Article

A News Sentiment Index to Inform International Financial Reporting Standard 9 Impairments

by
Yolanda S. Stander
School of Accounting, College of Business & Economics, University of Johannesburg, P.O. Box 524, Auckland Park, Johannesburg 2006, South Africa
J. Risk Financial Manag. 2024, 17(7), 282; https://doi.org/10.3390/jrfm17070282
Submission received: 28 May 2024 / Revised: 1 July 2024 / Accepted: 1 July 2024 / Published: 4 July 2024
(This article belongs to the Section Economics and Finance)

Abstract

:
Economic and financial narratives inform market sentiment through the emotions that are triggered and the subjectivity that gets evoked. There is an important connection between narrative, sentiment, and human decision making. In this study, natural language processing is used to extract market sentiment from the narratives using FinBERT, a Python library that has been pretrained on a large financial corpus. A news sentiment index is constructed and shown to be a leading indicator of systemic risk. A rolling regression shows how the impact of news sentiment on systemic risk changes over time, with the importance of news sentiment increasing in more recent years. Monitoring systemic risk is an important tool used by central banks to proactively identify and manage emerging risks to the financial system; it is also a key input into the credit loss provision quantification at banks. Credit loss provision is a key focus area for auditors because of the risk of material misstatement, but finding appropriate sources of audit evidence is challenging. The causal relationship between news sentiment and systemic risk suggests that news sentiment could serve as an early warning signal of increasing credit risk and an effective indicator of the state of the economic cycle. The news sentiment index is shown to be useful as audit evidence when benchmarking trends in accounting provisions, thus informing financial disclosures and serving as an exogenous variable in econometric forecast models.

1. Introduction

Economic narratives pertain to the sharing of perceptions and views on the current state of the economy, as well as forecasts of possible future outcomes. The narratives are influential in informing strategy and policies, thus providing early warnings of serious economic events, and in assessing systemic risk (Kou et al. 2019; Nyman et al. 2021). Narratives have a powerful effect on market behavior due to the ability to reinforce ideas through repetition (Shiller 2020). Incorporating narrative and natural language processing (NLP) in accounting research has been noted by researchers such as Bae et al. (2023); Mahlendorf et al. (2023); Ranta and Ylinen (2023); and Cao et al. (2024). NLP is useful in identifying key themes and extracting value-relevant information from financial disclosures. There is an important connection between narrative, sentiment, and human decision making. Learnings from neuroscience have been incorporated in neuroaccounting to help the accounting function understand how individuals process information and respond to controls, as well as in neuroeconomics to describe the cognitive processes that affect the decision making process and explain the interactions between markets (Loewenstein et al. 2008; Glimcher et al. 2009; Tank and Farrell 2022). In this study, NLP is used to extract market sentiment from economic and financial narratives. The main objective is to explore new ways to incorporate news sentiment in the quantification, governance, and audit of accounting impairments.
Forward-looking information is a key driver in the quantification of the International Financial Reporting Standard (IFRS) 9 impairments, which require the early recognition of possible loan losses (International Accounting Standards Board 2014). The credit risk models used in the derivation of the IFRS 9 impairments at banks are complex and typically cover client- or deal-specific idiosyncratic risk indicators with a systemic risk overlay. The models include assessments of the probability of default, loss given a default event, and the exposure at default. The risks associated with these models are interlinked and demand a strong model risk governance framework to ensure the appropriateness of the estimated impairments (Bank of England 2023; Cosma et al. 2023; Stander 2023).
Credit loss provisioning is a key focus area for auditors due to the risk of material misstatement. The IFRS is principle-based, which leads to significant judgment incorporated in the outcomes, thus resulting in a greater demand for audit evidence. The audit evidence is expected to be convincing and from multiple sources to judge the appropriateness of the impairment outcomes (International Auditing and Assurance Standards Board 2018; Basel Committee on Banking Supervision 2020). Industry norms are often used as audit evidence (Peytcheva et al. 2014; Boyle 2024). Vinson et al. (2024) examined a behavioral aspect of audit evidence by examining whether the way in which audit evidence is framed affects auditor judgment. Another objective of this study is to explore the feasibility of using news sentiment as audit evidence, thus using South African news sources and economic indicators in the case study.
Credit risk is adversely affected by worsening macroeconomic conditions (Fallanca et al. 2020; Xing and Yang 2020). The use of macroeconomic indicators to estimate default risk has been presented by Yang (2017), Gubareva (2020), Martinelli et al. (2020), Schutte et al. (2020), and Blümke (2022). This study explores whether news sentiment can be used as an early warning signal to increases in credit risk. This may be useful for a bank as part of the required IFRS 9 forward-looking information, but it can also be used more broadly by regulators who enforce policies to prevent credit deterioration to unsustainable levels (European Systemic Risk Board 2019; Carvalho et al. 2022). The study explores whether news sentiment could serve as a more timely gauge of economic activity compared to survey-based measures of sentiment. It is an extension of the work by Segawa (2021), who explored the causality of the SARB MPC statements on the BER inflation expectations survey.
A news sentiment index is constructed from South African central bank communications and speeches, articles from the Financial Mail, and headlines from the Financial Times. Two global reports from the World Economic Forum (WEF) and Bank for International Settlements (BIS) are included to capture contagion risk. NLP is performed with FinBERT, a Python library that has been pretrained on a large financial corpus with the BERT (Bidirectional Encoder Representations from Transformers) language model as its base (Araci 2019; Devlin et al. 2019). Using FinBERT addresses the issues with financial sentiment analysis raised by Chen et al. (2021), who highlighted that as much as three-quarters of the negative words in the Harvard Dictionary are not negative in financial narrative, as well as that bullish words in finance often get labeled as neutral words in general sentiment dictionaries. By combining the different news sources in the construction of the news sentiment index, the concerns raised by Buckmann et al. (2021) around biased data are addressed.
Rather than focusing on any specific economic indicator, the relationship between news sentiment and an economic systemic index is analyzed over time in a rolling regression. The systemic index is derived with a principal component analysis (PCA) and intended to capture the general trend of the economy (Dai et al. 2021; Caporin et al. 2022; Pan et al. 2022).
An aspect-based sentiment analysis is performed to identify specific sentiment topics that may be leading indicators of systemic risk, thus following on the work of Barbaglia et al. (2022).
The remainder of the paper is structured as follows. Section 2 covers a literature review of NLP and various applications of news sentiment indicators. Section 3 summarizes the methodologies to process the different data sources. Section 4 summarizes the approaches used to construct the systemic and sentiment indices and explore the importance of a rolling regression in capturing changing relationships over time. The analyses in Section 5 establish the link between news sentiment and credit risk, and the section then considers the causal effects of central bank communications on economic narratives. The relationship between the news sentiment index and systemic risk index is evaluated, thus also incorporating the impact of survey-based measures of sentiment. The aspect-based sentiment analysis identifies important news topics. Section 6 links the outcomes to approaches that may enhance the quantification, governance, and audit procedures of IFRS 9 loss provisions. Conclusions are drawn in Section 7.

2. Literature Review

The use of artificial intelligence (AI) has increased markedly in finance and economics (Cao 2021). Applications include extracting topical issues from news (Rönnqvist and Sarlin 2017), extracting value-relevant information from financial disclosures (Bae et al. 2023; Mahlendorf et al. 2023; Ranta and Ylinen 2023; Cao et al. 2024), detecting fake news and filtering spam (Oshikawa et al. 2018), training an AI economist to propose new tax policies (Engler 2020), using AI in the interpretation of regulations to reduce bias (Buckmann et al. 2021), and using AI to perform auditing tasks (Zhang et al. 2022).
NLP is a field that combines learnings from AI, linguistics, and behavioral finance. It involves interpreting and classifying unstructured text data into positive, neutral, or negative sentiment; assessing subjectivity; or extracting emotions (Lee and Seo 2023; William et al. 2023). Gupta et al. (2023) also included emojis in the polarity assessment. Approaches to train AI to perform NLP have been explored in studies such as Vicari and Gaspari (2021), Chen et al. (2021), and Huang et al. (2023), with the latter study showing the superiority of FinBERT trained specifically for finance. Zaremba and Demir (2023) discuss how the development of GPT (Generative Pre-training Transformer) technology has improved the performance of NLP in financial applications but raises ethical and regulatory concerns.
Numerous studies have proved the value of news sentiment collected from economic and financial news using NLP. News sentiment can predict survey-based measures of consumer sentiment (Shapiro et al. 2022; Seki et al. 2022) and improve economic forecasts (Ardia et al. 2019). The relationships between news and stock markets, foreign exchange markets, cryptocurrency, and commodities have been explored in Agyei et al. (2023), Kulbhaskar and Subramaniam (2023), Raza et al. (2023), and Tadphale et al. (2023). Gardner et al. (2021) showed how macroeconomic news have an asymmetrical impact on asset prices, with an increased effect during economic downturns. Macaulay and Song (2023) considered the impact of social media on traditional news sources. Buckman et al. (2020) used a news sentiment index in nowcasting to handle lags in published economic data, which is especially useful during periods of high uncertainty and stress. Ghirelli et al. (2019) created an economic policy uncertainty index based on newspaper headlines.
The effect of market sentiment on economic outcomes is explored in the study of neuroeconomics. Neuroeconomics highlight the important connection between narrative, sentiment, and human decision making (Loewenstein et al. 2008). Narratives inform market sentiment through the emotions triggered and the subjectivity that gets evoked. Mäkelä et al. (2021) showed how viral, emotive narratives can distort an intended rhetoric. They can lead to severe impacts on the financial market and heightened contagion risk between markets and countries. Researchers have found evidence of bias in economic narratives. There is the anchoring hypothesis, where narratives display overreaction towards current events; there is also confirmation bias, which refers to the tendency of the human mind to pay more attention to information that confirms preconceptions (Campbell and Sharpe 2009; Afrouzi et al. 2020; Buckmann et al. 2021; Kohlhas and Walther 2021).
It is important to understand the impact of news sentiment on systemic risk. Systemic risk is typically hard to measure, and the approach depends on its intended use. It can be developed to measure general risk in a system, as well as provide information on the business cycle or specific market aspects; more recent work has also incorporated the impact of climate change (Ardia et al. 2019; Hanley and Hoberg 2019; Montagna et al. 2021; Li et al. 2021; Lee and Seo 2023). Approaches to identify the indicators of a systemic risk measure are explored in Hartwig et al. (2021).
In a regulatory setting, a systemic risk index is an important tool to proactively identify and manage emerging risks to the financial system (ECB 2011; Chatterjee and Sing 2021; Hartwig et al. 2021). In South Africa, the mandate of the South African Reserve Bank (SARB) is to monitor and mitigate systemic risks. The Financial Stability Committee is responsible for macroprudential policy. Rising vulnerabilities are identified by conducting systemic risk assessments through tools such as common stress tests across the banking and insurance sectors, with the results published in the Financial Stability Review (FSR) (Rooplall and Nkosi 2021). The SARB implements monetary policy to manage inflation by setting the short-term policy rate through the Monetary Policy Committee (MPC). The causal effects of central bank communications on economic narratives have been explored in studies such as Correa et al. (2021) and Kryvtsov and Petersen (2021). Du Rand et al. (2021) showed that the MPC statements reflect the policy stance of the SARB more clearly than speeches.
The complex interdependencies between markets and the changing dynamics of those markets necessitate assessments of the observed behaviors and relationships over time (Giacomini and Rossi 2015; Rossi 2021). The impacts of news sentiment on systemic risk are not necessarily consistent across different parts of the economic cycle (Ashwin et al. 2024).

3. Data Sources

In this section, the approaches to extract, clean, and transform the different data sources are summarized. All data series were converted to a monthly frequency. Where the data were only available quarterly or annually, the data were kept constant for that observation period. The data series were converted to a standard Gaussian distribution using the probability integral transform. Outliers were identified using the interquartile range and smoothed with linear interpolation.

3.1. News Data

The news data include central bank communications and speeches, articles from the Financial Mail, headlines from the Financial Times, and two global reports from the WEF and BIS to capture contagion risk.
Table 1 summarizes the economic and financial news sources. The sources were selected to cover current events in South Africa ( S S _ F T = Financial Times, and S S _ F M = Financial Mail), speeches and reports from the South African central bank ( S S _ B I S S P = BIS speeches, S S _ S A R B F S R = SARB Financial Stability Review, S S _ S A R B M P C = Monetary Policy Committee Statement, and S S _ S A R B Q B = Quarterly Bulletin), and global economic views ( B I S E R = BIS Annual Economic Report, and S S _ W E F = WEF Global Risks Report).
The unstructured nature of news data often requires preprocessing to reduce the noise. Examples include correcting misspelled words or unifying typesetting to handle upper- and lowercases (Hassani et al. 2020). Reputable news sources reduce the need for preprocessing.
The document downloads were automated in Python with the Selenium and Beautiful Soup libraries (Richardson 2007; Raghavendra 2021; Python Software Foundation 2024). All PDF files were converted to text using the pypdf Python library (Fenniak et al. 2024). Full reports were extracted for all news sources, except the Financial Times, where only news headlines were extracted.
Natural language processing of the text was performed with the FinBERT library. The news sentiment was derived for each sentence. The sentences were tokenized to remove stop words, numbers, and symbols. The words were then lemmatized to obtain the root words. The updated sentences were analyzed with FinBERT and assigned a positive, negative, or neutral score. The FinBERT scores range from −1 (negative sentiment) to 1 (positive sentiment).
Figure 1 illustrates how the narratives extracted from the Financial Times have changed over time. In 2018, the focus was around political scandals and then shifted in 2020 to the pandemic and global crisis. News around the pandemic still featured in 2021. The 2023 news shifted to the electricity crisis and the impact of it on the economy.
Research often analyzes news sentiment by tracking the proportion of positive to negative sentences over time (Nguyen and La Cava 2020; Du Rand et al. 2021; Correa et al. 2021; Lee and Seo 2023). In this study, the sentiment data series were derived by calculating the average sentiment by month, thus ignoring all sentences with a neutral score. The method took into account not just whether the sentiment is generally more positive or negative but also how strongly positive or negative the statements are.

3.2. Economic Data

The economic data used in the construction of the systemic index are summarized in Table 2. The economic categories covered are the following:
  • Stock market: JSE All-Share Index (ALSI); JSE Financial 15 Index (FINI).
  • Economic activity: real GDP (GDP); purchasing managers’ index (PMI).
  • Credit extension: private sector credit extension (PCE).
  • Compensation: employee compensation (ECOMP); personal disposable income (PDI).
  • Interest rates: long-term bond yield (BOND).
  • Inflation: consumer price index (CPI); producer price index (PPI).
  • Exchange rate: Rand per US dollar (USDZAR).
There are three business cycle indicators published by SARB, namely the SARB leading indicator (SARBLEAD), the coincident indicator (SARBCOIN), and the lagging indicator (SARBLAG), as well as two survey-based indices compiled by the Bureau for Economic Research (BER), namely the business confidence indicator (BCI) and the consumer confidence indicator (CCI). This study investigates whether news sentiment could serve as a more timely gauge of economic activity compared to the business cycle and confidence indicators.

4. Methodology

The methodologies to construct the economic systemic index and news sentiment index are summarized in this section. A rolling regression was applied to determine the dependence between the two indices, thus incorporating the changing relationships over time.

4.1. Economic Systemic Index

Principal component analysis (PCA) was used to construct a macrofocused systemic index that captures the general trend in the economy. The PCA summarizes multiple economic indicators into a smaller set of new indicators that capture the most important aspects of the original set (Dai et al. 2021; Caporin et al. 2022; Pan et al. 2022; Nyati et al. 2023).
The PCA was performed by calculating the eigenvectors and eigenvalues λ 1 , λ 2 , , λ n , where n denotes the number of economic indicators in the PCA. The eigenvector Λ j = β j 1 , β j 2 , , β j n corresponds to the eigenvalue λ j . The eigenvalues indicate the proportion of variance explained by each principal component and are sorted in descending order, with the first component being the most important. The economic indicators are adjusted to ensure a positive relationship with the systemic index; in other words, negative values of the economic indicator denote negative economic conditions.
The systemic index is derived from the first m principal component weights:
E S I = j = 1 m λ j λ t o t × i = 1 n β j i 2 Z i
where E I denotes the economic systemic index, λ t o t = j = 1 m λ j , Z i denotes the i th standardized economic indicator, and i = 1 n β j i 2 = 1 . The percentage weight contribution denoted by β j i 2 is used to ensure that the correct relationship with the economic cycle is preserved.

4.2. News Sentiment Index

The news sentiment index is derived similarly to the economic systemic index by applying PCA. The sentiment index indicators do not need to be adjusted for trend; the trend is incorporated in the approach used to derive sentiment. The sentiment index is derived for the first k principal component as follows:
N S I = j = 1 k λ j λ t o t × i = 1 n β j i N i
where N S I denotes the news sentiment index, and N i denotes the i th standardized news indicator; the remaining PCA variables are as defined before in Equation (1).

4.3. Nonstationary Regression

An ordinary least squares (OLS) regression was used to analyze the relationship between news sentiment and macroeconomic variables, thus incorporating heteroskedasticity and autocorrelation consistent standard errors. The regression equation is as follows:
Y t = φ 0 + i = 1 m φ i X t i + ε t
where Y t denotes the target variable, X t i denotes the m predictor variables—which can include both news and macroeconomic variables— φ i denotes the estimated regression coefficients, and ε t is the residual. The residuals were tested for stationarity with the augmented Dickey–Fuller (ADF) test to ensure the validity of the regression and for handling nonstationarity in the variables. Stationary residuals indicate a cointegrated relationship between the target and predictor variables (Engle and Granger 1987; Hyndman and Athanasopoulos 2021).
In econometric forecasting, it is key to handle model instabilities caused by structural breaks that lead to changes in observed behavior and relationships. Structural breaks can be caused by market forces such as economic stress periods or changing regulations (Giacomini and Rossi 2015). Models do not necessary perform well under all phases of the economic cycle. In this study, a rolling regression was used to analyze the trends in the regression parameters over time. The optimal regression model was selected by ensuring an appropriate in-sample fit, but giving more weight to the out-of-sample performance (Rossi 2021).

5. Analysis

The analysis in this section first establishes the link between news sentiment and credit risk. It then considers the causal effects of central bank communications on economic narratives in the market. A news sentiment index is constructed, and its potential as a leading indicator of systemic risk evaluated. This study explores whether the news sentiment index could serve as a more timely gauge of economic activity compared to survey-based measures of sentiment. An aspect-based sentiment analysis is performed to identity important news topics.

5.1. Linking News Sentiment to Credit Risk

A relationship between news sentiment and credit risk has important implications. A relationship of this kind may be useful in enriching the forward-looking information required for accounting impairments, or it may serve as an early warning indicator to regulators that enforces policies to prevent credit deterioration to unsustainable levels (European Systemic Risk Board 2019; Carvalho et al. 2022).
Table 3 summarizes the average exposure-weighted probability of default (PD) extracted from the Pillar 3 reports of the biggest four banks in South Africa. The big-four banks control around 80% of the South African market (Gwatidzo and Simbanegavi 2024; PWC 2024). The PDs for the corporate, small- to medium-enterprise (SME) retail, revolving retail, and retail mortgage asset classes are shown. The PDs differ significantly between asset classes and highlight that the risk may not be driven by the same market indicators. The PDs for the same asset class, but between banks, also differ substantially, thus indicating differences in the target markets and risk appetites of the banks.
The average PD was derived across all banks to obtain a view on the general trend, by year, for the given asset class. In Figure 2, the average log changes of the PDs are plotted against the average sentiment score for the year, which were extracted from the news sources. Only the news sources with the strongest relationship with the change in PDs are shown. All the plots show the expected negative relationship, thus indicating that more positive news are related to lower systemic risk and thus lower PDs. The SARB MPC were found to have a strong relationship with retail mortgages and revolving retail; global risks highlighted by the WEF reports were found to be related to corporates; and the Financial Mail news were found to be strongly related to the behavior observed for the retail SMEs.

5.2. Causal Impact of Central Bank Communications

The causal effects of central bank communication on general economic narratives were tested by calculating the crosscorrelation function at monthly lags out to one year based on data from January 2016 to March 2023. Figure 3 shows a matrix of the bivariate dependence structures between the South African central bank communications and other news sources, thus incorporating the lag where the strongest correlation is observed. The darker areas denote more observations.
The dependence structures highlighted no strong causal relationship between the central bank communications and the Financial Times. It can be a function of the South African news in the Financial Times being more politically than economically focused, as illustrated in Figure 1. It may also be a function of limited information content when only extracting news headlines.
The strongest observed relationships are between the SARB FSR lagged by 12 months and the Financial Mail, with a rank correlation of 53%, as well as the SARB MPC lagged by 12 months and the Financial Mail, with a rank correlation of 44%.

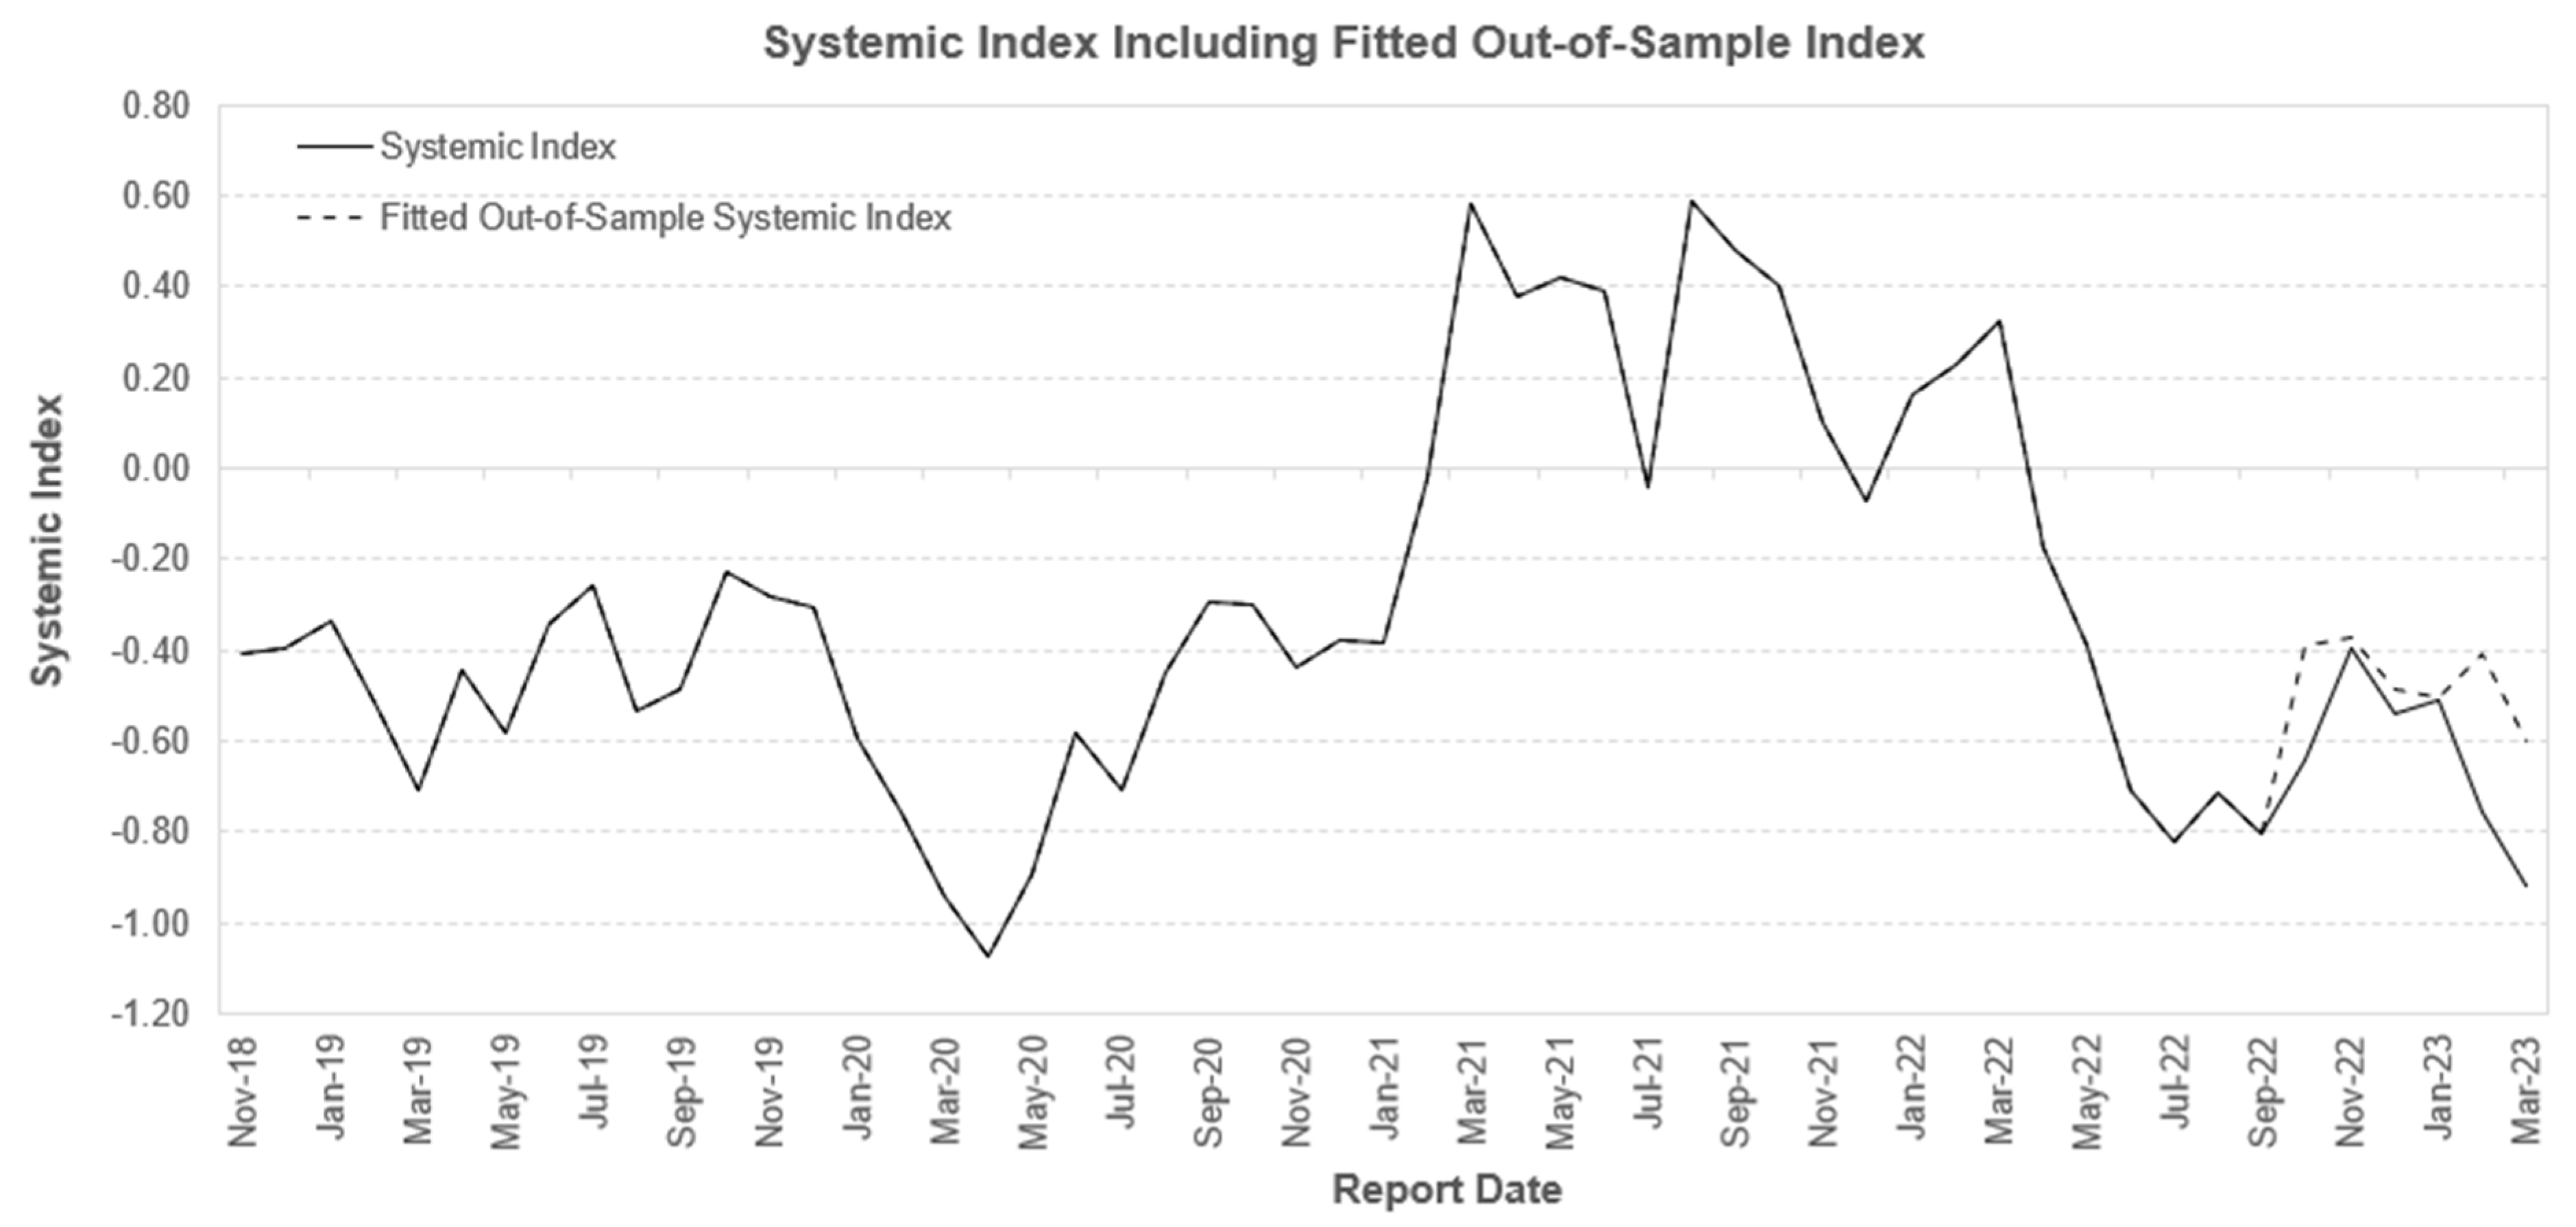
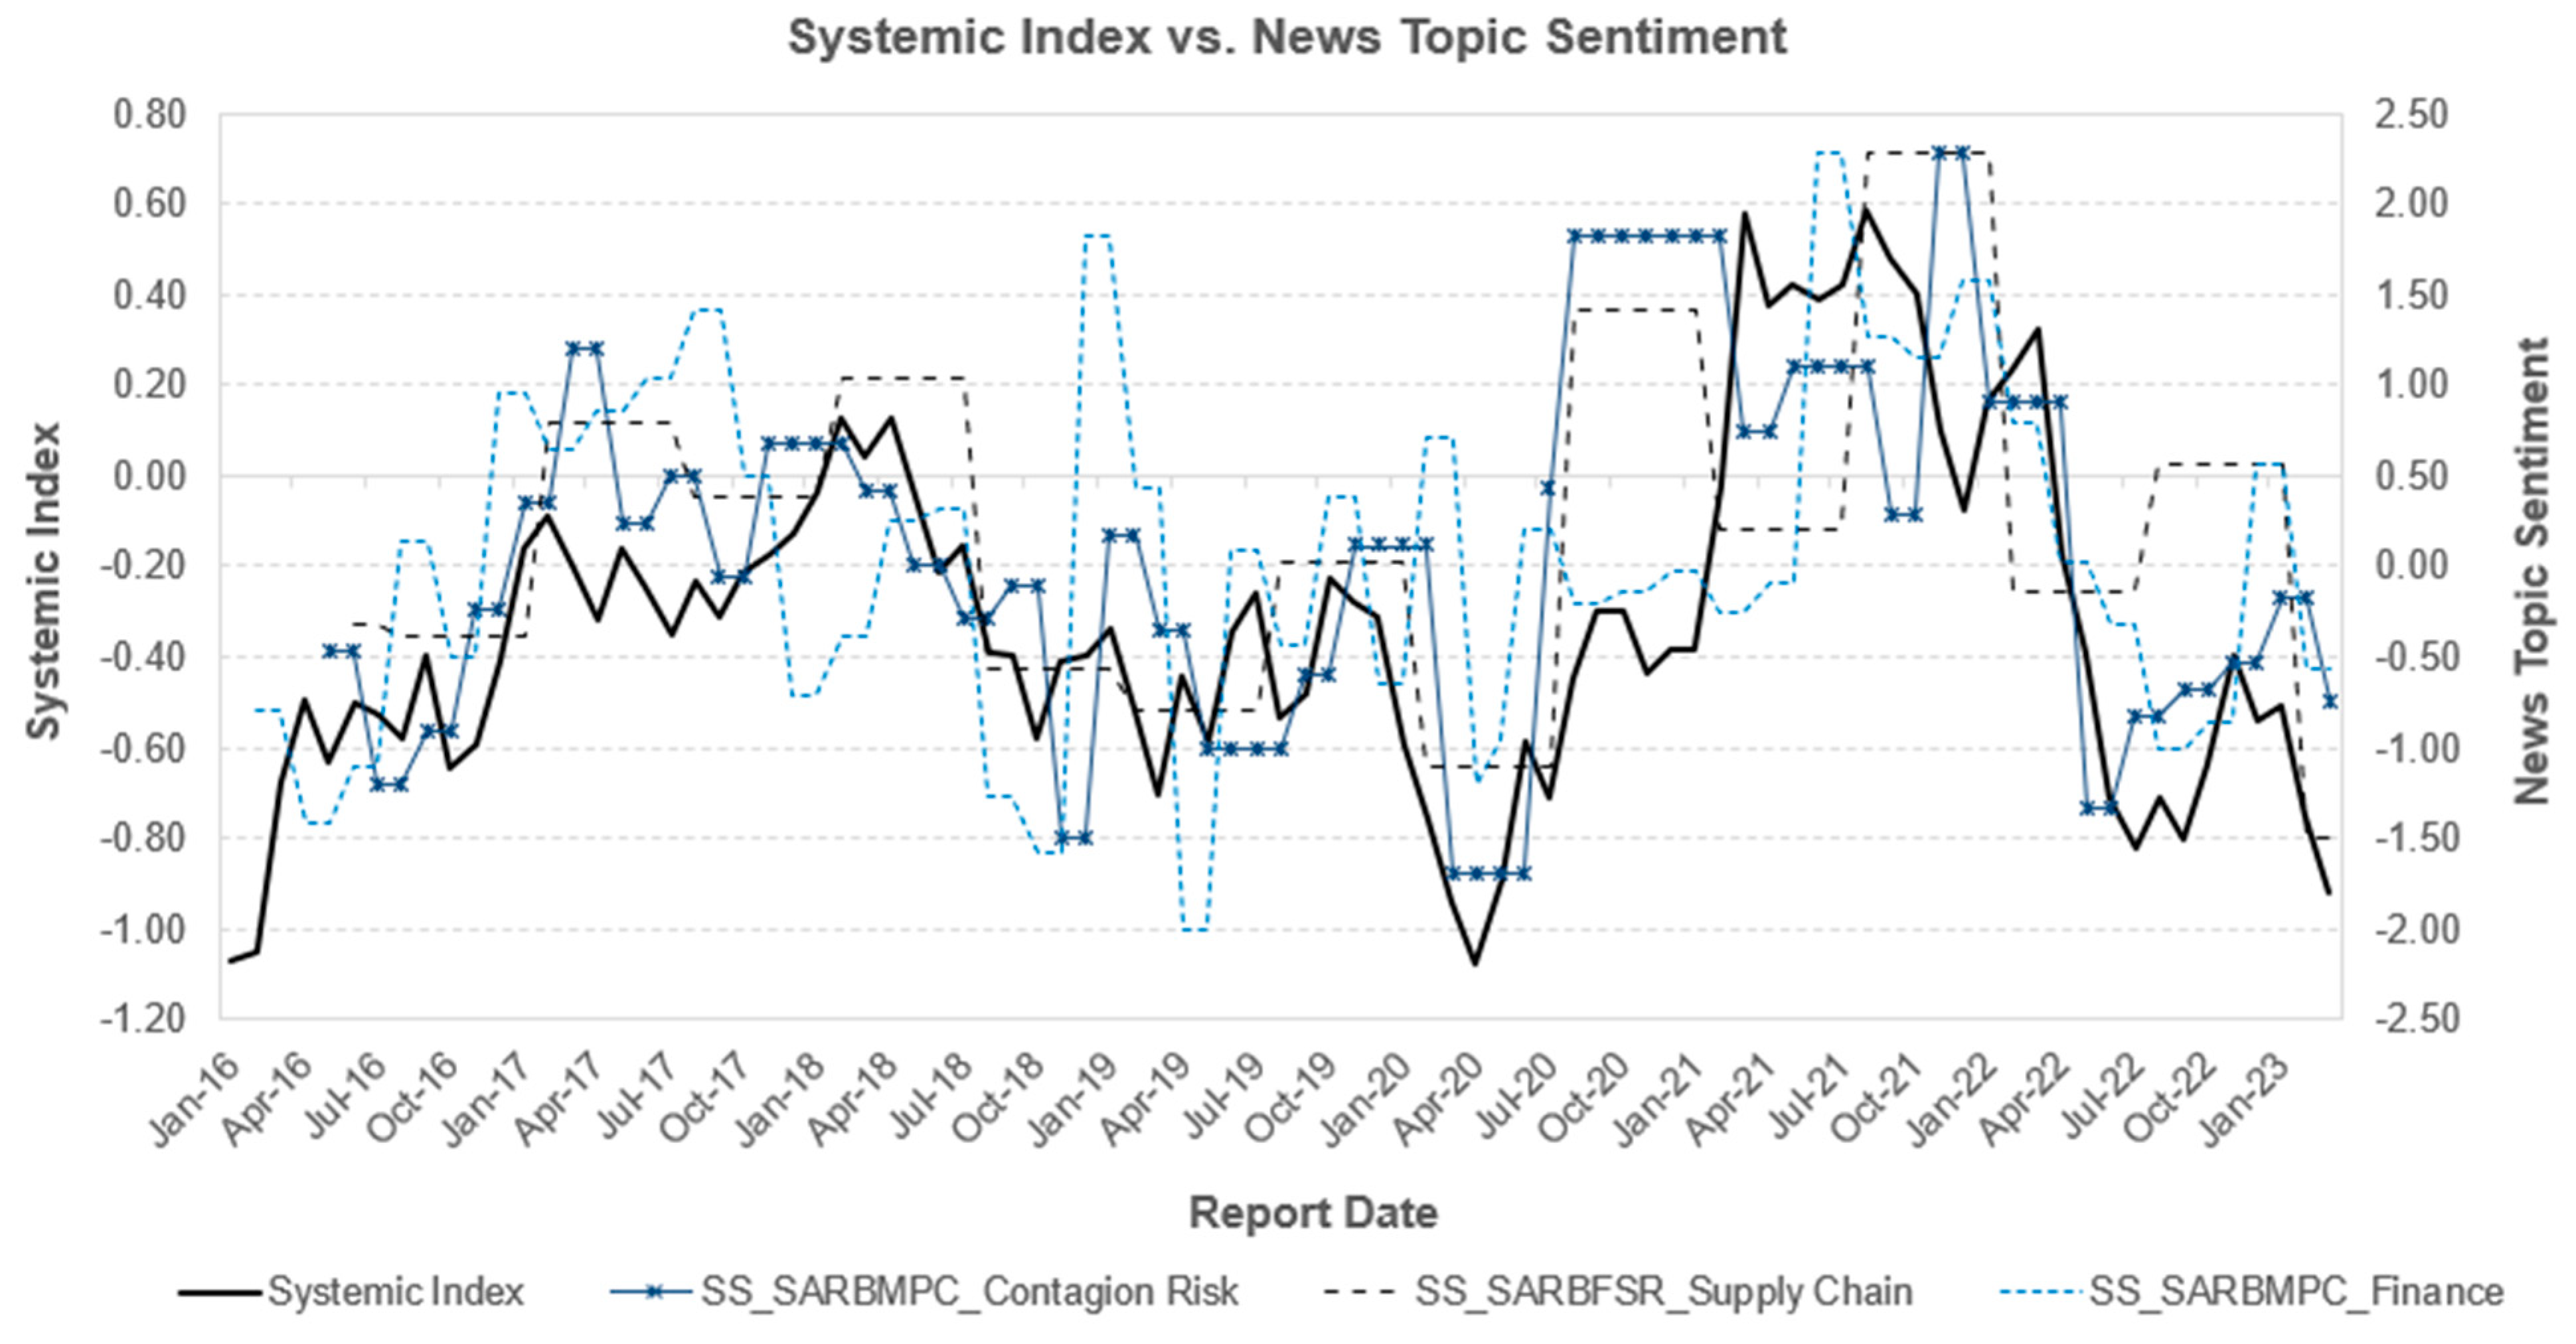
5.3. A Systemic Index and the Relationship with News

Instead of analyzing the relationship between news sentiment and specific economic indicators, an economic systemic index was constructed to obtain a more general indicator of the systemic risk.
The economic systemic index was derived as per Equation (1) from the set of economic indicators {ALSI; FINI; PDI; ECOMP; PCE; PPI; CPI; BOND; USDZAR; GDP; PMI} using historical data from January 2016 to March 2023. The eigenvalues and eigenvectors from the PCA are summarized in Table 4. The first three principal components (PCs) were selected to construct the systemic index, as they explained over 80% of the total variance. The first PC captures the stock market with some weight to inflation and economic activity; the second PC has most weight to inflation, interest rate, and currency; and the third PC is heavily weighted to economic activity.
Next, the relationship between the systemic index and each of the individual news series are analyzed. Figure 4 summarizes these relationships. The annual news series S S _ W E F and S S _ B I S E R did not track the systemic index very well, but this may be expected because they are global reports that were included to provide insight into possible contagion risk. The SARB reports S S _ S A R B M P C and S S _ S A R B F S R tracked the systemic index much closer; however, the S S _ B I S S P and S S _ S A R B Q B showed less of a relationship over time. The S S _ F M and S S _ F T news that were available at more regular intervals were more volatile but did indicate a relationship with the systemic index over time.
Based on the observed trends, only four news variables were considered in the construction of the news sentiment index, namely S S _ F M ,   S S _ F T , S S _ S A R B F S R , and S S _ S A R B M P C . The eigenvalues and eigenvectors are summarized in Table 5. Only the first two PCs were used in the construction of the index; they captured around 70% of the variance in the news variables. The news sentiment index was derived using Equation (2).
Figure 5 show the relationship between the systemic index and the news sentiment index. The correlation was highest when the sentiment index was lagged by 3 months, thus indicating that the news sentiment index is a leading indicator of systemic risk.
The bivariate dependence structure between the systemic index and the lagged sentiment index is shown in Figure 6. Darker areas denote more observations. There is a clear upper-tail dependence, which indicates that the two indices are more highly correlated in positive economic environments. In economic downturn conditions, there is more uncertainty leading to greater volatility in the outcomes.

5.4. News vs. Other Business Cycle and Survey-Based Indicators

The study explores whether news sentiment may be a more timely indicator of systemic risk compared to other business cycle and survey-based indicators. An OLS was used to test how the N S I , the survey-based indicator B C I , and the SARB leading indicator S A R B L E A D behave as leading indicators of the E S I . The regression equation was defined by Equation (3). Historical data from January 2016 to March 2023 were used in a rolling regression using 40 datapoints at a time to estimate the regression parameters following a general rule of thumb of 10 observations per regression coefficient estimated and moving forward one month at a time. The OLS algorithm iterates through different lags to ensure each of the predictor variables are included at the optimal lag.
Figure 7 show the estimated regression coefficients over time. Generally the N S I , B C I , and S A R B L E A D consistently had statistically significant coefficients in the regression, with the weight of the sentiment index increasing over time. The estimated regression coefficients are shown in Table 6 for September 2022, thus ensuring a hold-out sample of 6 months. The individual indicators were found to be nonstationary; however, the residuals were found to be stationary as indicated by the ADF test statistic. The variance inflation factors (VIFs) indicate no issues with multicollinearity. The N S I was included at a lag of 3 months; all other variables were included at no lag.
The R 2 value indicates an in-sample goodness of fit of 70%. Figure 8 shows the out-of-sample performance of the model. The mean squared out-of-sample error was 0.022 over the first 3 months and 0.048 over 6 months.
In Table 7, the S S _ B I S E R is included in the regression to also incorporate the impact of contagion risk. The R 2 value indicates an in-sample goodness-of-fit increase to 75%. The mean squared out-of-sample error was 0.021 over the first 3 months and 0.022 over 6 months, thus showing that by including S S _ B I S E R , both the in-sample and out-of-sample fit of the model were improved.

5.5. Aspect-Based Sentiment Analysis

In this section, an aspect-based sentiment analysis was performed to identify the news topics with the strongest correlation with the E S I . The news topics considered include economic growth, currency, supply chain, inflation, AI, electricity, sovereign, climate, consumption, property, tourism, interest rate, stock market, finance, commodity, pandemic, healthcare, contagion risk, and agriculture. The specific keywords searched for in the text under each topic are summarised in Table 8.
The analysis was performed by sentence. If the specific sentence contained any of the keywords, it was assigned to the topic. It is possible for one sentence to be assigned to more than one topic. The average sentiment score was calculated by month and topic. Table 9 summarizes the rank correlation between the E S I and the sentiment scores derived by topic for S S _ F M , S S _ S A R B M P C , and S S _ S A R B F S R . The correlation was derived for the lagged news sentiment monthly out to 12 months; but only the strongest correlation and the lag at which it occurred is shown in Table 9. This points to whether the particular news topic can serve as a causal indicator of systemic risk.
The S S _ S A R B F S R news topics that exhibited the highest correlation with E S I are currency, contagion risk, consumption, commodity, sovereign, economic growth, and supply chain, with lags that varied between 0 and 5 months. The correlations between currency news and the E S I were negative, which is expected because a more positive outlook is related to a currency appreciation (lower USDZAR). The S S _ S A R B M P C news topics with the highest correlation are stock market, commodity, agriculture, finance, and contagion risk, with lags ranging from 1 to 9 months. The contagion risk news had the strongest correlation among all the news sources. The S S _ F M topics with the highest correlation are climate, currency, and inflation, with lags from 6 to 10 months. Figure 9 shows a comparison between the news sources with the strongest relationships with the systemic index.

5.6. Summary of the Results

The link between news sentiment and credit risk is important, both in the context of the IFRS 9 and the forward-looking information required for accounting provisions, in addition to its importance as an early warning of systemic risk. In this study, the link between news sentiment and credit risk is illustrated based on the published PDs of the biggest four banks in South Africa in the Pillar 3 reports. It was shown how news sentiment was found to have a negative relationship with the PDs, thus indicating that positive news are related to lower systemic risk and thus lower PDs.
The SARB implements monetary policies to manage inflation by setting the short-term policy rate through the Monetary Policy Committee. News sentiment extracted from the SARB MPC reports was found to have a strong relationship with the retail asset classes such as mortgages and revolving loans, which is intuitive given how sensitive these asset classes are to inflation and interest rates (Gumata and Ndou 2021; Bullock 2023; Albertazzi et al. 2024). Corporates were found to be more strongly affected by global risks highlighted by the WEF reports. Smaller businesses such as retail SMEs were found to be strongly related to news extracted from the Financial Mail. These results enforce the idea that news sentiment may be used as a causal indicator of systemic risk.
The central bank communications did not have a similar causal impact on all news sources in South Africa. It was shown to not have a strong causal relationship with the Financial Times. It may be a result of the Financial Times’ coverage of South African news, which leans more toward politics than economics; or it may be due the limited information in only using the news headlines. The SARB FSR and MPC may have a causal impact on the Financial Mail of up to 12 months.
News sentiment is a leading indicator of economic systemic risk. The bivariate dependence structure between the E S I and the lagged N S I (Figure 6) demonstrate upper-tail dependence, which indicates that the two indices are more highly correlated in positive economic environments. In economic downturn conditions, there is more uncertainty leading to greater volatility in the outcomes.
In a regression study, the N S I was shown to be a leading indicator of E S I of up to 3 months compared to the survey-based measures of sentiment B C I and the S A R B L E A D , which both had the strongest relationship with the E S I at no lag. By including the contagion risk news indicator S S _ B I S E R , both the in- and out-of-sample fits of the regression improves. The rolling regression shows that the importance of the news sentiment has increased over time.
Finally, the study identified the news topics extracted from the SARB FSR, MPC, and the Financial Mail, with the strongest relationship with the E S I . Their outcomes showed no consistent trend in the topics between the different news sources.
The results presented in this study are in line with studies such as Ardia et al. (2019), Hanley and Hoberg (2019), Barbaglia et al. (2022), and Lee and Seo (2023) that showed how news sentiment tracks the business cycle closely and can be used in nowcasting to manage the accuracy and timeliness of economic forecasts.

6. Discussion

The role of the external audit is to ensure the reasonableness of accounting estimates and disclosures. Credit loss provisioning is a key focus area because of the risk of material misstatement. A greater demand for audit evidence arises from the fact that the IFRS is principle-based, which incorporates significant judgment. The auditor is expected to show how different sources of audit evidence contradict or corroborate the outcomes (International Auditing and Assurance Standards Board 2018; Basel Committee on Banking Supervision 2020).
Finding appropriate sources of audit evidence is complicated. The IFRS 9 audit includes an assessment of the models used to derive the impairments (the main models are probability of default, loss given default, and exposure at default), forecasts and forward-looking information, the assessment of a significant increase in credit risk, and disclosure. In Section 5.1, it was shown how the credit risk behavior of the big-four banks in SA differ significantly even for the same asset class, thus possibly indicating differences in the target markets and risk appetites of the banks. It is difficult to justify using information from one bank to benchmark the client behavior at another. The nuances of benchmarking the IFRS 9 forward-looking information have been explored in Stander (2023). Limited published forecasts, differences in economic narratives, and timing differences of economic publications are some of the aspects that complicate the benchmarking substantially.
This study established the link between news sentiment, systemic risk, and credit risk, and it showed how news sentiment can be a leading indicator of systemic risk. There are many ways in which news sentiment can be used to inform or benchmark IFRS 9 impairments. The results suggest that a news sentiment index may be a useful exogenous variable in the econometric models used to derive the IFRS 9 macroeconomic scenarios. It was shown how news sentiment compliments market indicators such as the SARB leading indicator and survey-based indicators such as the B C I in explaining the systemic risk in an OLS. The news sentiment index can also enhance the IFRS 9 models used to estimate default risk. Currently, researchers focus more on macroeconomic indicators (Yang 2017; Gubareva 2020; Martinelli et al. 2020; Schutte et al. 2020; Blümke 2022), but news sentiment may add an additional layer of information.
The audit function typically evaluates the appropriateness of the IFRS 9 economic scenarios by benchmarking to internally derived indicators, consensus forecasts, third-party scenarios, or by comparing to the scenarios published by other banks (Stander 2023). Economists responsible for the derivation of the scenarios may use expert judgment to handle data and model constraints. The expert judgment in the forward-looking information can be tested by comparing modeled outcomes with the final outcomes, thus ensuring that adjustments are in the correct direction. For instance, when the news sentiment index indicates further deterioration in systemic risk, it can confirm a conservative adjustment to the economic outlook.
The news sentiment index may provide insight into the current state of the economy and whether additional conservatism is necessary in the credit loss provisioning. The analysis in Section 5.3 shows a clear upper-tail dependence in the dependence structure of the systemic index and the lagged sentiment index. The upper-tail dependence indicates that the two indices are more highly correlated in positive economic environments. In economic downturn conditions, there is more uncertainty leading to greater volatility in the outcomes which has implications for the audit process. In an economic downturn, this may indicate the need for added conservatism in the provisions. Where a risk cannot be handled explicitly in a model, evidence-based overlays are used (McCaul and Walter 2023).
The news sentiment index can be used as audit evidence to inform or justify trends in the IFRS 9 impairments. For example, positive news signal an improved economic environment, lower systemic risk, and lower impairments needed. Counterintuitive trends may trigger the need for further investigation and require additional audit evidence.
Aspect-based sentiment analysis indicates important news topics that can inform systemic risk. These topics can be used in the formulation of the economic narrative that forms part of the IFRS disclosure, or they can be used as inputs to derive alternative news sentiment indices.
A study by Du et al. (2022) showed a conditional conservatism in accounting for provisions where banks tend to react more to negative news. Banks respond to negative news by increasing impairments, but there is a reluctance to incorporate positive news and release impairments, thus reducing the information content in the outcomes. Another general downside is that unforeseen stress events such as the COVID-19 pandemic will not be captured by news sentiment.

7. Conclusions

The main objective of this study was to explore innovative approaches to incorporate a news sentiment index in the quantification, governance, and audit of credit loss provisions at a bank. This was achieved by establishing news sentiment as a useful tool in benchmarking trends in the accounting provisions and in informing financial disclosures; it was also established as an exogenous variable in econometric forecast models.
The news sentiment index was shown to compliment other business cycle and survey-based indicators in explaining systemic risk. The causal relationship between news sentiment and systemic risk suggests that news sentiment could serve as an early warning signal of increasing credit risk and as an effective indicator of the state of the economic cycle. This is useful when benchmarking the observed trends in the accounting provisions, thus being included as audit evidence.
The news sentiment index may be a useful exogenous variable in the econometric models used to derive the IFRS 9 forward-looking information and the credit risk parameters that include the probability of default, loss given default, and exposure at default. It is an extension of existing research that focuses more on macroeconomic indicators.
An aspect-based sentiment analysis was shown to be useful in identifying important news topics that inform systemic risk. These topics can be used in the formulation of the economic narrative that form part of the IFRS disclosure, or they can be used to inform the derivation of alternative news sentiment indices.
This study highlighted how the relationship between news sentiment and systemic risk is not necessarily consistent across different parts of the economic cycle. The bivariate dependence structure of the systemic index and the lagged news sentiment index, indicates that the two indices are more highly correlated in positive economic environments. In economic downturn conditions, there is more uncertainty leading to greater volatility in the outcomes and indicating the need for added conservatism in the quantification.
Interestingly, the study found no consistent causal effect of central bank communications on the economic narrative in the market.
An avenue for future research is to consider more news sources and track the information content over time to ensure the appropriateness of including them in a sentiment index. This study employed a rolling regression to show how the impact of news sentiment on systemic risk changed over time, with the importance of news sentiment increasing in recent years. The research can be extended to also consider the impact of social media.
This study highlighted the information content in news sentiment; however, it is important to use AI that is trained on reputable news sources to manage bias and ensure that financial phrases are correctly interpreted.

Funding

This research received no external funding.

Data Availability Statement

Publicly available datasets were analyzed in this study with sources as outlined in Table 1 and Table 2.

Conflicts of Interest

The author declare no conflict of interest.

References

  1. Afrouzi, Hassan, Spencer Y. Kwon, Augustin Landier, Y. Ma, and David Thesmar. 2020. Overreaction in Expectations: Evidence and Theory. HEC Paris Research Paper No FIN-2021-1444. Available online: https://papers.ssrn.com/sol3/papers.cfm?abstract_id=3709548 (accessed on 27 May 2024).
  2. Agyei, Samuel, Zaghum Umar, Ahmed Bossman, and Tamara Teplova. 2023. Dynamic connectedness between global commodity sectors, news sentiment, and sub-Saharan African equities. Emerging Markets Review 56: 101049. [Google Scholar] [CrossRef]
  3. Albertazzi, Ugo, Fulvia Fringuellotti, and Steven Ongena. 2024. Fixed rate versus adjustable rate mortgages: Evidence from euro area banks. European Economic Review 161: 104643. [Google Scholar] [CrossRef]
  4. Araci, Dogu Tan. 2019. FinBERT: Financial Sentiment Analysis with Pre-trained Language Models. Master dissertation, Faculty of Science, University of Amsterdam, Amsterdam, The Netherlands, June. Available online: https://arxiv.org/pdf/1908.10063.pdf (accessed on 15 December 2023).
  5. Ardia, David, Keven Bluteau, and Kris Boudt. 2019. Questioning the news about economic growth: Sparse forecasting using thousands of news-based sentiment values. International Journal of Forecasting 35: 1370–86. [Google Scholar] [CrossRef]
  6. Ashwin, Julian, Eleni Kalamara, and Lorena Saiz. 2024. Nowcasting Euro area GDP with news sentiment: A tale of two crises. Journal of Applied Econometrics, 1–19. [Google Scholar] [CrossRef]
  7. Bae, Jihun, Chung Yu Hung, and Laurence van Lent. 2023. Mobilizing Text as Data. European Accounting Review 32: 1085–106. [Google Scholar] [CrossRef]
  8. Bank of England. 2023. Model Risk Management Principles for Banks. Supervisory Statement SS1/23, Prudential Regulation Authority. Available online: https://www.bankofengland.co.uk/-/media/boe/files/prudential-regulation/supervisory-statement/2023/ss123.pdf (accessed on 30 April 2024).
  9. Barbaglia, Luca, Sergio Consoli, and Sebastiano Manzan. 2022. Forecasting with Economic News. Journal of Business & Economic Statistics 41: 708–19. [Google Scholar] [CrossRef]
  10. Basel Committee on Banking Supervision. 2020. Supplemental Note to External Audits of Banks—Audit of Expected Credit Loss. Guidelines. Basel: Bank for International Settlements, December, Available online: https://www.bis.org/bcbs/publ/d513.pdf (accessed on 1 May 2024).
  11. Blümke, Oliver. 2022. Multiperiod default probability forecasting. Journal of Forecasting 41: 677–96. [Google Scholar] [CrossRef]
  12. Boyle, Erik S. 2024. How do auditors’ use of industry norms differentially impact management evaluations of audit quality under principles-based and rules-based accounting standards? Journal of International Accounting, Auditing and Taxation 54: 100598. [Google Scholar] [CrossRef]
  13. Buckman, Shelby R., Adam Hale Shapiro, Moritz Sudhof, and Daniel J. Wilson. 2020. News Sentiment in the Time of COVID-19. FRBSF Economic Letter, 2020-08. Research from Federal Reserve Bank of San Francisco. Available online: https://www.frbsf.org/wp-content/uploads/el2020-08.pdf (accessed on 1 May 2024).
  14. Buckmann, Marcus, Andy Haldane, and Anne-Caroline Huser. 2021. Comparing Minds and Machines: Implications for FINANCIAL STABility. London: Bank of England, Staff Working Paper No. 937. Available online: https://www.bankofengland.co.uk/working-paper/2021/comparing-minds-and-machines-implications-for-financial-stability (accessed on 1 May 2024).
  15. Bullock, Michele. 2023. How well placed are households for interest rate increases. Economic Analysis and Policy 77: 222–30. [Google Scholar] [CrossRef]
  16. Campbell, Sean D., and Steven A. Sharpe. 2009. Anchoring Bias in Consensus Forecasts and Its Effect on Market Prices. Journal of Financial and Quantitative Analysis 44: 369–90. [Google Scholar] [CrossRef]
  17. Cao, Longbing. 2021. AI in Finance: Challenges, Techniques and Opportunities. ACM Computing Surveys 55: 1–38. [Google Scholar] [CrossRef]
  18. Cao, Sean Shun, Wei Jiang, Lijun Lei, and Qing Zhou. 2024. Applied AI for finance and accounting: Alternative data and opportunities. Pacific-Basin Finance Journal 84: 102307. [Google Scholar] [CrossRef]
  19. Caporin, Massimiliano, Michele Costola, Jean-Charles Garibal, and Bertrand Maillet. 2022. Systemic risk and severe economic downturns: A targeted and sparse analysis. Journal of Banking & Finance 134: 106339. [Google Scholar] [CrossRef]
  20. Carvalho, Paulo V., José D. Curto, and Rodrigo Primor. 2022. Macroeconomic determinants of credit risk: Evidence from the Eurozone. International Journal of Finance & Economics 27: 2054–72. [Google Scholar] [CrossRef]
  21. Chatterjee, Somnath, and Marea Sing. 2021. Measuring Systemic Risk in South African Banks. South African Reserve Bank Working Paper Series WP/21/04. Available online: https://www.resbank.co.za/content/dam/sarb/publications/working-papers/2021/WP%202104.pdf (accessed on 1 May 2024).
  22. Chen, Chung-Chi, Hen-Hsen Huang, and Hsin-Hsi Chen. 2021. From Opinion Mining to Financial Argument Mining, 1st ed. Singapore: Springer Briefs in Computer Science. [Google Scholar] [CrossRef]
  23. Correa, Ricardo, Keshav Garud, Juan M. Londono, and Nathan Mislang. 2021. Sentiment in Central Banks’ Financial Stability Reports. Review of Finance 25: 85–120. [Google Scholar] [CrossRef]
  24. Cosma, Simona, Giuseppe Rimo, and Giuseppe Torluccio. 2023. Knowledge mapping of model risk in banking. International Review of Financial Analysis 89: 102800. [Google Scholar] [CrossRef]
  25. Dai, Peng-Fei, Xiong Xiong, and Wei-Xing Zhou. 2021. A global economic policy uncertainty index from principal component analysis. Finance Research Letters 40: 101686. [Google Scholar] [CrossRef]
  26. Devlin, Jacob, Ming-Wei Chang, Kenton Lee, and Kristina Toutanova. 2019. BERT: Pre-training of Deep Bidirectional Transformers for Language Understanding. Paper presented at the 2019 Conference of the North American Chapter of the Association for Computational Linguistics: Human Language Technologies, Minneapolis, MN, USA, June; Association for Computational Linguistics, Volume 1 (Long and Short Papers). pp. 4171–86. [Google Scholar]
  27. Du Rand, Gideon, Ruan Erasmus, Hylton Hollander, Monique Reid, and van Dawie Lill. 2021. The evolution of central bank communication as experienced by the South Africa Reserve Bank. Economic History of Developing Regions 36: 282–312. [Google Scholar] [CrossRef]
  28. Du, Ning, Alessandra Allini, and Marco Maffei. 2022. How do bank managers forecast the future in the shadow of the past? An examination of expected credit losses under IFRS 9. Accounting and Business Research 53: 699–722. [Google Scholar] [CrossRef]
  29. Engle, Robert F., and C. W. J. Granger. 1987. Co-integration and error correction: Representation, estimation, and testing. Econometrica 55: 251–76. [Google Scholar] [CrossRef]
  30. Engler, Alex. 2020. Can AI Model Economic Choices? The Brookings Institution. Artificial Intelligence and Emerging Technology Series. Available online: https://www.brookings.edu/research/can-ai-model-economic-choices/ (accessed on 1 May 2024).
  31. European Central Bank (ECB). 2011. Systemic Risk Methodologies. Financial Stability Review. June. Available online: https://www.ecb.europa.eu/pub/pdf/fsr/art/ecb.fsrart201106_03.en.pdf (accessed on 1 May 2024).
  32. European Systemic Risk Board. 2019. Macroprudential Approaches to Non-Performing Loans. European System of Financial Supervision. Available online: https://www.esrb.europa.eu/pub/pdf/reports/esrb.report190128_macropudentialapproachestonon-performingloans.en.pdf (accessed on 1 May 2024).
  33. Fallanca, Maria Grazia, Antonio Fabio Forgione, and Edoardo Otranto. 2020. Forecasting the macro determinants of bank credit quality: A non-linear perspective. Journal of Risk Finance 21: 423–43. [Google Scholar] [CrossRef]
  34. Fenniak, Mathieu, Matthew Stamy, Martin Thoma, Matthew Peveler, and pypdf contributors. 2024. The pypdf Library. Available online: https://pypdf.readthedocs.io/en/latest/meta/faq.html (accessed on 1 May 2023).
  35. Gardner, Ben, Chiara Scotti, and Clara Vega. 2021. Words Speak as Loudly as Actions: Central Bank Communication and the Response of Equity Prices to Macroeconomic Announcements; Finance and Economics Discussion Series 2021-074; Washington, DC: Board of Governors of the Federal Reserve System. [CrossRef]
  36. Ghirelli, Corinna, Javier J. Pérez, and Alberto Urtasun. 2019. A New Economic Policy Uncertainty Index for Spain. Economics Letters 182: 64–67. [Google Scholar] [CrossRef]
  37. Giacomini, Raffaella, and Barbara Rossi. 2015. Forecasting in Nonstationary Environments: What Works and What Doesn’t in Reduced-Form and Structural Models. Annual Review of Economics 7: 207–29. [Google Scholar] [CrossRef]
  38. Glimcher, Paul W., Colin F. Camerer, Ernst Fehr, and Russell A. Poldrack. 2009. Chapter 1—Introduction: A Brief History of Neuroeconomics. In Neuroeconomics: Decision Making and the Brain. Edited by Paul W. Glimcher, Colin F. Camerer, Ernst Fehr and Russell A. Poldrack. London: Elsevier, pp. 1–12. [Google Scholar]
  39. Gubareva, M. 2020. IFRS 9 Compliant Economic Adjustment of Expected Credit Loss Modeling. Journal of Credit Risk 16: 29–66. Available online: https://ssrn.com/abstract=3769164 (accessed on 1 May 2024). [CrossRef]
  40. Gumata, Nombulelo, and Eliphas Ndou. 2021. How Does a Tight Monetary Policy Shock Affect the Household Sector Intermediation? Evidence from Households’ Flow-of-Funds Data. In Achieving Price, Financial and Macro-Economic Stability in South Africa. Cham: Palgrave Macmillan. [Google Scholar] [CrossRef]
  41. Gupta, Shelley, Archana Singh, and Vivek Kumar. 2023. Emoji, Text, and Sentiment Polarity Detection Using Natural Language Processing. Information 14: 222. [Google Scholar] [CrossRef]
  42. Gwatidzo, Tendai, and Witness Simbanegavi. 2024. Financial Inclusion and Banking Sector Competition in South Africa. Working Paper Series, WP/24/08; Pretoria: South Africa Reserve Bank, April 16, Available online: https://www.resbank.co.za/content/dam/sarb/publications/working-papers/2024/financial-inclusion-and-banking-sector-competition-in-south-africa.pdf (accessed on 1 June 2024).
  43. Hanley, Kathleen Weiss, and Gerard Hoberg. 2019. Dynamic Interpretation of Emerging Risks in the Financial Sector. The Review of Financial Studies 32: 4543–603. [Google Scholar] [CrossRef]
  44. Hartwig, Benny, Christoph Meinerding, and Yves S. Schüler. 2021. Identifying indicators of systemic risk. Journal of International Economics 132: 103512. [Google Scholar] [CrossRef]
  45. Hassani, Hossein, Christina Beneki, Stephan Unger, Maedeh Taj Mazinani, and Mohammad Reza Yeganegi. 2020. Text Mining in Big Data Analytics. Big Data and Cognitive Computing 4: 1. [Google Scholar] [CrossRef]
  46. Huang, Allen H., Hui Wang, and Yi Yang. 2023. FinBERT: A large language model for extracting information from financial text. Contemporary Accounting Research 40: 806–41. [Google Scholar] [CrossRef]
  47. Hyndman, Rob J., and George Athanasopoulos. 2021. Forecasting: Principles and Practice, 3rd ed. Melbourne: OTexts. Available online: https://otexts.com/fpp3/ (accessed on 1 May 2024).
  48. International Accounting Standards Board. 2014. IFRS 9: Financial Instruments. Available online: https://www.ifrs.org/content/dam/ifrs/publications/pdf-standards/english/2022/issued/part-a/ifrs-9-financial-instruments.pdf?bypass=on (accessed on 30 April 2024).
  49. International Auditing and Assurance Standards Board. 2018. ISA 540 (Revised) and Conforming and Consequential Amendments to Other International Standards Arising from ISA 540 (Revised). Available online: https://www.ifac.org/_flysystem/azure-private/publications/files/ISA-540-Revised-and-Conforming-Amendments_0.pdf (accessed on 1 May 2024).
  50. Kohlhas, Alexandre N., and Ansgar Walther. 2021. Asymmetric Attention. American Economic Review 111: 2879–925. [Google Scholar] [CrossRef]
  51. Kou, Gang, Xiangrui Chao, Yi Peng, Fawaz E. Alsaadi, and Enrique Herrera-Viedma. 2019. Machine learning methods for systemic risk analysis in financial sectors. Technological and Economic Development of Economy 25: 716–42. [Google Scholar] [CrossRef]
  52. Kryvtsov, Oleksiy, and Luba Petersen. 2021. Central Bank Communication That Works: Lessons from Lab Experiments. Journal of Monetary Economics 117: 760–80. [Google Scholar] [CrossRef]
  53. Kulbhaskar, Anamika Kumar, and Sowmya Subramaniam. 2023. Breaking news headlines: Impact on trading activity in the cryptocurrency market. Economic Modelling 126: 106397. [Google Scholar] [CrossRef]
  54. Lee, Younghwan, and Beomseok Seo. 2023. Extracting Economic Sentiment from News Articles: The Case of Korea, IFC Bulletins chapters. In Data Science in Central Banking: Applications and Tools. Basel: Bank for International Settlements, vol. 59, Available online: https://www.bis.org/ifc/publ/ifcb59_37.pdf (accessed on 1 May 2024).
  55. Li, Hui-Min, Xue-Chun Wang, Xiao-Fan Zhao, and Ye Qi. 2021. Understanding systemic risk induced by climate change. Advances in Climate Change Research 12: 384–94. [Google Scholar] [CrossRef]
  56. Loewenstein, George, Scott Rick, and Jonathan D. Cohen. 2008. Neuroeconomics. Annual Review of Psychology 59: 647–72. [Google Scholar] [CrossRef] [PubMed]
  57. Macaulay, Alistair, and Wenting Song. 2023. Narrative-Driven Fluctuations in Sentiment: Evidence Linking Traditional and Social Media. Staff Working Paper 2023-23. Ottawa: Bank of Canada. [Google Scholar] [CrossRef]
  58. Mahlendorf, Matthias D., Melissa A. Martin, and David Smith. 2023. Innovative Data—Use-cases in Management Accounting Research and Practice. European Accounting Review 32: 547–76. [Google Scholar] [CrossRef]
  59. Martinelli, Fabio, Francesco Mercaldo, Domenico Raucci, and Antonella Santone. 2020. Predicting Probability of Default under IFRS 9 through Data Mining Techniques. In Web, Artificial Intelligence and Network Applications. Edited by Leonard Barolli, Flora Amato, Francesco Moscato, Tomoya Enokido and Makoto Takizawa. WAINA 2020. Advances in Intelligent Systems and Computing. Cham: Springer, vol. 1150. [Google Scholar] [CrossRef]
  60. Mäkelä, Maria, Samuli Björninen, Laura Karttunen, Matias Nurminen, Juha Raipola, and Tytti Rantanen. 2021. Dangers of Narrative: A Critical Approach to Narratives of Personal Experience in Contemporary Story Economy. Narrative 29: 139–59. [Google Scholar] [CrossRef]
  61. McCaul, Elizabeth, and Stefan Walter. 2023. Overlays and In-Model Adjustments: Identifying Best Practices for Capturing Novel Risks. The Supervision Blog. Frankfurt am Main: European Central Bank. Available online: https://www.bankingsupervision.europa.eu/press/blog/2023/html/ssm.blog230526~29af0452d6.en.html (accessed on 1 May 2024).
  62. Montagna, Maria, Gabriele Torri, and Giovanni Covi. 2021. On the Origin of Systemic Risk. Staff Working Paper No. 906. London: Bank of England. Available online: https://www.bankofengland.co.uk/-/media/boe/files/working-paper/2021/on-the-origin-of-systemic-risk.pdf (accessed on 1 May 2024).
  63. Nguyen, Kim, and Gianni La Cava. 2020. Start Spreading the News: News Sentiment and Economic Activity in Australia; Research Discussion Paper—RDP 2020-08. Sydney: Reserve Bank of Australia. Available online: https://www.rba.gov.au/publications/rdp/2020/2020-08/full.html (accessed on 1 May 2024).
  64. Nyati, Malibongwe Cyprian, Paul-Francois Muzindutsi, and Christian Kakese Tipoy. 2023. Macroprudential and Monetary Policy Interactions and Coordination in South Africa: Evidence from Business and Financial Cycle Synchronisation. Economies 11: 272. [Google Scholar] [CrossRef]
  65. Nyman, Rickard, Sujit Kapadia, and David Tuckett. 2021. News and narratives in financial systems: Exploiting big data for systemic risk assessment. Journal of Economic Dynamics and Control 27: 104119. [Google Scholar] [CrossRef]
  66. Oshikawa, Ray, Jing Qian, and William Yang Wang. 2018. A Survey on Natural Language Processing for Fake News Detection. Paper presented at the 12th Language Resources and Evaluation Conference (LREC 2020), Marseille, France, May 11–16; pp. 6086–93. [Google Scholar] [CrossRef]
  67. Pan, Wenrong, Tao Xie, Zhuwang Wang, and Lisha Ma. 2022. Digital economy: An innovation driver for total factor productivity. Journal of Business Research 139: 303–311. [Google Scholar] [CrossRef]
  68. Peytcheva, Marietta, Arnold M. Wright, and Barbara Majoor. 2014. The Impact of Principles-Based versus Rules-Based Accounting Standards on Auditors’ Motivations and Evidence Demands. Behavioral Research in Accounting 26: 51–72. [Google Scholar] [CrossRef]
  69. PWC. 2024. South Africa—Major Banks Analysis. March. Available online: https://www.pwc.co.za/en/publications/major-banks-analysis.html (accessed on 15 June 2024).
  70. Python Software Foundation. 2024. Python Language Reference, Version 3.9.7. Available online: http://www.python.org (accessed on 1 May 2024).
  71. Raghavendra, Sujay. 2021. Introduction to Selenium. In Python Testing with Selenium. Berkeley: Apress. [Google Scholar] [CrossRef]
  72. Ranta, Mikko, and Mika Ylinen. 2023. Employee benefits and company performance: Evidence from a high-dimensional machine learning model. Management Accounting Research, 100876. [Google Scholar] [CrossRef]
  73. Raza, Shahid, Sun Baiqing, Pwint Kay-Khine, and Muhammad Ali Kemal. 2023. Uncovering the Effect of News Signals on Daily Stock Market Performance: An Econometric Analysis. International Journal of Financial Studies 11: 99. [Google Scholar] [CrossRef]
  74. Richardson, Leonard. 2007. Beautiful Soup Documentation. April. Available online: https://beautiful-soup-4.readthedocs.io/en/latest/ (accessed on 1 May 2023).
  75. Rooplall, Videshree, and Siphokazi Nkosi. 2021. The South African Reserve Bank’s Systemic Risk Assessment and Macroprudential Policy Frameworks for Financial Stability. Pretoria: Financial Stability Department. South African Reserve Bank, June, Available online: https://www.resbank.co.za/en/home/what-we-do/financial-stability (accessed on 1 May 2024).
  76. Rossi, Barbara. 2021. Forecasting in the Presence of Instabilities: How We Know Whether Models Predict Well and How to Improve Them. Journal of Economic Literature 59: 1135–90. [Google Scholar] [CrossRef]
  77. Rönnqvist, Samuel, and Peter Sarlin. 2017. Bank distress in the news: Describing events through deep learning. Neurocomputing 264: 57–70. [Google Scholar] [CrossRef]
  78. Schutte, Willem Daniel, Tanja Verster, Derek Doody, Helgard Raubenheimer, Peet J. Coetzee, and David McMillan. 2020. A proposed benchmark model using a modularised approach to calculate IFRS 9 expected credit loss. Cogent Economics & Finance 8: 1735681. [Google Scholar] [CrossRef]
  79. Segawa, Arnold. 2021. Sentimental Outlook for the Monetary Policies of South African Reserve Bank. International Journal of Finance & Banking Studies 10: 37–56. [Google Scholar] [CrossRef]
  80. Seki, Kazuhiro, Yusuke Ikuta, and Yoichi Matsubayashi. 2022. News-based business sentiment and its properties as an economic index. Information Processing & Management 59: 102795. [Google Scholar] [CrossRef]
  81. Shapiro, Adam Hale, Moritz Sudhof, and Daniel J. Wilson. 2022. Measuring news sentiment. Journal of Econometrics 228: 221–43. [Google Scholar] [CrossRef]
  82. Shiller, Robert J. 2020. Narrative Economics: How Stories Go Viral and Drive Major Economic Events. Princeton: Princeton University Press. [Google Scholar]
  83. Stander, Yolanda S. 2023. The Governance and Disclosure of IFRS 9 Economic Scenarios. Journal of Risk and Financial Management 16: 47. [Google Scholar] [CrossRef]
  84. Tadphale, Anushkla, Haripriya Saraswat, Omkar Sonawane, and P. R. Deshmukh. 2023. Impact of News Sentiment on Foreign Exchange Rate Prediction. Paper presented at the 2023 3rd International Conference on Intelligent Technologies (CONIT), Hubli, India, June 23–25; pp. 1–8. [Google Scholar] [CrossRef]
  85. Tank, Ann K., and Anne M. Farrell. 2022. Is Neuroaccounting Taking a Place on the Stage? A Review of the Influence of Neuroscience on Accounting Research. European Accounting Review 31: 173–207. [Google Scholar] [CrossRef]
  86. Vicari, Mattia, and Mauro Gaspari. 2021. Analysis of news sentiments using natural language processing and deep learning. AI & Society 36: 931–37. [Google Scholar] [CrossRef]
  87. Vinson, Jeremy M., Byron J. Pike, Lawrence Chui, and Mingjun Zhou. 2024. The Influence of Audit Evidence Framing on Auditors’ Judgment. Behavioral Research in Accounting 36: 105–20. [Google Scholar] [CrossRef]
  88. William, P., Anurag Shrivastava, Premanand S. Chauhan, Mudasir Raja, Sudhir B. Ojha, and Keshav Kumar. 2023. Natural Language Processing Implementation for Sentiment Analysis on Tweets. In Mobile Radio Communications and 5G Networks. Edited by Nikhil Marriwala, C.C. Tripathi, Shruti Jain and Dinesh Kumar. Lecture Notes in Networks and Systems. Singapore: Springer, vol. 588. [Google Scholar] [CrossRef]
  89. Xing, Kai, and Xiaoguang Yang. 2020. Predicting default rates by capturing critical transitions in the macroeconomic system. Finance Research Letters 32: 101107. [Google Scholar] [CrossRef]
  90. Yang, Bill Huajian. 2017. Forward ordinal probability models for point-in-time probability of default term structure: Methodologies and implementations for IFRS 9 expected credit loss estimation and CCAR stress testing. Journal of Risk Model Validation 11: 1–18. [Google Scholar] [CrossRef]
  91. Zaremba, Adam, and Ender Demir. 2023. ChatGPT: Unlocking the Future of NLP in Finance (January 13, 2023). Modern Finance 1: 93–98. [Google Scholar] [CrossRef]
  92. Zhang, Chanyuan, Soohyun Cho, and Miklos Vasarhelyi. 2022. Explainable Artificial Intelligence (XAI) in auditing. International Journal of Accounting Information Systems 46: 100572. [Google Scholar] [CrossRef]
Figure 1. Narrative extracted from the Financial Times headlines.
Jrfm 17 00282 g001
Figure 2. Negative relationship between the change in PD and news sentiment.
Jrfm 17 00282 g002
Figure 3. Dependence between the central bank communications and the two news sources.
Jrfm 17 00282 g003aJrfm 17 00282 g003b
Figure 4. Summary of the relationship between the systemic index and each of the individual news series.
Jrfm 17 00282 g004
Figure 5. Summary of the relationship between the systemic index and the news sentiment index.
Jrfm 17 00282 g005
Figure 6. The bivariate dependence structure between the systemic index and the lagged sentiment index.
Jrfm 17 00282 g006
Figure 7. Rolling regression model weights over time.
Jrfm 17 00282 g007
Figure 8. Out-of-sample performance of the regression model targeting the systemic index E S I .
Jrfm 17 00282 g008
Figure 9. Comparison between the news sources with the strongest relationship with the systemic index.
Jrfm 17 00282 g009
Table 1. News sources used in the construction of a news sentiment index.
SourceDescriptionFrequencyDate RangeOnline Source
BISCode = SS_BISER; Annual Economic Report Annual2005 to 2023https://www.bis.org/
BISCode = SS_BISSP; Central banker’s speeches—South AfricaNo set frequency2012 to 2023https://www.bis.org/
Financial MailCode = SS_FM; Financial views and news
(South Africa)
Mid-Month 2013 to 2023Newsbank
Financial TimesCode = SS_FT; Financial views and news
(South Africa), headlines
No set frequency2010 to 2023https://www.ft.com/south-africa (accessed on 16 April 2024)
SARBCode = SS_SARBFSR; Financial Stability ReviewQuarterly2004 to 2023https://www.resbank.co.za/
SARBCode = SS_SARBMPC; Monetary Policy Committee StatementNo set frequency2013 to 2023https://www.resbank.co.za/
SARBCode = SS_SARBQB; Quarterly BulletinQuarterly2008 to 2023https://www.resbank.co.za/
WEFCode = SS_WEF; Global Risks ReportAnnual2006 to 2023https://www.weforum.org/
BIS = Bank for International Settlements, SARB = South African Reserve Bank, WEF = World Economic Forum.
Table 2. Economic data used in the construction of an economic systemic index.
CategoryCodeDescriptionSourceData
Frequency
Stock MarketALSIJSE All-Share Index. Closing price. Year-on-year.EquityRTDaily
Stock MarketFINIJSE Financial 15 Index. Closing price. Year-on-year.EquityRTDaily
Economic ActivityGDPGross domestic product at market prices. Constant 2010 prices.
Seasonally adjusted. Code: KBP6006D. Year-on-year.
SARBQuarterly
Economic ActivityPMIAbsa Purchasing Managers’ Index. Survey-based.BERMonthly
Credit ExtensionPCEAll monetary institutions: total credit extended to the private sector. KBP1347M. Year-on-year.SARBMonthly
CompensationECOMPCompensation of employees at current prices:
Total. Code: KBP6240L. Year-on-year.
SARBQuarterly
CompensationPDIDisposable income of households. Current prices.
Seasonally adjusted. Code: KBP6246L. Year-on-year.
SARBQuarterly
Interest RatesBONDYield on loan stock traded on the stock exchange for government bonds 10 years and over. Code: KBP2003M. Annual moves.SARBMonthly
InflationCPIConsumer price index. Headline CPI Year-on-year rates;
Code: P0141.
Stats SAMonthly
InflationPPIProducer price index. Final manufactured goods.
December 2016 = 100. Code: P0142.1. Year-on-year.
Stats SAMonthly
Exchange RateUSDZARRand per US Dollar. Year-on-year.EquityRTDaily
Confidence IndexBCIComposite business confidence index. Survey-based. BERQuarterly
Confidence IndexCCIConsumer confidence index. Survey-based. BERQuarterly
Confidence IndexSARBLEADSARB business confidence indicator–leading. Year-on-year. SARBMonthly
Confidence IndexSARBCOINSARB business confidence indicator–coincident. Year-on-year. SARBMonthly
Confidence IndexSARBLAGSARB business confidence indicator–lagging. Year-on-year. SARBMonthly
SARB = South African Reserve Bank; BER = Bureau for Economic Research.
Table 3. Exposure-weighted average PD extracted from the Pillar 3 reports of the big-4 banks in South Africa for selected asset classes.
Asset Class: Corporate
SA Bank20162017201820192020202120222023
A1.011.941.872.691.92.81.861.19
B 0.960.890.840.750.790.93
C0.850.930.80.890.860.760.920.94
D1.521.091.182.222.331.741.991.9
Average PD1.131.321.201.671.481.511.391.24
LN Change in PD 15.8−9.333.0−12.12.0−8.4−11.4
Asset Class: Mortgages
SA Bank20162017201820192020202120222023
A3.533.283.073.263.193.333.463.88
B 3.283.333.443.063.032.79
C3.383.263.022.532.632.582.793.11
D4.975.345.366.337.427.676.987.29
Average PD3.963.963.683.864.174.164.074.27
LN Change in PD 0.0−7.34.87.7−0.2−2.34.9
Asset Class: Revolving Retail
SA Bank20162017201820192020202120222023
A7.287.187.237.577.347.437.658.36
B 4.214.384.3244.133.58
C4.784.764.955.04.925.335.33
D5.946.055.598.359.339.588.869.1
Average PD6.006.005.486.336.506.486.496.59
LN Change in PD −0.1−9.014.32.7−0.20.21.5
Asset Class: SME Retail
SA Bank20162017201820192020202120222023
A3.833.893.664.563.683.713.843.94
B 3.483.223.753.582.963.48
C2.932.953.032.733.173.12.841.28
D6.257.417.168.213.6411.729.088.18
Average PD4.344.754.334.686.065.534.684.22
LN Change in PD 9.1−9.27.725.9−9.2−16.6−10.3
Table 4. Eigenvalues and eigenvectors used in the construction of the economic systemic index.
Eigenvector SquaredALSIFINIPDIECOMPPCEPPICPIBONDUSD
ZAR
GDPPMIEigenvalues
λ j
% Variance Explained
β 1 2 9%32%7%3%1%16%7%3%6%8%10%2.5440%
β 2 2 8%1%9%1%9%17%16%16%16%3%4%1.8729%
β 3 2 0%1%3%5%1%3%0%13%7%5%61%0.9715%
β 4 2 19%19%0%1%0%0%21%12%18%3%7%0.295%
β 5 2 14%1%0%33%0%14%2%0%8%17%11%0.203%
β 6 2 16%0%6%27%0%0%9%6%15%19%1%0.163%
β 7 2 12%4%5%13%0%11%1%35%17%0%0%0.162%
β 8 2 10%11%45%4%0%6%0%11%11%1%2%0.102%
β 9 2 1%1%0%0%86%2%0%2%1%2%4%0.081%
β 10 2 9%29%10%1%1%15%5%1%1%27%0%0.051%
β 11 2 3%0%14%12%0%16%38%0%1%15%0%0.010%
Table 5. Eigenvalues and eigenvectors used in the construction of the news sentiment index.
EigenvectorsSS_FMSS_FTSS_SARBFSRSS_SARBMPCEigenvalues
λ j
% Variance
Explained
β 1 −0.030.440.650.621.6444%
β 2 −0.91−0.340.22−0.040.9826%
β 3 0.35−0.830.240.360.7219%
β 4 −0.200.02−0.690.700.4111%
Table 6. Regression results with the systemic index E S I as target variable for September 2022.
SymbolDescriptionLag (Months)Regression
Coefficient φ i
ADF Test StatisticADF p-Value
Y E S I 0 −1.318.0%
X 1 N S I 30.21 *−1.511.5%
X 2 BCI00.15 **−1.124.0%
X 3 SARBLEAD00.10 *−1.415.8%
φ 0 intercept −0.25 *
ε t Residuals −3.5<0.01%
*—statistically significant at the 1% confidence level; **—statistically significant at the 5% confidence level.
Table 7. Regression results with the systemic index E S I as target variable for September 2022.
SymbolDescriptionLag (Months)Regression
Coefficient φ i
ADF Test StatisticADF p-Value
Y E S I 0 −1.318.0%
X 1 N S I 30.16 *−1.511.5%
X 2 SS_BISER00.12 *−1.95.9%
X 3 BCI00.07 ***−1.124.0%
X 4 SARBLEAD00.17 *−1.415.8%
φ 0 intercept −0.34 *
ε t Residuals −4.35<0.01%
*—statistically significant at the 1% confidence level; ***—statistically significant at the 10% confidence level.
Table 8. Summary of the keywords by news topic.
TopicKeyword
economic growthgdp, pmi, economic growth, recession, gross domestic product
currencycurrency, currencies, usd, zar, rand, forex, foreign exchange, fx, exchange rate, crypto
supply chainsupply chain, freight, logistics, import, export, deglobal, logistics
inflationinflation, stagflation, disinflation, consumer price index, cpi, producer price index, ppi
AIchatgpt, chatbot, artificial intelligence, ai, robot, machine learning, automat, algo, cyber
electricityload-shed, loadshed, solar, renewable, electricity, eskom, coal, karpowership, energy, power, diesel
sovereigngovernment, ramaphosa, zuma, president, sovereign downgrade, elections, strike, war, sanction, russia, state capture, fiscal, credit rating, risk premium, protest action, unrest, labour cost
climateclimate, weather, natural disaster, water, storm, drought, flood, global warming, esg, green economy, cop
consumptionretail, wage, consumption, job, employ, disposable income, compensation, salary, consumer, income, demand, stagflation
propertyreal estate, property, house price, housing, mall, tenant, vacancy rate, construction
tourismaviation, tourism, hotel, tourist, airplane, flight, leisure, travel, hospitality
interest ratecost of borrowing, interest rate, repo rate, monetary policy, borrowing cost, bond, reserve bank, policy rate, lending rate, cost of borrowing
stock marketcorporate, jse, alsi, equity, stocks, stock price, company, earnings, shares, shareholder
financebank, fintech, crypto, fatf, greylist, grey list, insurance, hedge fund, asset manager, financial institution
commoditymanufacture, pmi, commodity, mining, gold, diamond, oil, petrol
pandemiccorona, virus, pandemic, covid, lockdown, vaccination, vaccinate
healthcarenhi, health insurance, disease, illness, hospital, healthcare, nurse, doctor
contagion riskglobal recession, contagion, usa, china, trade war, russia, ukraine, war
agricultureagriculture, agricultural, farm, food
Table 9. Summary of the correlation between the news topic and the economic systemic index E S I .
News Source: SS_SARBFSRSS_SARBMPCSS_FM
TopicLag (Months)Rank CorrelationLag (Months)Rank CorrelationLag (Months)Rank Correlation
Economic Growth045%233%012%
Currency2−40%12−10%10−41%
Supply Chain559%229%06%
Inflation12−13%12−9%4−38%
AI828%0−19%1029%
Electricity03%117%116%
Sovereign243%1217%1012%
Climate028%325%637%
Consumption041%031%013%
Property12−7%915%10%
Tourism020%026%926%
Interest Rate12−24%12−6%07%
Stock Market016%1240%025%
Finance320%151%624%
Commodity042%941%011%
Pandemic01%725%09%
Healthcare03%110%127%
Contagion Risk040%467%0−5%
Agriculture020%349%412%
Disclaimer/Publisher’s Note: The statements, opinions and data contained in all publications are solely those of the individual author(s) and contributor(s) and not of MDPI and/or the editor(s). MDPI and/or the editor(s) disclaim responsibility for any injury to people or property resulting from any ideas, methods, instructions or products referred to in the content.

