Abstract
Investment in stocks is increasingly dependent on artificial intelligence (AI), but the psychological and social factors that affect stock prices may not be fully covered by the measures currently used in AI training. Here, we search for additional measures that may improve AI predictions. We start by reviewing stock price movements that appear to be affected by social and psychological factors, drawing on stock market behaviour during the COVID-19 pandemic. A review of processes that are likely to produce such stock market movements follows: the disposition effect, momentum, and the response to information. These processes are then explained by regression to the mean, negativity bias, the availability mechanism, and information diffusion. Taking account of these processes and drawing on the consumer behaviour literature, we identify three factors which may not be covered by current AI training data that could affect stock prices: publicity in relation to capitalization, stock-holding penetration in relation to capitalization, and changes in the penetration of stock holding.
1. Introduction
Sometimes, stock prices rise or fall in a manner that cannot be justified by financial fundamentals. These price changes appear when investors are aware of profit-related information but there is uncertainty about the effect of this information. This aspect of stock pricing is thus dependent, in part, on the individual and social psychological mechanisms involved in the reaction to uncertain information, and this includes the response of investors to the behaviour of other investors.
AI (artificial intelligence) is widely used in stock selection (Baldwin 2019; Rosenbaum 2017). AI can take account of many variables simultaneously and weigh their importance in interaction with other variables. When AI gets a prediction wrong, it can adjust weightings to improve later predictions. Shanmuganathan (2020) reports a rise in AI-managed wealth from 300 million dollars in 2014 to an estimated 2 trillion in 2020. More recently, Michael and Pratt (2023) have reported that 35 per cent of hedge funds use AI and that the returns of these funds are superior to those of funds that do not use AI. AI analysis requires large volumes of relevant data. There is no shortage of market data, company statistics, and information on the economy that can be used to establish whether a stock is underpriced or overpriced according to financial criteria, but such data may not cover all psychological and social factors affecting stock prices. Ideally, we would propose new variables, test these by incorporating them into the training data of AI, and then test the predictions of the trained AI, but access to such facilities is not readily available. We can leave such work to industry, or we can participate by assessing current knowledge and suggesting variables that may have been neglected; this is what we have done here.
Estimates vary, but it appears that around 60 per cent of US stock market trades are computer-driven and based on algorithms. These high-frequency trades benefit from the speed of transactions and are intended to make small gains by capitalizing on arbitrage, statistical effects, and minor inefficiencies in markets. Such trades are mostly held for less than a minute and so, despite their high volume, this use of the market employs only a small proportion of the total capital involved in stock investment. Because of this, these trades do not normally have much impact on market price levels. A much larger weight of investment rests on the ‘Warren Buffet’ approach. Here, investing is based on financial fundamentals, company management and history, and market prospects; often, stocks are held for years. There is some debate on what factors are fundamental, and there seems to be a case for including softer variables; for example, Gupta et al. (2004) find that customer retention is a major correlate of stock market value. A third approach to investment, technical analysis, uses statistical techniques and AI to predict market prices. Usually, this is applied to predictions about the market a few days ahead, using market data and leading indicators; this approach can claim some success (e.g., Zheng and Jin 2017).
Stock prices also depend on the psychological propensities of investors as they react to imprecise information that relates to profitability. A component of that information is the price movement brought about by investors. Keynes (1936) coined the term ‘animal spirits’ to describe such investor motivation that may lead to under- or overpricing when compared with valuations based on fundamentals. Investors following the Warren Buffet approach may benefit when stocks are underpriced according to fundamentals, but such investors may miss gains from buying a rising stock or short-selling a falling stock if the price rise/fall is predictable from psychological mechanisms rather than fundamentals. There will also be occasions when psychological factors and fundamentals work together, which could give a greater advantage to investors. Trading based on psychological influences could increase price swings and lead to the misallocation of capital. However, if we understand how these influences operate, it may be possible to regulate markets better and reduce such swings.
Fama (1970) argued that stock markets are efficient in the sense that stock prices immediately reflect all available relevant information. This would mean that there is no point in basing investment on publicly available information because the advantage that this confers would already have been consolidated in the stock price. Contrary to Fama’s claim, there is evidence that persistent biases exist. For example, Dimson et al. (2002) found that over 101 years, ‘value’ stocks, which trade at low prices relative to book value, were regularly underpriced in 13 out of 14 countries since yields from these stocks were, on average, substantially larger than yields on growth stocks1.
Evidence has accumulated on psychologically based biases that move stock prices and other market judgments away from valuations based on fundamentals, and we give examples of price movements over the period of the COVID-19 pandemic that reflect such biases. Then, attention is given to the psychological processes that are likely to be behind such stock price movements. In this review, studies relating to three important observations in behavioural finance are examined: these are the disposition effect, the momentum effect, and the spread of information among investors. We review explanations for these effects and use these to interpret the odd stock price movements that were observed during the pandemic. Finally, drawing on work in consumer behaviour, a review is made of measures that could be relevant to predicting psychologically based price movements. This work is not definitive. The purpose is to identify likely explanations and therefore measures that could be relevant in AI analysis; the latter, when conducted, will test our proposals.
2. Stock Price Movements during the COVID-19 Pandemic
Previous pandemics, including those in 1918–9, did not have much effect on stock prices, but, in these cases, there was no attempt by governments to curtail social and economic activity (Baker et al. 2020). At first, there was little stock price reaction to the outbreak in Wuhan (Capelle-Blancard and Desroziers 2020). On 4 February 2020, the Guardian commentator, Nils Pratley, noted that Western stock markets were disregarding the threat, and it was not until late in that month that stock prices started falling. With the advantage of hindsight, it seems extraordinary that the impact of the pandemic on cruise firms, airlines and hospitality was scarcely anticipated until then.
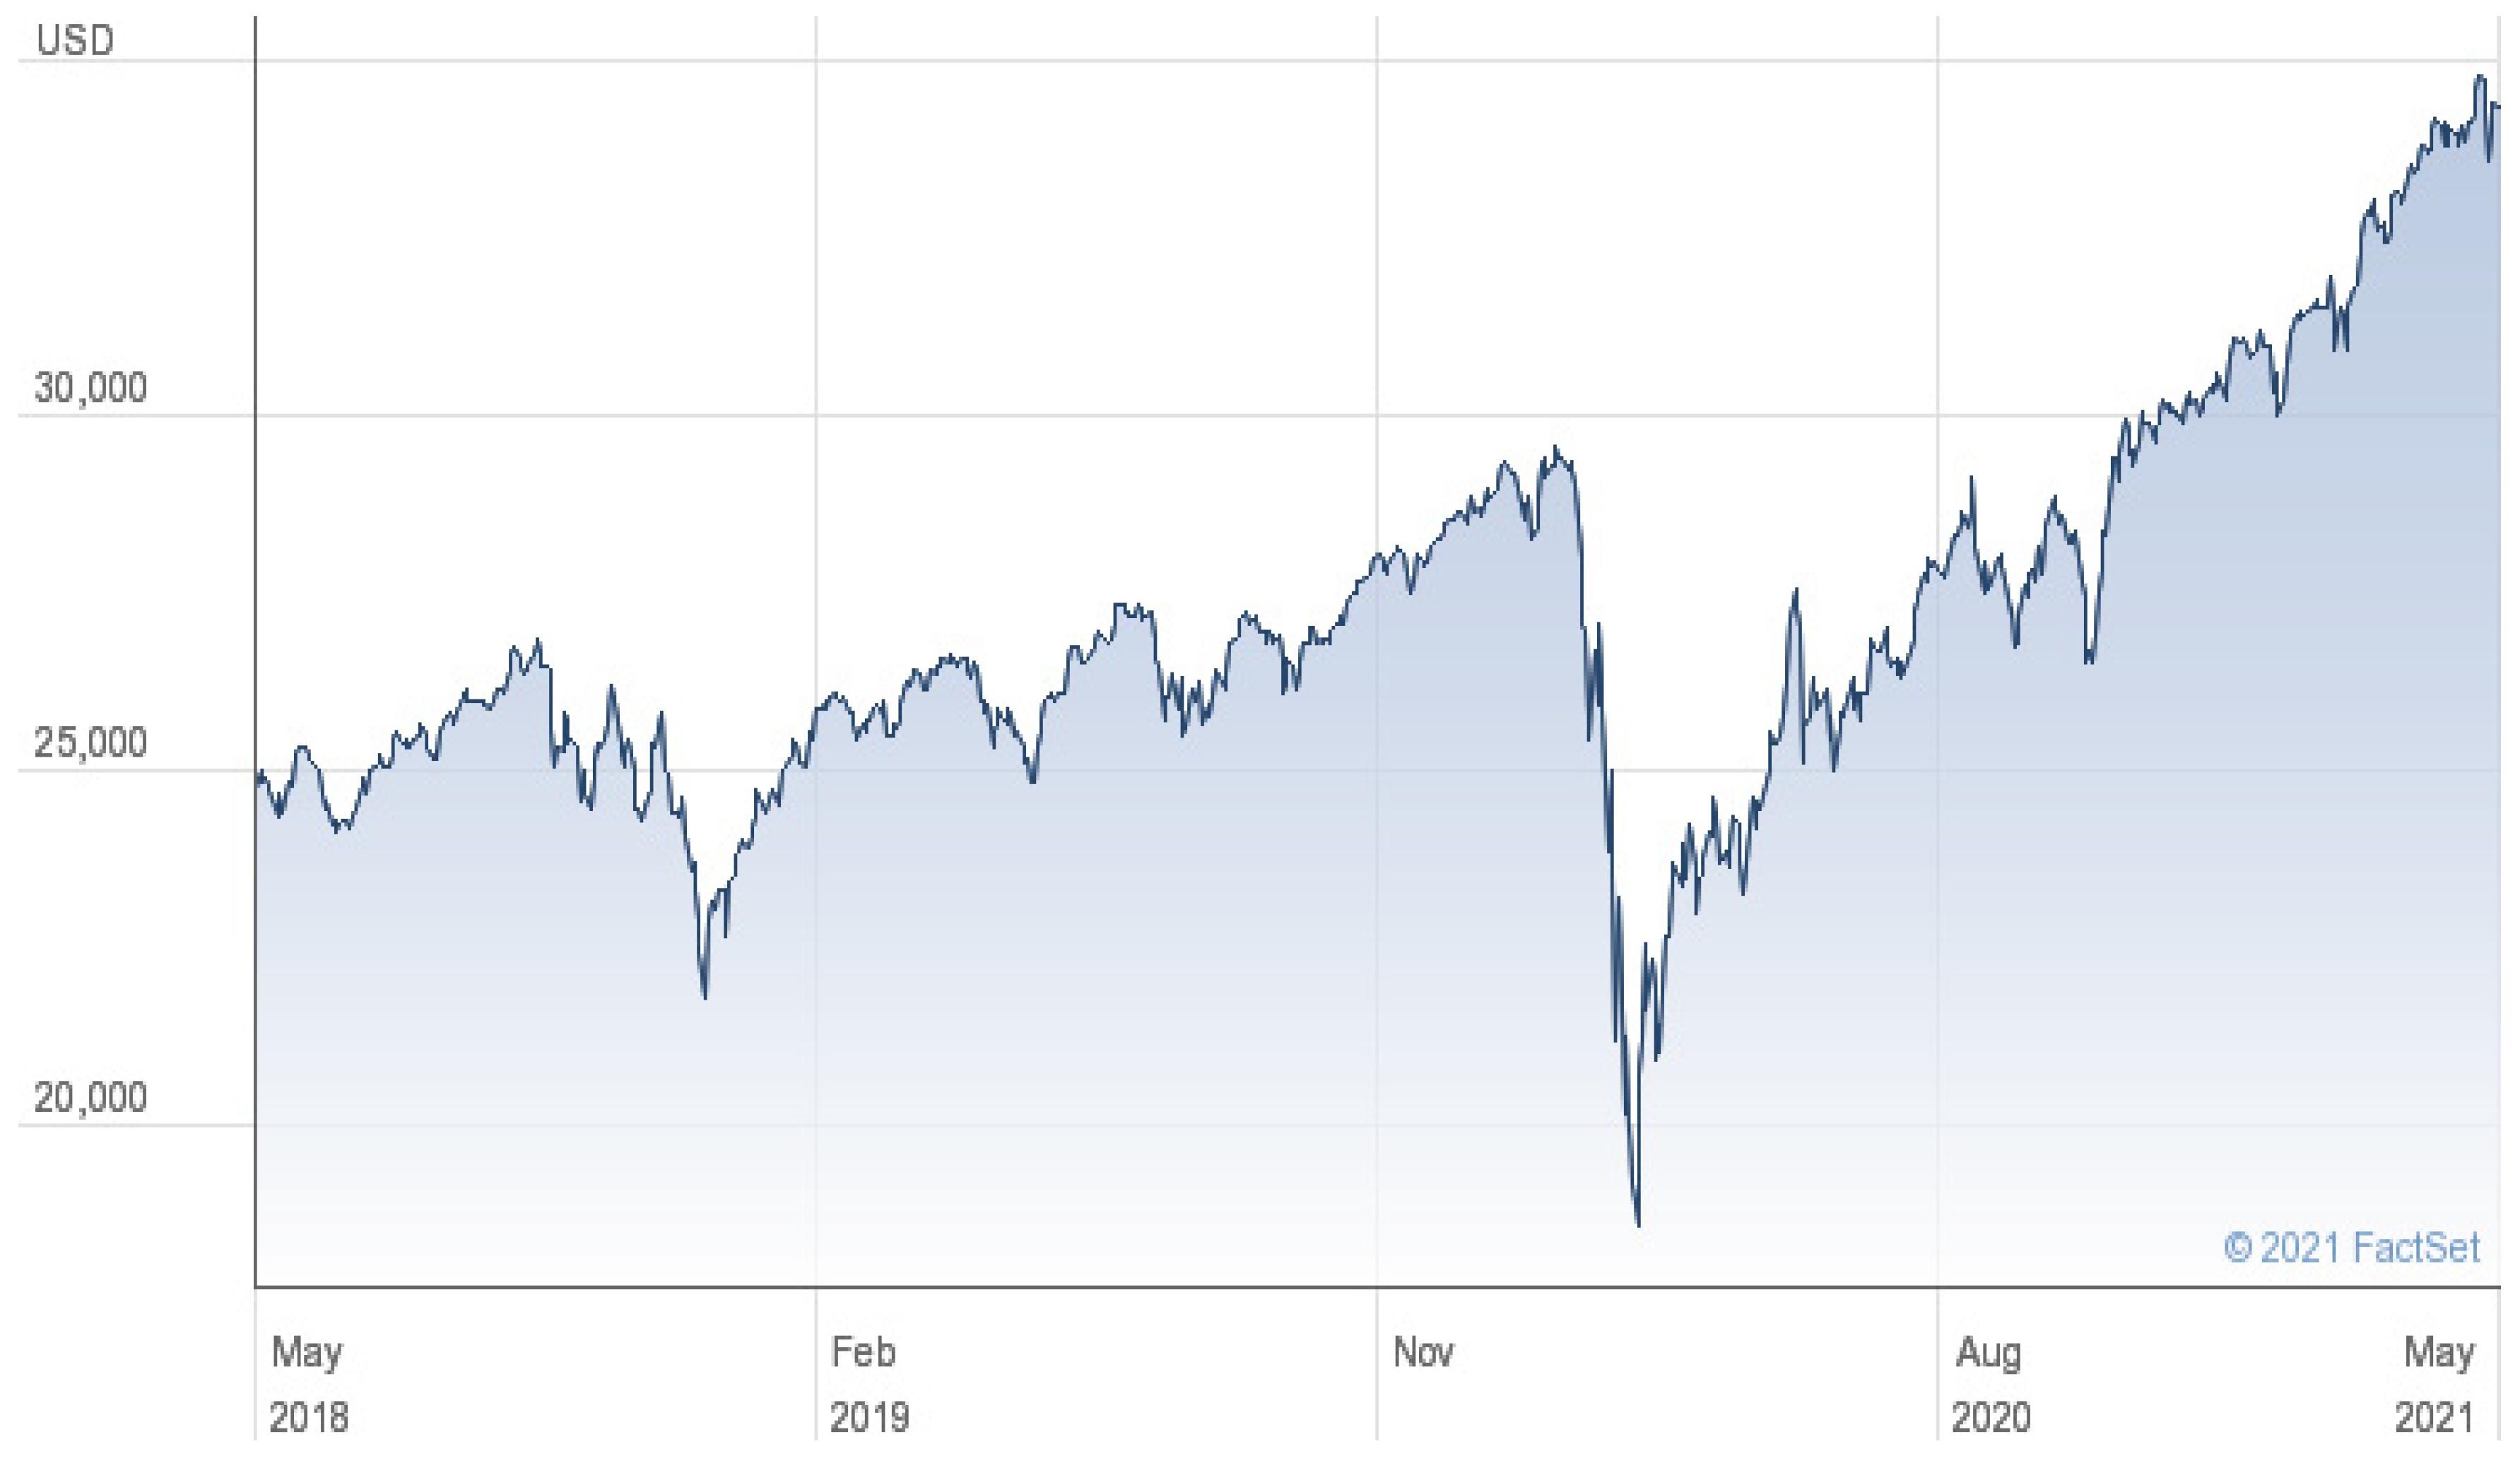
When the slide started, the Dow Jones Industrial Average lost 26 per cent in four trading days (Mazur et al. 2020). This is shown in Figure 1. This was mirrored by the fall of the FT 100 Index (Figure 2). The full decline was extended over a month, and there was massive volatility (Baker et al. 2020). The fall in prices then reversed so that about half the losses were recovered over the next few months. Some individual company crashes have been similarly quick; for example, the fall in the BP stock price following the Deepwater Horizon disaster took about six weeks and was followed by some recovery. However, compared with the 1929 crash and the bursting of the dot-com bubble, the COVID-19 crash was rapid. The 1929 crash occurred over three years, and the dot-com bubble, starting in 2002, burst over two and a half years. Recovery after these crashes was also slower than that observed with COVID-19; after the 1929 crash, recovery took years, and the NASDAQ took 10 months to regain about 50 per cent of the dot.com drop.

Figure 1.
Dow Index.
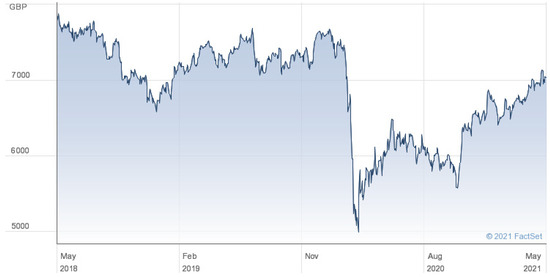
Figure 2.
FT100 Index.
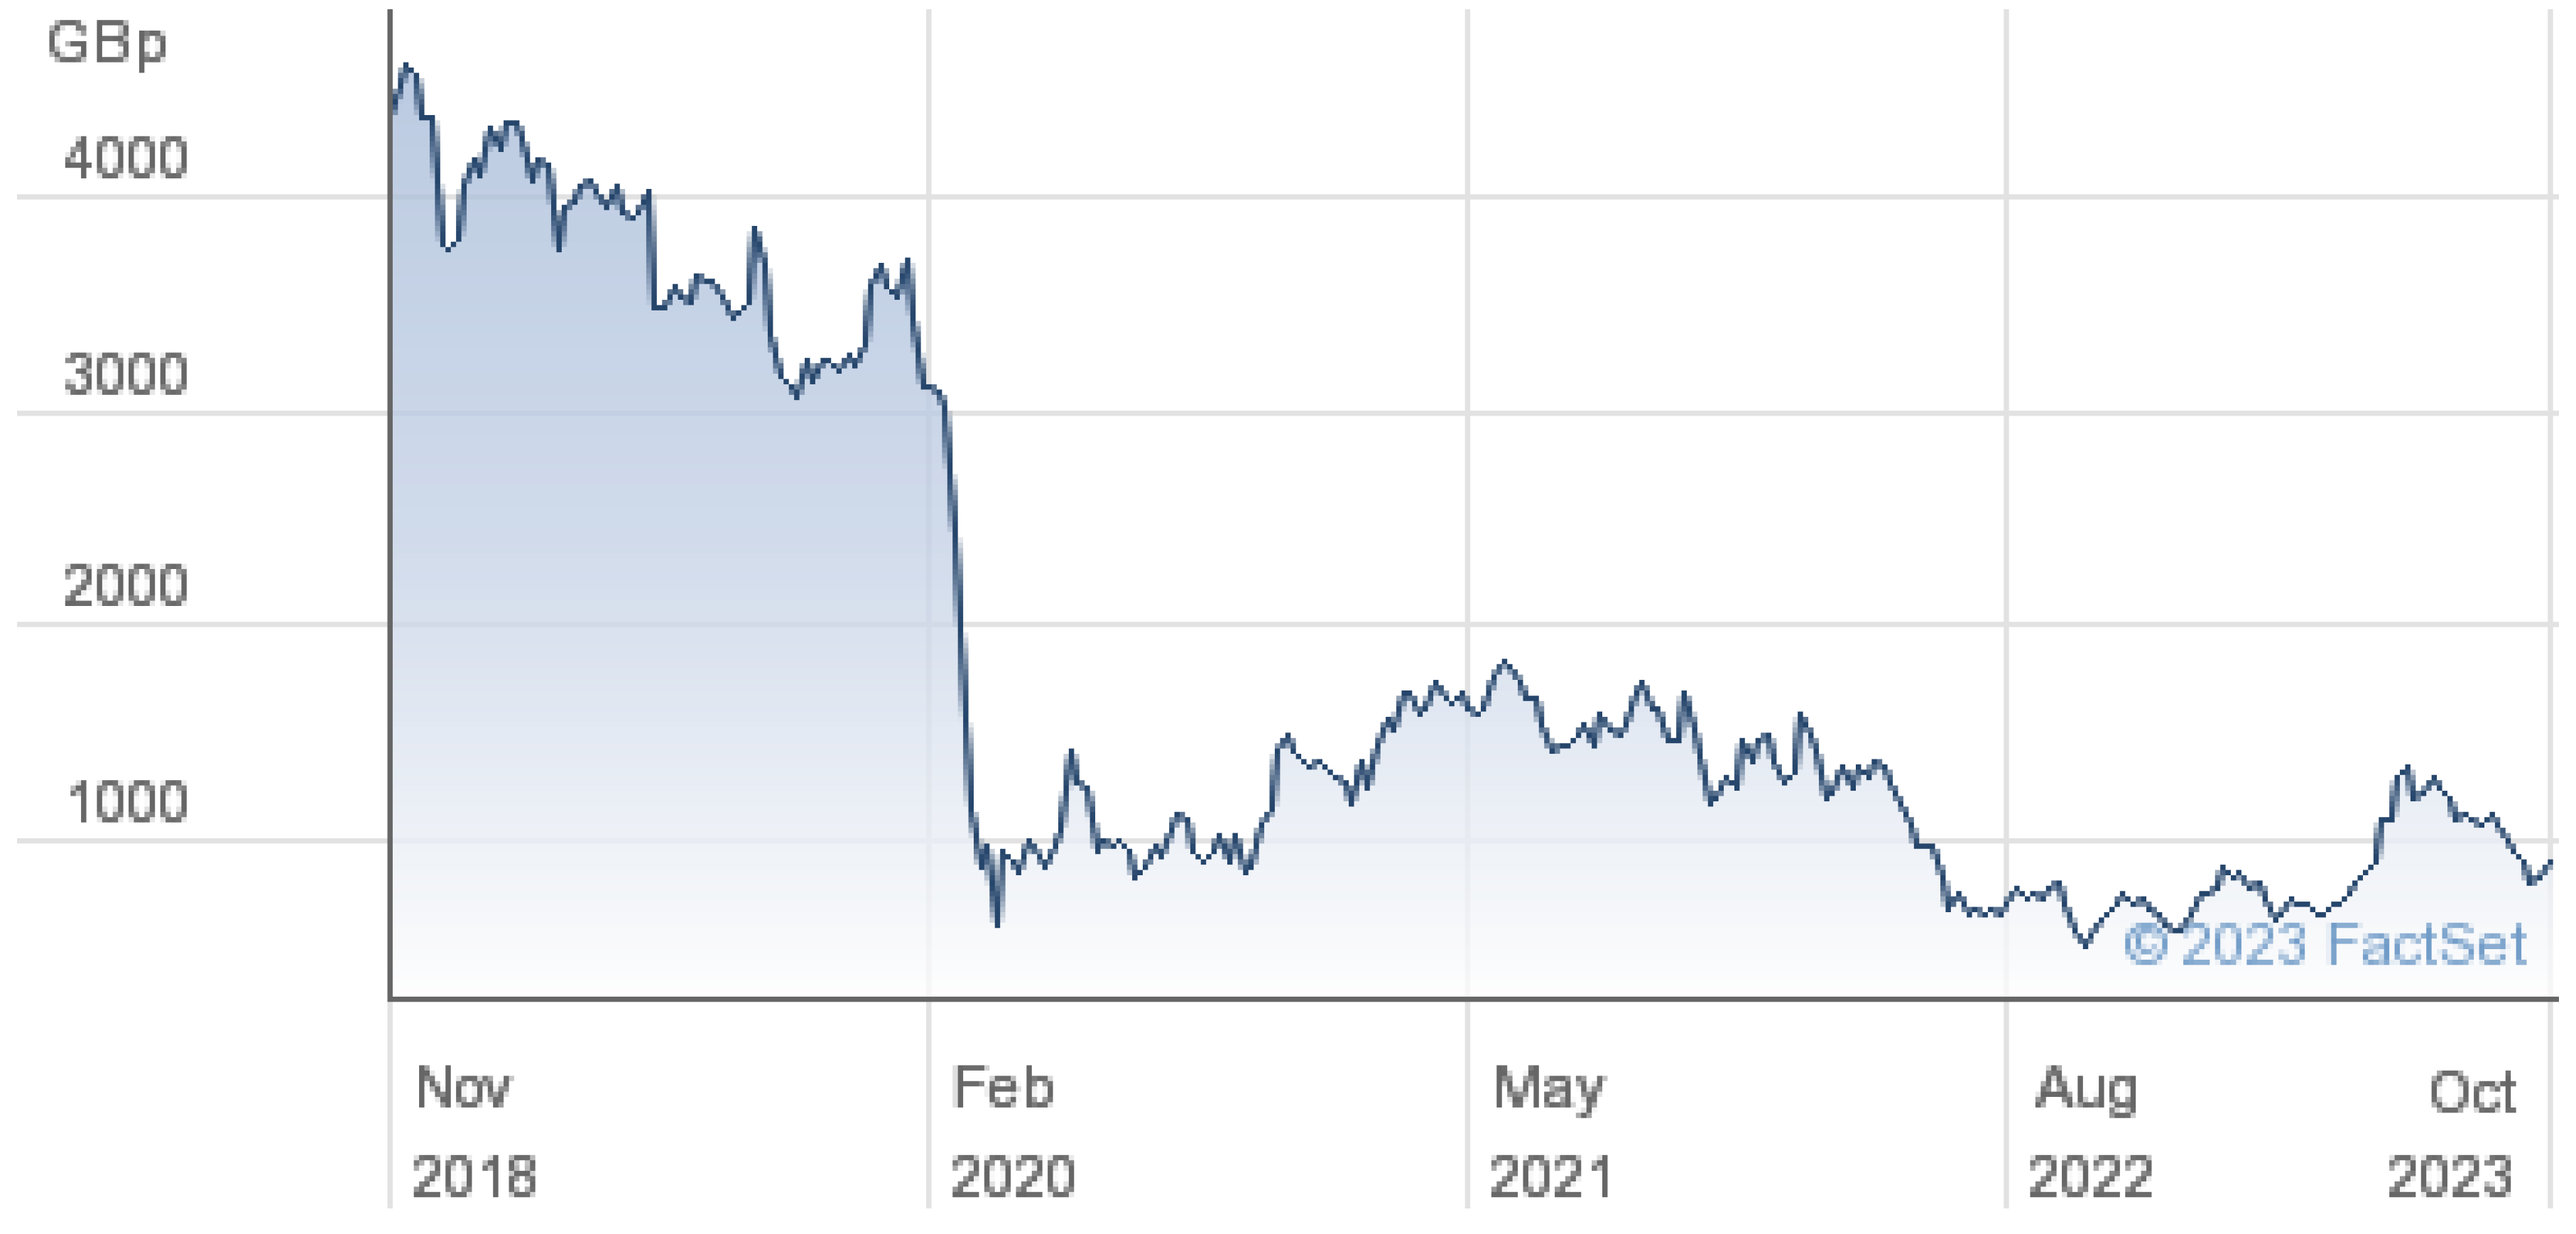
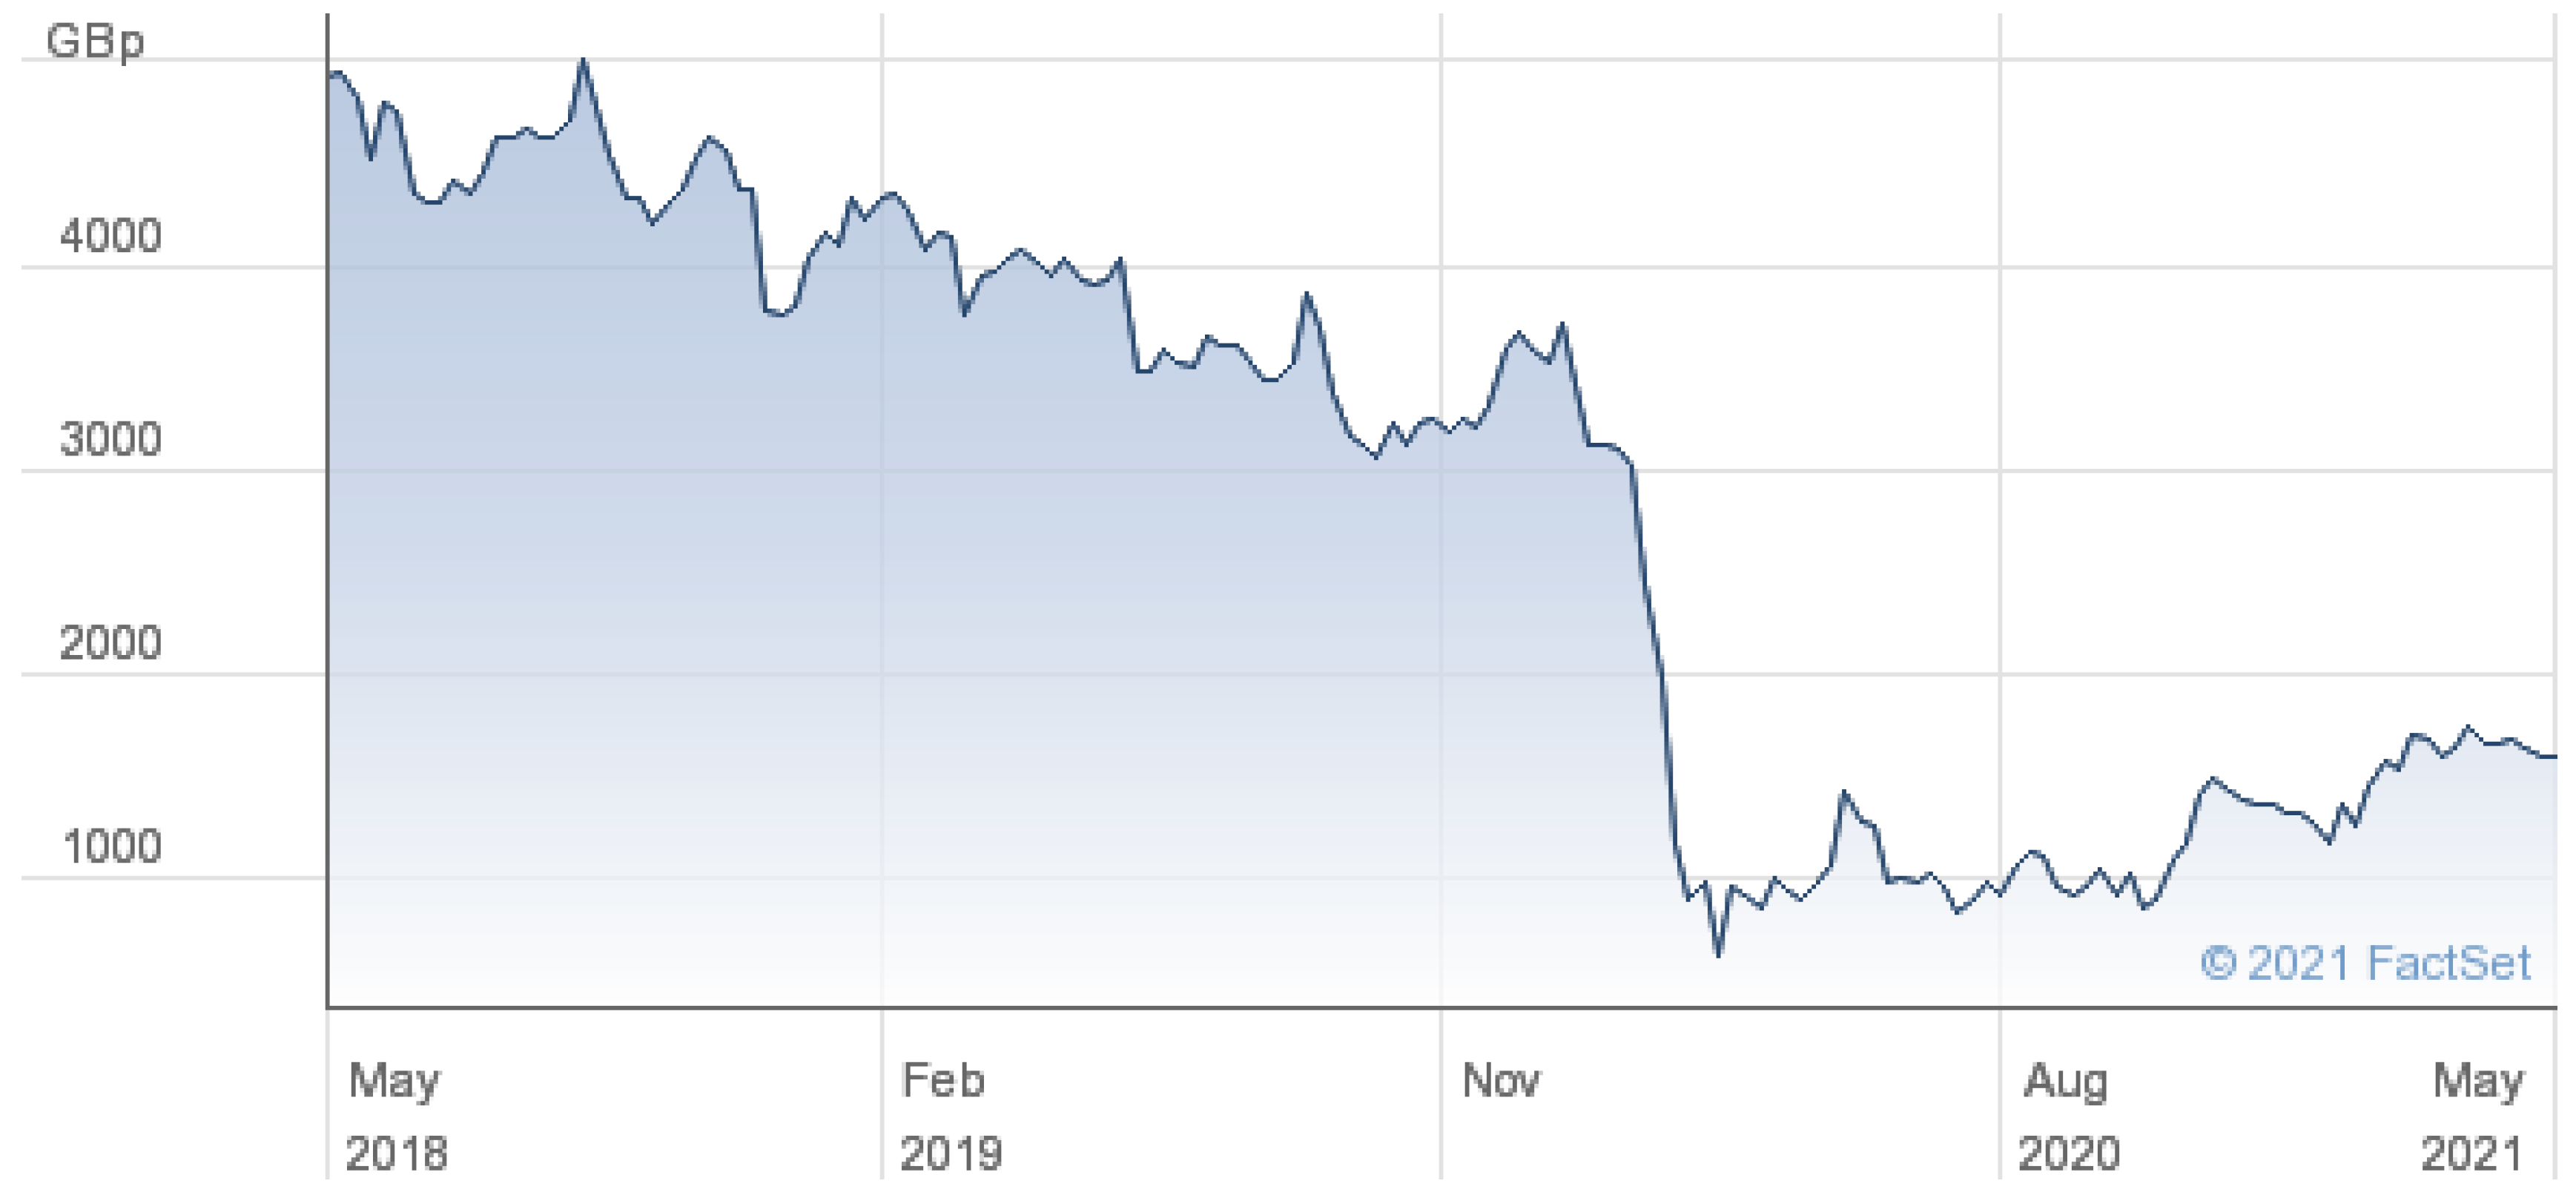
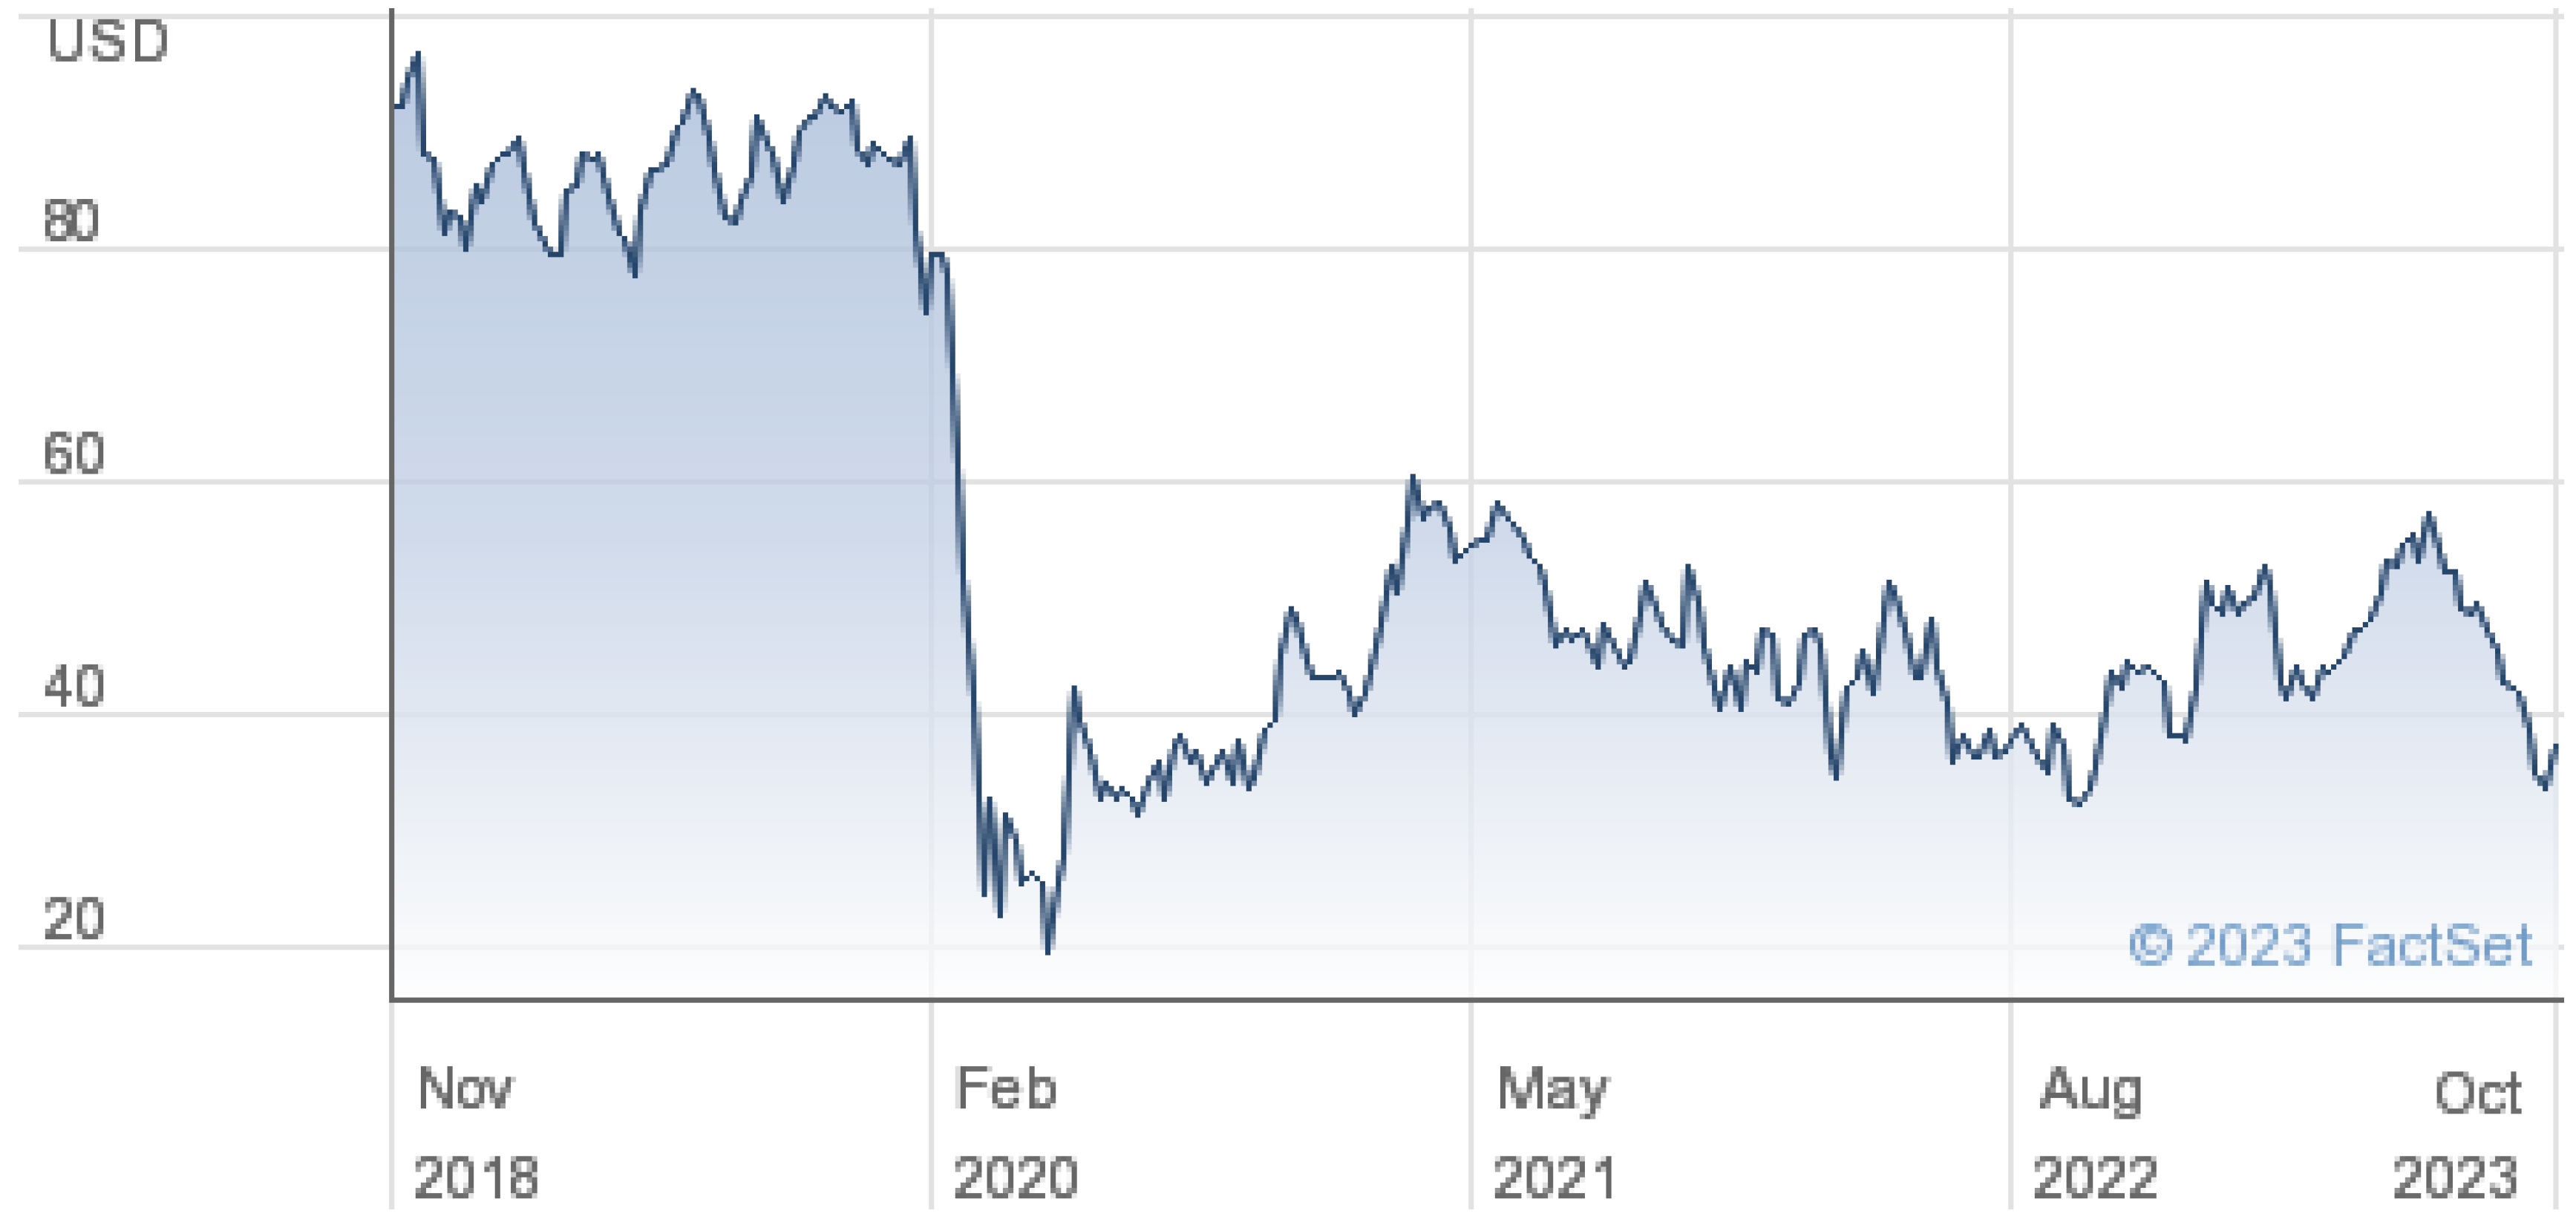
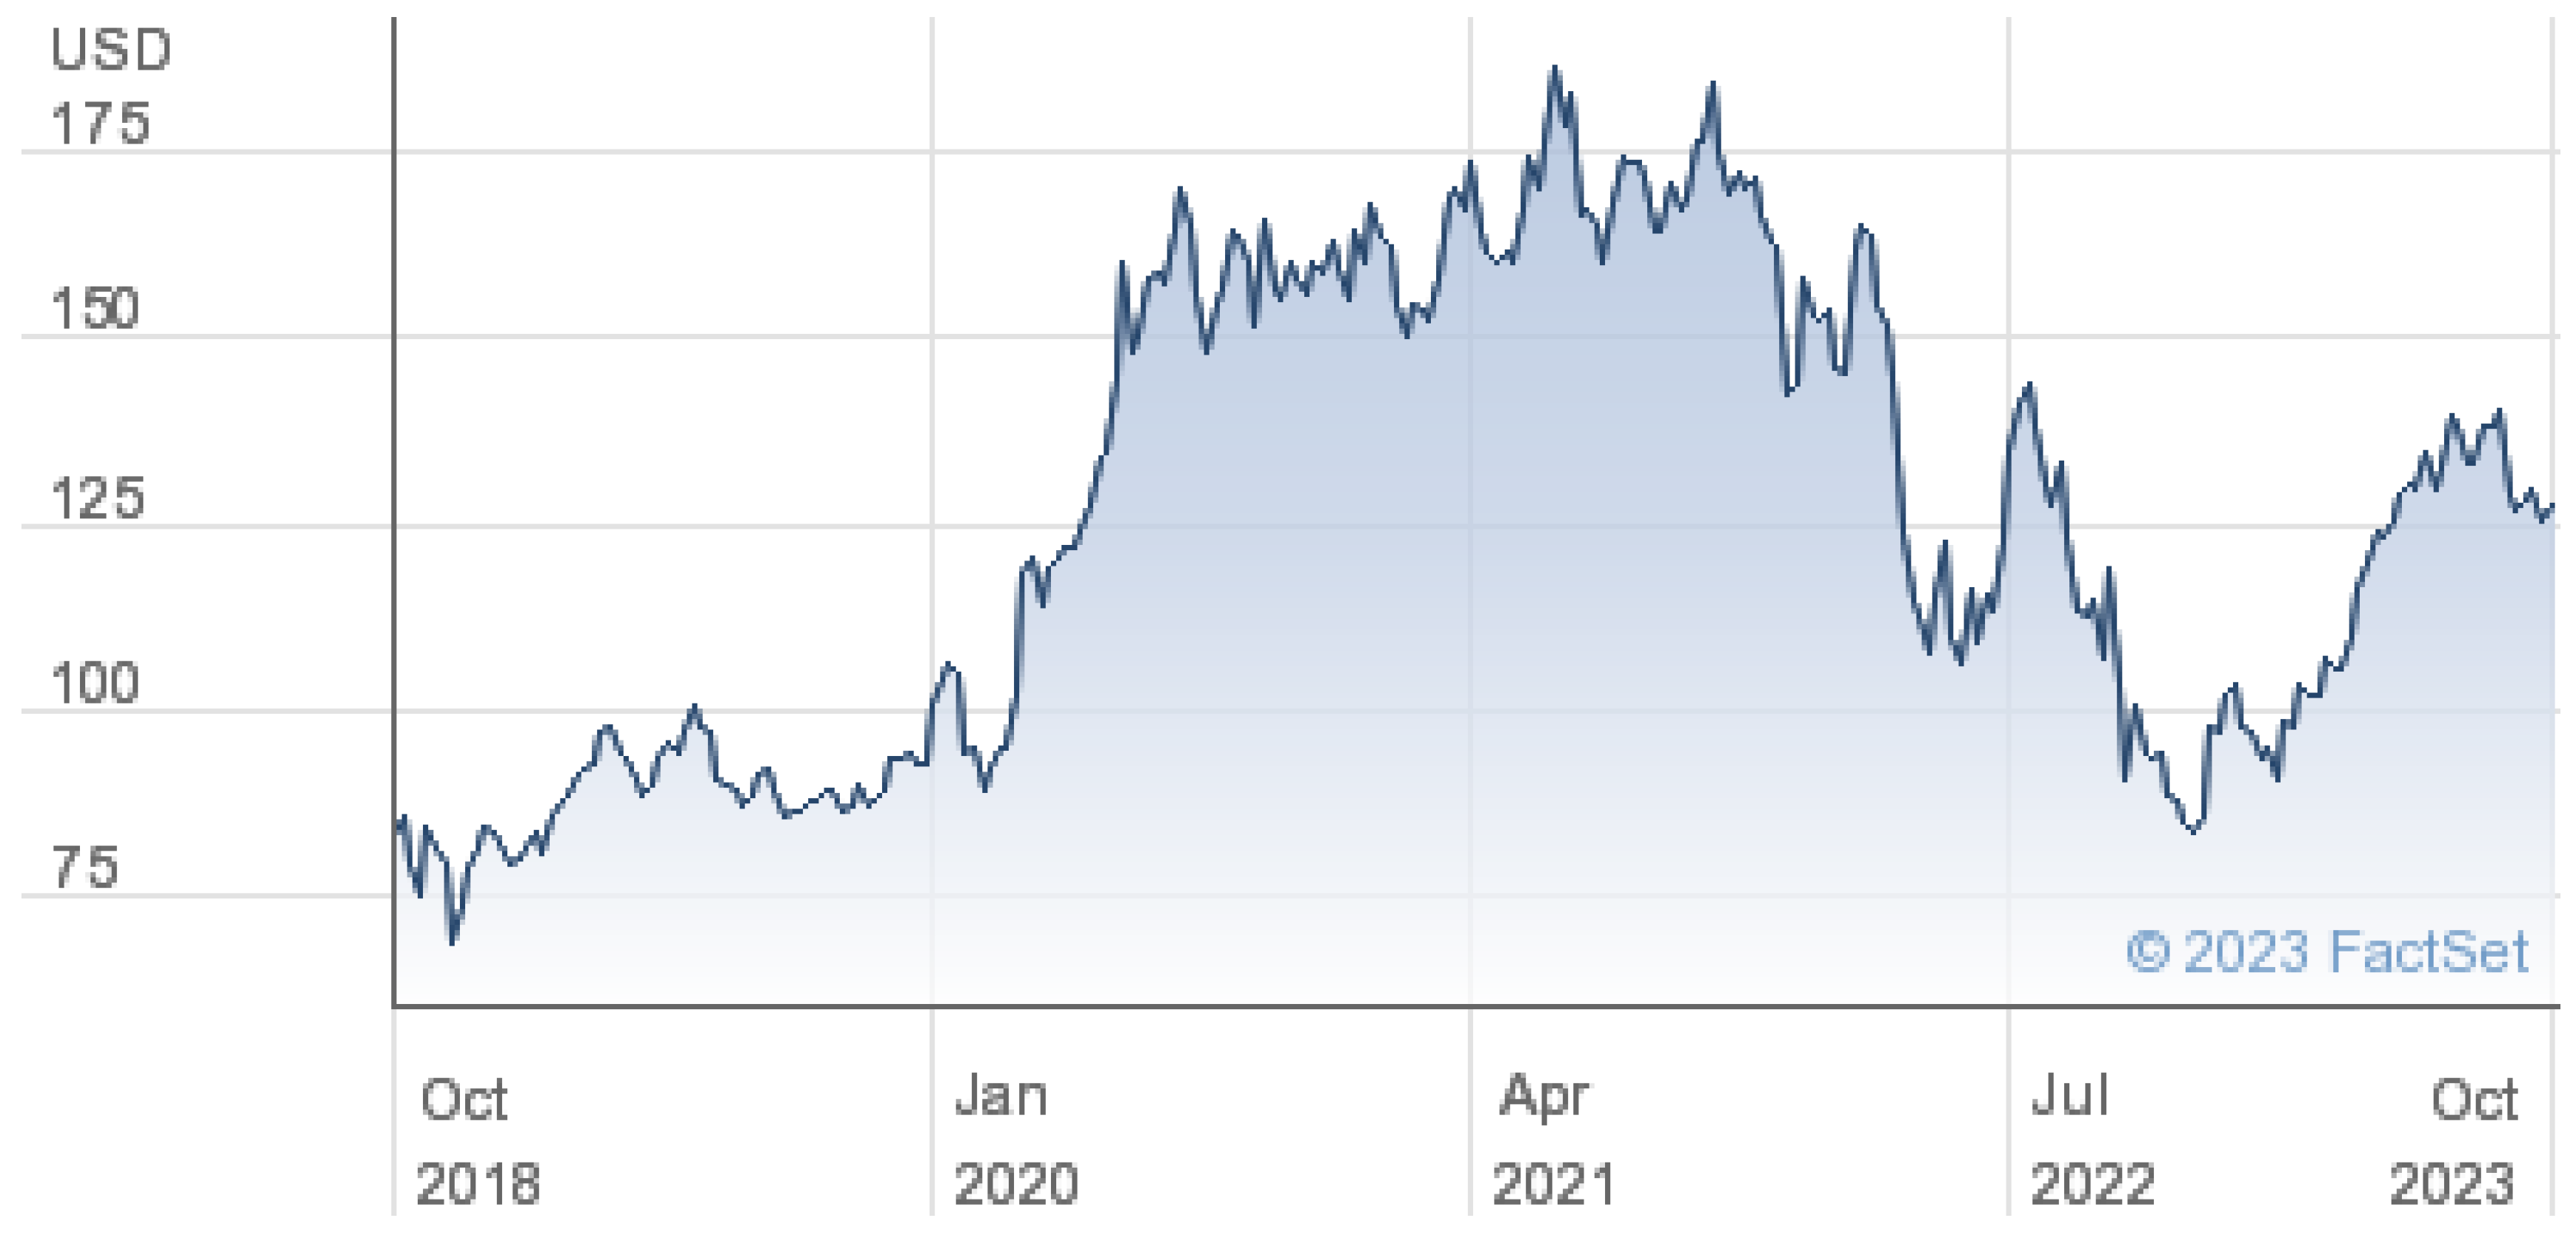
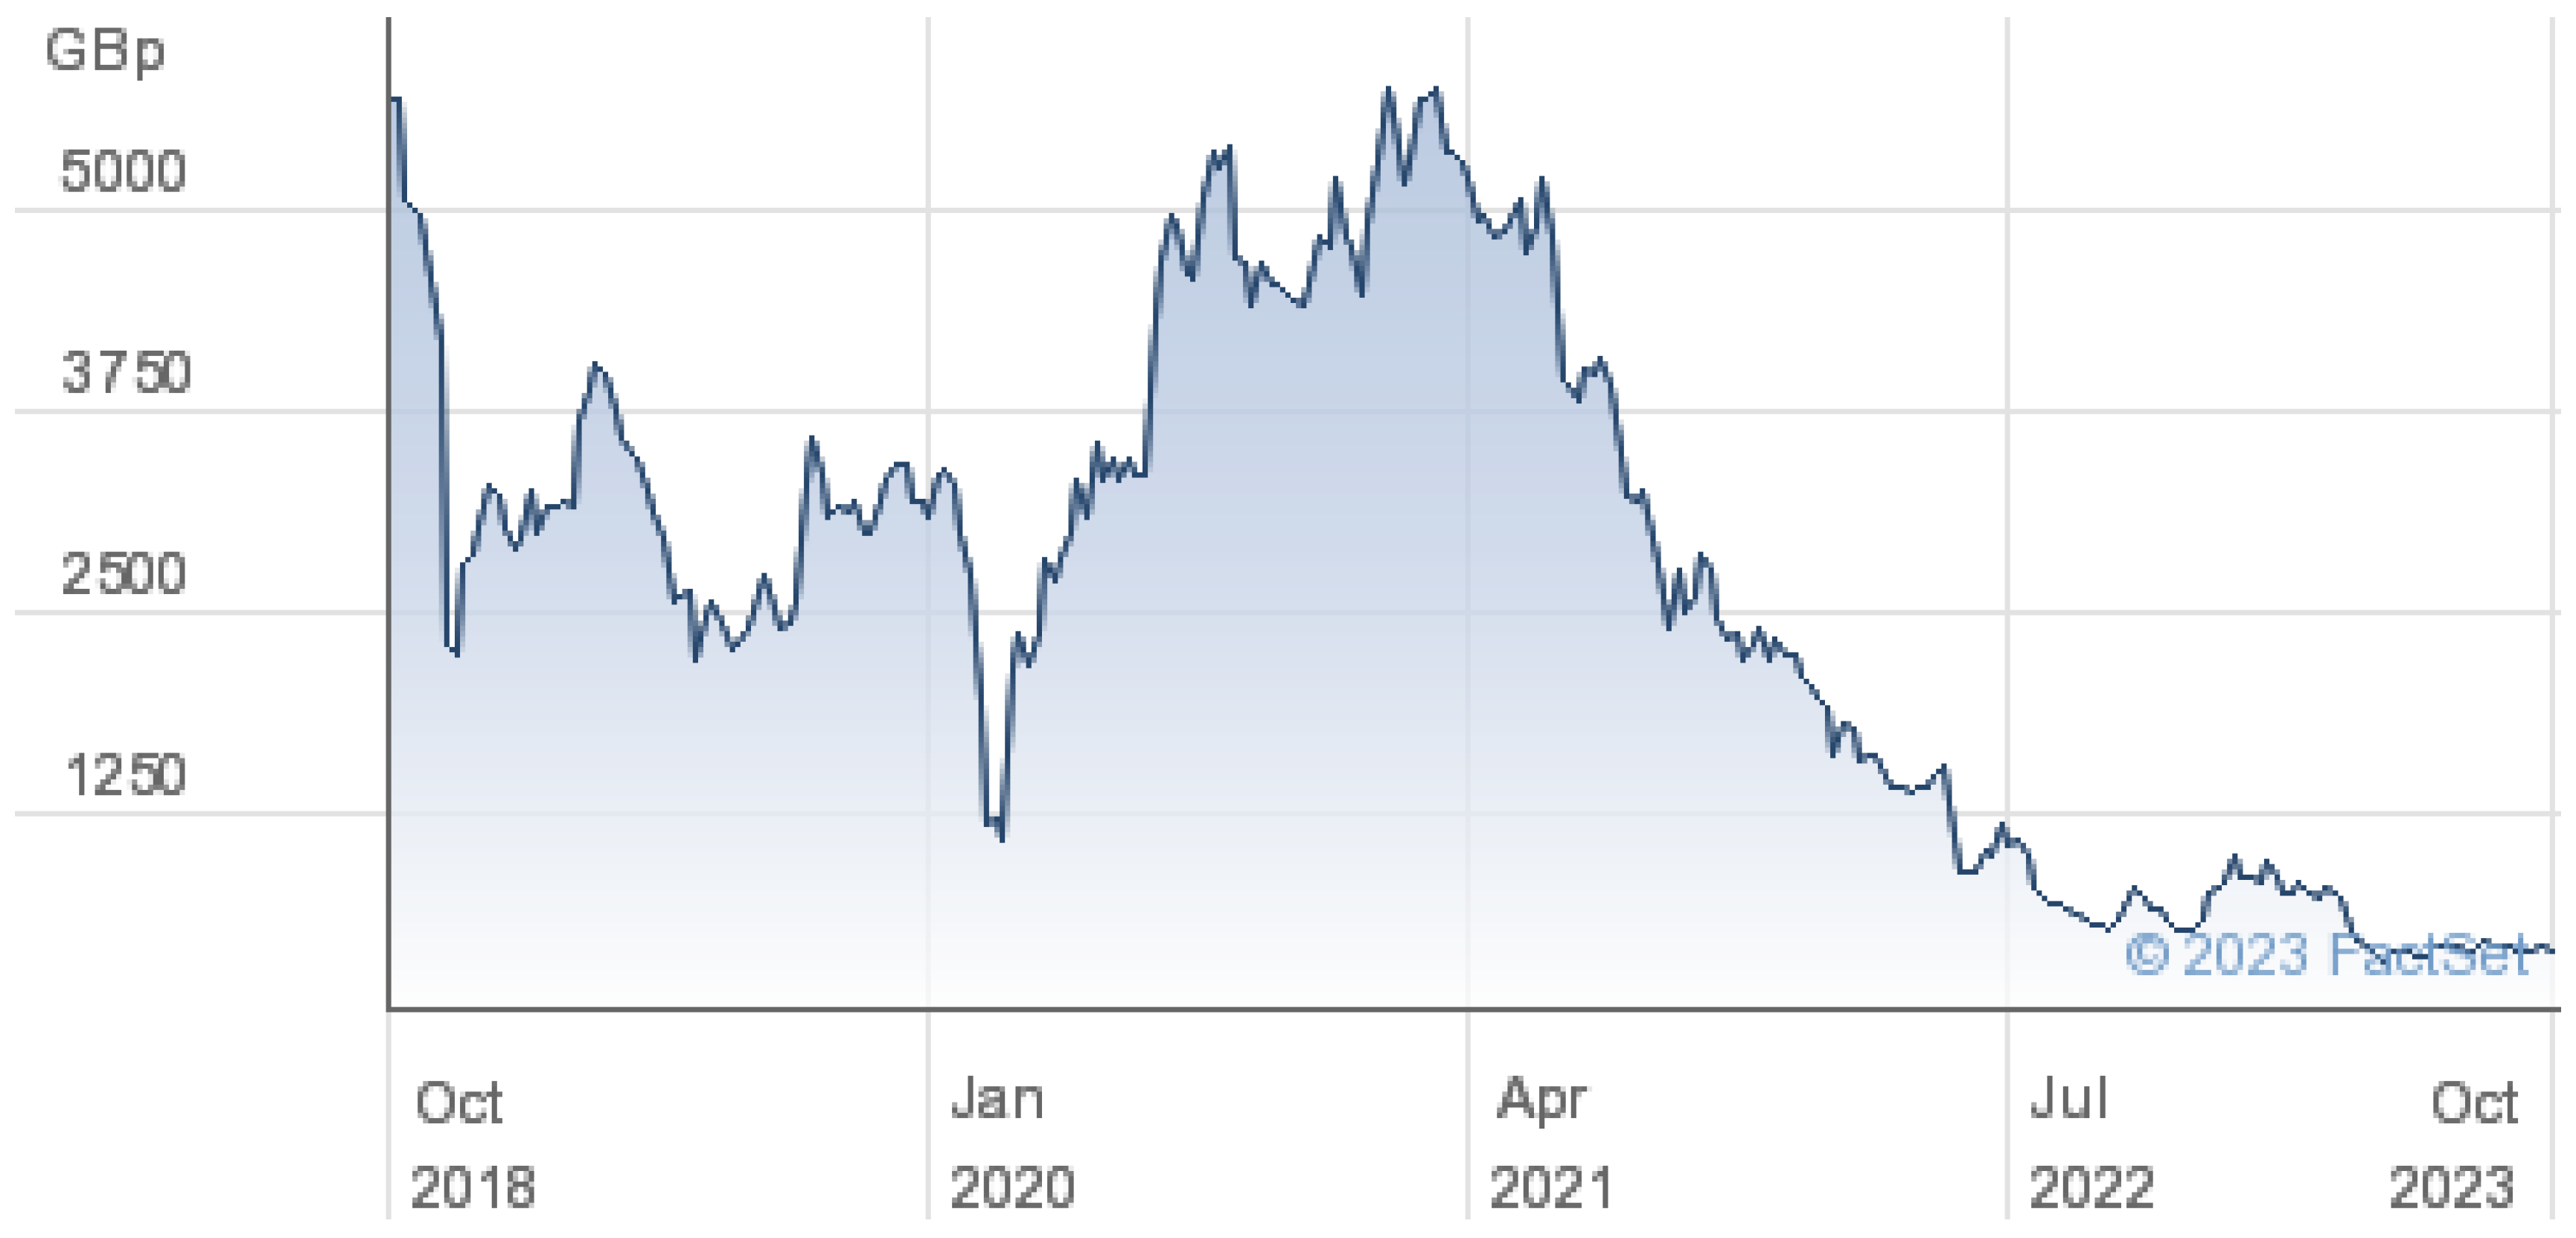
Firms that were directly impacted by pandemic restrictions fared much worse. For example, the cruise firm Carnival (Figure 3) lost about 90 per cent of its stock value in the initial slide. So did Cineworld (Figure 4) and United Airlines (Figure 5). But, like the main indexes, the stock price of these companies recovered part of the fall over the next few months, though, by the end of 2023, Carnival had declined further, and Cineworld was near zero and had filed for bankruptcy in the USA.

Figure 3.
Carvival stock price.

Figure 4.
Cineworld.

Figure 5.
United Airlines stock price.
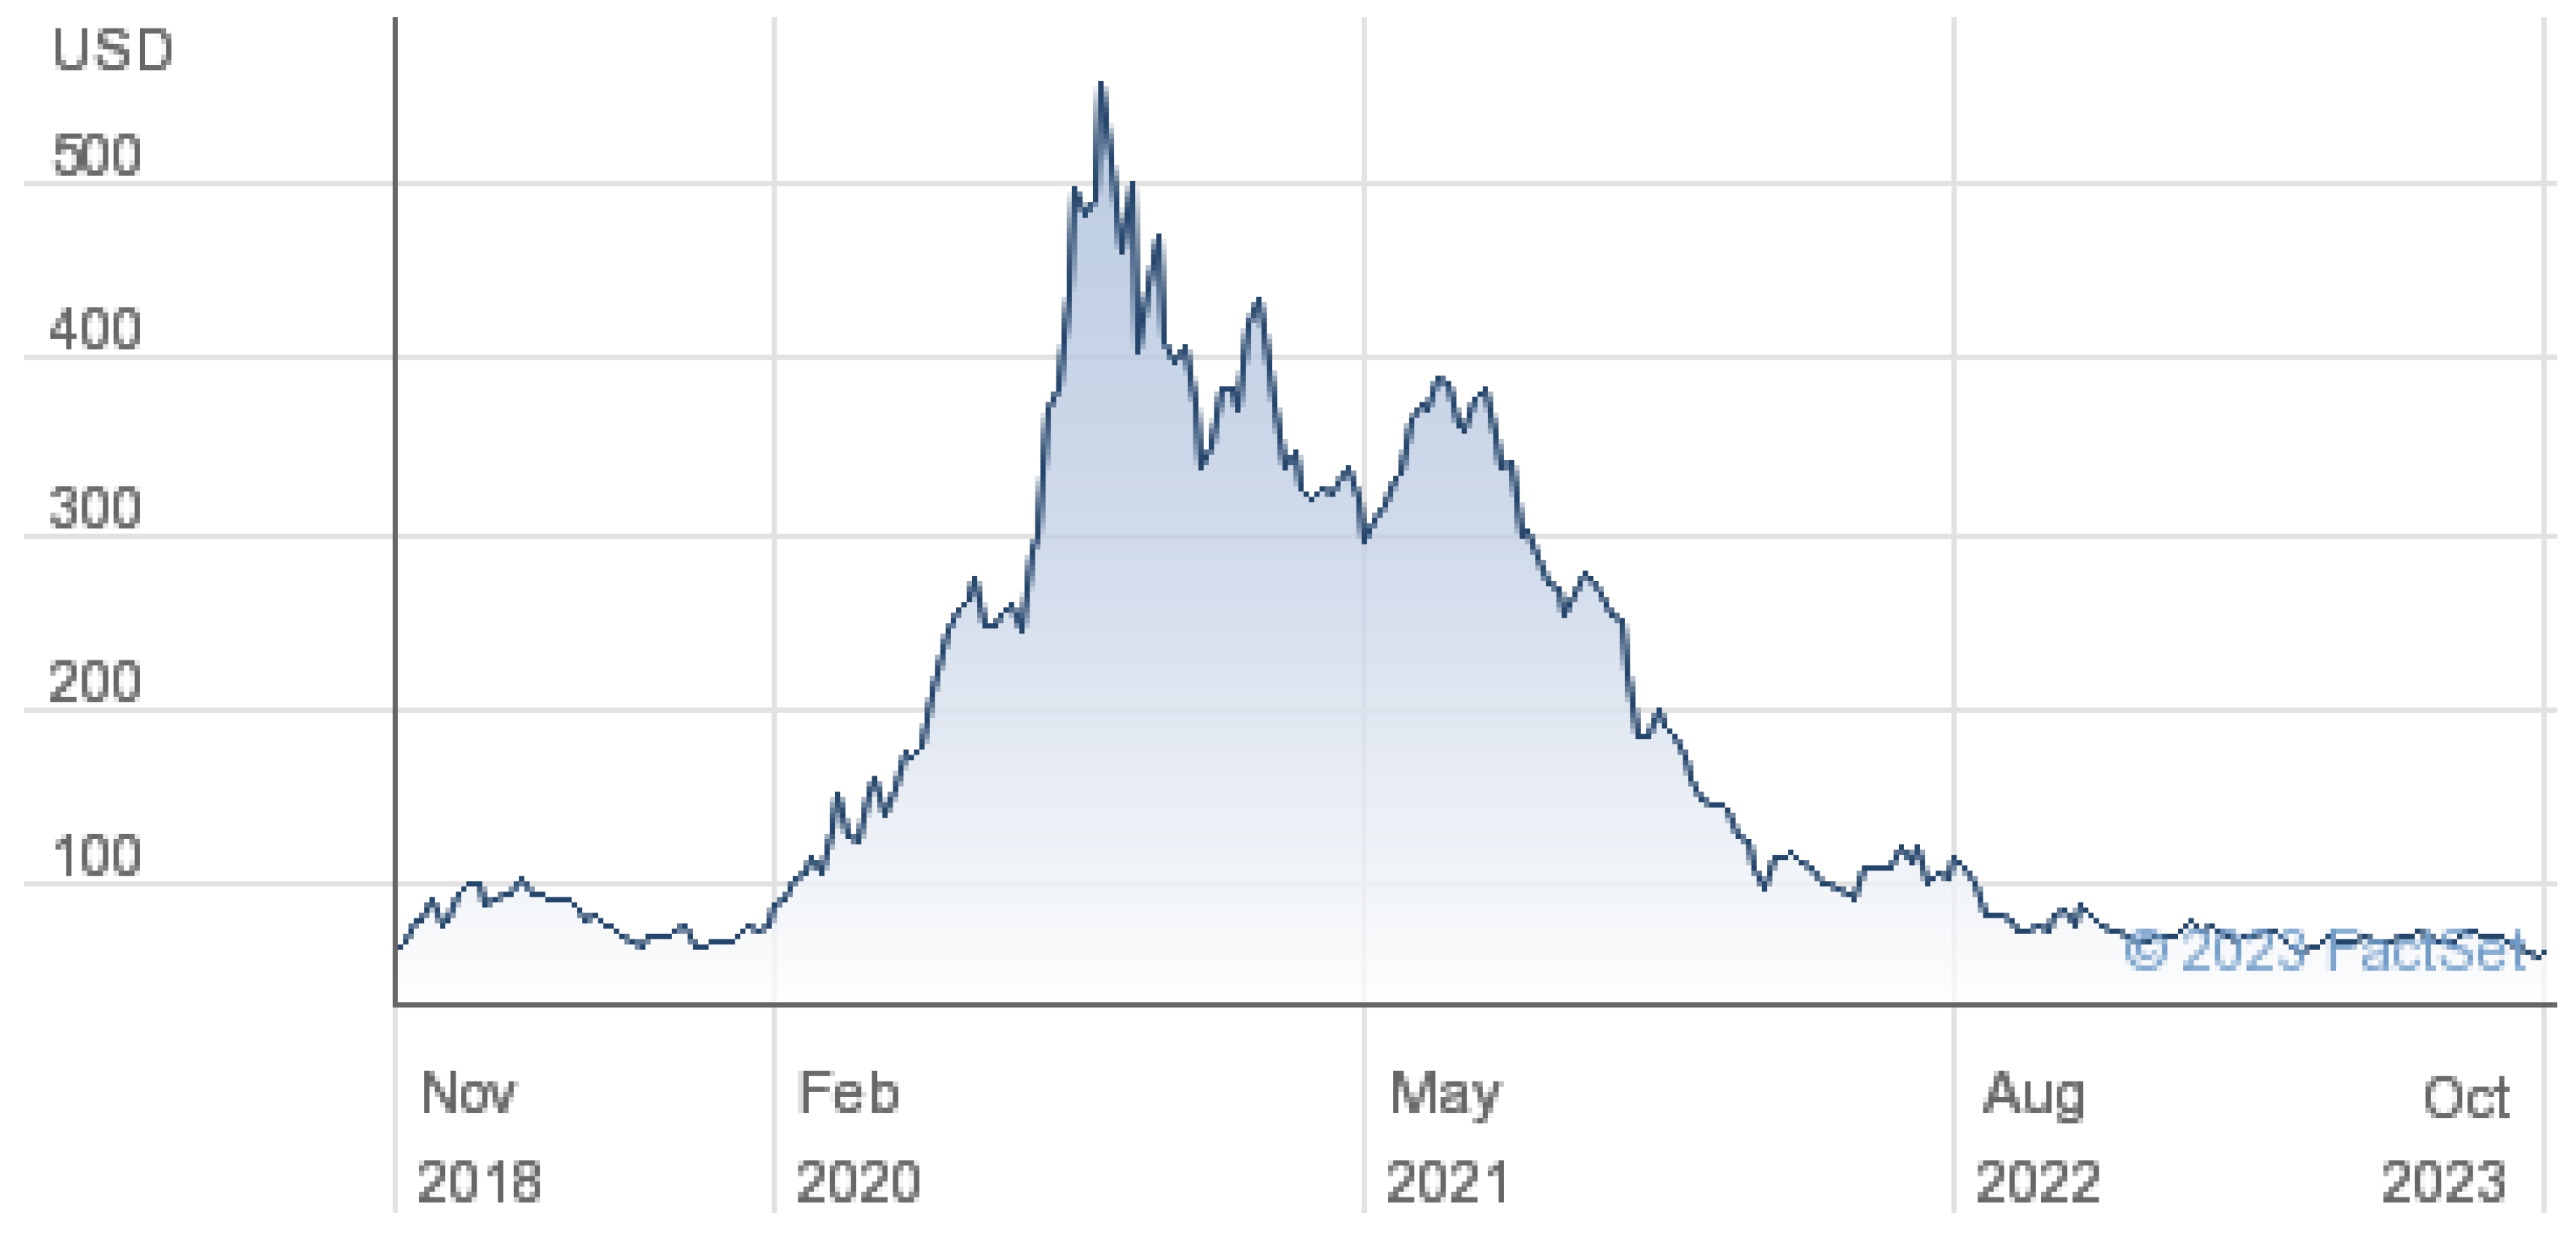
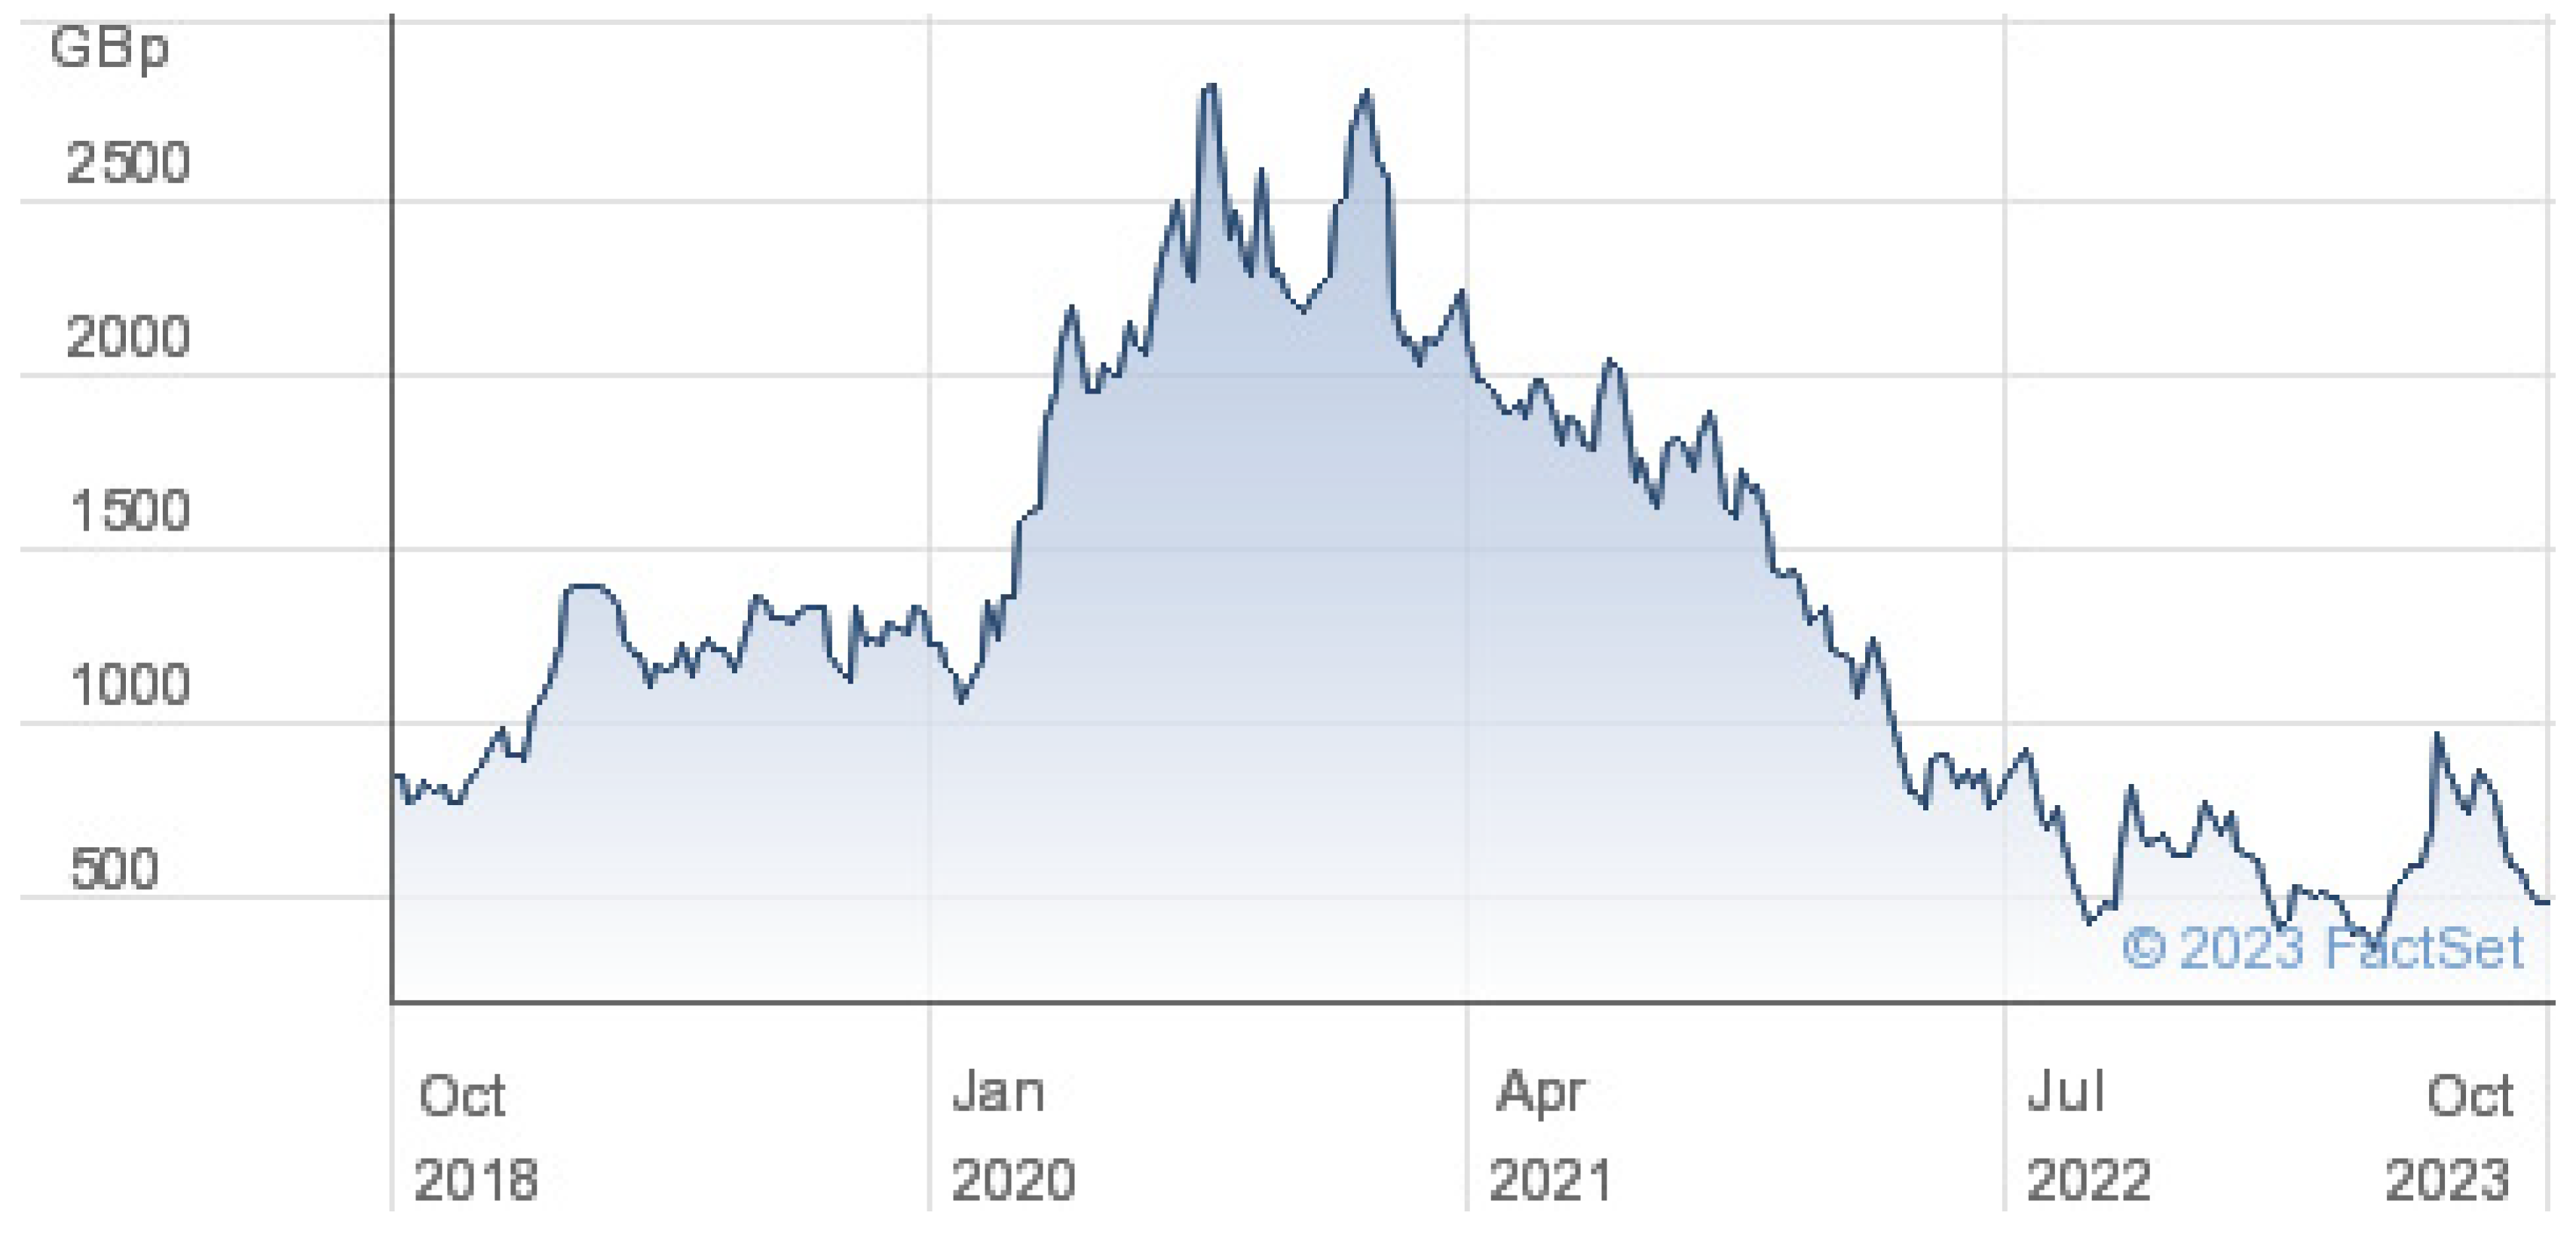
One might expect firms that were advantaged by the pandemic, such as Amazon (Figure 6), Asos (online clothing, Figure 7), Zoom (Figure 8), and Ocado (grocery home delivery and associated technology, Figure 9), would show a reverse pattern, but here, some price movements were peculiar. Initially, Amazon and Ocado dipped a little, and Asos lost two-thirds of its value. It seems that investors had failed to grasp the fact that lockdowns were likely and that online firms would benefit. After a few weeks, the stock price of these firms began to rise and joined other beneficiaries of the lockdown, such as Zoom.
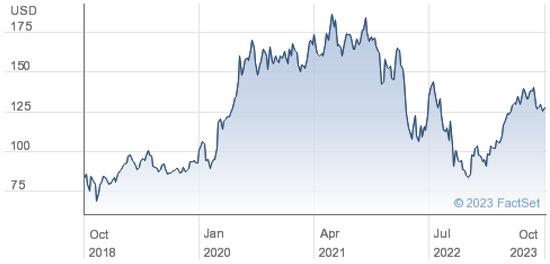
Figure 6.
Amazon stock price.
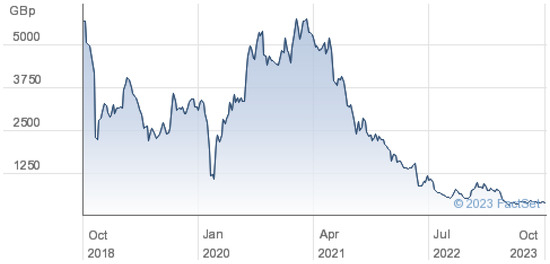
Figure 7.
Asos stock price.

Figure 8.
Zoom stock price.
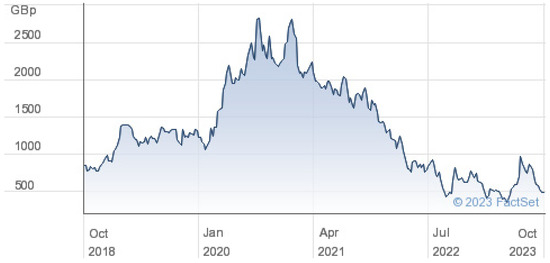
Figure 9.
Ocado stock price.
This rise in the stock price of the winners took much longer than the fall of the whole market. Amazon’s price started rising at the beginning of April 2020 and continued to rise until August, when it plateaued at approximately double the pre-pandemic level but, by the end of 2023, it had lost much of the gain. Similarly, Zoom climbed steadily to a fourfold increase in stock price by October, then fluctuated, and was back to its pre-pandemic level at the end of 2023. Ocado more than doubled in value by the end of September but, by the end of 2023, had fallen well back. Analysts have long recognized that markets usually fall rapidly and rise slowly; they suggest that when owners of stocks have borrowed against the value of their investments (leverage), they may have to sell quickly to resolve their position when the price falls, thus accelerating the decline. However, a rising market allows investors to borrow more and increase their investment, thus accentuating a market rise. Leverage must play some part in price movements, but it seems likely that psychological processes were a major factor in the effects described here. These examples indicate that once the COVID threat was recognized, there was an overreaction, leading to an excessive price fall, and, where a company had an advantage, there was an overreaction to this advantage, leading to an excessive rise.
Reviewing this account, there are four features that require explanation and to which we shall return after a review of the main psychological effects relating to stock price:
- The delay before prices fell;
- The overshoot when stocks fell and when the winners rose;
- The initial failure to recognize the advantages of online firms;
- The slow rise of the winners, compared with the fall of the losers.
3. Disposition and Momentum Effects
The disposition effect is the tendency to sell a stock that has risen in preference to one that has fallen. People are risk-averse with regard to gains and risk-prone to losses. The plot of psychological value (utility, on the y-axis) is curved toward the x-axis for both gain and loss (diminishing marginal utility). Thus, with each unit increase in objective value, the increment in utility diminishes and with each unit increase in objective loss, the increment in disutility diminishes. This diminishing marginal dis/utility means that the chance of later gain from keeping a winner has lower utility than the certain gain from a present sale, which motivates selling. Correspondingly, the chance of later loss from keeping a loser has lower disutility than the certain loss from a present sale, which motivates retention. Additionally, the disposition effect may be supported by a belief that price movements tend to reverse, and Fogel and Berry (2010) found more regret about selling a loser than a winner. Others, such as Shefrin and Statman (1985), have related the disposition effect to loss aversion, but the support for loss aversion now seems to be in doubt2.
The disposition effect is found widely. Shefrin and Statman noted a failure to cut losses by both professional traders and individual investors, and Garvey and Murphy (2010) observed that institutional traders held losers proportionately longer than retail traders3. The disposition effect also appears as an aggregate volume effect following price declines and rises (Lakonishok and Smidt 1986). Though this effect is generally found, Lehenkari and Perttunen (2010) showed that, in a severe bear market, Finnish investors, while still averse to selling losers, were not prone to sell winners. One important effect of the disposition effect is that it tends to stabilize markets because it encourages selling in a rising market and retention of stocks in a falling market.
The disposition effect may lead to a loss. Odean (1998) found that investors lose an average of 3.4 per cent in the following year by selling a winner in preference to a loser since there is a momentum effect with trends tending to continue for a while. Taking advantage of this effect, Jegadeesh and Titman (1993) found that buying stocks that have performed well, and selling stocks that have performed poorly, generated significant positive returns over three- to twelve-month holding periods. Dimson et al. (2017) calculated the effect of a momentum strategy based on the performance of the top 100 UK stocks and found a clear advantage over a period of months4. Though one study by Locke and Mann (2005) showed a neutral outcome from the disposition effect, a review by O’Brien et al. (2010) shows that momentum strategies over a period of 12 months generally yield a premium, with the main benefit arising from counteracting the disposition effect by selling losing stocks. For longer periods, the outcome changes. De Bondt and Thaler (1985) found that investing in stocks that had underperformed brought a return that was 19.6 per cent better than the market average after 36 months, whereas a similar investment in outperforming stocks gave a return of 5 per cent below the market average after 36 months. DeBondt and Thaler ascribed their findings to overreaction to information about stocks, leading to excessively depressed prices in the case of underperforming stocks and overpricing of outperforming stocks. If these prior movements in price were the result of the momentum effect, it seems that this effect carries rising/falling prices to a point above/below their long-run level. Consistent with DeBondt and Thaler’s evidence, Bohl et al. (2016) found that momentum strategies do poorly in highly volatile market recoveries because loser portfolios rebound from a very depressed state. Clearly, timing is key for those seeking to profit from momentum. In this context, it is difficult to identify stocks that are gathering momentum. Chen et al. (2017) found that more than 40 per cent of winners and losers fall out of their respective groups in the month following group formation. However, when one more month of gain/loss was used for classifying the winners/losers, there was much stronger momentum persistence.
DeBondt and Thaler’s evidence indicates that underperforming stocks become more underpriced than outperforming stocks become overpriced; this suggests that negative information has more impact than positive information, an observation supported by Akhtar et al. (2011) and Reyes (2019). When portfolios are constructed from the extremes of a distribution, some part of the subsequent change in portfolio valuation will result from regression to the mean since stocks with extreme valuations are likely to have these valuations, in part because of high random variation, which will return to an average level in a subsequent period. The effect of regression to the mean will be to reduce the gain in a portfolio of winners and increase the gain of a portfolio of losers. This could explain the differential performance of winners and losers in DeBondt and Thaler’s study, but a second effect, negativity bias, may enhance the performance of a portfolio of underperformers.
In explaining negativity bias, we need to recognize that information that is consistent with a receiver’s current evaluation of a stock may increase their certainty about its worth but is unlikely to affect their evaluation. However, information that implies a value that is different from a receiver’s current evaluation will exert an influence on the implied value. Some new information may be disregarded by investors, but if they do not do this, the degree of influence should be a function of the magnitude of the gap between the value implied by the new information and the value previously held by the receiver. Thus, an investor’s subjective stock valuation will be affected more if new information is substantially at odds with his/her prior beliefs about the stock’s value. Most information about entities is positive. For example, there is approximately three times as much positive word of mouth as negative (East et al. 2007), while Peterson and Wilson (1992) report data that indicate a ratio of satisfaction to dissatisfaction of the order of 10:1. This predominantly positive information shapes attitudes and makes the majority of these attitudes correspondingly positive. This means that negative information is more likely to be at odds with current thinking than positive information, so negative information has a greater effect on evaluation. This is the main explanation for negativity bias, but other ways in which negative information could have more effect are discussed by Rozin and Royzman (2001) and Skowronski and Carlston (1989). Here, it is proposed that people are normally positive about their investments because this is partly why they hold them. If this is so, the impact of negative information on a stock will depress the price more than positive information will uplift it, which may leave more scope for a recovery in price by underperformers. This fits De Bondt and Thaler’s (1985) evidence that, over three years, a portfolio of previously underperforming stocks shows more price gain, relative to the index, than a portfolio of previously outperforming stocks.
4. More on the Effect of Information
Contrary to the efficient market hypothesis, there are many cases where there is an initial underreaction to new information. One example is the failure to take account of changes in company satisfaction scores when these are first announced despite evidence that increases in satisfaction herald later increases in stock value (Anderson et al. 2004; Aksoy et al. 2008; Luo et al. 2010). This evidence allows investors to benefit by buying/selling stocks in companies that have gained/lost in customer satisfaction ratings, and investment on this basis has proved profitable (Fornell et al. 2006, 2009). Yang (2021) found a strong relationship between sentiment about the firm and future stock prices, and Kim et al. (2022) found that basing investment on sentiment was advantageous. These cases indicate that, even when measured and reported, there is a delay in the response to information on market sentiment.
Another example of underreaction, described by Edmans (2020), is that, after sensitive company announcements, there is an initial adjustment and then often a slow drift of price in the direction of the prior adjustment; alert investors can gain an advantage from anticipating this drift. Edmans offers two explanations for the drift. The first is that the diffusion of information is impeded by other information because the drift is slower when an announcement competes with many other announcements or when it is made on a Friday, and the distractions of the weekend affect the response. Edmans’ second explanation attributes investor underreaction to confirmation bias. More generally, it seems that information diffuses slowly through social contacts and media comments so that the influence on stock price is delayed. This is a person’s tendency to accept information consistent with their beliefs and resist information that is inconsistent (Wason 1960). This produces a bias in favour of the status quo and a reluctance to endorse evidence that is inconsistent with it. However, confirmation bias, though clearly observable, does not appear to confer any adaptive advantage and therefore requires explanation.
5. The Availability Effect
Over time, the momentum effect can produce an overpricing of winners and an underpricing of losers, and this requires explanation. In 1982, Tversky and Kahneman introduced the availability heuristic: information that is easily retrieved from memory (more available) is assigned greater probability and given more emphasis in judgments (Tversky and Kahneman 1982). The ease of retrieval rests on the frequency of experience and other factors that make information more salient, such as relating to hopes and fears, being learned through experience, rather than from reports, and when it concerns events rather than states. Well-justified information is likely to be more frequently experienced, which would provide an associative basis for the availability effect. Confirmation bias is probably based on the more frequent statement of accepted ideas, which builds belief in these ideas through availability. One of the consequences of the availability mechanism is a greater emphasis on current information, which is more available than recollections of the past and predictions of the future; this greater weight placed on current information creates status quo bias. Thus, availability helps to explain both confirmation bias and status quo bias.
Availability may underlie the momentum effect. When there is a shock of positive information about a firm, this more available information will tend to support stock price increases, and these increases then add to the current positive information with media comments and word of mouth, amplifying interest in the stock and producing further upward pressure on price. This positive feedback may be why the momentum effect seems to be overrun. A corresponding effect of negative information may lead to an overreaction against a stock, depressing its price. De Bondt (2020) has reviewed explanations for overreaction and suggests a number of processes that may work together.
We should qualify what is meant by information here. Momentum effects seem to occur when there is some evidence relating to profit but uncertainty about the impact. For example, when the Deepwater Horizon disaster first occurred, it was clear that crude oil was seeping into the Gulf, but the eventual cost was quite uncertain. Similarly, the potential of Tesla is uncertain, and it seems likely that momentum has led to an overpricing of this stock (see Box 1). In this context, we should note that investors do not usually search for information systematically; Loibl and Hira (2009) found that 78 per cent of US investors practiced low to moderate information search.
Factors that persistently bias prices are not likely to produce momentum effects on their own. These effects are more likely to be started by novel information that has an unclear but potentially large impact on the profits of a firm. Examples could be when new mineral deposits are discovered by a mining company or when there is evidence that an innovation (such as AI) is highly effective. Such information may be acquired from comments in newspapers and television, through Google searches, from websites such as Reddit, and through interpersonal contacts. Essentially, this sort of information raises the prospect of gain or loss but is not definitive. It focuses attention on a firm, raising speculation about its prospects and, as a result, increases the number of buyers/sellers. We can see this in the case of Tesla, where the advances in battery design and the prospect of near-autonomous vehicle guidance draw attention (see Box 1). Those who bought Tesla early had done well by November 2021 when the box was drafted, but it looks as though their gain was partly based on psychological processes rather than fundamental value. At the beginning of 2024, Tesla was well below its peak price.
Box 1. Is Tesla Overpriced? (written Nov. 2021).
At the end of November 2021, the stock price of Tesla was 22 times that which applied two years previously, giving Tesla a value 8 times that of Volkswagen and over 3 times that of Toyota. Tesla’s production of cars was approaching 1 million a year in 2021 but Volkswagen and Toyota were each producing 10 million. If Tesla continues to expand at 40 per cent per year, it will reach the 2021 output of Volkswagen/Toyota in 7 years, but competition from these and other automotive firms in the electric vehicle market is building up, and this is likely to affect Tesla’s sales and margins. In these circumstances, the authors suggested that the high valuation of Tesla in 2021 seemed unjustified.
It seems likely that one type of information promoting momentum is a recent change in stock price. Support for this view comes from evidence in the cryptocurrency market, where momentum effects are common (Borgards and Czudaj 2020). It seems likely that, here, price movements beget further price movements because there is little else to indicate value (Gurdgiev and O’Loughlin 2020).
Uncertainty about stock value is indicated by volatility in the stock price, but other more direct measures of uncertainty could be useful predictors of momentum proneness. One such measure is the number of Google searches. Preis et al. (2013) found that increases/decreases in the Dow Jones Industrial Average were preceded by a decrease/increase in search volume for certain financially related terms. However, Challet and Ayed (2013) argued that biases were present in this work and found no effect in a modified research design, and Ciocca and Gutsche (2017) did not find that strategies based on search were helpful. One problem here is that people may search when they are considering either investment, divestment, or short selling, and the reason for the search may not be known. This may be behind the mixed results from other studies. Bijl et al. (2016) found that Google searches indicated marginally negative returns, in contrast to Da et al. (2011) and Joseph et al. (2011), who found positive returns in the two weeks following the search, with reverse effects for longer periods.
6. Explaining COVID-19 Price Movements
We now return to the odd stock price effects noted earlier during the COVID-19 pandemic and relate these to psychological explanations.
6.1. The Delay before Prices Fell
One possible explanation here is a herd effect based on conformity. In uncertain situations, people pick up signals from others on what they should do and, when other people are doing nothing, that is what they copy. A second explanation is a failure of perception. Before widespread infection had developed and a lockdown was necessary, investors might have found it difficult to grasp the likelihood of these potential changes. This is the negative side of the availability effect: what has not yet happened is harder to bring to mind and, consequently, has a reduced impact. A further constraint on action may have been a reluctance to realize a loss, which, as reviewed earlier, has several explanations.
6.2. The Overshoot When Stock Prices Fell and Rose
Once the fall had started, reality was thrust upon investors, and the same mechanisms now impelled the rapid decline of stock prices. The decline was an event and was thus more available. The sell-off showed that others felt that prices were unsustainable, so that any herd effect now favoured selling. To check such a decline, the conventional view is that investors need evidence that stocks have lost more value than could be justified by an assessment of fundamentals, but such evidence may be difficult to source in a bear market and, even if available, may be crowded out by other (negative) information. The overshoot of the market seems to fit the pattern of the momentum effect. As stocks fall, the diet of stock price information is predominantly negative, which leads to more selling, a further price drop, and, thus, more negative information. The availability of this information strengthens its influence, and the dramatic quality of a stock market crash raises discussion, leading to the diffusion of views through social networks and media. Although it is market lore that bear and bull markets overshoot, there seems to be a dearth of studies that quantify the overshoot. One might expect the extent of overshoot to be a function of the rapidity of the price change, because corrective information would have less time to act under such circumstances, but, though there is extensive research on stock market overreaction, this point does not appear to have been investigated.
Some of the firms that benefited from the lockdown, such as Amazon, Ocado, and Zoom, showed a positive overshoot—they gained, and later, their stock price fell back. We can see that availability might have powered this because the heavier use of these firms made them more salient during lockdown.
6.3. The Initial Failure to Recognize the Advantage of Online Firms
When we consider the high level of understanding that we have achieved in many fields, it is tempting to credit human beings with great insight and to be perplexed by their failure to see the likelihood of a lockdown and the consequential advantage to online firms. However, insight seems to be a fairly scarce phenomenon (East and Ang 2020). When we look carefully at the way in which innovative advances have occurred, these are usually achieved by piecemeal changes and often rest on serendipity or trial and error rather than insight (Ridley 2020).
6.4. The Slow Rise of the Winners
We may like to think of ourselves as purposive forward-looking agents, but the reality seems to be that our judgments rest more on currently available information than on past experience and predictions of the future. This status quo bias may restrain the rise of the winners. The slow rise is also explained by Helsen’s (1964) adaptation-level theory. In this theory, people use their experience to develop price expectations, which are adaptation levels. When a new experience is different from the adaptation level, the level will shift towards the new experience. This means that, in a market that is moving in one direction, the adaptation level operates as a drag on change. This does not explain why the fall of the losers was faster than the rise of the winners. Leverage differences may be part of the explanation here, but regression effect and negativity bias are also likely contributors.
7. The Flow of Information
This analysis indicates that one key to predicting momentum effects is the flow of inexact information. Research on the diffusion of innovation through social networks relates to this. There is general agreement that diffusion starts when an external force, such as advertising or news reports, acts on individuals in a social network. This causes adoption/acceptance by early adopters, who then influence others in their network through word of mouth and example. Adoption tends to follow an S-shape distribution: it accelerates, reaches a maximum rate, and then decelerates. This has been represented mathematically by Bass (1969) with parameters for the external force, for the influence of other individuals in the social network, and for the final number of adopters. However, we do not know much about the way in which investment-related information is exchanged between investors and between media and investors. This deficit in our understanding might be corrected by surveys of investor thinking and experience when purchasing stocks.
8. Potential New Predictors of Stock Price Change
This review indicates that momentum effects are an important feature of psychologically based stock price changes. The characteristics of some firms and their investors may make them more prone to momentum effects when there is shock information, and we suggest that publicity about firms and their number of stockholders in relation to their capitalization is a potential predictor of momentum effect proneness. A second potential predictor is evidence that momentum has begun, and here, we think that signs that the stockholder base is enlarging could be predictive.
8.1. Publicity
In the consumer field, much of the diffusion of new information occurs through word of mouth or Internet comments. The great majority of positive comments on brands is made by current or past users (East et al. 2011). In consequence, the volume of positive word of mouth about a brand is closely correlated with its market share in the category (Uncles et al. 2010). Signs that positive word of mouth is running above market share will predict growth. East et al. (2011) found that most negative word of mouth came from past owners. This means that new entrants to a market enjoy a honeymoon period during which the dearth of past owners reduces the level of negative comments. These patterns are likely to be reflected in comments on stocks; that is, we would expect most positive references to a stock to come from those who own or have owned, that stock; that negative comments would come more often from past owners; and that stock offerings in new firms may, for a while, be less critically reviewed because of a lack of past owners. But firms are not like consumer brands. The brands in a category often differ little; in contrast, firms are diverse and correspond more with categories in this respect. Two categories with much the same sales volume can differ substantially in the amount of comment they attract, and, similarly, firms with the same capitalization can have quite different levels of publicity, making them more, or less, available. We expect a given amount of publicity in a small firm to have more of an effect on stock price than in a big firm because there is less stock to buy. This is one potential predictor of momentum proneness.
The impact of any publicity will relate to its relevance to stock purchase/selling, and AI analysis should be able to weigh the different sources of publicity. Word-of-mouth surveys on brands (covering both positive and negative comments) are conducted by the Keller Fay Agency, now part of Engagement Labs; their method is described by Keller and Fay (2006). Customer satisfaction surveys are conducted in many countries following the model of the American Consumer Satisfaction Index developed by Fornell et al. (1996). In the case of investments, debate on stocks may relate more to media comments in newspapers, Google searches, and specialist forums on the Internet. If this is the case, text mining should provide some indication of interest. Valle-Cruz et al. (2021) have reported on the association between Twitter comments and stock performance. Searches on Google and Google Trends may also be relevant, but the evidence reviewed previously suggests that there is a limited association with stock purchase, perhaps because a search does not indicate whether the interest relates to investment and, if it does, whether to buying or selling.
8.2. Stockholding
A second and related potential predictor is the penetration of stock holding in relation to capitalization: stockholders create publicity, which will have a sharper effect on the stock price when there is less stock. A number of factors could affect the ratio of investors to capitalization. Long-established firms are likely to be better known and have more investors. Firms with products that attract attention may similarly gain investors. Firms that sell products to individual consumers rather than to other firms and those that use more advertising will also widen the pool of people familiar with the firm (Fehle et al. 2005; Mathur and Mathur 1995). Demand for the firm’s stock may also be increased if it provides products, such as luxury cars or cruises, that are bought by those who tend to buy stocks. Aspara and Tikkanen (2008) showed that those who bought a company’s products were more likely to invest in that company, and Barber et al. (2003) showed that the prestige of companies raised investment in them; these effects could raise the number of investors for a given capitalization and make the firm more susceptible to momentum effects when there is a shock of new information5.
8.3. New Investors
In consumer research, most non-seasonal brands usually have fairly stable sales levels. When a brand does grow or decline, this is mainly reflected by a change in the proportion of consumers buying it (the penetration) rather than by a change in the average purchase frequency of buyers (Ehrenberg et al. 2004; Sharp 2010; Romaniuk and Sharp 2016) (often, penetrations for consumer brands are in single figures, which leaves substantial headroom for an increase). Applying this thinking to stocks, we should measure changes in the penetration of stock ownership since evidence of exceptional interest in a stock is likely to be indicated by a change in its number of investors. Except when rights issues are made, the supply of stock is normally fixed since most trades are covered by ownership or borrowing in the case of short selling, so price, rather than supply, varies. Investors may increase or decrease their holdings and, when they sell, their stock may be purchased by other existing holders or by new investors. Taken up by new investors, increasing penetration signals a diffusion of interest in the stock and may indicate increasing momentum when it is accompanied by a rising price. Thus, a third potential predictor of the momentum effect could be a change in stock penetration, but no research has been found on this matter. Change in the penetration of stockholders could be established from stock exchange data or by stockbroker surveys of stock purchases.
One problem affecting the recording of stock purchases is the large number of trades conducted by program traders. It is the stock holdings of investors that are of interest, not trades.
It may be possible to anticipate change in stockholding using surveys. The questions in a survey have to relate directly or indirectly to the action of investing and the valuation of the firm. An increase in positive word of mouth about a firm’s products is not directly related to that firm’s profits, though it seems likely that there will be some indirect relationship, as is found with satisfaction with a firm. To be most relevant, the information should connect to the disposition to invest. Ajzen (1991) showed that the psychological disposition most closely related to action is the intention to act and that this intention is, in turn, related to attitude to the action, perceived social norms for and against the action, and the perception of factors helping or hindering the action. We conclude from this that the information most predictive of investing in a firm will relate to the intention to do so among potential investors, and that information that bears on the attitude to investing, normative influences, and facilitating factors will also be predictive, but to a lesser extent.
9. What Is to Be Predicted by AI
Those recommending stocks often give a target price. This is useful for those following the Warren Buffet strategy of long-term investment. Those who want to take advantage of momentum effects need a rather different stock price prognosis, where a change in price is predicted with respect to the time elapsing from the present, since what concerns the momentum investor is the stock’s rate of gain (or loss in short selling). For example, a stock might be predicted to gain substantially in value in the near future and thus offer a short-term gain. On this basis, it might be bought and then regularly reassessed until its prospects fall below those of an alternative investment, when it will be exchanged. Following this thinking, an AI analysis should provide predictions of the likely rate of gain from the present time. Trades could be automated but, when human intervention is preferred, the analysis could provide recommendations to hold or switch investments. In addition, there will be considerations of portfolio management with some balancing of exposures across countries, products, and types of firms; this can be handled by AI.
10. Public Interest
Investment based on momentum may upset markets by enlarging the size of bubbles and the depth of falls. In addition, it may further destabilize the stock market by counteracting the disposition effect. Those who want to see stable markets should take steps to minimize overshoots in price. To curtail speculative surges, credible predictions of profit impact are required. This may be impossible with disasters such as Deepwater Horizon, but in other cases, such as Tesla, firms can project future returns using a range of scenarios. Firms may be reluctant to engage in such exercises, but it is a task that could be performed by auditors. Financial journalists give predictions about share prices, but these often lack detail and may foster rather than calm momentum effects.
11. Conclusions
We have reviewed the psychological and social mechanisms that drive stock prices and asked what data are needed to enable AI to predict psychologically based price movements in addition to movements based on fundamentals. Relevant mechanisms that may affect the behaviour of investors include the disposition to sell rising rather than falling stocks, disproportionate reactions to negative information, the stronger impact of more available information, greater momentum effects in the face of uncertainty, more potential for the spread of new information when stock ownership is large in relation to capitalization, and the take-up of stock by new investors. Thus, data that indicate the operation of these mechanisms may be of value, but the main concern should be with data that indicate the speed of price changes and, here, effects may be stronger when the price movement is negative. Social data may add to the picture; evidence from word-of-mouth and satisfaction surveys and Internet search activity may assist, particularly when it can be related to the intention to invest. We identify three types of data that could help to predict momentum effects. These are publicity in relation to capitalization, the ratio of the number of stockholders to capitalization, and changes in the penetration of stock ownership. If AIs are trained on these kinds of data, they may learn to predict stock price movement that arises from investor psychology in addition to movement based on stock fundamentals. However, success with AI-based investment may lead to greater market instability.
Author Contributions
Conceptualization, R.E.; Methodology, R.E.; Data Curation, R.E.; Investigation, R.E. and M.W.; Writing—original draft preparation, R.E. and M.W.; Writing—review and editing, R.E. and M.W.; All authors have read and agreed to the published version of the manuscript.
Funding
This research received no external funding.
Data Availability Statement
The data used in this study are available at https://www.factset.com/ (accessed on 11 July 2024).
Conflicts of Interest
The authors declare no conflict of interest.
Notes
| 1 | Dimson et al. (2002) have also shown that gains tend to be inversely related to the size of company, directly related to yield and that more volatile stocks do not enjoy greater returns. Their work is summarized in a more recent paper (Dimson et al. 2017). A review of the effect of these factors in Australian markets broadly supports these findings (O’Brien et al. 2010). |
| 2 | Loss aversion, proposed by Kahneman and Tversky (1979), occurs when losses are experienced with greater psychological force than gains of the same magnitude. Though widely accepted, loss aversion now appears to lack supporting evidence. Gal and Rucker (2018) point to confounds in the design of the research used to support loss aversion and show that the greater response to losses could be largely attributed to a preference for inaction over action. When confounds were removed in improved research designs, the relative impact of losses and gains depended on the context. |
| 3 | Institutional traders greatly outnumber retail traders. A Reuters report estimated that 10 per cent of the London Stock Exchange dealings were retail (Retail traders account for 10% of U.S. stock trading volume—Morgan Stanley|Reuters https://www.reuters.com/business/retail-traders-account-10-us-stock-trading-volume-morgan-stanley-2021-06-30/ (accessed on 11 July 2024)). |
| 4 | Dimson et al. (2017) ordered the 100 stocks by their gains/losses over the year and compared the top 50 stocks with the bottom 50. After establishing these two groups they waited a month before buying and then held purchases for one month before selling. |
| 5 | Investment in a firm by its customers may be due to the affect heuristic; for an application see Merz et al. (2021). |
References
- Ajzen, Icek. 1991. The theory of planned behavior. In Organizational Behavior and Human Decision Processes. Edited by E. A. Locke. Amsterdam: Elsevier, vol. 50, pp. 179–211. [Google Scholar]
- Akhtar, Shumi, Robert Faff, Barry Oliver, and Avanidhar Subrahmanyam. 2011. The power of bad: The negativity bias in Australian consumer sentiment announcements on stock returns. Journal of Banking & Finance 35: 1239–49. [Google Scholar]
- Aksoy, Lezran, Bruce Cooil, Chistopher Groening, Timothy Keiningham, and Atakan Yalçın. 2008. The long-term stock market valuation of customer satisfaction. Journal of Marketing 72: 105–22. [Google Scholar] [CrossRef]
- Anderson, Eugene W., Claus Fornell, and Sanal K. Mazvancheryl. 2004. Customer satisfaction and shareholder value. Journal of Marketing 68: 172–85. [Google Scholar] [CrossRef]
- Aspara, Jaakko, and Henrikki Tikkanen. 2008. Interactions of individuals’ company-related attitudes and their buying of companies’ stocks and products. Journal of Behavioral Finance 9: 85–94. [Google Scholar] [CrossRef]
- Baker, Scott R., Nicholas Bloom, Steven J. Davis, Kyle Kost, Marco Sammon, and Tasaneeya Viratyosin. 2020. The unprecedented stock market reaction to COVID-19. The Review of Asset Pricing Studies 10: 742–58. [Google Scholar] [CrossRef]
- Baldwin, William. 2019. The Artificially Intelligent Investor: AI and the Future of Stock Picking, The Artificially Intelligent Investor: AI and the Future of Stock Picking. Available online: https://www.forbes.com/sites/baldwin/2019/12/09/connecting-a-million-dots/?sh=2b964d4843bb (accessed on 11 July 2024).
- Barber, Brad M., Chip Heath, and Terrance Odean. 2003. Good reasons sell: Reason-based choice among group and individual investors in the stock market. Management Science 49: 1636–52. [Google Scholar] [CrossRef]
- Bass, Frank M. 1969. A new product growth model for consumer durables. Management Science 15: 215–27. [Google Scholar] [CrossRef]
- Bijl, Laurens, Glenn Kringhaug, Peter Molnar, and Eric Sandvik. 2016. Google searches and stock returns. International Review of Financial Analysis 45: 150–56. [Google Scholar] [CrossRef]
- Bohl, Martin, Marc-Gregor Czaja, and Phillip Kaufmann. 2016. Momentum profits, market cycles, and rebounds: Evidence from Germany. The Quarterly Review of Economics and Finance 61: 139–59. [Google Scholar] [CrossRef]
- Borgards, Oliver, and Robert L. Czudaj. 2020. The prevalence of price overreactions in the cryptocurrency market. Journal of International Financial Markets, Institutions and Money 65: 101194. [Google Scholar] [CrossRef]
- Capelle-Blancard, Gunter, and Adrien Desroziers. 2020. The Stock Market Is Not the Economy? Insights from the COVID-19 Crisis. Available online: https://europepmc.org/article/ppr/ppr242665 (accessed on 11 July 2024).
- Challet, Damien, and Ahmen B. H. Ayed. 2013. Predicting financial markets with Google Trends and not so random keywords. arXiv arXiv:1307.4643. [Google Scholar] [CrossRef]
- Chen, Hong-Yi, Pin-Huang Chou, and Chia-Hsun Hsieh. 2017. Persistency of the momentum effect. European Financial Management 24: 856–92. [Google Scholar] [CrossRef]
- Ciocca, Giorgio, and Robert Gutsche. 2017. Retail Investors’ Attention and Momentum Strategies: Evidence from the S&P 500. Available online: https://www.efmaefm.org/0EFMAMEETINGS/EFMA ANNUAL MEETINGS/2017-Athens/papers/EFMA2017_0509_fullpaper.pdf (accessed on 11 July 2024).
- Da, Zhi, Josopeh Engelberg, and Pengjie Gao. 2011. In Search of Attention. The Journal of Finance 66: 1461–99. [Google Scholar] [CrossRef]
- De Bondt, Werner. 2020. Investor and market overreaction: A retrospective. Review of Behavioral Finance 12: 11–20. [Google Scholar] [CrossRef]
- De Bondt, Werner F. M., and Richard H. Thaler. 1985. Does the stock market overreact? Journal of Finance 40: 793–805. [Google Scholar] [CrossRef]
- Dimson, Elroy, Paul Marsh, and Mike Staunton. 2002. Triumph of the Optimists: 101 Years of Global Investment Returns. Princeton: Princeton University Press. [Google Scholar]
- Dimson, Elroy, Paul Marsh, and Mike Staunton. 2017. In search of patterns. London Business School Review 2: 76–79. [Google Scholar]
- East, Robert, and Lawrence Ang. 2020. Insight: The key to faster progress in science. Foundations of Science 26: 503–14. [Google Scholar] [CrossRef]
- East, Robert, Jenni Romaniuk, and Wendy Lomax. 2011. The NPS and the ACSI: A critique and an alternative metric. International Journal of Market Research 53: 327–46. [Google Scholar] [CrossRef]
- East, Robert, Kathy Hammond, and Malcolm Wright. 2007. The relative incidence of positive and negative word of mouth: A multi-category study. International Journal of Research in Marketing 24: 175–84. [Google Scholar] [CrossRef]
- Edmans, Alex. 2020. The Psychology of the Stock Market. Available online: https://www.youtube.com/watch?v=2q1M1H8a9FA (accessed on 11 July 2024).
- Ehrenberg, Andrew SC, Mark D. Uncles, and Gerald J. Goodhardt. 2004. Understanding brand performance measures using Dirichlet benchmarks. Journal of Business Research 57: 1307–25. [Google Scholar] [CrossRef]
- Fama, Eugene. 1970. Efficient capital markets: A review of theory and empirical work. Journal of Finance 25: 383–417. [Google Scholar] [CrossRef]
- Fehle, Frank, Sergey Tsyplakov, and Vladimir Zdorovtsov. 2005. Can companies influence investor behaviour through advertising? Super Bowl commercials and stock returns. European Financial Management 11: 625–47. [Google Scholar] [CrossRef]
- Fogel, Suzanne O’Curry, and Thomas Berry. 2010. The disposition effect and individual investor decisions: The role of regret and counterfactual alternatives. In Handbook of Behavioral Finance. Edited by Brian Bruce. Northampton: Edward Elgar Publishing Inc., pp. 65–80. [Google Scholar]
- Fornell, Claus, Michael D. Johnson, Eugene W. Anderson, Jaesung Cha, and Barbara E. Bryant. 1996. The American Customer Satisfaction Index: Nature, purpose, and findings. Journal of Marketing 60: 7–18. [Google Scholar] [CrossRef]
- Fornell, Claus, Sunil Mithas, and Forrest V. Morgeson. 2009. The statistical significance of portfolio returns. International Journal of Research in Marketing 26: 162–63. [Google Scholar] [CrossRef]
- Fornell, Claus, Sunil Mithas, Forrest V. Morgeson, and Mayuram S. Krishnan. 2006. Customer satisfaction and stock prices: High returns, low risks. Journal of Marketing 70: 3–14. [Google Scholar] [CrossRef]
- Gal, David, and Derek D. Rucker. 2018. The loss of loss aversion: Will it loom larger than its gain? Journal of Consumer Psychology 28: 497–516. [Google Scholar] [CrossRef]
- Garvey, Ryan, and Anthony Murphy. 2010. The effects of higher transaction costs on trader behaviour. In Handbook of Behavioral Finance. Edited by Brian Bruce. Northampton: Edward Elgar Publishing Inc., pp. 155–65. [Google Scholar]
- Gupta, Sunil, Don R. Lehmann, and Jennifer A. Stuart. 2004. Valuing customers. Journal of Marketing Research 41: 7–18. [Google Scholar] [CrossRef]
- Gurdgiev, Constantin, and Daniel O’Loughlin. 2020. Herding and anchoring in cryptocurrency markets: Investor reaction to fear and uncertainty. Journal of Behavioral and Experimental Finance 25: 100271. [Google Scholar] [CrossRef]
- Helsen, Harry. 1964. Adaptation Level Theory. New York: Harper & Row. [Google Scholar]
- Jegadeesh, Narasimhan, and Sheridan Titman. 1993. Returns to buying winners and selling losers: Implications for stock market efficiency. Journal of Finance 48: 65–91. [Google Scholar] [CrossRef]
- Joseph, Kissan, M. Babajide Wintoki, and Zelin Zhang. 2011. Forecasting abnormal stock returns and trading volume using investor sentiment: Evidence from online search. International Journal of Forecasting 27: 1116–27. [Google Scholar] [CrossRef]
- Kahneman, Daniel, and Amost Tversky. 1979. Prospect theory: An analysis of decision under risk. Econometrica 47: 263–91. [Google Scholar] [CrossRef]
- Keller, Ed, and Brad Fay. 2006. Single-source WOM measurement: Bringing together senders’ and receivers’ inputs and outputs. In Measuring Word of Mouth. Edited by Walter J. Carl. Chicago: Word of Mouth Marketing Association, vol. 2, pp. 31–41. [Google Scholar]
- Keynes, John Maynard. 1936. The General Theory of Empolyment, Interest and Money. London: Palgrave Macmillan. [Google Scholar]
- Kim, Karam, Doojin Ryu, and Jinyoung Yu. 2022. Is a sentiment-based trading strategy profitable? Investment Analysts Journal 51: 94–107. [Google Scholar] [CrossRef]
- Lakonishok, Josef, and Seymour Smidt. 1986. Capital gains taxation and volume of trading. Journal of Finance 41: 951–74. [Google Scholar] [CrossRef]
- Lehenkari, Mirjam, and Jukka Perttunen. 2010. Holding on to the losers: Finnish evidence. In Handbook of Behavioral Finance. Edited by Brian Bruce. Northampton: Edward Elgar Publishing Inc., pp. 346–61. [Google Scholar]
- Locke, Peter R., and Stephen C. Mann. 2005. Professional trader discipline and trade disposition. Journal of Financial Economics 76: 401–44. [Google Scholar] [CrossRef]
- Loibl, Cäzilia, and Tahira K. Hira. 2009. Investor information search. Journal of Economic Psychology 30: 24–41. [Google Scholar] [CrossRef]
- Luo, Xueming, Christian Homburg, and Jan Wieseke. 2010. Customer satisfaction, analyst stock recommendations, and firm value. Journal of Marketing Research 47: 1041–58. [Google Scholar] [CrossRef]
- Mathur, Lynette K., and Ike Mathur. 1995. The effect of advertising slogan changes on the market values of firms. Journal of Advertising Research 35: 59. [Google Scholar]
- Mazur, Mieszko, Man Dang, and Miguel Vega. 2020. COVID-19 and the March 2020 Stock Market Crash. Evidence from S&P1500. Finance Research Letters 38: 101690. [Google Scholar]
- Merz, Oliver, Raphael Flepp, and Egon Franck. 2021. Sonic Thunder vs. Brian the Snail: Are people affected by uninformative racehorse names? Journal of Behavioral and Experimental Economics 93: 101724. [Google Scholar] [CrossRef]
- Michael, Andrew, and Kevin Pratt. 2023. How To Invest In Artificial Intelligence (AI) Funds—Forbes Advisor UK. Available online: https://www.forbes.com/uk/advisor/investing/how-to-invest-in-artificial-intelligence-ai-funds/ (accessed on 11 July 2024).
- O’Brien, Michael A., Tim Brailsford, and Clive Gaunt. 2010. Interaction of size, book-to-market and momentum effects in Australia. Accounting and Finance 50: 197–219. [Google Scholar] [CrossRef]
- Odean, Terrance. 1998. Are investors reluctant to realize their losses? Journal of Finance 53: 1775–98. [Google Scholar] [CrossRef]
- Peterson, Robert A., and William R. Wilson. 1992. Measuring customer satisfaction: Fact and artifact. Journal of the Academy of Marketing Science 20: 61–71. [Google Scholar] [CrossRef]
- Preis, Tobias, Helen Moat, and H. Eugene Stanley. 2013. Quantifying trading behavior in financial markets using Google Trends. Scientific Reports 3: 1684. [Google Scholar] [CrossRef] [PubMed]
- Reyes, Tomas. 2019. Negativity bias in attention allocation: Retail investors’ reaction to stock returns. International Review of Finance 19: 155–89. [Google Scholar] [CrossRef]
- Ridley, Matt. 2020. How Innovation Works, 4th ed. London: Estate. [Google Scholar]
- Romaniuk, Jenni, and Byron Sharp. 2016. How Brands Grow: Part 2. South Melbourne: Oxford University Press. [Google Scholar]
- Rosenbaum, Eric. 2017. IBM’s Watson Supercomputer Is Getting into Wall Street Stock-Picking. Available online: https://www.cnbc.com/2017/06/16/ai-assault-on-stock-market-ibms-watson-is-getting-into-etf-business.html (accessed on 11 July 2024).
- Rozin, Paul, and Edward B. Royzman. 2001. Negativity bias, negativity dominance, and contagion. Personality and Social Psychology 5: 296–320. [Google Scholar] [CrossRef]
- Shanmuganathan, Manchuna. 2020. Behavioural finance in an era of artificial intelligence: Longitudinal case study of robo-advisors in investment decisions. Journal of Behavioral and Experimental Finance 27: 100297. [Google Scholar] [CrossRef]
- Sharp, Byron. 2010. How Brands Grow: What Marketers Don’t Know. Oxford: Oxford University Press. [Google Scholar]
- Shefrin, Hersh, and Meir Statman. 1985. The disposition to sell winners too early and ride losers too long: Theory and evidence. Journal of Finance 40: 77–90. [Google Scholar] [CrossRef]
- Skowronski, John J., and Donal E. Carlston. 1989. Negativity and extremity biases in impression formation: A review of explanations. Psychological Bulletin 105: 131–42. [Google Scholar] [CrossRef]
- Tversky, Amos, and Daniel Kahneman. 1982. Availability: A heuristic for judging frequency and probability. In Judgment under Uncertainty: Heuristics and Biases. Edited by Daniel Kahneman, Paul Slovik and Amos Tversky. Cambridge: Cambridge University Press. [Google Scholar]
- Uncles, Mark, Robert East, and Wendy Lomax. 2010. Market share is correlated with word-of-mouth volume. Australasian Marketing Journal 18: 145–50. [Google Scholar] [CrossRef]
- Valle-Cruz, David, Vanessa Fernandez-Cortez, Asdrubal López-Chau, and Rodrigo Sandoval-Almazán. 2021. Does Twitter affect stock market decisions? Financial sentiment analysis during pandemics: A comparative study of the h1n1 and the COVID-19 periods. Cognitive Computation 14: 372–87. [Google Scholar] [CrossRef]
- Wason, Peter C. 1960. On the failure to eliminate hypotheses in a conceptual task. Quarterly Journal of Experimental Psychology 12: 129–40. [Google Scholar] [CrossRef]
- Yang, Heejin. 2021. Investor sentiment and market dynamics: Evidence from index futures markets. Investment Analysts Journal 50: 258–72. [Google Scholar] [CrossRef]
- Zheng, Alice, and Jack Jin. 2017. Using AI to Make Predictions on Stock Market. Available online: http://cs229.stanford.edu/proj2017/final-reports/5212256.pdf (accessed on 11 July 2024).

Disclaimer/Publisher’s Note: The statements, opinions and data contained in all publications are solely those of the individual author(s) and contributor(s) and not of MDPI and/or the editor(s). MDPI and/or the editor(s) disclaim responsibility for any injury to people or property resulting from any ideas, methods, instructions or products referred to in the content. |
© 2024 by the authors. Licensee MDPI, Basel, Switzerland. This article is an open access article distributed under the terms and conditions of the Creative Commons Attribution (CC BY) license (https://creativecommons.org/licenses/by/4.0/).