Abstract
Lenders writing loans in the peer-to-peer market carry risk with the anticipation of an expected return. In the current implementation, many lenders do not have an exit strategy beyond holding the loan for the full repayment term. Many would-be lenders are deterred by the risk of being stuck with an illiquid investment without a method for adjusting to overall economic conditions. This risk is a limiting factor for the overall number of loan transactions. This risk prevents funding for many applicants in need, while simultaneously steering capital towards other more liquid and mature markets. The underdeveloped valuation methods used presently in the peer-to-peer lending space present an opportunity for establishing a model for assigning value to loans. We provide a novel application of an established model for pricing peer-to-peer loans based on multiple factors common in all loans. The method can be used to give a value to a peer-to-peer loan which enables transactions. These transactions can potentially encourage participation and overall maturity in the secondary peer-to-peer loan trading market. We apply established valuation algorithms to peer-to-peer loans to provide a method for lenders to employ, enabling note trading in the secondary market.
1. Introduction
Peer-to-peer loans have become popular due to the recent advances in financial technology. The concept of pairing a lender with a borrower remains a central focus of the peer-to-peer lending market. Many of the recent enhancements brought about due to technology adoption in this space have made the number of participants increase by making parings available to any individual with the right qualification requirements and some effort (Caglayan et al. 2020). Though there are many benefits to the accessibility to the peer-to-peer lending market now, some of the risks are still present and continue to hinder growth (Suryono et al. 2019). Many lenders have access to vital information about a potential borrower, which aids in making decisions to lend (Liu et al. 2020). Various work has been carried out to predict the repayment and default potential based on key factors in the borrower profile (Maloney et al. 2022). No matter the predictive capability, the risk of lending money to an individual with only a single exit strategy persists (Chen et al. 2022). In a straightforward peer-to-peer lending transaction, the lender’s money is in the borrower’s possession until the repayment term concludes and all payments are finalized.
In the peer-to-peer lending market, the online lending platforms play an essential role by pairing investors with borrowers. Beyond facilitating the pairing, these platforms will offer payment management for borrowers, analytical metrics for lenders, and a customer service capability for both sides (should any issues occur). Currently, there are use cases for the secondary market where the original lender on the primary market can sell their loan asset to a buyer on the secondary market who then becomes the new lender. Since many mainstream platforms only offer a primary marketplace, the scarce capabilities in the secondary marketplace vary, causing gaps in the trading of existing peer-to-peer loans (Holden et al. 2023). Some of the gaps and limitations that exist cause a lender on the primary market to hold a note until expiration (Caglayan et al. 2020). This is due to not having the mechanisms in place to exit their position on favorable terms. The current focus for the majority of the peer-to-peer market tends to be centered around decision making on the primary market, an important requirement for lenders (Zanin 2020). As the peer-to-peer lending space matures, we are seeing that there should be just as much importance placed on viable exit strategies, risk monitoring, and risk mitigation beyond the initial decision to lend money to a borrower (Lukkarinen and Schwienbacher 2022). Due to challenges and changes outside of the scope of the primary transaction, there are ways that a loan contract can become jeopardized during the course of repayment (Maloney et al. 2023). We have shown that low credit scores can limit the size of the desirable borrower pool when lenders use these scores as a heavily weighted requirement for decisions in the primary market (Maloney et al. 2022). There is also work on changing circumstances and disruptions that can occur after an agreement has been made—affecting the borrower’s ability to repay (Maloney et al. 2023). In these circumstances, the lender would benefit from having multiple options to manage risk.
Although a peer-to-peer secondary market would provide a lender with some flexibility, there is no standardization from one platform to another. Many secondary markets do not allow loans that are in arrears to be sold, some restrict selling when the borrower has made late payments, others restrict selling of loans that are too new, and a few will not allow the selling of loans that are too close to expiration. With these types of inconsistencies, a lender does not acquire the flexibility they need to implement an exit strategy when the circumstances change. Lenders provide the funding that makes the peer-to-peer loan market exist and are essential to the borrower pool. There are enhancements that can be made to the current peer-to-peer lending framework to provide more benefits to the lender without causing more burden on the borrower. These enhancements could fill some of the research gaps that exist in the field. The first major gap mentioned can be solved with a standard method for pricing a loan. This standardization will increase the diversity of lending potential and discourage platforms from implementing specialized rules for transacting on the secondary market. With a robust peer-to-peer loan pricing model, another gap closes by allowing and encouraging loan trading. To achieve the desired flexibility that comes with trading, participation and liquidity are requirements. We believe that a standardized and transparent pricing method will help the secondary market develop and attract more participant lenders and traders. This added liquidity can solve a very important gap in risk management methods in the peer-to-peer lending space.
Is there a method for pricing a peer-to-peer loan?
Will the method allow lenders to adapt to changes in the lending environment?
Can the method provide an enhancement to existing secondary market trade?
To answer these research questions, we will demonstrate how a widely utilized pricing model can be adjusted and applied to the peer-to-peer lending market. We will break down the multiple components of the algorithm to explain the inputs and how each affects the price of the loan. We will then show how the existing peer-to-peer loans lack incentives for participants when market conditions change and will show how our model contributes an improvement by allowing the lender to adapt accordingly. We then will show how a secondary market motivates peers while opening opportunities for more participants, providing liquidity and a basis for trading.
The scientific goal of our research is to deliver three theoretical contributions to improve the peer-to-peer lending market for both the borrower and the lender. First, we show how fundamental data points in the repayment terms of a standard peer-to-peer loan already have the parts necessary to assign a value to that loan. Second, we provide the logic necessary to calculate loan values based on these factors. Third, we show the benefit to the proposed changes by comparing how a lender and borrower would adapt to changes in the lending market using the proposed method in comparison to the existing standard. Our method introduces concepts for the secondary market to provide much needed support to the primary market by way of encouraging participation while also solving the liquidity needs for lenders.
This paper is organized as follows: Section 2 reviews prior studies in peer-to-peer lending pricing, trading, and risk. Section 3.1 provides the analysis of the pricing algorithm for peer-to-peer loans. In Section 3.2, we describe enhancements to the secondary market which are directly derived from the pricing algorithm explained in Section 3.1. In Section 4, we conclude, summarize the findings, and provide suggestions for future research to extend this study.
2. Literature Review
2.1. Pricing Asymmetries in Peer-to-Peer Lending
Compared with the traditional lending environment, peer-to-peer loans have many differences from transactions among peers. The diversity in the source of loan funds and the variety of borrowers makes standardization more challenging (Havrylchyk and Verdier 2018). It is not a popular idea to have a level playing field for all peer-to-peer lending agreements by way of a standard pricing model. Institutions are regulated and have specific risk guidelines that correspond to lending criteria in traditional loans. The decentralized unregulated peer-to-peer lending market has less oversight and no direct governing authority. Many peer-to-peer lending platforms are only restricted by the local laws for the jurisdiction in which the borrower resides. In the case of the United States of America, the regulation for peer lending is more relaxed than traditional lending. Though more loosely governed, the regulation can be different from state to state if any exist at all. Borrower qualifications will also vary on different platforms which are used as a risk/reward balance (Babaei and Bamdad 2020). The attributes in peer-to-peer lending transactions are generally common and the same data points exist in all platforms. This shared data model presents an opportunity to establish standards for pricing such loan assets.
Loans provide value to both the borrower and the lender but are only considered an asset to the lending party. Assets generally have a monetary equivalent price attached based on the fair market value, or amount that a buyer is willing to pay. When analyzing peer-to-peer loans from the aspect of a lender owning the asset, there currently is not a standardized method for assigning a fair market value or price for this asset. Multiple factors can be used to define the value of a peer-to-peer loan. These factors are easily accessible and currently not being utilized beyond the initial transaction of writing the loan on the primary market (Kholidah et al. 2022). For example, take the borrower application, which typically holds a credit score, annual income, debt-to-income ratio, and many other attributes used to evaluate the borrower’s ability to repay. These attributes exist in practically any loan application or borrower profile from a peer-to-peer lending platform. Once the application has been evaluated and a loan has been granted, there are other attributes that are made available such as the principal amount, interest rate, repayment term, and monthly payment. Just as the pre-loan application holds common standard attributes, the loan also holds attributes that are common regardless of the platform used. These standard attributes enable comparative analysis, but very few researchers have discovered the value in using these attributes to price the asset (Fitzpatrick and Mues 2021).
Pricing has been neglected as a contribution due to the limitations that exist in the peer-to-peer model (Caglayan et al. 2020). Our review of the existing literature and published information available on the popular U.S.-based peer-to-peer lending platforms reveals that the focus of these platforms is solely on providing a marketplace that pairs borrowers with lenders, which is a great contribution (Havrylchyk and Verdier 2018). These platforms make the bulk of their money from taking a portion of the borrower’s loaned funds as a fee and may also take a small percentage for facilitating payments. This marketplace model is limited to the primary market of an initial peer lender being paired with a peer borrower, instead of subsequent transactions beyond the original. A true marketplace provides for an unlimited number of transactions on the same commodity so long as there is value in said commodity (Galema 2020). The value of a peer-to-peer loan must exist beyond the original owner of the asset to allow for the marketplace to fulfill its true potential. The single-use nature of the current peer-to-peer loan model prohibits peer-to-peer loans from developing into a more mature transactional asset class (Harvey 2018).
The primary transaction and all data points involved provide the foundation for developing a viable method for valuation (Chen et al. 2021). We are aware that many of the popular peer-to-peer lending platforms in the United States do not offer a secondary market (Holden et al. 2023). This forces the lender to make the right decision initially without any corrective measures if or when the borrower does not perform. Of the platforms that offer a secondary market, there is very little published information on how the loans are priced and even less information available about the trading process (Harvey 2018). Since there is such little available information on these secondary markets, we provide our findings in Table 1. Table 1 lists any publicly available information on peer-to-peer lending platforms with secondary markets, the region in which they serve, the method in which the loans are priced, and any restrictions on transactions on the secondary market. Our review of the state of the peer-to-peer market and the existing literature gives a clear indication that large popular secondary markets do not exist. The reason for the lack of popularity may be due to the non-standard method for asset valuation. Each platform having its own method for valuing a loan creates liquidity silos for each platform instead of establishing an interconnected standard promoting trade. This lack of pricing methodology creates a barrier for the peer-to-peer lending industry, preventing the development of the secondary market. Due to the lack of available information in specific regions, we must include any region that has available information on their local peer-to-peer lending markets to serve as existing examples of the asymmetries in the secondary market offerings. In Table 1, we list any peer-to-peer lending platforms with published information on their secondary market (past or present), their given URL, their region, the status of their secondary market offering, and any pricing/restriction information offered publicly. This list does not capture every peer-to-peer platform with a secondary market in existence, but gives an example of the offerings that were accessible.

Table 1.
List of peer-to-peer lending platforms with published information on their secondary market (past or present).
The pricing or method for assigning value to a loan that exists currently or in a past version of a secondary market for peer-to-peer loans has traditionally been based on the face value or outstanding principal of the loan. Those platforms that have published their pricing methods show that the seller may set the price of their loan. In some cases, though set by the seller, there are limitations or rules that establish boundaries, restricting prices from being too aggressive. These limitations are enforced for reasons that seem to attempt to address issues that face markets in general such as liquidity, volume, and accuracy (Herzenstein et al. 2010). Developments in the peer-to-peer lending space that make efforts to address these issues are needed to further develop the secondary market and strengthen the primary market.
2.2. Secondary Market Asymmetries in Peer-to-Peer Lending
Our survey of the available peer-to-peer platforms that offer secondary markets reveals that there are differences that distinguish one platform’s secondary market from the other. On the other hand, there are also similarities that can be used as common ground to begin making progress towards a shared trading experience for buyers and sellers of these loans. After compiling information on the various platforms that offer secondary markets, we find that there are some key attributes that can be used to make comparisons.
The region shows where the operations for the platform are managed. The region serves as a de facto boundary for the loan transactions, as many of the borrowers and lenders will be based out of that area. Borrowers cannot easily borrow outside of their own jurisdiction because of the difficulty and differences in obtaining valid information to assess the criteria used to rank borrower’s credit worthiness. There usually is no region-specific restriction for lenders as the funding can come from anywhere in a peer-to-peer transaction. If a platform is regulated, the rules for that jurisdiction will apply to the platform and its secondary market.
In Table 2, we show key features of various peer-to-peer platforms from different areas in the world. In the table, you will see that there are various entry-level investment amounts. This limitation would be an issue in a standardized shared secondary market if the minimum investment is a much larger burden for an investor from a region with lower economic thresholds like cost of living, income, and GDP per capita. To facilitate a broader inclusive secondary market encompassing notes from as many peer-to-peer platforms as possible, the minimum investment restriction on an individual platform should not carry over to the shared secondary market. This would mitigate any issues where the minimum investment for any individual platform is substantially higher than others. On the secondary market, investors would not have this restriction because asset prices can vary based on market conditions. A buyer on the secondary market would not know where a loan places in the range of minimum to maximum investment limits on the primary market because loans from various primary markets would be available.
Table 2.
Peer-to-peer platforms with secondary markets established for buying and selling loans.
An interesting feature that a portion of the surveyed peer-to-peer platforms implement is a buyback guarantee. This guarantee is a commitment by the peer-to-peer platform to repurchase the loan from the peer lender at a specified price before a deadline timeframe. In this arrangement, there are often applicable performance criteria that the borrower must not have met, resulting in an unfavorable situation for the lender. This guarantee is not an all-encompassing insurance policy for the lender to recoup their funds, but more of a counter measure for bad actors who may have intentionally taken advantage of the peer-to-peer platform. An example would be a borrower who falsified documents to make their application appeal to a lender. In this transaction, the lender would have relied on the peer-to-peer platform to vet the borrower. To prevent lenders from losing trust in the peer-to-peer platform, the platform would offer a buyback guarantee in the early stages of the loan repayment term at a predetermined price (Weng and Luo 2021). This guarantee provides investors with a measure of confidence in the platform, but not a completely risk-free transaction. This buyback is commonly used as a marketing tool to promote the trustworthiness of the peer-to-peer lending platform, making one platform more attractive than another.
The minimum projected return is an advertised amount that each of the platforms will disclose to investors as an estimated return on investment. These rates are indicative of a fully repaid loan at maturity and come with no guarantee as to the performance of the borrower over the term of the loan. Some of the platforms advertise a minimum projected return that is more conservative, and some are aggressive with projections. As shown in Table 2, Fixura, a Finland-based platform, projects the most conservative return on investment, while many of the other platforms listed project returns of 9% or more. There are issues that come with high returns, such as riskier borrowers being charged higher rates, and predatory marketing tactics to sucker borrowers into making bad loans. These scenarios can lead to a loss of capital, but this is not always the case. Many of these platforms do not have transparent statistics available to lenders to cross-reference in their due diligence.
We found that the secondary markets on these platforms are segmented and associated only with the primary parent platform. Since many of these platforms are from various countries, there are different currencies used, different languages, and varying lending levels (minimum and maximum loan amounts). Any of these mentioned differences can be inhibiting factors to secondary market participation, resulting in liquidity issues for traders. Liquidity promotes more efficient pricing and is necessary for a secondary market to successfully exist (Zhou and Wei 2020). One example of a secondary market lacking liquidity would be a seller of an asset with a performing borrower, no other heightened risk factors, but having no available interested buyers in this loan even at a discount. With sufficient liquidity, a seller of a loan does not have an issue with obtaining a buyer for an asset priced correctly. To increase participation in the secondary market of peer-to-peer lending, barriers that prevent traders from transacting on these markets must be remedied (Oh and Rosenkranz 2022).
2.3. Prevailing Risk Factors in Peer-to-Peer Lending
Many papers focus on the benefits of the peer-to-peer lending industry and how innovative strides in financial technology assist in making the industry more popular. However, there are risks that exist in the peer-to-peer lending space. One fundamental risk with lending is the opportunity cost that arises when market conditions change. Lenders invest capital based on economic factors present when making the decision to lend money to a borrower. These factors are not frozen in time and can impact the quality of the investment for the lender. For the borrower, changes in the overall lending environment can impact their decisions to keep the loan with the agreed-upon terms or move on to take advantage of a better situation (Huang et al. 2020). This risk is not unique to only the peer-to-peer lending market, as traditional lending also has this as a leading obstacle when writing loans. Though the traditional lending space shares the same risk, there are secondary markets that traditional institutions use to handle such scenarios (Kaminskyi et al. 2022). In many cases, there are people in risk analysis positions in traditional lending institutions. In contrast, in the peer-to-peer lending space, the potential peer lender is the main decision maker, who has no established secondary market.
When interest rates fluctuate, existing loans are affected. Since peer-to-peer loans are fixed-rate personal loans, a change to the overall lending environment has a direct impact on the asset’s strength. When the change does not benefit the lender, there are limited options. One major downside for the lender is that the loan must be held as an investment through to the end of the repayment term if there is not a viable option for selling this loan to another investor. On the other hand, there are exit strategies that can be employed by the borrower to take advantage of a change in rates for the better. Also, when rates change for the worse, the borrower has the option to continue paying on an existing peer-to-peer loan with favorable rates locked in prior to the move. So, in reference to rate changes, the borrower’s flexibility outweighs the lender’s when there is not a viable secondary market for the lender to transact.
Another prevailing risk within the peer-to-peer lending space is a change in the borrower’s attributes. Investors are always concerned with a borrower’s ability to repay because this can be the difference in making a return on their investment or a loss of capital. Interested peers will make decisions to lend based on available data points in loan applications (Ma et al. 2018). During the course of the loan repayment, the attributes have the ability to change (Berg et al. 2020). Since these attributes influenced the decision to lend with the associated terms, the quality of the investment will be in question when a change occurs. When attributes change for the worse, the borrower benefits from locking in terms based on better qualifications and has an incentive to stick with the existing loan situation. On the other hand, if the loan qualifications for the borrower are enhanced, they may benefit from finding better terms based on having more desirable application attributes. From the perspective of the lender, diminished borrower qualifications hurt the quality of the investment and decrease optimism for repayment. Enhanced borrower attributes will strengthen the loan qualities when analyzing the investment and could help a lender sell a loan. Through the use of technology and data offered by the online platform, the ranking systems give investors the ability to use a summarized grade for the quality of borrowers (Boiko Ferreira et al. 2017). A lower-grade borrower would be a higher risk for a lender, while a higher-grade borrower signifies a safer investment. Ultimately, the decision is made by the peer lender, but with the use of the platform’s quality rating, the peer can lean on the platform’s analysis. Lower-grade borrowers will provide lenders with an incentive for taking on more risk by paying higher interest rates. More favorable rates will be given to high-grade borrowers because of the competition from other lenders for high-quality borrowers (Yu et al. 2018).
Most peer-to-peer lending platforms are serving in an alternative capacity to the traditional institutions available in the borrower’s area. Though well-qualified, highly rated borrowers can utilize these peer-to-peer lending platforms, the less attractive borrower usually has no other option. In areas where there are established credit reporting agencies, the applicant’s credit score and other important factors are used to determine the quality of the borrower (Kim and Cho 2019). Many would assume that a lower-credit-score borrower should not be given a loan. In other work that uses machine learning on low-credit borrowers, we found that there are factors in the borrower’s credit profile that show promise in giving applicants like these a chance (Maloney et al. 2022). In other work, we have seen that there are economic disruptions that can cause financial issues for borrowers. Analyzing data on borrowers who have experienced economic hardship during their repayment period shows that there are certain factors in the applicant profile that a lender can use. Factors such as the words in their job title can influence the confidence that a lender has in an applicant’s resilience to economic disruption (Kriebel and Stitz 2022).
Reviewing many of the prevailing risk factors, we come back to the fundamental issue, which is a lacking exit strategy for peer lenders. Lenders need the flexibility to adjust to changing conditions and must have an alternative to waiting on the borrower to perform to completion of the repayment term. Loans are assets of the lender that carry inherent risk, but the risk of exposure due to a non-existent secondary market further complicates the position. The value of these assets must be standardized and easily computed to support market activity beyond the initial writing of the loan on the primary market. Conditions in the lending environment have the possibility to change. In the rare case that conditions in the lending environment remain consistent throughout the term of the loan, the qualities of the borrower can also change. In situations where changes occur, the value of the asset should adjust properly to reflect the change. Until there are acceptable methods to assign a value to a peer-to-peer loan, the risk of exposure will remain. To begin addressing this risk, we will present a valuation method for these assets that could be a foundation for establishing a liquid secondary peer-to-peer loan market. The design of a peer-to-peer lending network with a robust and liquid secondary market has the potential to give peer lenders options in risk mitigation.
3. Pricing Peer-to-Peer Loans
3.1. Pricing Methodology
We see that the structures of peer-to-peer loans are common on both the platforms that offer secondary markets and those that do not. Those with published information about their loan offerings on the primary market state that the loans are installment loans and have a fixed interest rate for the repayment term. This fixed interest rate guarantees a consistent payment for the borrower during their repayment term, which enables the borrower to plan accordingly. These loans also have platform-specific fees that are either charged one time or on a periodic repeating basis. A one-time fee could be the application fee or the loan origination fee that the borrower must pay. Recurring fees include service fees or platform-specific vendor fees billed along with each installment payment.
During the repayment period of the loan, the borrower will make payments. The portion of the payment that goes towards the principal paydown and the interest charged will be broken down by an amortization schedule. The amortization schedule will allocate a larger portion of the recurring payment to interest in the earlier periods of the loan, while decreasing that allocated portion as more payments are made. The principal, or the borrowed amount, will slowly decrease as payments are made by the borrower. Due to amortization, the portion of the payment that will be allocated to paying down the principal starts off small and increases over time. The formula for calculating amortization in this case is as follows:
where = the payment amount, = the amount of principal net of initial payments, = the periodic interest rate, and = the total number of payments. To further illustrate how a typical peer-to-peer loan repayment schedule breaks down in proportions of principal and interest for the borrower, we give an example of a USD 10,000 loan with a 3-year repayment term and a 10% fixed interest rate. When looking ahead to the last successful payment at the end of the repayment term, the borrower would have paid a total of USD 1616.19 in interest. As shown in Table 3, this total interest figure accumulated over the life of the repayment term, starting from month 1 at an amount of USD 83.33 through to month 36 at USD 2.67, which is the lowest interest allocation. In this scenario, the effective return on capital for the peer-lender is USD 1616.19, or 16% on the original USD 10,000 that was originally borrowed. For the borrower, USD 1616.19 was the cost in interest paid in addition to the original principal of USD 10,000. These calculations do not include any fees charged to the borrower by the peer-to-peer lending platform.
Table 3.
Schedule and allocation on a typical peer-to-peer loan for USD 10k at 10% interest issued with 3-year repayment-term.
If the original lender wants to sell this performing loan to another lender prior to month 36, there should be an easily calculated price. Table 3 shows the amount of principal remaining in the ending balance column at any month interval. This amount would be the payoff for the loan if a borrower wanted to complete the repayment early, which is prepayment. This amount could also be thought of as a buyout that another lender would pay the original primary lender in a transaction initiated by the borrower. This could be thought of as refinancing the remainder of the loan with another lender. In this scenario, the price for this loan is a simple calculation, as we can take the remaining principle as a minimum price the seller should ask for the loan. Any amount over the remaining principal would be a premium or bonus for the seller as they would be locking in additional gain while taking their risked capital out of the equation.
There are external issues that can impact the attractiveness of pricing a loan based on the remaining principal. The most obvious issue would be the performance of the borrower. If a borrower has stopped making payments to the current lender, selling the rights to the loan at the amount of remaining principal would require some way of convincing or way to ensure that the purchasing lender can collect payments from the borrower. A guarantee such as this does not exist; thus, the value of this loan would decrease. This risk associated with lending causes issues when it occurs, and attempting to pass a loan on with a nonperforming borrower is not ideal.
Another prevailing issue with pricing based on the remaining principal is the competing alternative investment vehicles available. Since peer-to-peer loans have fixed interest rates, during the repayment term, conditions could change in the lending space that would change how the fixed-rate loan is viewed on the secondary market. There could possibly be other places an interested party could put this money for a similar or better return. On the other hand, the fixed rate could become very attractive because the rate is much higher than other investments. When interest rates change, fixed-rate assets become either more or less attractive (Ma et al. 2017). This will affect the ability of a note holder to sell their loan to another lender. Peer-to-peer loans each have different borrower quality, repayment periods, and interest rates. Pricing of peer-to-peer loans should be based on these factors because borrower quality and interest rates often change during the life of the loan.
To price peer-to-peer loans more effectively based on the nature of the instrument, we will introduce concepts that will serve as inputs for the pricing algorithm. Initially, the face value, or the loaned amount of the principle, starts off as the price. This value means nothing until the lender decides to sell and must have a marketable price. There are other factors that must be included to determine the marketable price (Ma et al. 2017). As we have already established in the discussion on amortized payments, there is a fixed interest rate and a set payment for the borrower. In this model, we do not amortize the payments and instead remove the principal portion from the recurring payment. Our model only requires a fixed interest amount to be paid by the borrower at recurring intervals (typically monthly) to the lender. Since the borrower is only paying interest, the entire principal amount is due to be paid to the lender at the end of the term. This concept, also known as maturity, allows the borrower to make regular, fixed-amount, interest-only coupon payments to the lender for a defined period. As a result, the borrower benefits from the flexibility of the lower payment to prepare for the bulk repayment or refinance the principal portion of the loan. The benefits for the lender will be explained as the discussion of the pricing method continues.
In our method, the payment, which is a fixed amount composed of only interest, stays consistent for the borrower throughout the term of the loan. This periodic distribution of interest from the borrower will be paid to the noteholder or peer lender even if sold during the duration of the loan term. This fixed periodic distribution, or coupon, can be calculated by taking the contractually agreed annual interest rate on the principal and dividing this amount by the number of payments that will occur during the year.
where is the coupon rate, is the annualized interest, and is the par value (principal) of the loan. If a loan has a principal amount of USD 10,000, and over the course of the year a borrower agrees to pay USD 1500 in interest, then the coupon rate is 15% annually. In the case where there will be multiple payments required throughout the year such as a monthly payment, the coupon rate stays the same, but the payment amount is broken up to equal the yearly total required. In the following equation, is the coupon payment, is the par value (principal) of the loan, is the coupon rate, and is the number of payments annually.
The coupon payment amount, which does not change, plays a big role in pricing the peer-to-peer loan on the secondary market because it can be compared with other investments to determine the attractiveness of the opportunity. For example, if a peer-borrower is currently paying 5% on a loan of USD 10,000 (Loan A) and decides to borrow more money by securing another USD 10,000 loan from a totally separate peer-lender at 10% (Loan B), there is a comparison that can be made. If the quality of the borrower, the duration of the loan, and other loan qualities are identical at the time of writing Loan B, then Loan A is less attractive to a lender than Loan B simply because of the difference in coupon rate. Lender A has locked in a lower rate with theoretically the same level of risk as Lender B, who is achieving a better return. In regard to pricing the two assets on the secondary market, Loan A would need to be priced at a lower value than Loan B because of the difference. On the secondary market, these peer-to-peer loans may be sold for a premium or discount on their initially established face value. This means that the issuer or borrower’s contractual interest rate plays a role in the price of the loan.
Using another example, consider a USD 10,000 peer-to-peer loan with a 10% coupon annually. If this loan sells on the secondary market for USD 11,000 to investor A, the coupon of 10% on the USD 10,000 still stands. This investment made by investor A now has a 9% yield since the amount invested is higher than the face value of the loan, which is sold at a premium. If a second transaction occurs and the loan sells for USD 9000 to investor B, the coupon of 10% on the USD 10,000 still stands. This USD 9000 investment made by investor B now has an 11% yield because the amount invested is less than the face value of the loan, which is sold at a discount.
Another key measure for valuing a loan on the secondary market is the yield. There are multiple meanings when referring to yield. In the most general sense, the yield refers to the return on investment from interest paid. The multiple ways yield can be used in pricing peer-to-peer loans include nominal yield, yield to maturity, yield to call, and yield to worst (Caglayan et al. 2020). We have already discussed the nominal yield in prior sections, as this is synonymous with the loan’s coupon rate. Simply put, nominal yield is the interest-based return on the face value of the loan a lender can expect to receive in the span of a year. The yield to maturity is a factor of importance in trading loans as this measures the rate of return if the lender performs and pays the owner of the asset as agreed through the maturity date. Investors looking to transact peer-to-peer loans must have this calculation readily available to determine if the price of the asset is at a premium or discounted in relation to the par value. Yield to maturity is calculated as follows:
where C is the coupon or interest payment, F is the face value or par value, P is the stated price of the loan, and n represents the number of years to maturity. This will represent the actual realized yield over the life of an investment only if all coupon interest payments received before the maturity date are reinvested at the current YTM in a compounding manner. This yield to maturity formula calculation is an approximation because we assume that the value of the loan stays constant until maturity, though this is not likely. The YTM is the estimated annual rate of return that the peer-to-peer loan is expected to earn until reaching maturity, with three notable assumptions:
Assumption 1.
The return assumes the lender or investor will hold onto the asset instrument until the maturity date.
Assumption 2.
All the required interest payments will be made as scheduled and ultimately the principal will be repaid.
Assumption 3.
The interest payments will be reinvested at the same rate as the yield to maturity.
Yield to maturity is the internal rate of return because the calculation takes the discount rate and present value (PV) of all the loan’s future cash flows and provides an indicator for the current market price. Since the YTM is based on an annualized rate, it allows an interested party to make comparisons among different loans and their expected returns on the primary and secondary market. Finding the actual yield to maturity would require scenario-based parameter changes for the rates used in the present value formula until P (or price) equals the actual price of the loan.
To validate the value of a loan, we use the present value of the loan’s expected income based on the yield to maturity. The yield to maturity, along with the par value, coupon, and time to maturity, will be used as inputs to calculate the present value. We utilize the following for the calculation of the value of cash flow and face value:
,
so,
To give an example of a typical peer-to-peer loan, we will take a USD 1000 loan with an annual interest rate of 5% for the next 3 years. The interest payments are made monthly until the maturity date, when the USD 1000 principal is due for payment.
To calculate the yield to maturity for the loan based on the values listed above with monthly coupon payments, we use the applicable formula with the stated values:
For the scenario mentioned, the loan is showing the full term as t = 36 months and T = 3 years, meaning this is either at origination in the primary market or being analyzed shortly after that in the secondary market. When analyzing loans that are at or near origination, the yield to maturity is equal to the agreed annual interest rate when the loan is neither discounted nor sold at a premium. The secondary market will be composed of loans that do not have a full term remaining and have an asking price that is different from the face value.
To illustrate a situation where the original loan is being sold at a premium, or P > F, we use the following example:
In the above example, the higher loan price (P) has a negative impact on the yield to maturity. This decrease is because the inputs that provide the income for the loan do not increase along with the price. The coupon payments, the interest received on any interest payments (assuming coupon payments are reinvested at the same yield to maturity), and the difference in the face value compared to the price only result in a profit if the loan is bought for less than the par value. The buyer of this loan would have a lower yield to maturity because they paid a premium and because there is less time to maturity remaining. After calculating the yield to maturity, and replacing r with the updated YTM rate, we have the necessary inputs required to calculate the present value from the following equation:
In this scenario, the present value, though still at a premium, is less than the asking price of USD 1010 given in the example. Unless there are other factors warranting a higher asking price, a buyer would be overpaying for this loan if purchased at the asking price.
To illustrate a situation where the original loan is being sold at a discount, or P < F, we use the following example:
In the example above, we illustrate a loan priced lower than its face value which has a higher yield to maturity because of the discount. This concept of buying loans at a discount can result in the buyer making a profit at maturity when receiving the face value payment. Another potential benefit to buying at a discount is that the coupon payment is based on the higher face value and not the discounted price. A peer-to-peer loan’s principal balance or par value at the time of issuing the loan is the loan amount. As shown in Table 4, when buying and selling these loans, we have the par value as the basis for determining if the asset is transacting at a premium or a discount. When the loan is transacting for more than the established face value or par, the loan is trading at a premium. On the contrary, a loan trading at a discount would be priced below its face value or par value. An ‘at par’ loan is priced equal to its face value or par value.
Table 4.
Classification of loan price compared to its face value with justification.
3.2. Empirical Results
Peer-to-peer loans are callable, which means that the borrower can repay the full face value at any time during the repayment term. Though this is not the worst-case scenario for a lender, the callable feature can impact returns because coupon payments will stop. In such a case, the true yield to maturity figures would need to be adjusted to the decreased value. Adjusting input values after the loan has been called back (or paid off) by the borrower does not give the investor the ability to plan and price the asset properly prior to purchase. The price paid for the loan would result in an overpayment when based on an incorrect yield to maturity equation since the loan was not actually held until maturity. In this scenario, the value (coupon) in the pricing formula would be inaccurate when retroactively plugging in the actual sum of coupon payments for the year in which the payoff occurred.
To avoid incorrect pricing due to a borrower paying prior to full maturity, we use a pricing formula built to handle such a scenario for callable loans. In such scenarios, we optimize the benefit for the buyer in the price as the seller already benefits from an embedded callable option. The benefit to the buyer works out to a cheaper purchase price. As shown in Table 5, when a callable loan is being sold at a premium, the buyer would need to base the price on the earliest possible payoff date to avoid overpaying for the asset. In contrast, the discounted loans should be analyzed based on the latest payoff date possible because the coupon rate is less than the yield to maturity. We can use the following equation to analyze price for a callable peer-to-peer loan:
where P is the price of the loan, F is the original face value of the loan, r is the coupon rate, n is the number of coupon periods, j is the yield rate, C is the coupon payment amount, and V is the present value.
Table 5.
Callable loan classification and basis for pricing by payoff date.
In a realistic scenario, we plug the values in for a peer-to-peer loan to determine its price.
- (0.83% monthly)
Since r > j, we have a loan being sold at a premium which will yield less than the contracted original rate due to the increase in price. For loans with r > j, we must calculate the best possible price based on the earliest payoff or call execution to avoid overpaying for the loan. We plug the values into the formula to simulate pricing of the loan based on the facts:
In this sample, we show that the loan being sold at a premium and then being paid off at n = 1 would result in a loss to the buyer. The buyer would have overpaid for the loan if purchased for an amount higher than the face value because the borrower paid only one payment to the lender. The sooner the loan is repaid, the less return the lender will realize. If the loan can be repaid at any time while n > 0, then a repayment at time n = 1 should be used as a basis for the best price of the loan due to it being the lower return for the buyer. To avoid a loss in this scenario, some lenders will charge a prepayment penalty to discourage borrowers from paying loans off early. Other loss mitigation techniques would include adding cost to the borrower to have a callable feature in the loan. Some lenders can place restrictions on how soon the loan can be paid off (in an effort to delay repayment). In such cases, the n value (number of payments) must meet a threshold that has the break-even amount factored in for the lender. We show in the following example how pushing the earliest payoff back to half of the full maturity affects the price based on the same example from before but using a different value for n.
- (% monthly)
Pushing the earliest payoff date back to half of the full maturity increases the price of the loan because there are more interest payments due to the note holder before the possibility of payoff. This affects the present value function by increasing the exponent. In both cases (n = 1 or n = 61), the loan was being sold at a premium because coupon rate > yield. So, in these cases, we calculate the price based on the earliest payoff because that early payoff presents the possibility of diminished return. In the case where the loan is sold at a discount, we calculate the price based on the latest payoff (to maturity). Loans will sell at a discount if the interest rate is no longer competitive, forcing yield improvement to meet the competition. A rate that is no longer competitive for a lender is a benefit to a borrower. This scenario occurs when rates in the overall market increase after writing the loan. When calculating the price of a callable loan being sold at a discount, we assume the borrower will take advantage of the lower rate and keep the loan for as long as possible (until maturity). Here, we modify the scenario to display pricing for the loan being sold at a discount and how it affects the price:
- (% monthly)
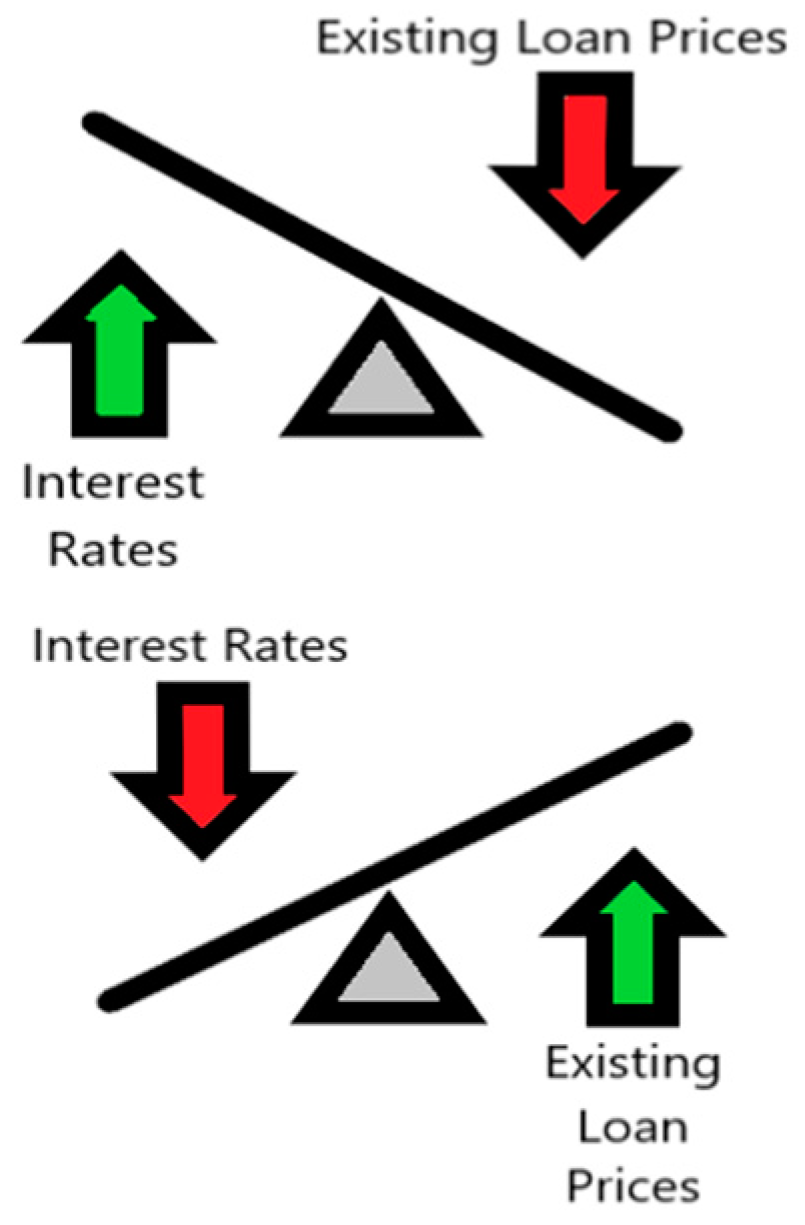
Interest rates have an external impact on peer-to-peer loan pricing as there are regulatory bodies that can raise or lower interest rates for the entire lending environment. Peer-to-peer lending does not exist in a vacuum and is still subject to macroeconomic conditions. If controlling regulators lower interest rates, the loans generated immediately after this change will have to compete with the new rates. This is also true for the reverse scenario of rates being increased. An existing peer-to-peer loan, written before the change in rate, becomes either more or less desirable depending on the direction of the move in rates for the market as whole. As shown in Figure 1, if the existing yield on a loan established prior to the rate move becomes more attractive to other investors, the price of the loan increases. In the opposite scenario where the yield is less desirable to an investor after the rate movement, the loan price will adjust downward. Currently, the majority of peer-to-peer loans remain unchanged because the concept of valuing the loan according to market conditions is not mainstream. Many investment vehicles that compete with peer-to-peer loans such as government bonds, municipal bonds, and corporate bonds adjust to changes in the lending market, enabling and facilitating trade.

Figure 1.
Illustration showing how loan prices change based on a change in rates.
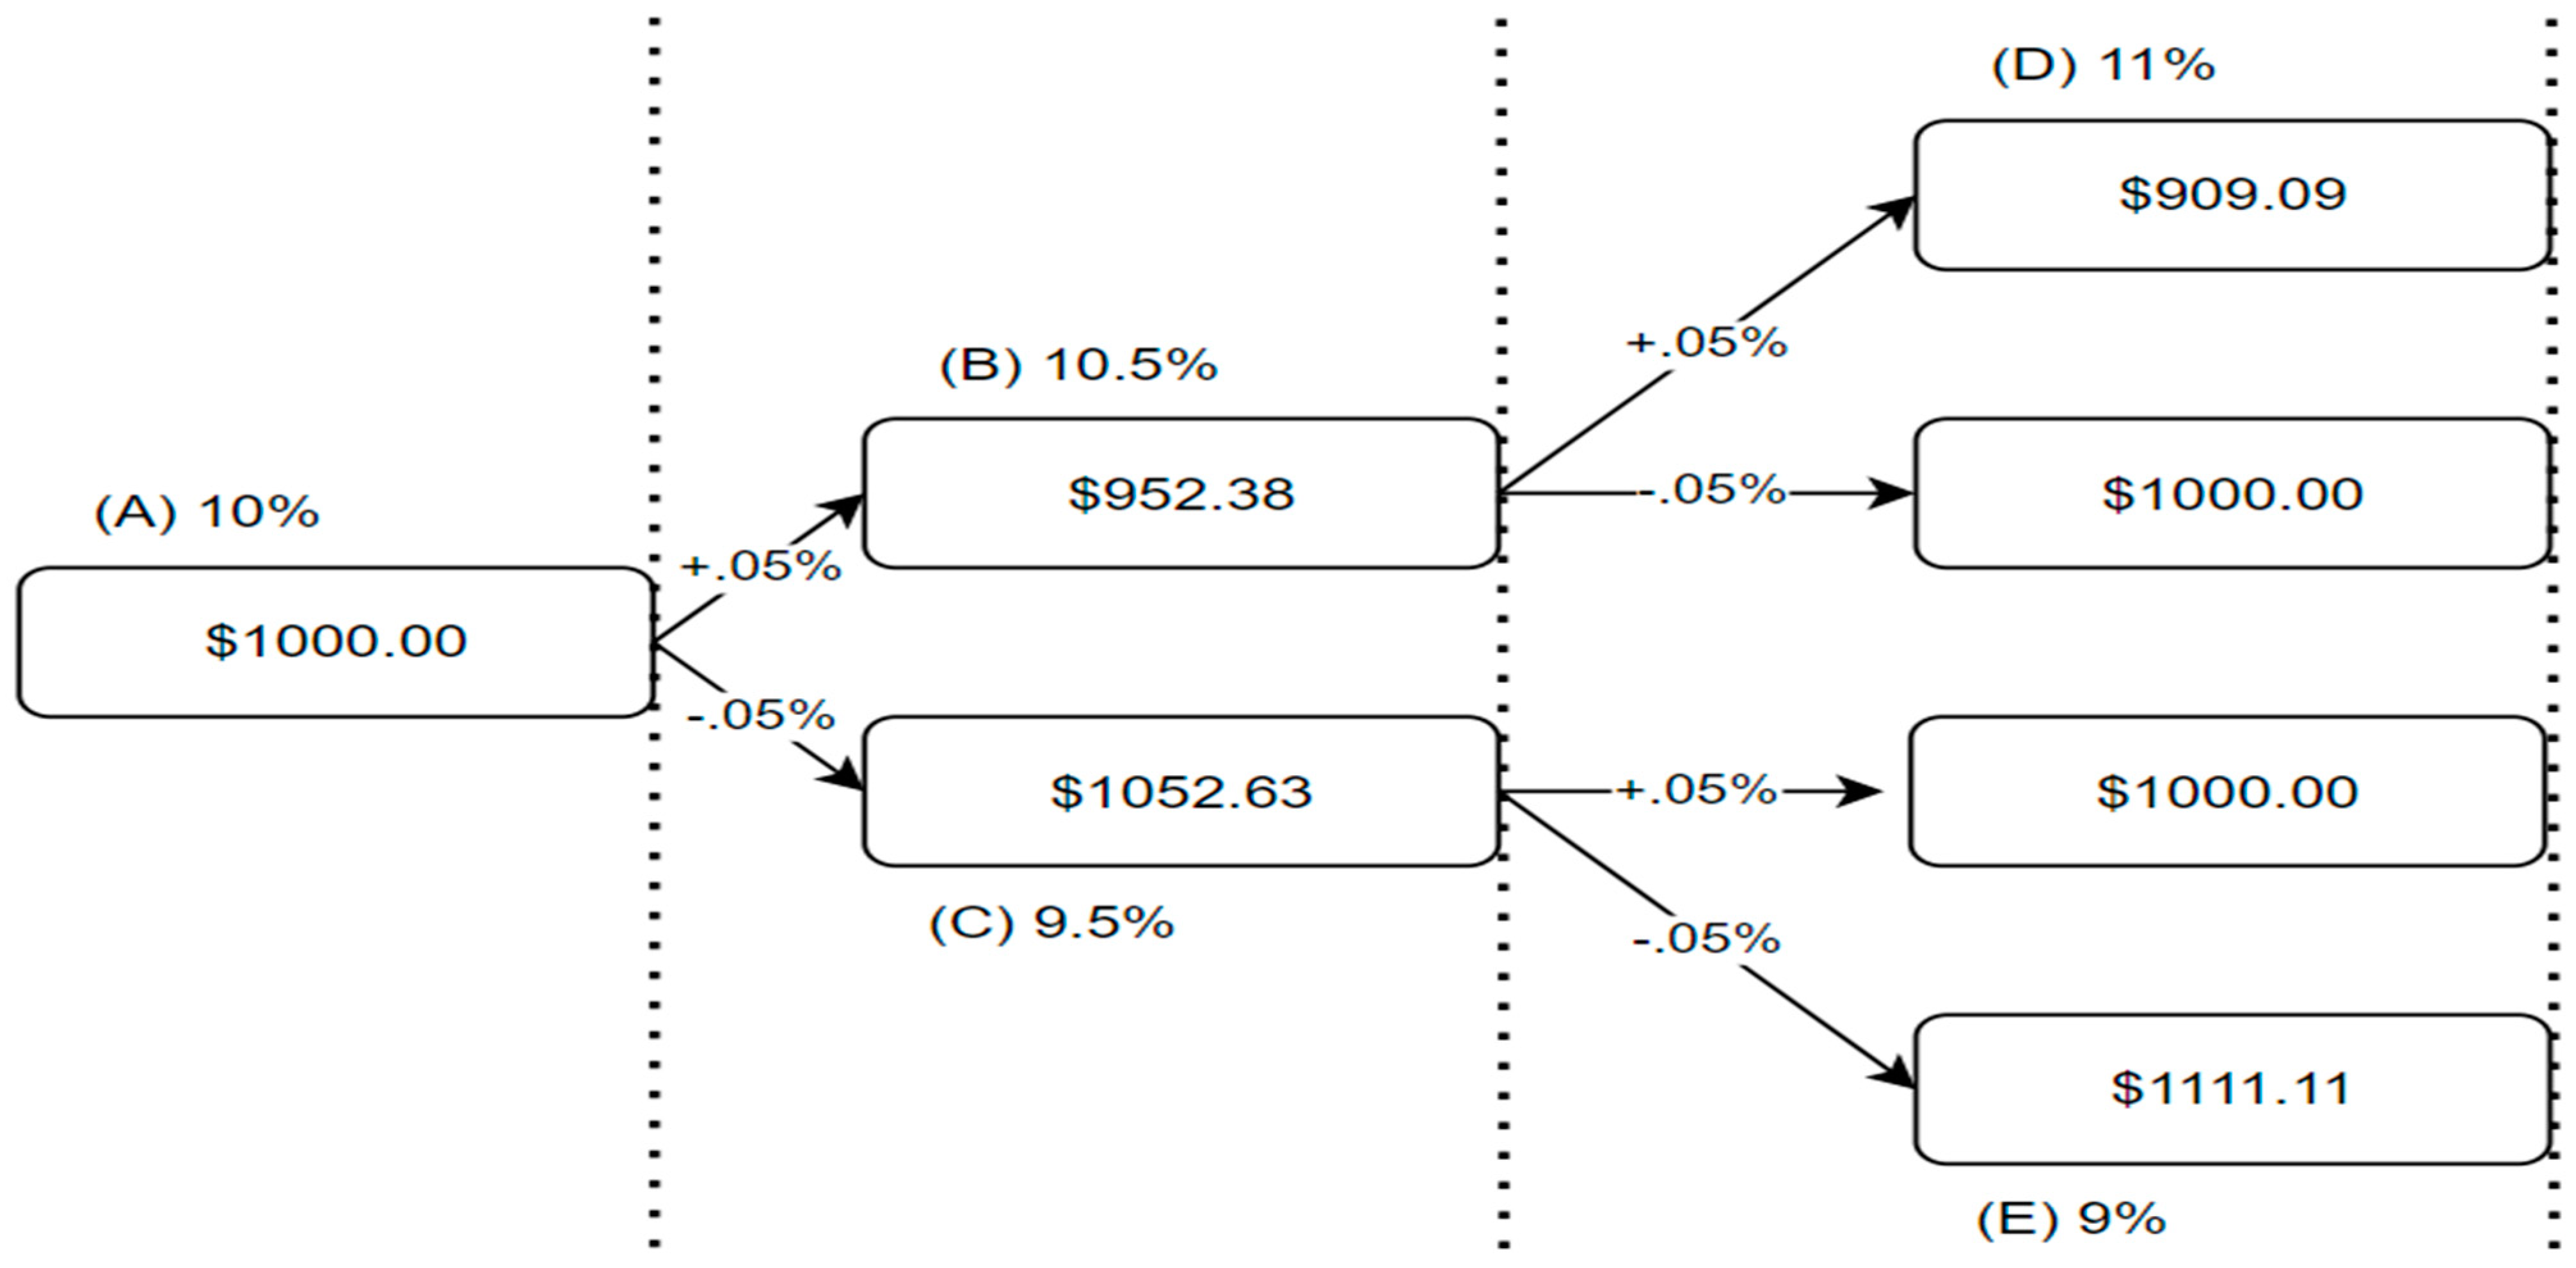
The price or value of the peer-to-peer loan after purchase can fluctuate as overall environmental changes occur in interest rates. There may also be a change in price due to supply and demand, time to maturity, and the credit quality of the borrower (Guo et al. 2016). Lenders can use models to determine how changes in factors such as the interest rate will change the value of their asset. Since there is a future maturity date in the proposed pricing formula explained previously in Equation (14), an investor can use a binomial model to forecast scenarios that may play out. The binomial pricing model can give an idea of the loan value using an iterative approach incorporating multiple future time periods. With the possibility of both rate increases and decreases, the changes in the value of the loan at each node are visible for analysis and planning. To illustrate how rate changes should impact a peer-to-peer loan we display the binomial interest rate tree in Figure 2 for the listed scenario:
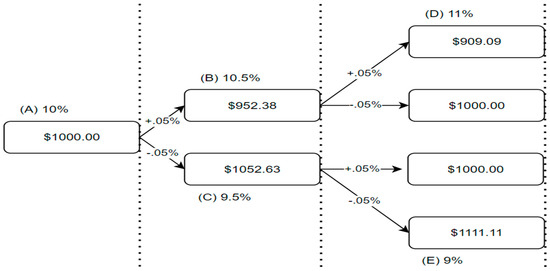
Figure 2.
Binomial interest rate tree for the scenario in Table 6 showing loan value fluctuations based on simulated movement in rates by ±0.5%.
- (% monthly)
where F is the original face value of the loan, r is the coupon rate, n is the number of coupon periods, j is the yield rate, C is the coupon payment amount, and V is the present value. In the example, we simulate a rate change of 0.5% in either direction from an artificial starting point of 10% for both the risk-free rate and the peer-to-peer loan. Typically, the risk-free rate and the rate for a peer-to-peer loan will not be the same, but for simplicity we use the same rate to show how changes in the government rates would impact the value of other assets like loans.
In Table 6, we use a simulated risk-free rate of 10% to model market conditions for the jurisdiction. This value is used to show how a change in rates at the federal level would impact an investor’s comparative value in a peer-to-peer loan. Competing investments such as a “risk-free” government bond would align with the rate adjustment, so an investor would be able to determine the difference in the return when comparing to an existing peer-to-peer loan. In Table 6, we start the risk-free rate and the rate for the peer-to-peer loan at 10% annually. In the updated interest rate column, we simulate a change in the risk-free rate by adjusting to the interest rates shown. A change in the rates does not change the original rate in the peer-to-peer loan. This forces the value of the peer-to-peer loan to change because an investor seeking to purchase this loan must factor in the ability to invest the same amount of money elsewhere (in this example, a government bond at the updated risk-free rate). Since the same amount can be invested elsewhere, we must determine the value of the investment by analyzing what amount it would take to achieve the same return using the competing vehicle. We display the amount needed to achieve the same return in the column based on the updated risk-free interest rate. This amount, along with the difference in value, would give the investor the ability to analyze the asking price of the sample peer-to-peer loan on the secondary market.
Table 6.
How fluctuations in rates should change the value of a peer-to-peer loan.
4. Conclusions—Establishing a Robust Secondary Market for Peer-to-Peer Loans
Pricing for peer-to-peer loans after initial funding on the primary market requires standardized valuation methods that can be utilized by a willing asset-purchasing peer. Prices can and will fluctuate as overall environmental changes occur in the lending space. This work builds upon the extensive existing literature on the potential benefits of peer-to-peer lending. This study shows the relevance and need for transactions beyond the primary market. In establishing a secondary peer-to-peer market in which a peer lender has an additional optional exit strategy, we make the lending experience more flexible for those that provide funding.
Yes, there is a method for pricing a peer-to-peer loan presented in this work. The formula provided contributes a basis for calculating the value of a peer-to-peer loan by using the standard attributes featured in all loans. In using the already established loan qualities as parameters for the formula, we show that the method can be deployed in peer-to-peer lending platforms that have existing loans with lenders that may desire to sell, or investors seeking to purchase assets. When analyzing funding requests on the peer-to-peer lending platform, the predictive capabilities of machine learning can be utilized to decide to lend, but without a viable secondary market, there is more pressure to make the right choice.
There are limitations in our research that pose some challenges and lead to areas for future work. One limitation is the access to relevant information about existing secondary markets in the peer-to-peer space. We found that there are countless platforms globally that provide peer-to-peer lending at the primary transactional level. Any information about secondary markets on these platforms was opaque at best. We listed any information we found on secondary markets that are either active or defunct in Table 1, but we are limited to the availability of published information on the existence of these secondary markets. There may very well be a thriving secondary market on a particular peer-to-peer lending platform not listed here, but access to information about this platform was not widely available. Thus, an assumption made in this research is that one of the reasons we found it difficult to find information on active popular secondary markets for peer-to-peer loans is due to a lack of proper standardized valuation methods for transactions to occur beyond the primary platform. Another limitation to our research is that each locality will have its own economic variables. Interest rates for one jurisdiction may be drastically different from another, creating issues for participants.
The method presented allows investors to adapt to changes in the lending environment. There are external factors that can update the rates for new debt that comes about after the most recent rate change. These external factors that change rates also have an impact on the perception of existing debt. This perception only matters if there is a transaction that can occur on this asset via the secondary market. We must price in the change in perception using a method that is not subjective, but based on mathematical, repeatable, and transparent rules. The presented method can provide an enhancement to existing secondary market trade through transparency. Transparency is required for both the participants involved in the transaction and for those needing to interpret the method. Such transparency through published methods encourages future work that would establish standardization. This work presents a method derived from long-standing existing practices for valuing debt instruments but applies the practice to a neglected segment of the financial space in peer-to-peer lending. The contribution is a benefit to the fintech arena because it can lead to more participation in peer-to-peer lending, increase lending opportunities for individuals, and provide revenue for online peer-to-peer lending marketplaces.
Author Contributions
Conceptualization, B.N. and S.-C.H.; methodology, D.D.M.; software, D.D.M.; validation, S.-C.H., B.N. and D.D.M.; formal analysis, D.D.M.; investigation, D.D.M.; resources, S.-C.H.; data curation, D.D.M.; writing—original draft preparation, D.D.M.; writing—review and editing, S.-C.H., B.N. and D.D.M.; visualization, B.N.; supervision, B.N. and S.-C.H.; project administration, B.N. and S.-C.H. All authors have read and agreed to the published version of the manuscript.
Funding
This research received no external funding.
Data Availability Statement
Publicly available datasets were analyzed in this study. This data can be found here: https://www.kaggle.com/datasets/ethon0426/lending-club-20072020q1 (accessed on 22 April 2024).
Conflicts of Interest
The authors declare no conflict of interest.
References
- Babaei, Golnoosh, and Shahrooz Bamdad. 2020. A Multi-Objective Instance-Based Decision Support System for Investment Recommendation in Peer-to-Peer Lending. Expert Systems with Applications 150: 113278. [Google Scholar] [CrossRef]
- Berg, Tobias, Valentin Burg, Ana Gombović, and Manju Puri. 2020. On the Rise of Fintechs: Credit Scoring Using Digital Footprints. The Review of Financial Studies 33: 2845–97. [Google Scholar] [CrossRef]
- Boiko Ferreira, Luis Eduardo, Jean Paul Barddal, Heitor Murilo Gomes, and Fabrício Enembreck. 2017. Improving Credit Risk Prediction in Online Peer-To-Peer (P2P) Lending Using Imbalanced Learning Techniques. Paper presented at 2017 IEEE 29th International Conference on Tools with ArtificialIntelligence (ICTAI), Boston, MA, USA, November 6–8. [Google Scholar]
- Caglayan, Mustafa, Tho Pham, Oleksandr Talavera, and Xiong Xiong. 2020. Asset mispricing in peer-to-peer loan secondary markets. Journal of Corporate Finance 65: 101769. [Google Scholar] [CrossRef]
- Chen, Pei-Fen, Shihmin Lo, and Hai-Yuan Tang. 2022. What if Borrowers Stop Paying Their Loans? Investors’ Rates of Return on a Peer-to-peer Lending Platform. International Review of Economics and Finance 77: 359–77. [Google Scholar] [CrossRef]
- Chen, Yen-Ru, Jenq-Shiou Leu, Sheng-An Huang, Jui-Tang Wang, and Jun-Ichi Takada. 2021. Predicting Default Risk on Peer-to-Peer Lending Imbalanced Datasets. IEEE Access 9: 73103–9. [Google Scholar] [CrossRef]
- Fitzpatrick, Trevor, and Christophe Mues. 2021. How Can Lenders Prosper? Comparing Machine Learning Approaches to Identify Profitable Peer-to-Peer Loan Investments. European Journal of Operational Research 294: 711–22. [Google Scholar] [CrossRef]
- Galema, Rients. 2020. Credit rationing in P2P lending to SMEs: Do lender-borrower relationships matter? Journal of Corporate Finance 64: 101742. [Google Scholar] [CrossRef]
- Guo, Yanhong, Wenjun Zhou, Chunyu Luo, Chuanren Liu, and Hui Xiong. 2016. Instance-based credit risk assessment for investment decisions in P2P lending. European Journal of Operational Research 249: 417–26. [Google Scholar] [CrossRef]
- Harvey, Stephen. 2018. Lending Club Lending Club’s Note Trading Platform Facade: An Examination of P2P Secondary Market Inefficiency. Dayton: Economics & Finance. University of Dayton. Available online: https://ecommons.udayton.edu/uhp_theses/199 (accessed on 1 May 2024).
- Havrylchyk, Olena, and Marianne Verdier. 2018. The financial intermediation role of the P2P lending platforms. Comparative Economic Studies 60: 115–30. [Google Scholar] [CrossRef]
- Herzenstein, Michal, Utpal M. Dholakia, and Rick L. Andrews. 2010. Strategic Herding Behavior in Peer-to-Peer Loan Auctions. Journal of Interactive Marketing 25: 27–36. [Google Scholar] [CrossRef]
- Holden, Craig W., Mingfeng Lin, Kai Lu, Jan Schneemeier, Zaiyan Wei, and Jun Yang. 2023. The Effect of Secondary Market Closure on Primary Market Liquidity: Evidence from Peer-to-Peer Lending. Rochester: Social Science Research Network. Available online: https://ssrn.com/abstract=3502006 (accessed on 22 April 2024).
- Huang, Yiping, Xiang Li, and Chu Wang. 2020. What does peer-to-peer lending evidence say about the Risk-Taking Channel of monetary policy? Journal of Corporate Finance 66: 101845. [Google Scholar] [CrossRef]
- Kaminskyi, Andrii, Maryna Nehrey, Vitalina Babenko, and Grzegorz Zimon. 2022. Model of Optimizing Correspondence Risk-Return Marketing. Journal of Risk and Financial Management 15: 583. [Google Scholar] [CrossRef]
- Kholidah, Himmatul, Hanifiyah Yuliatul Hijriah, Imron Mawardi, Nurul Huda, Sri Herianingrum, and Bani Alkausar. 2022. A Bibliometric mapping of peer-to-peer lending research based on economic and business perspective. Heliyon 8: 11512. [Google Scholar] [CrossRef] [PubMed]
- Kim, Ji-Yoon, and Sung-Bae Cho. 2019. Towards repayment prediction in Peer-to-Peer social lending using deep learning. Mathematics 7: 1041. [Google Scholar] [CrossRef]
- Kriebel, Johannes, and Lennart Stitz. 2022. Credit Default Prediction from User-Generated Text in Peer-to-Peer Lending using Deep Learning. European Journal of Operational Research 302: 309–23. [Google Scholar] [CrossRef]
- Liu, Zhengchi, Jennifer Shang, Shin-yi Wu, and Pei-yu Chen. 2020. Social Collateral, Soft Information and Online Peer-to-Peer Lending: A Theoretical Model. European Journal of Operational Research 281: 428–38. [Google Scholar] [CrossRef]
- Lukkarinen, Anna, and Armin Schwienbacher. 2022. Secondary market listings in equity crowdfunding: The missing link? Research Policy 52: 104648. [Google Scholar] [CrossRef]
- Ma, Ben-jiang, Zheng-long Zhou, and Feng-ying Hu. 2017. Pricing mechanisms in the online Peer-to-Peer lending market. Electronic Commerce Research and Applications 26: 119–30. [Google Scholar] [CrossRef]
- Ma, Lin, Xi Zhao, Zhili Zhou, and Yuanyuan Liu. 2018. A New Aspect on P2P Online Lending Default Prediction Using Meta-Level Phone Usage Data in China. Decision Support Systems 111: 60–71. [Google Scholar] [CrossRef]
- Maloney, David, Sung-Chul Hong, and Barin N. Nag. 2022. Two Class Bayes Point Machines in Repayment Prediction of Low Credit Borrowers. Heliyon 8: e11479. [Google Scholar] [CrossRef]
- Maloney, David, Sung-Chul Hong, and Barin Nag. 2023. Economic Disruptions in Repayment of Peer Loans. International Journal of Financial Studies 11: 116. [Google Scholar] [CrossRef]
- Oh, Eun Young, and Peter Rosenkranz. 2022. Determinants of peer-to-peer lending expansion: The roles of financial development and financial literacy. The Journal of FinTech 2: 2250001. [Google Scholar] [CrossRef]
- Suryono, Ryan Randy, Betty Purwandari, and Indra Budi. 2019. Peer to Peer (P2P) Lending Problems and Potential Solutions: A Systematic Literature Review. Paper presented at the Fifth Information Systems International Conference 2019, Chongqing, China, November 15–17, vol. 161, pp. 204–14. [Google Scholar]
- Weng, Zhicheng, and Pinliang Luo. 2021. The Impact of Guarantees on Peer-to-Peer Lending Platform: Evolutionary Game Analysis and Empirical Evidence from China. Journal of Theoretical and Applied Electronic Commerce Research 16: 2708–31. [Google Scholar] [CrossRef]
- Yu, Haihong, MengHan Dan, Qingguo Ma, and Jia Jin. 2018. Event Related Potential Evidence of Herding Behavior in Online Peer-to-Peer Lending. Neuroscience Letters 681: 1–5. [Google Scholar] [CrossRef] [PubMed]
- Zanin, Luca. 2020. Combining multiple probability predictions in the presence of class imbalance to discriminate between potential bad and good borrowers in the peer-to-peer lending market. Journal of Behavioral and Experimental Finance 25: 100272. [Google Scholar] [CrossRef]
- Zhou, Yimin, and Xu Wei. 2020. Joint Liability Loans in Online Peer-to-Peer Lending. Finance Research Letters 32: 101076. [Google Scholar] [CrossRef]
Disclaimer/Publisher’s Note: The statements, opinions and data contained in all publications are solely those of the individual author(s) and contributor(s) and not of MDPI and/or the editor(s). MDPI and/or the editor(s) disclaim responsibility for any injury to people or property resulting from any ideas, methods, instructions or products referred to in the content. |
© 2024 by the authors. Licensee MDPI, Basel, Switzerland. This article is an open access article distributed under the terms and conditions of the Creative Commons Attribution (CC BY) license (https://creativecommons.org/licenses/by/4.0/).