

The Impact of Public Environmental Concern on Corporate ESG Performance


Abstract
1. Introduction
2. Theoretical Analysis and Literature Review
2.1. Theoretical Background
2.2. Corporate ESG Performance
2.3. Public Environmental Concern
2.4. Public Environmental Concern and Corporate ESG Performance
3. Data and Methodology
3.1. Data
3.2. Methodology
3.2.1. Artificial Neural Network Model
3.2.2. Regression by ANN with Bootstrapping (RAB) Approach
4. Results and Discussion
4.1. The Impact of Public Environmental Concern on Corporate ESG Performance
4.2. The Driving Factors Behind the Impact of PEC on ESG Performance
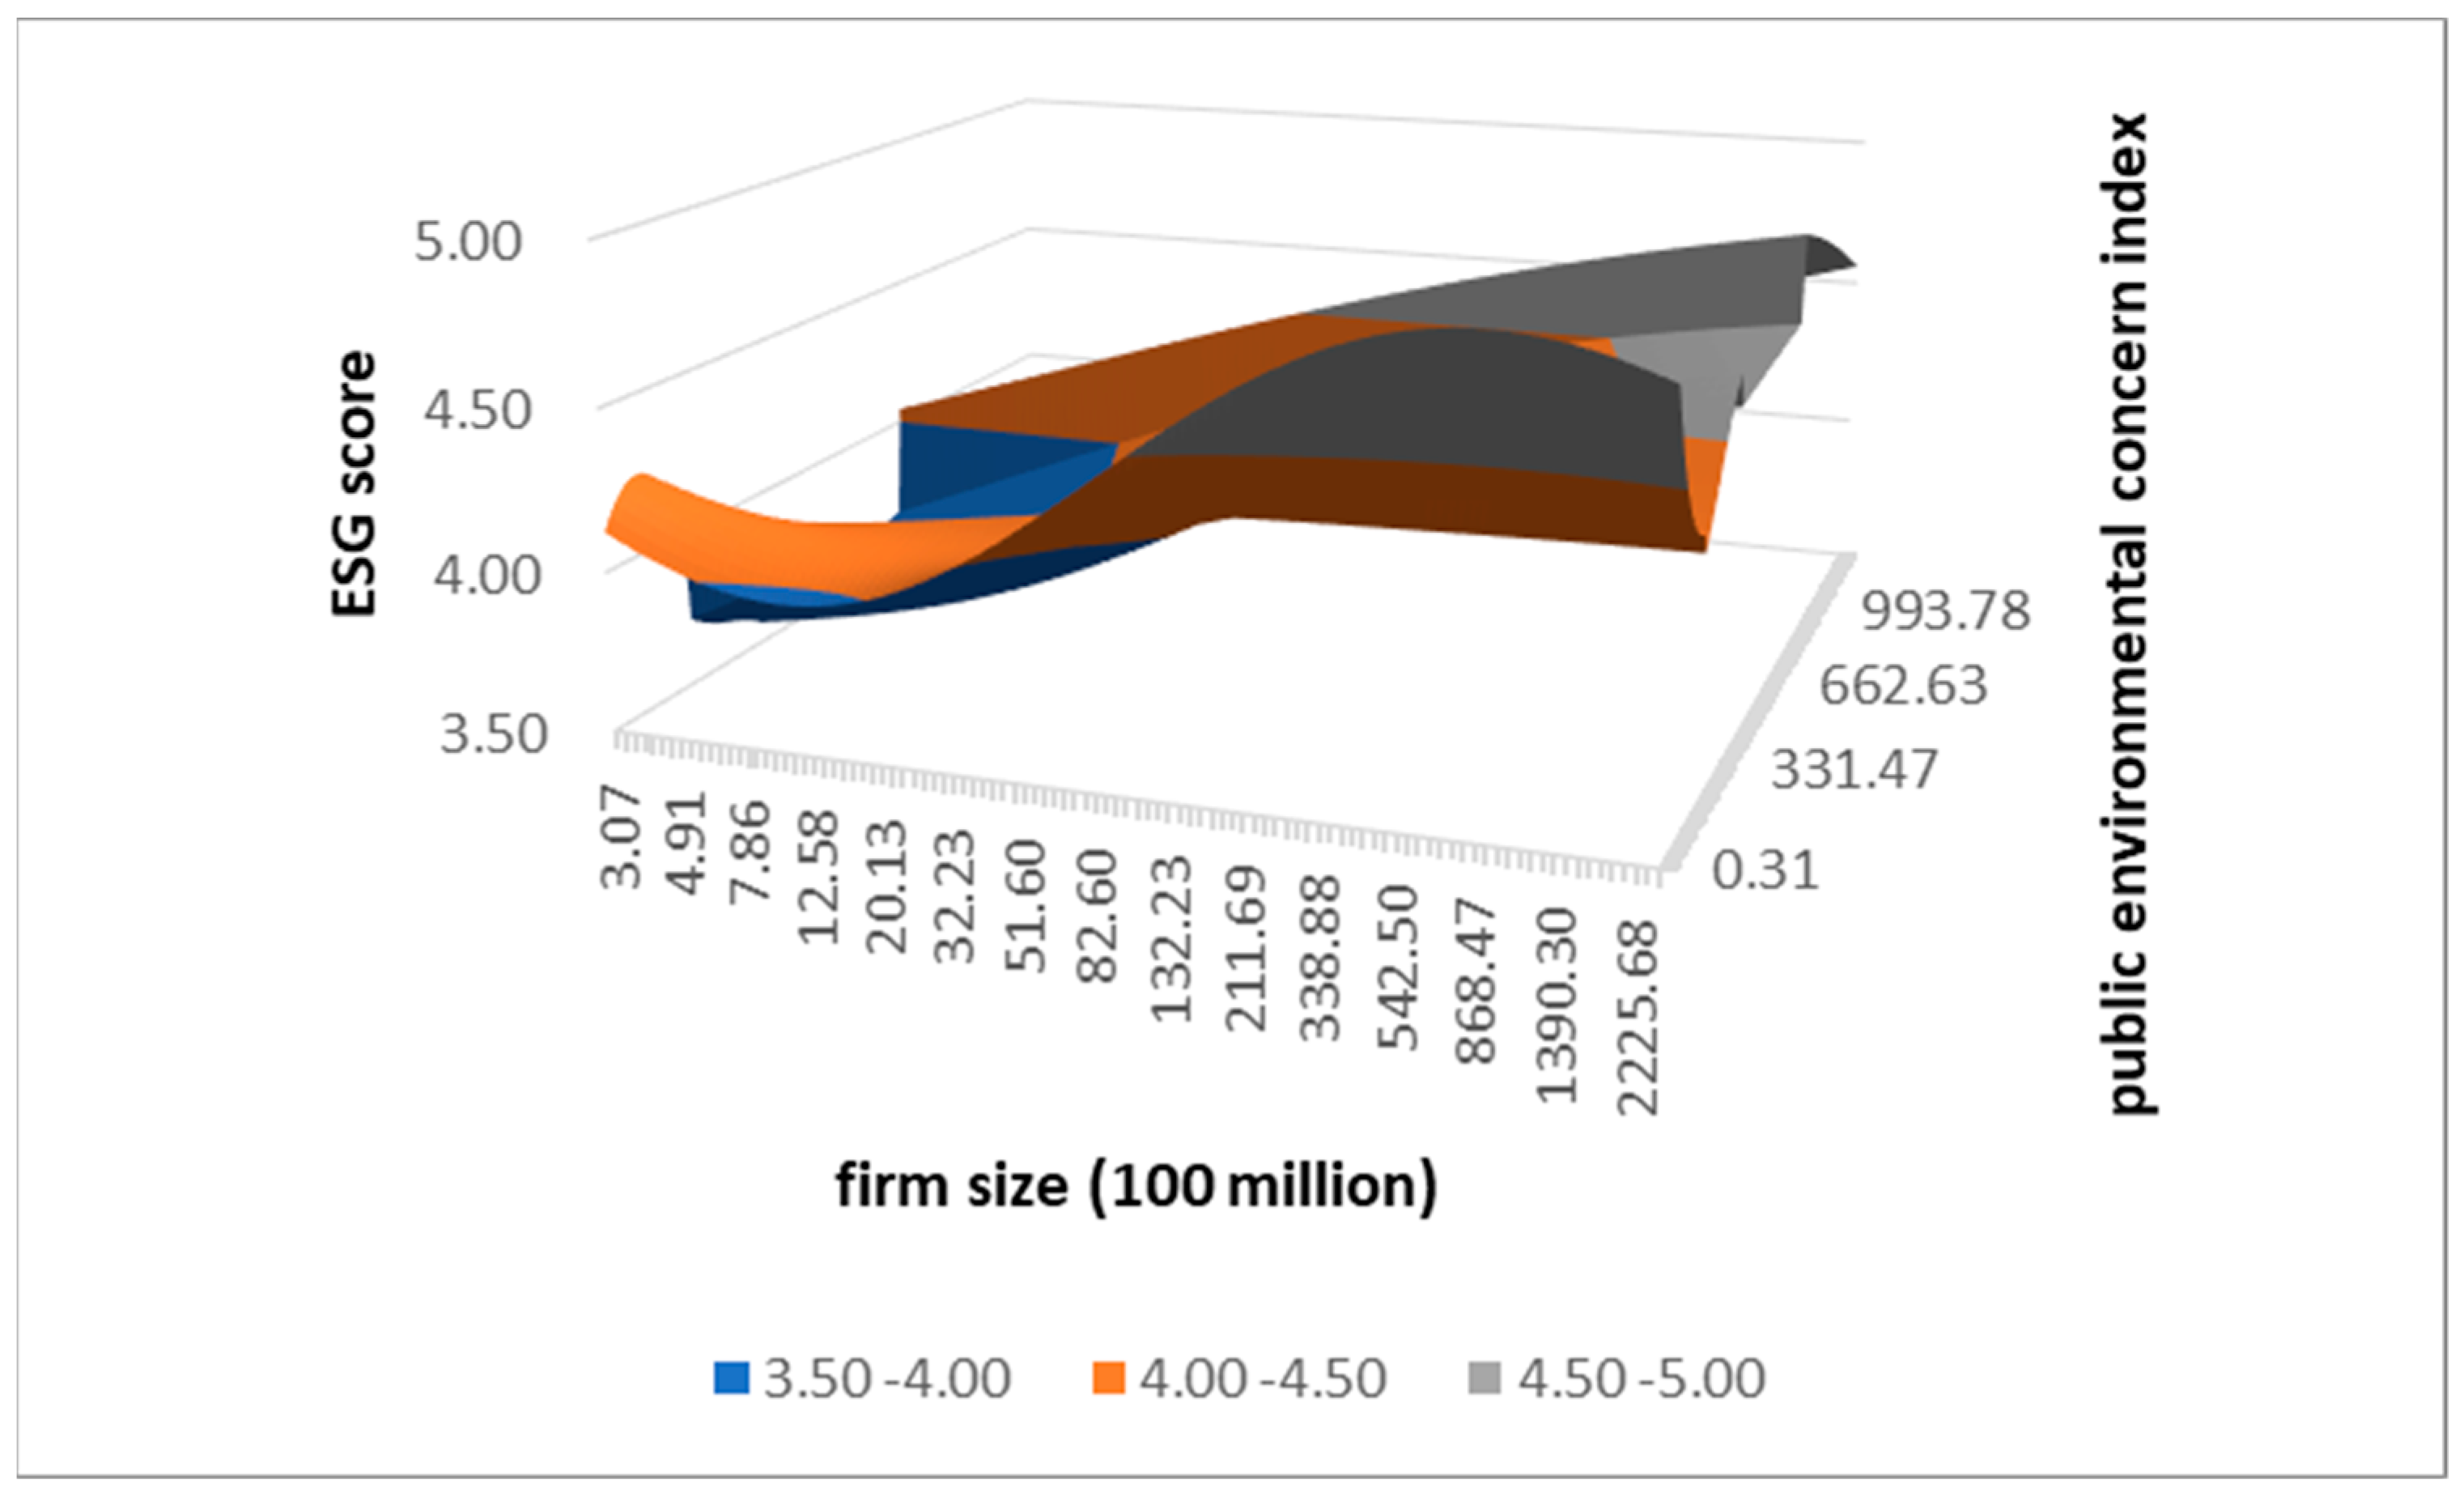
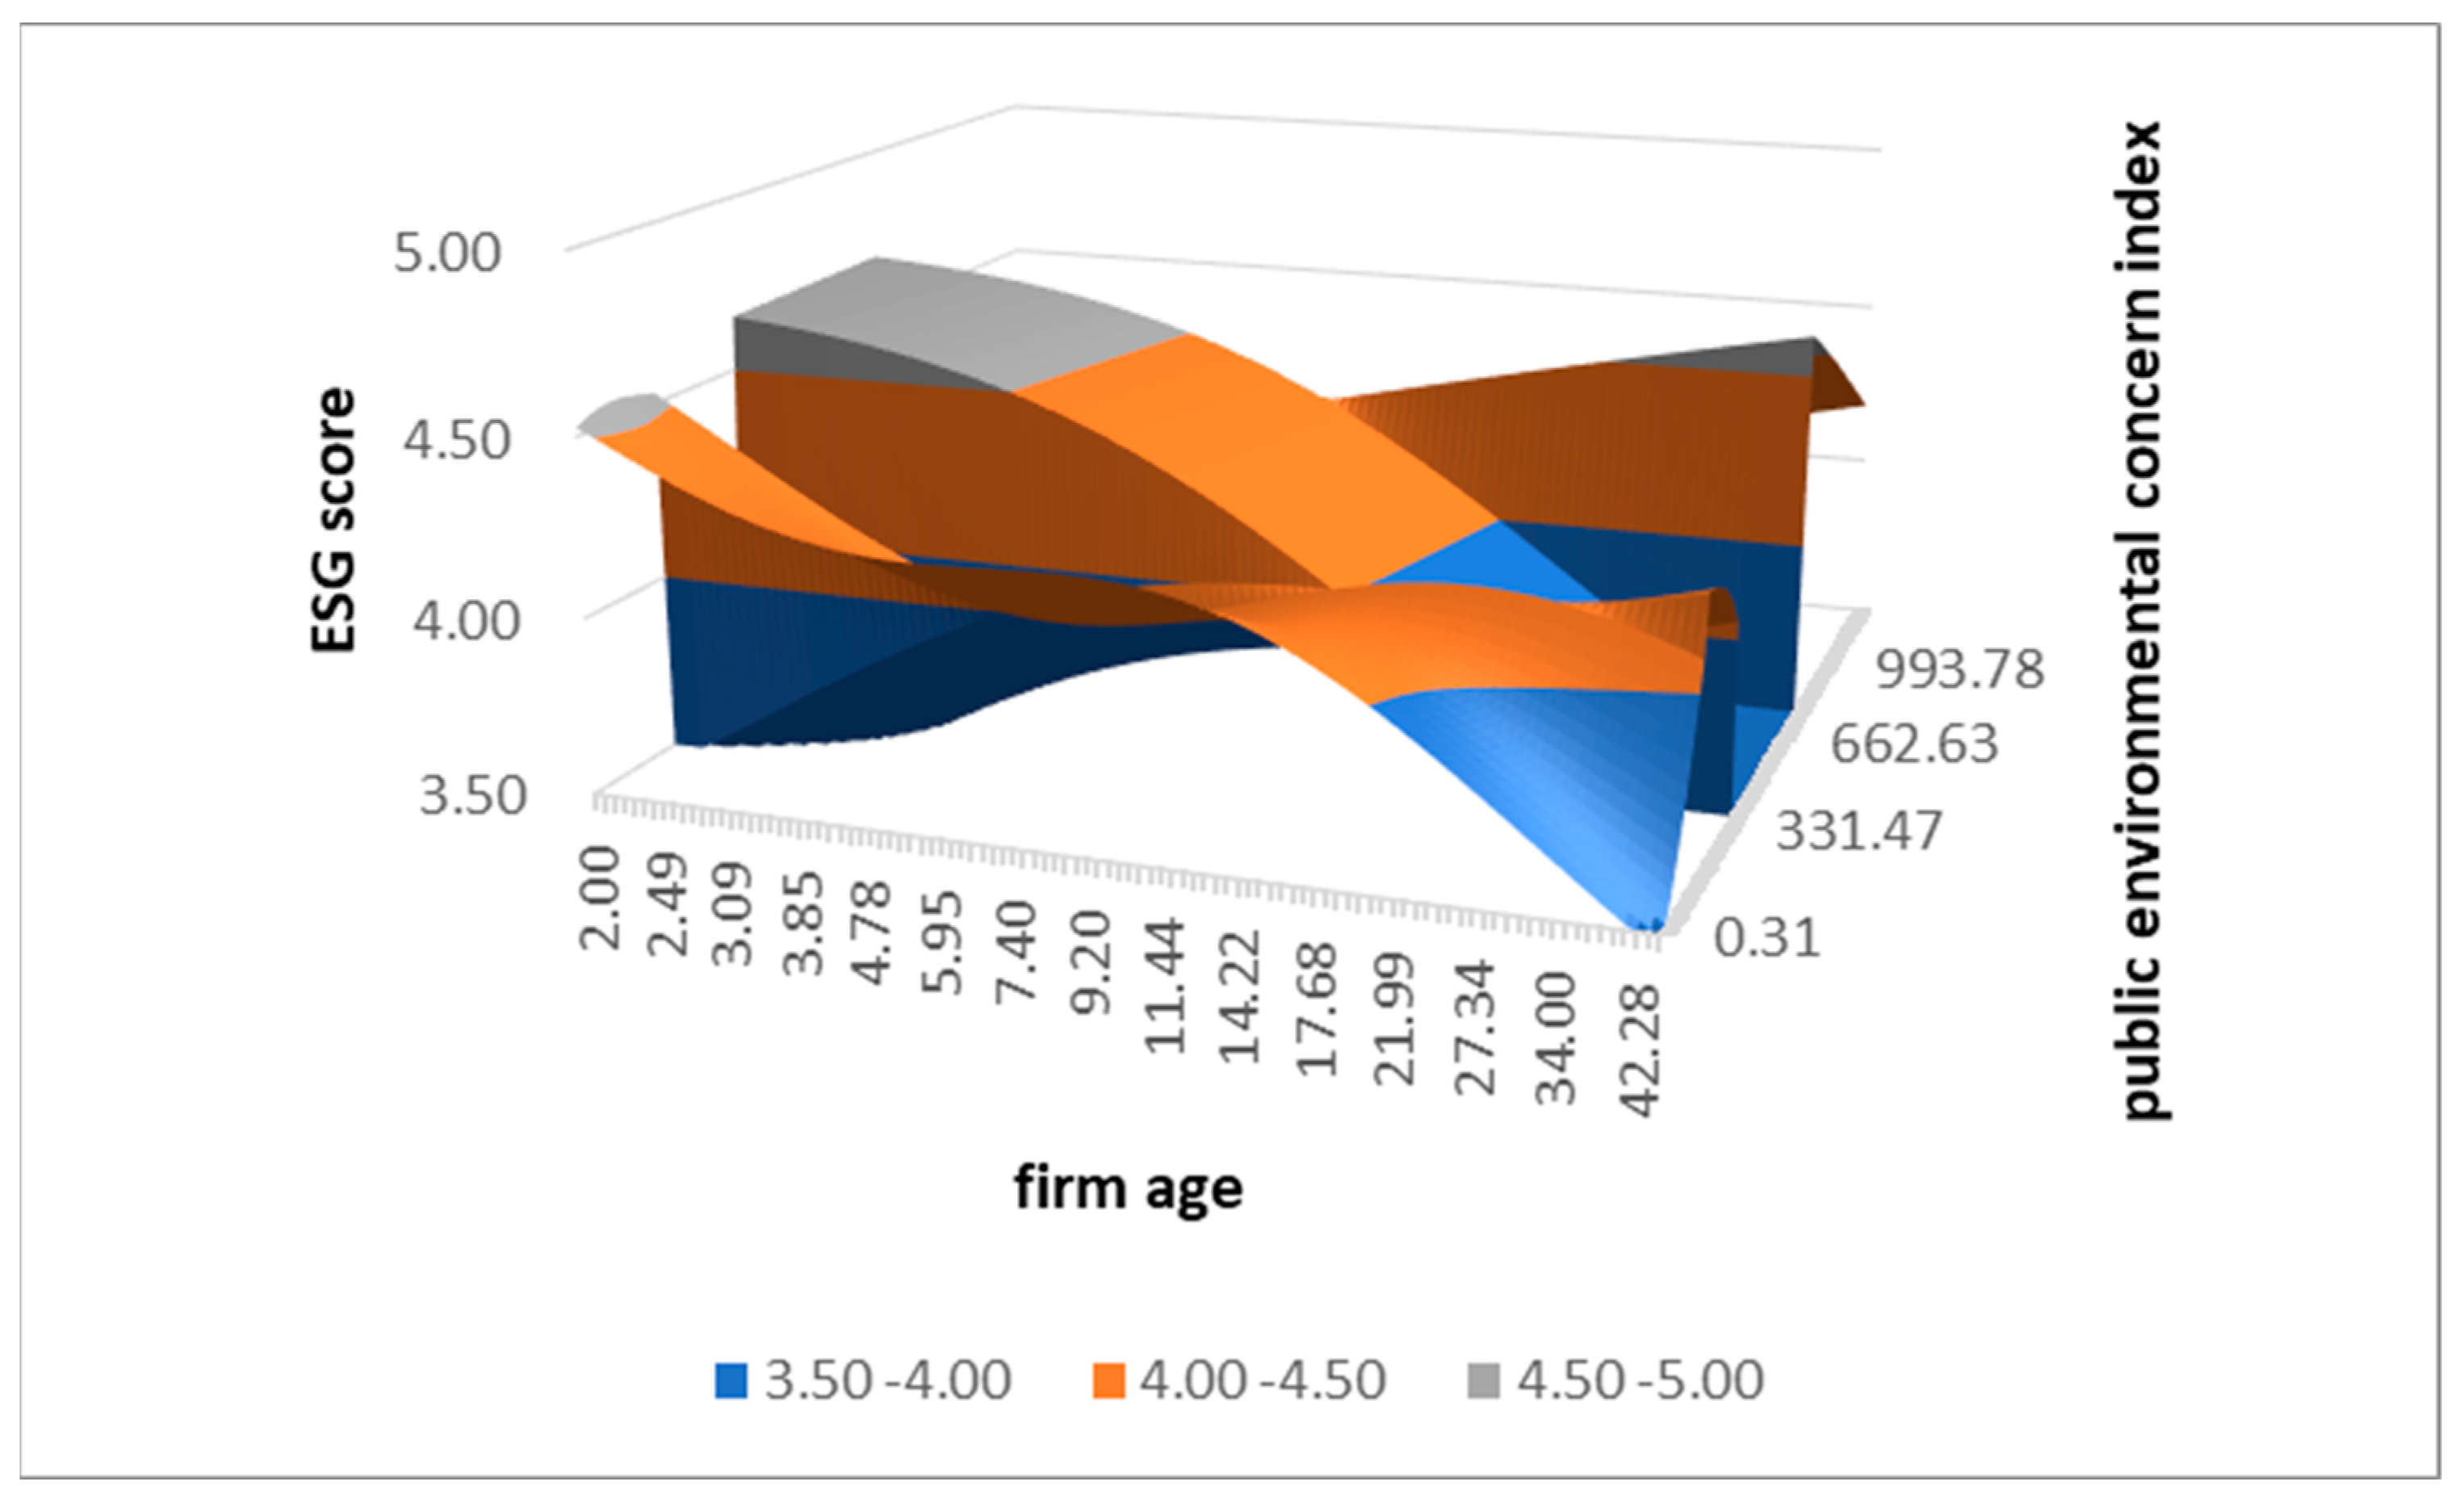
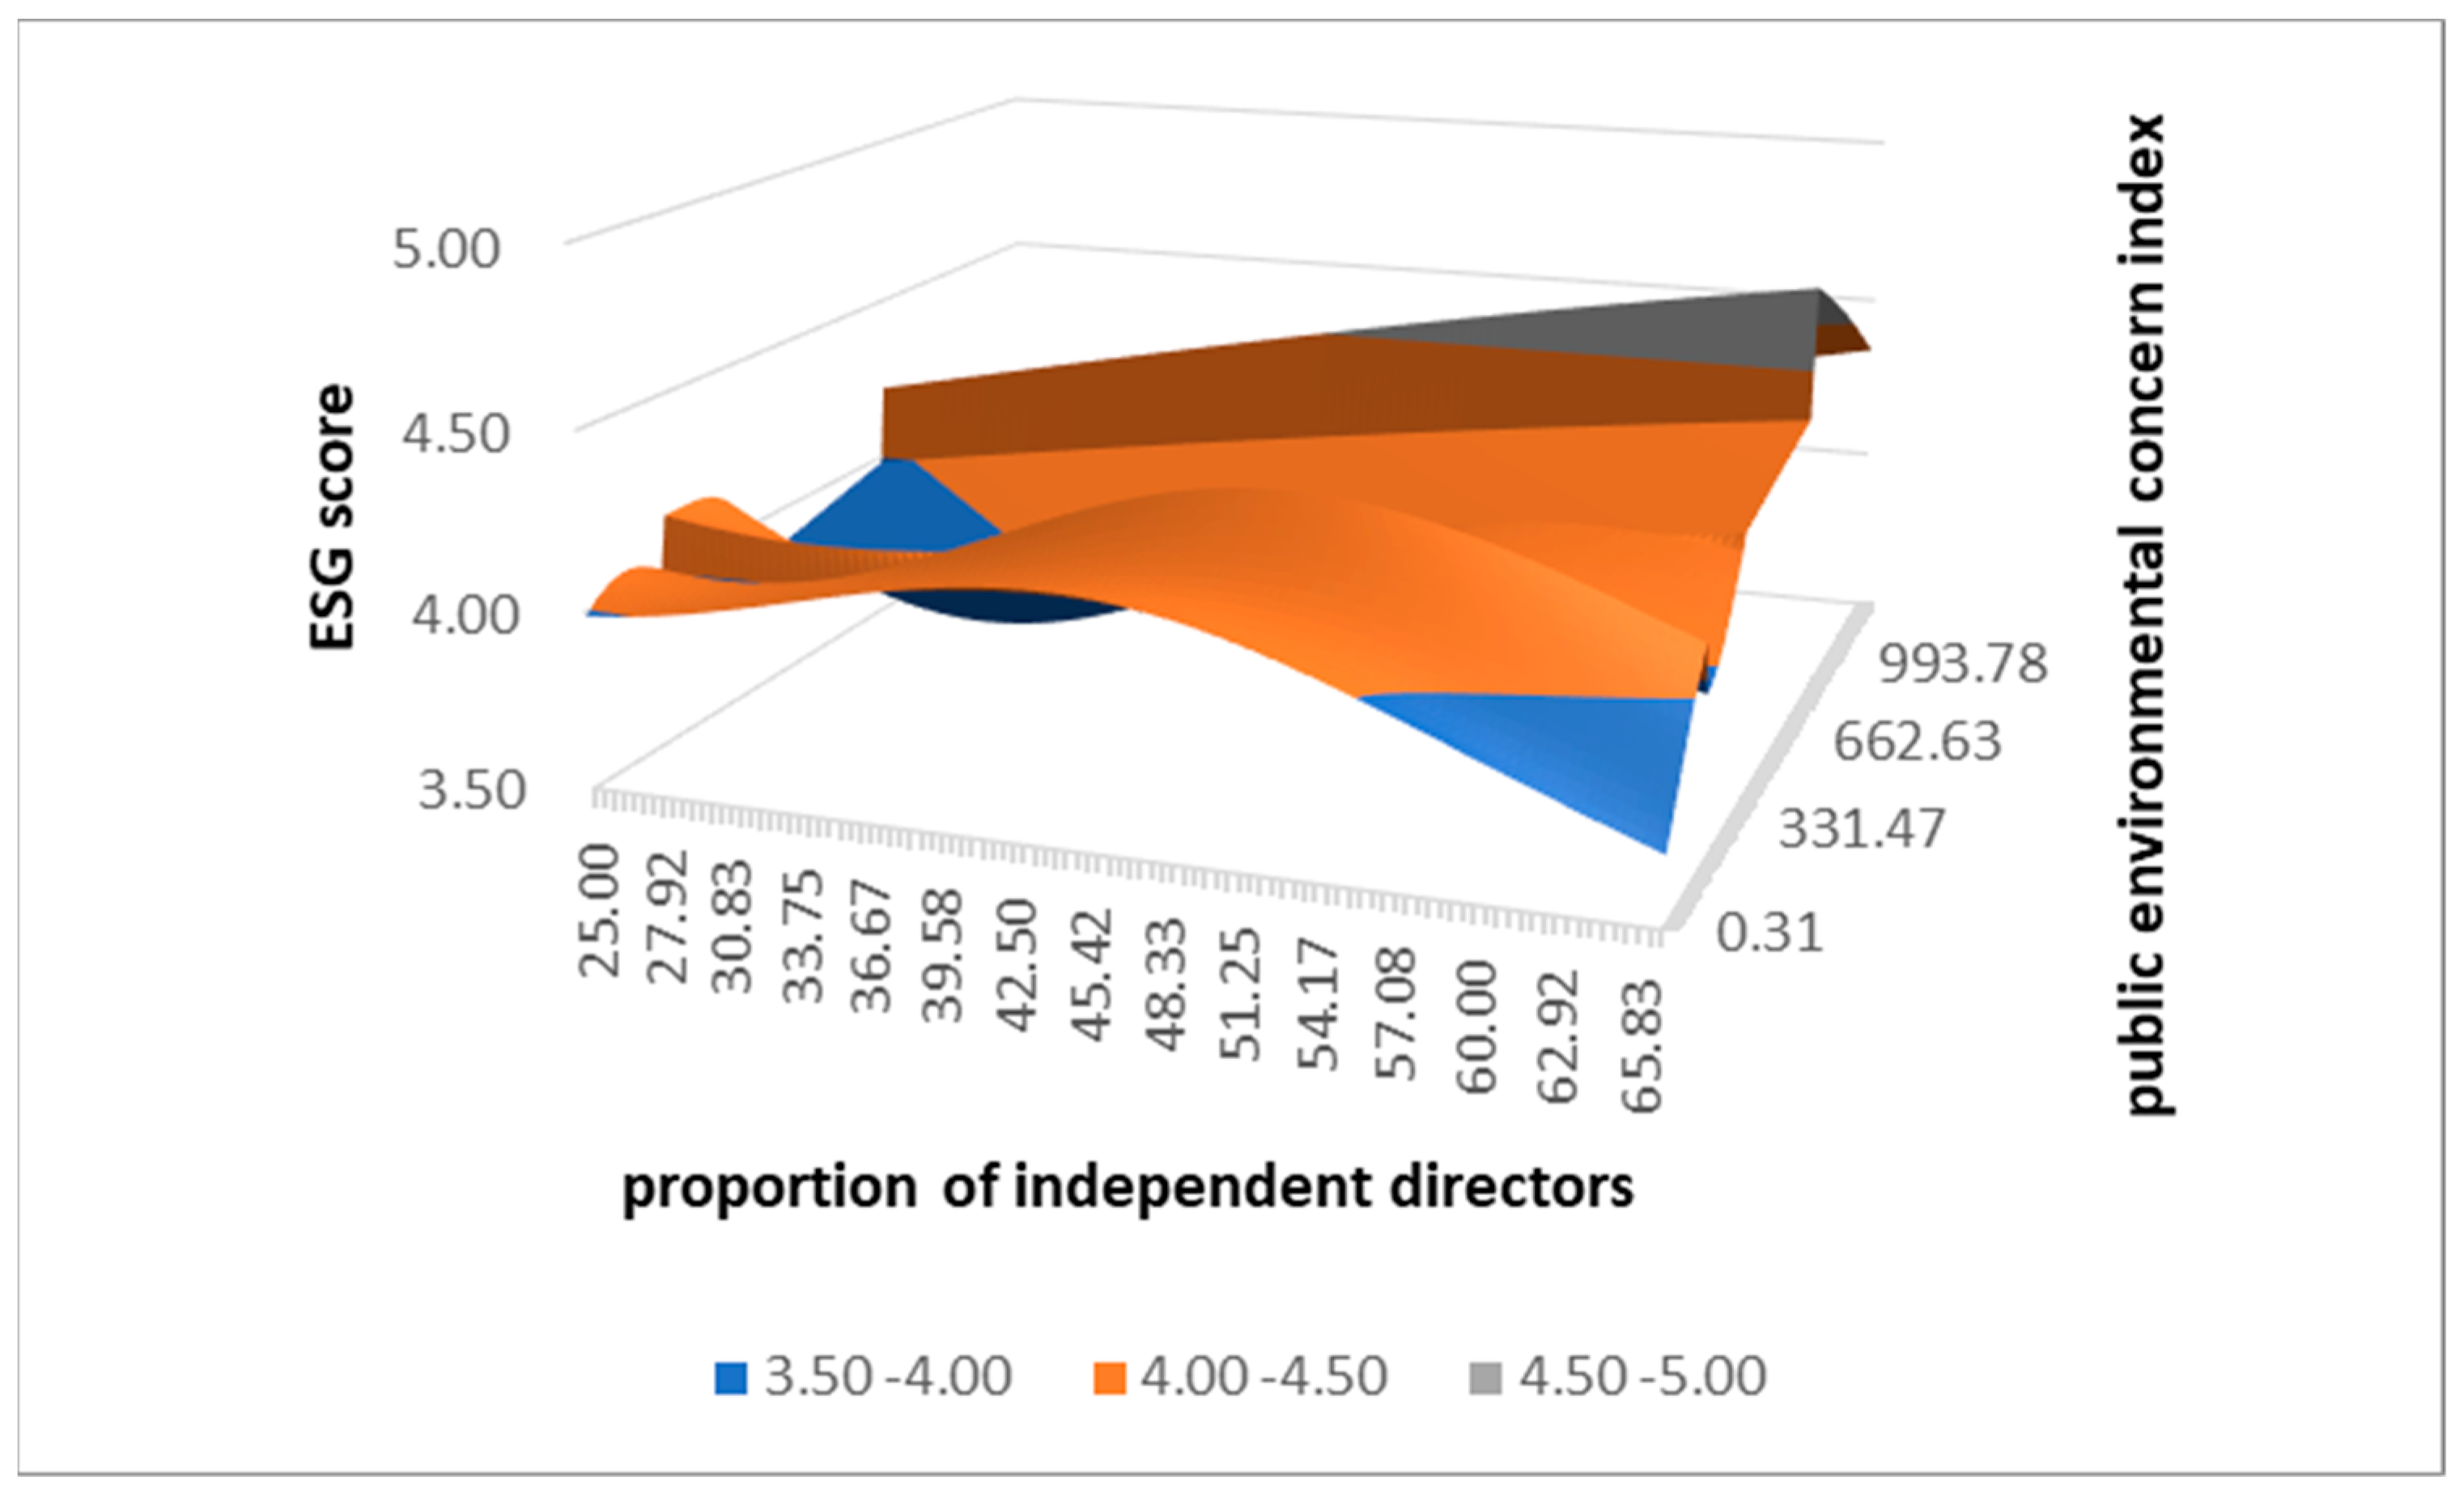
4.2.1. Firm-Specific Indicators
Firm Size
Firm Age
SOEs or POEs
Proportion of Independent Directors
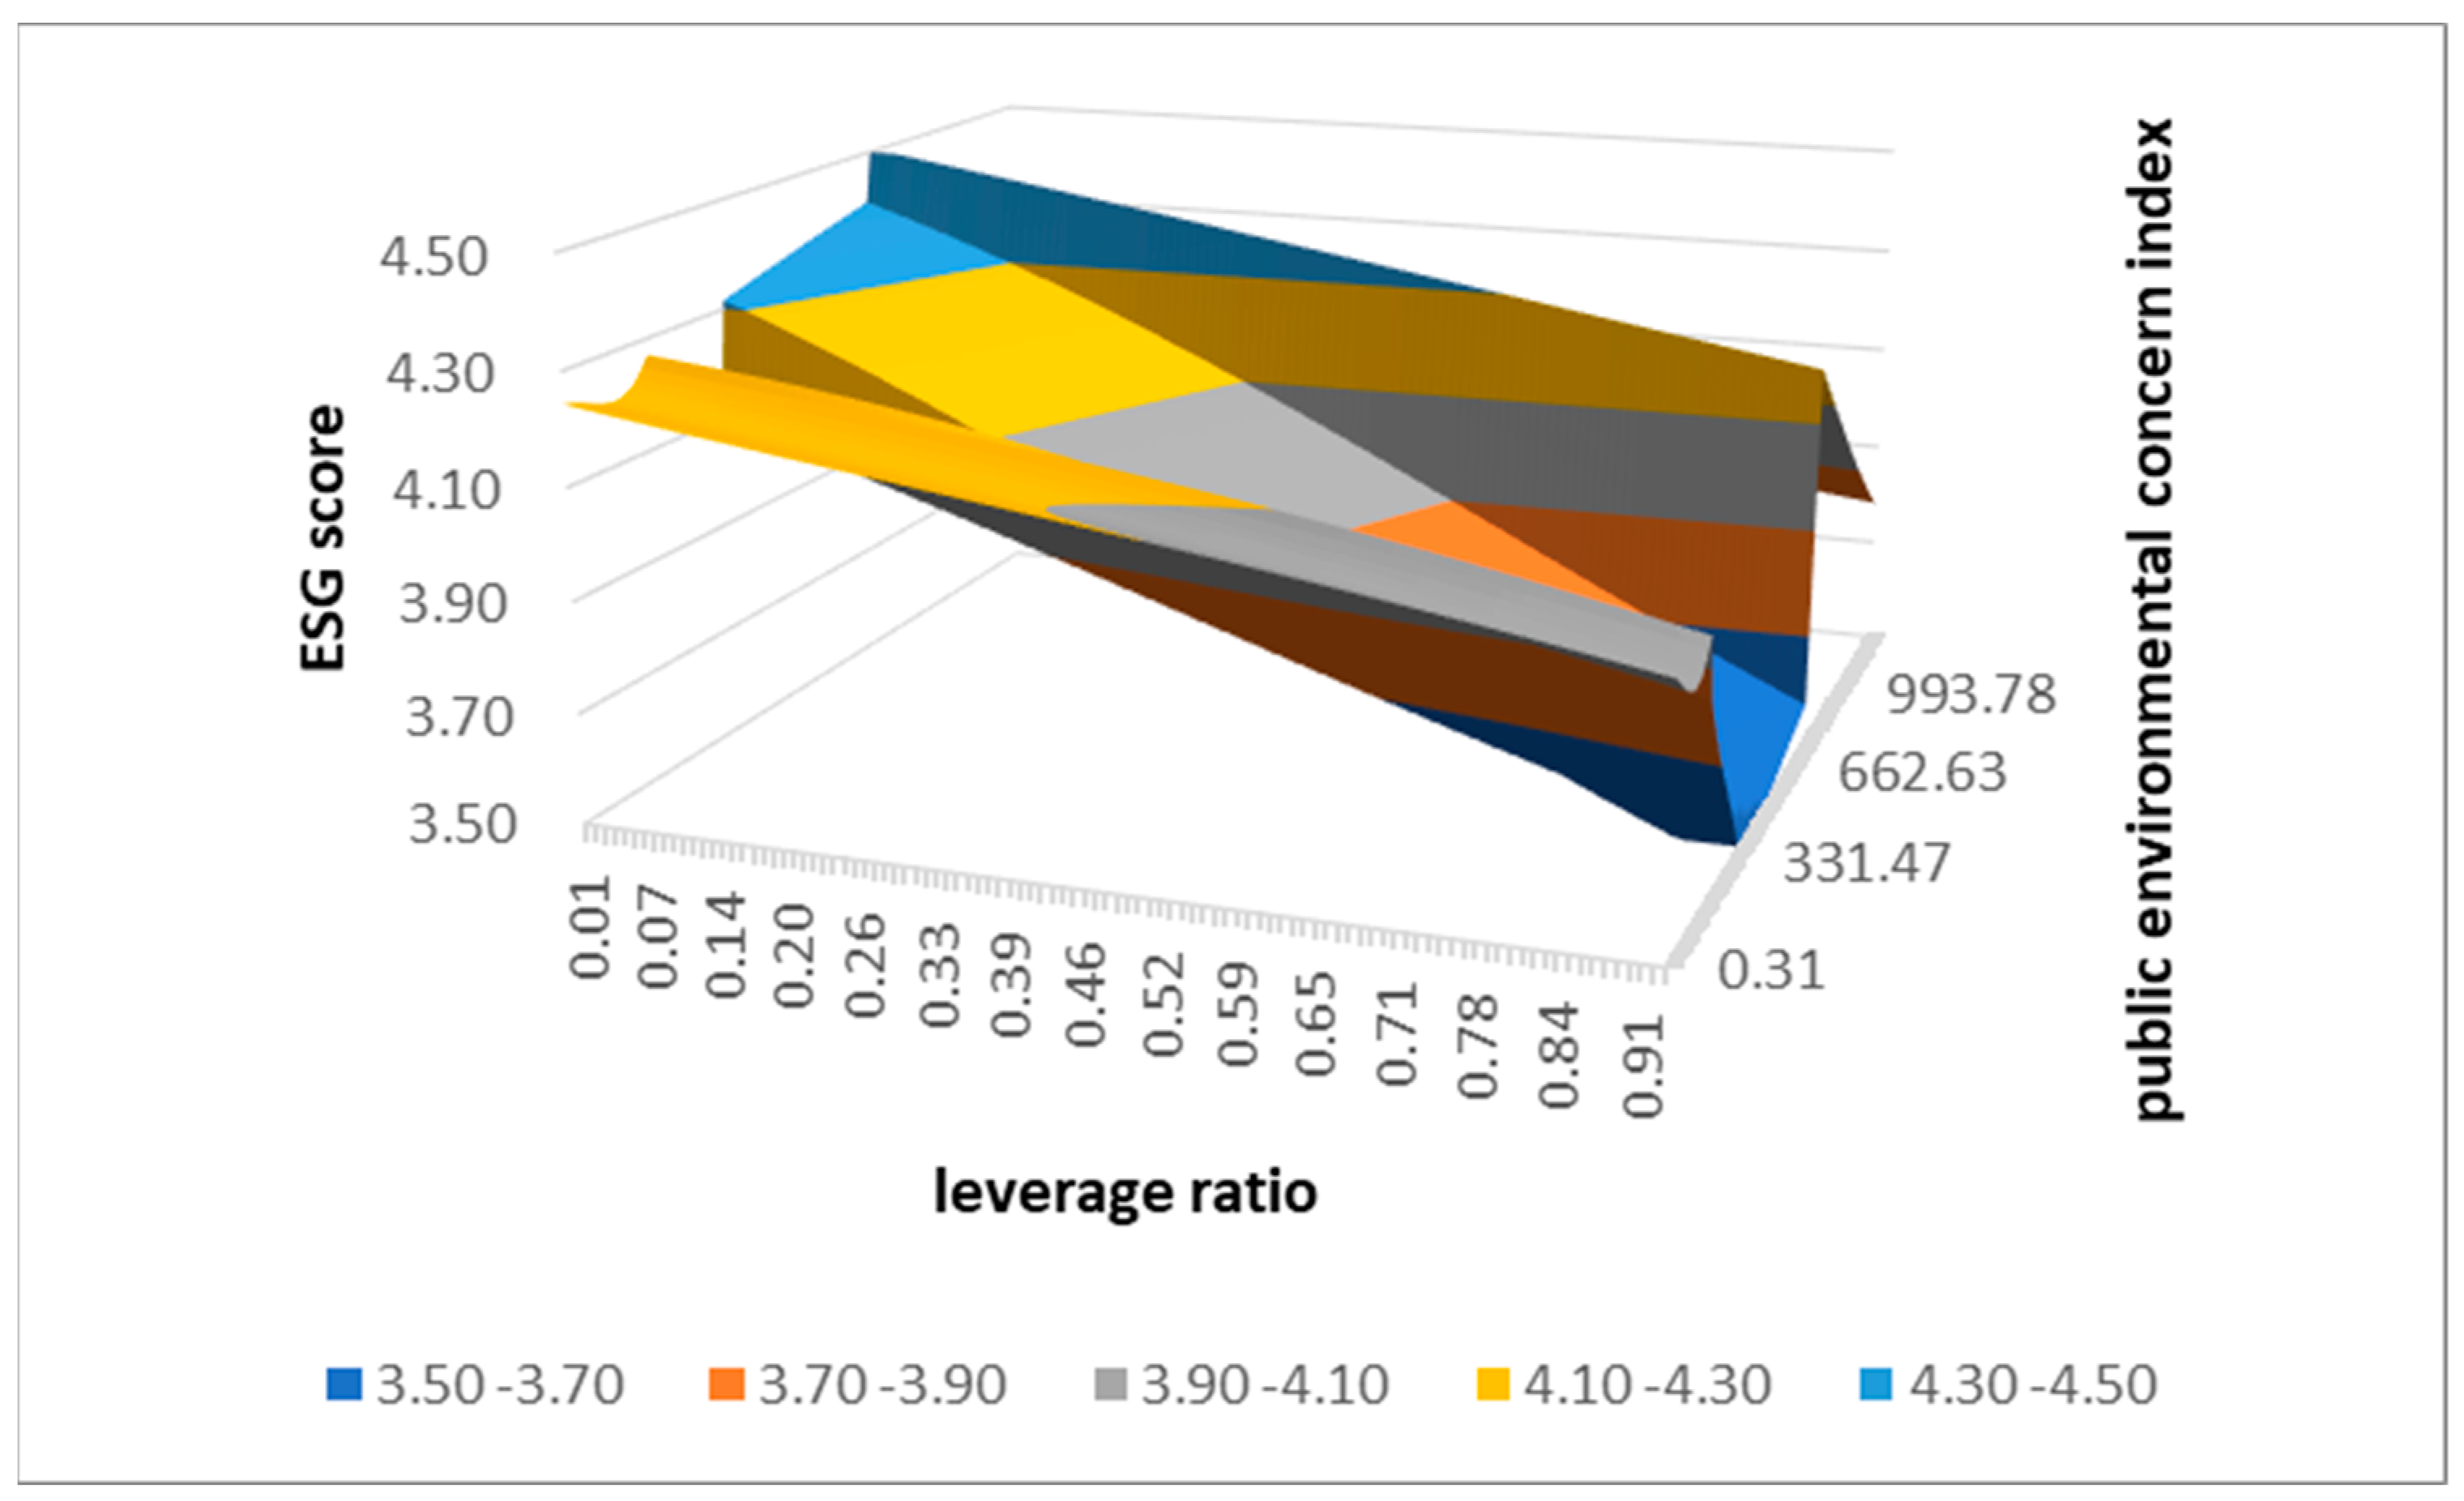
4.2.2. Firm Stability Indicators
Leverage Ratio
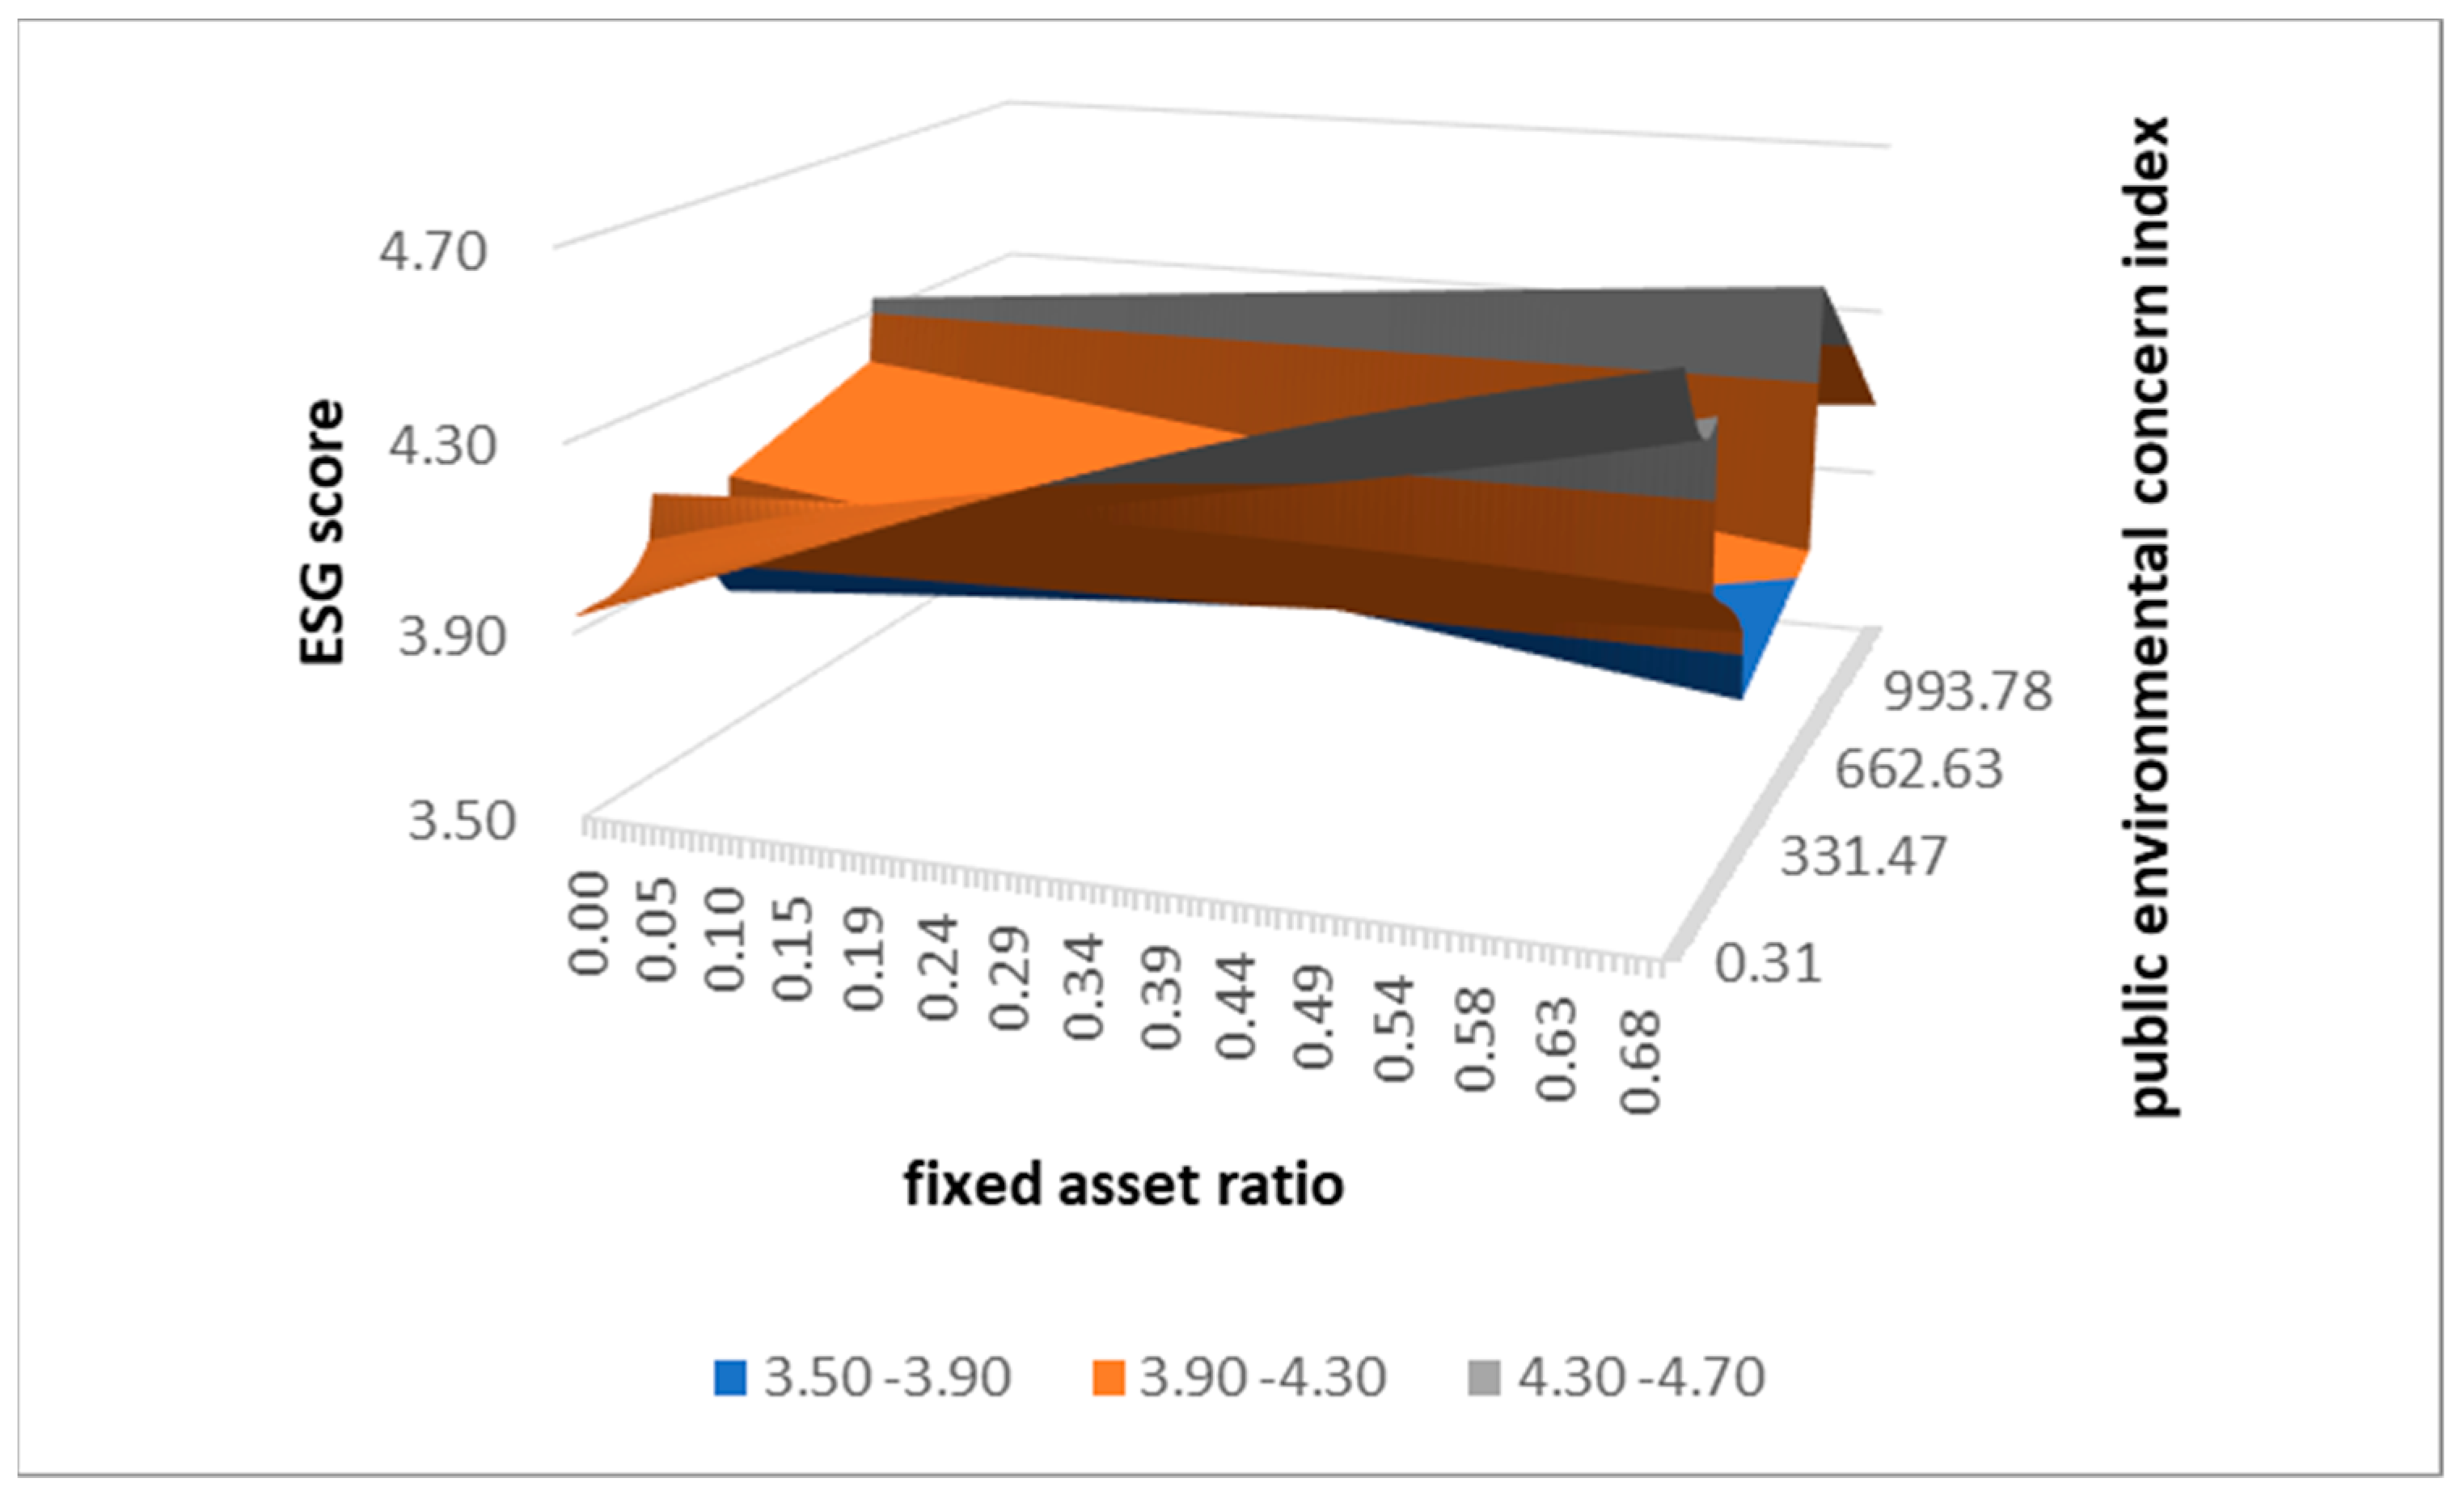
Fixed Asset Ratio
4.2.3. Firm Profitability Indicators
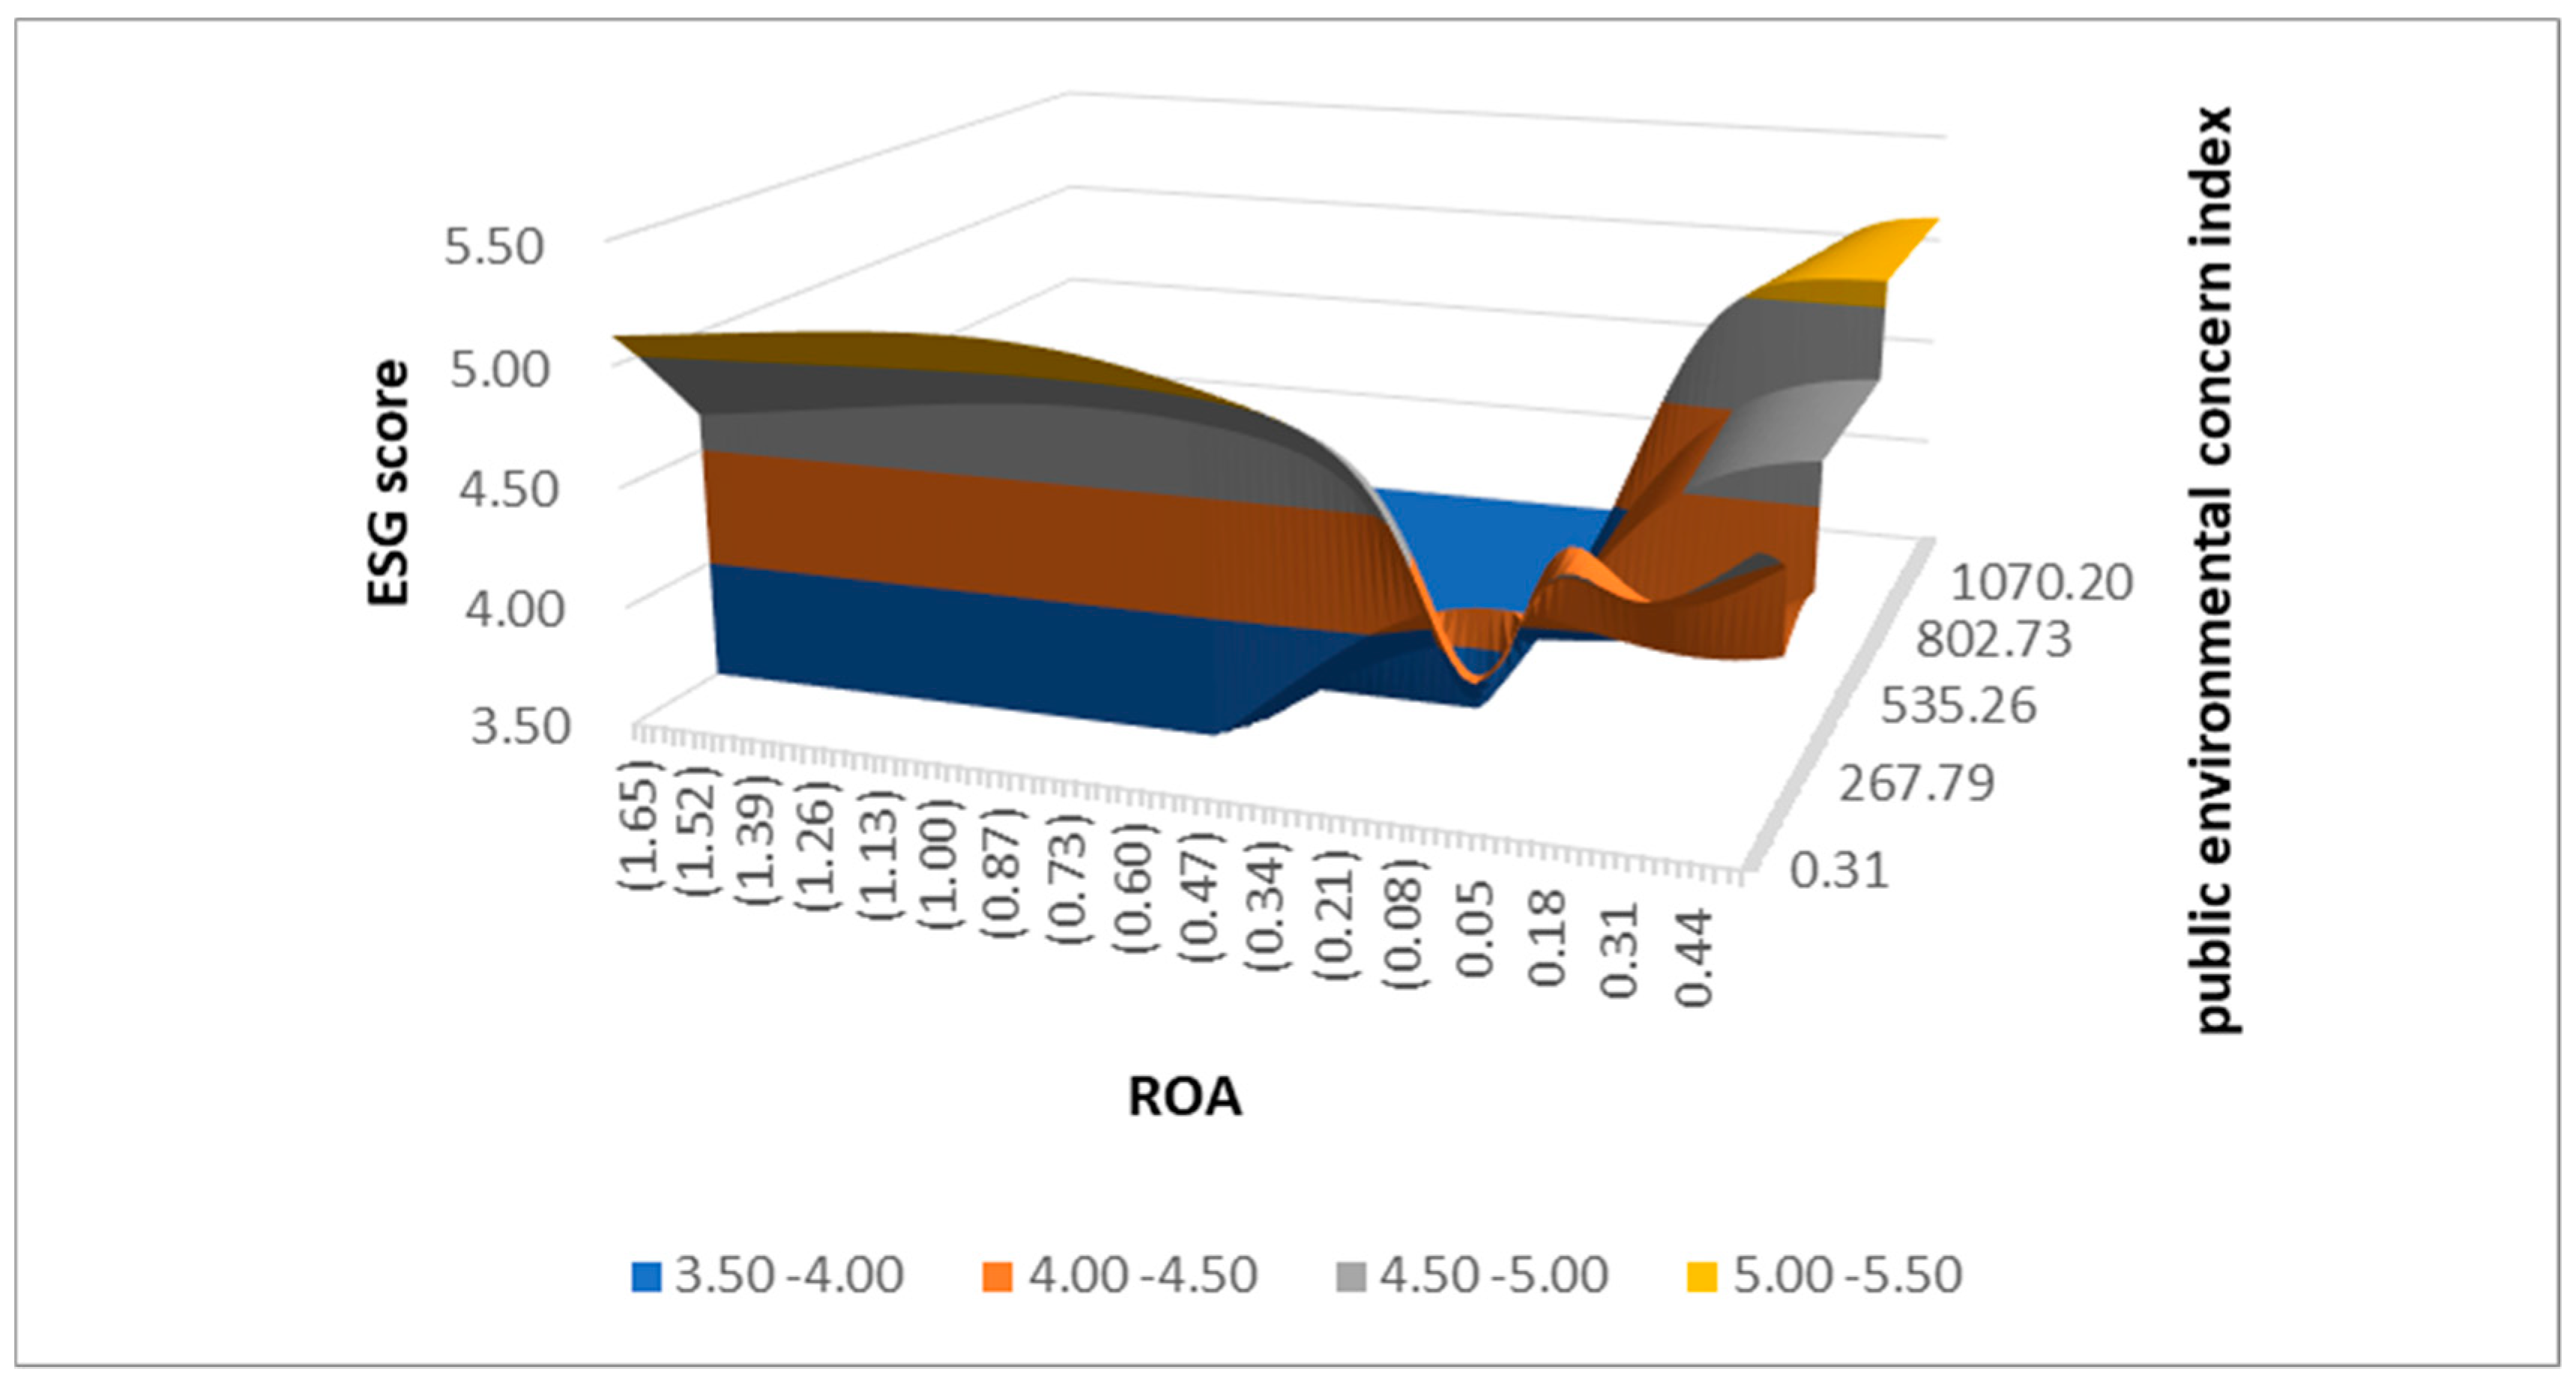
Return on Assets (ROAs)
Return on Equity (ROE)
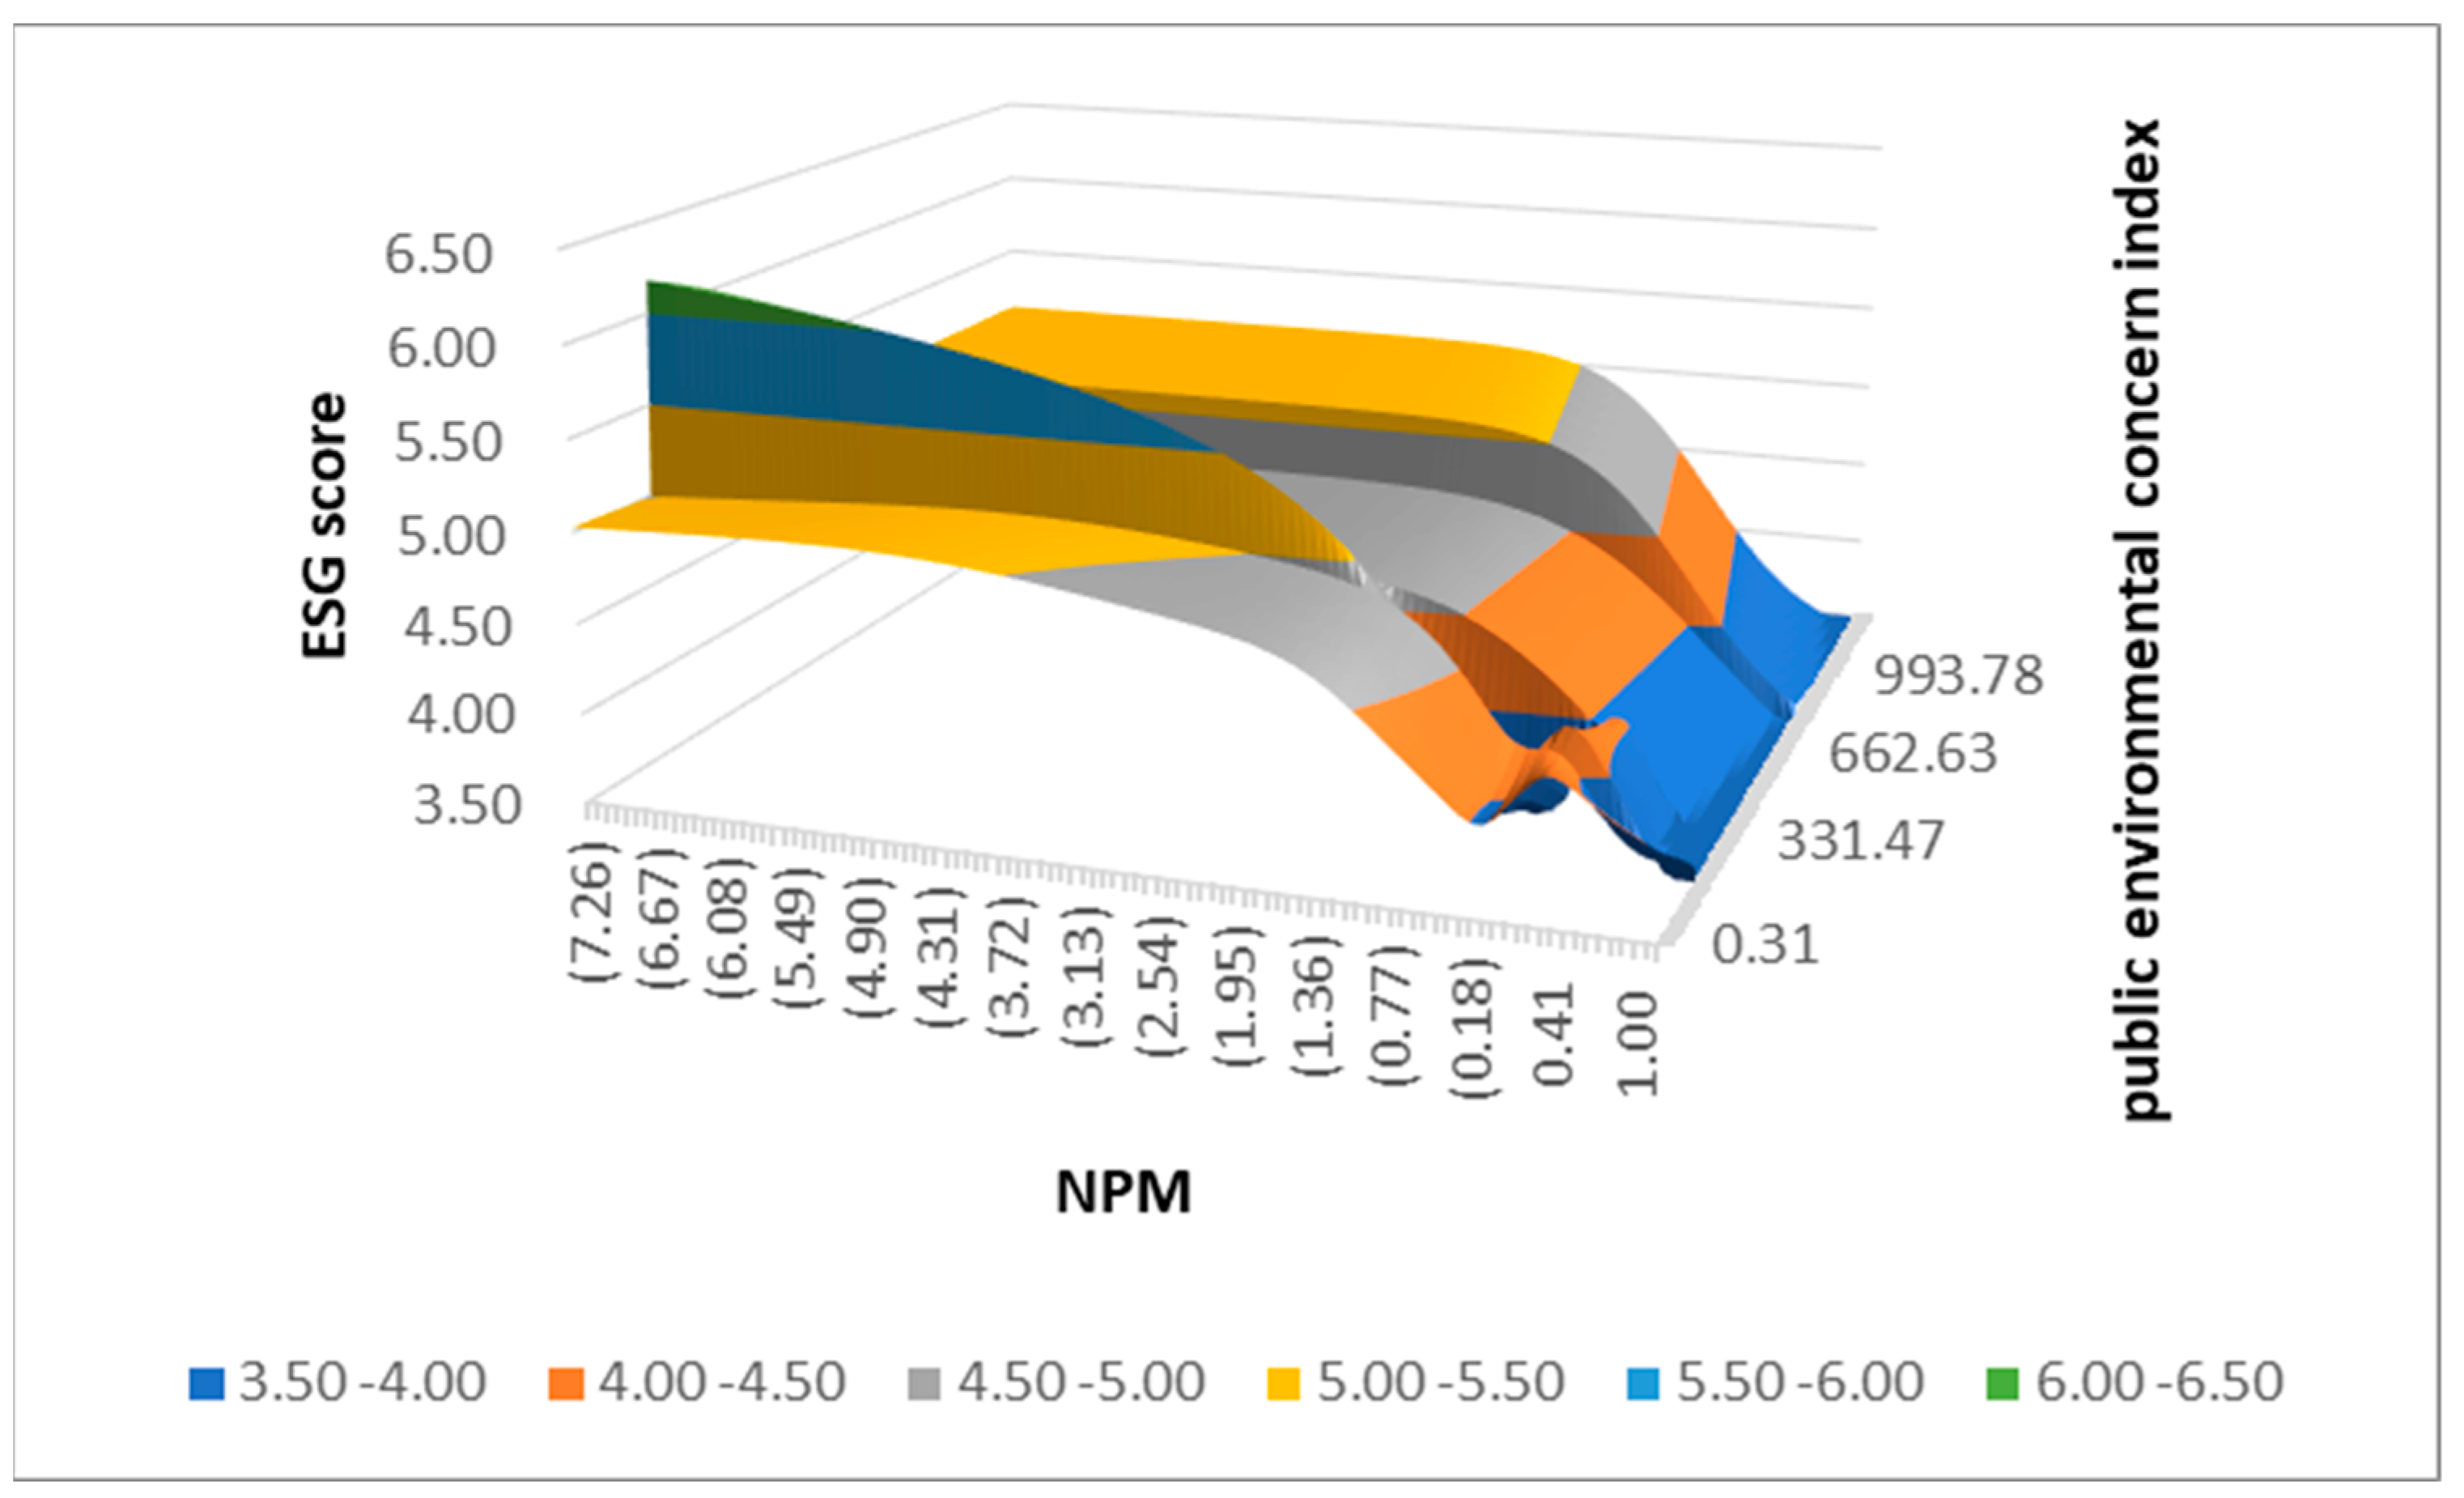
Net Profit Margin (NPM)
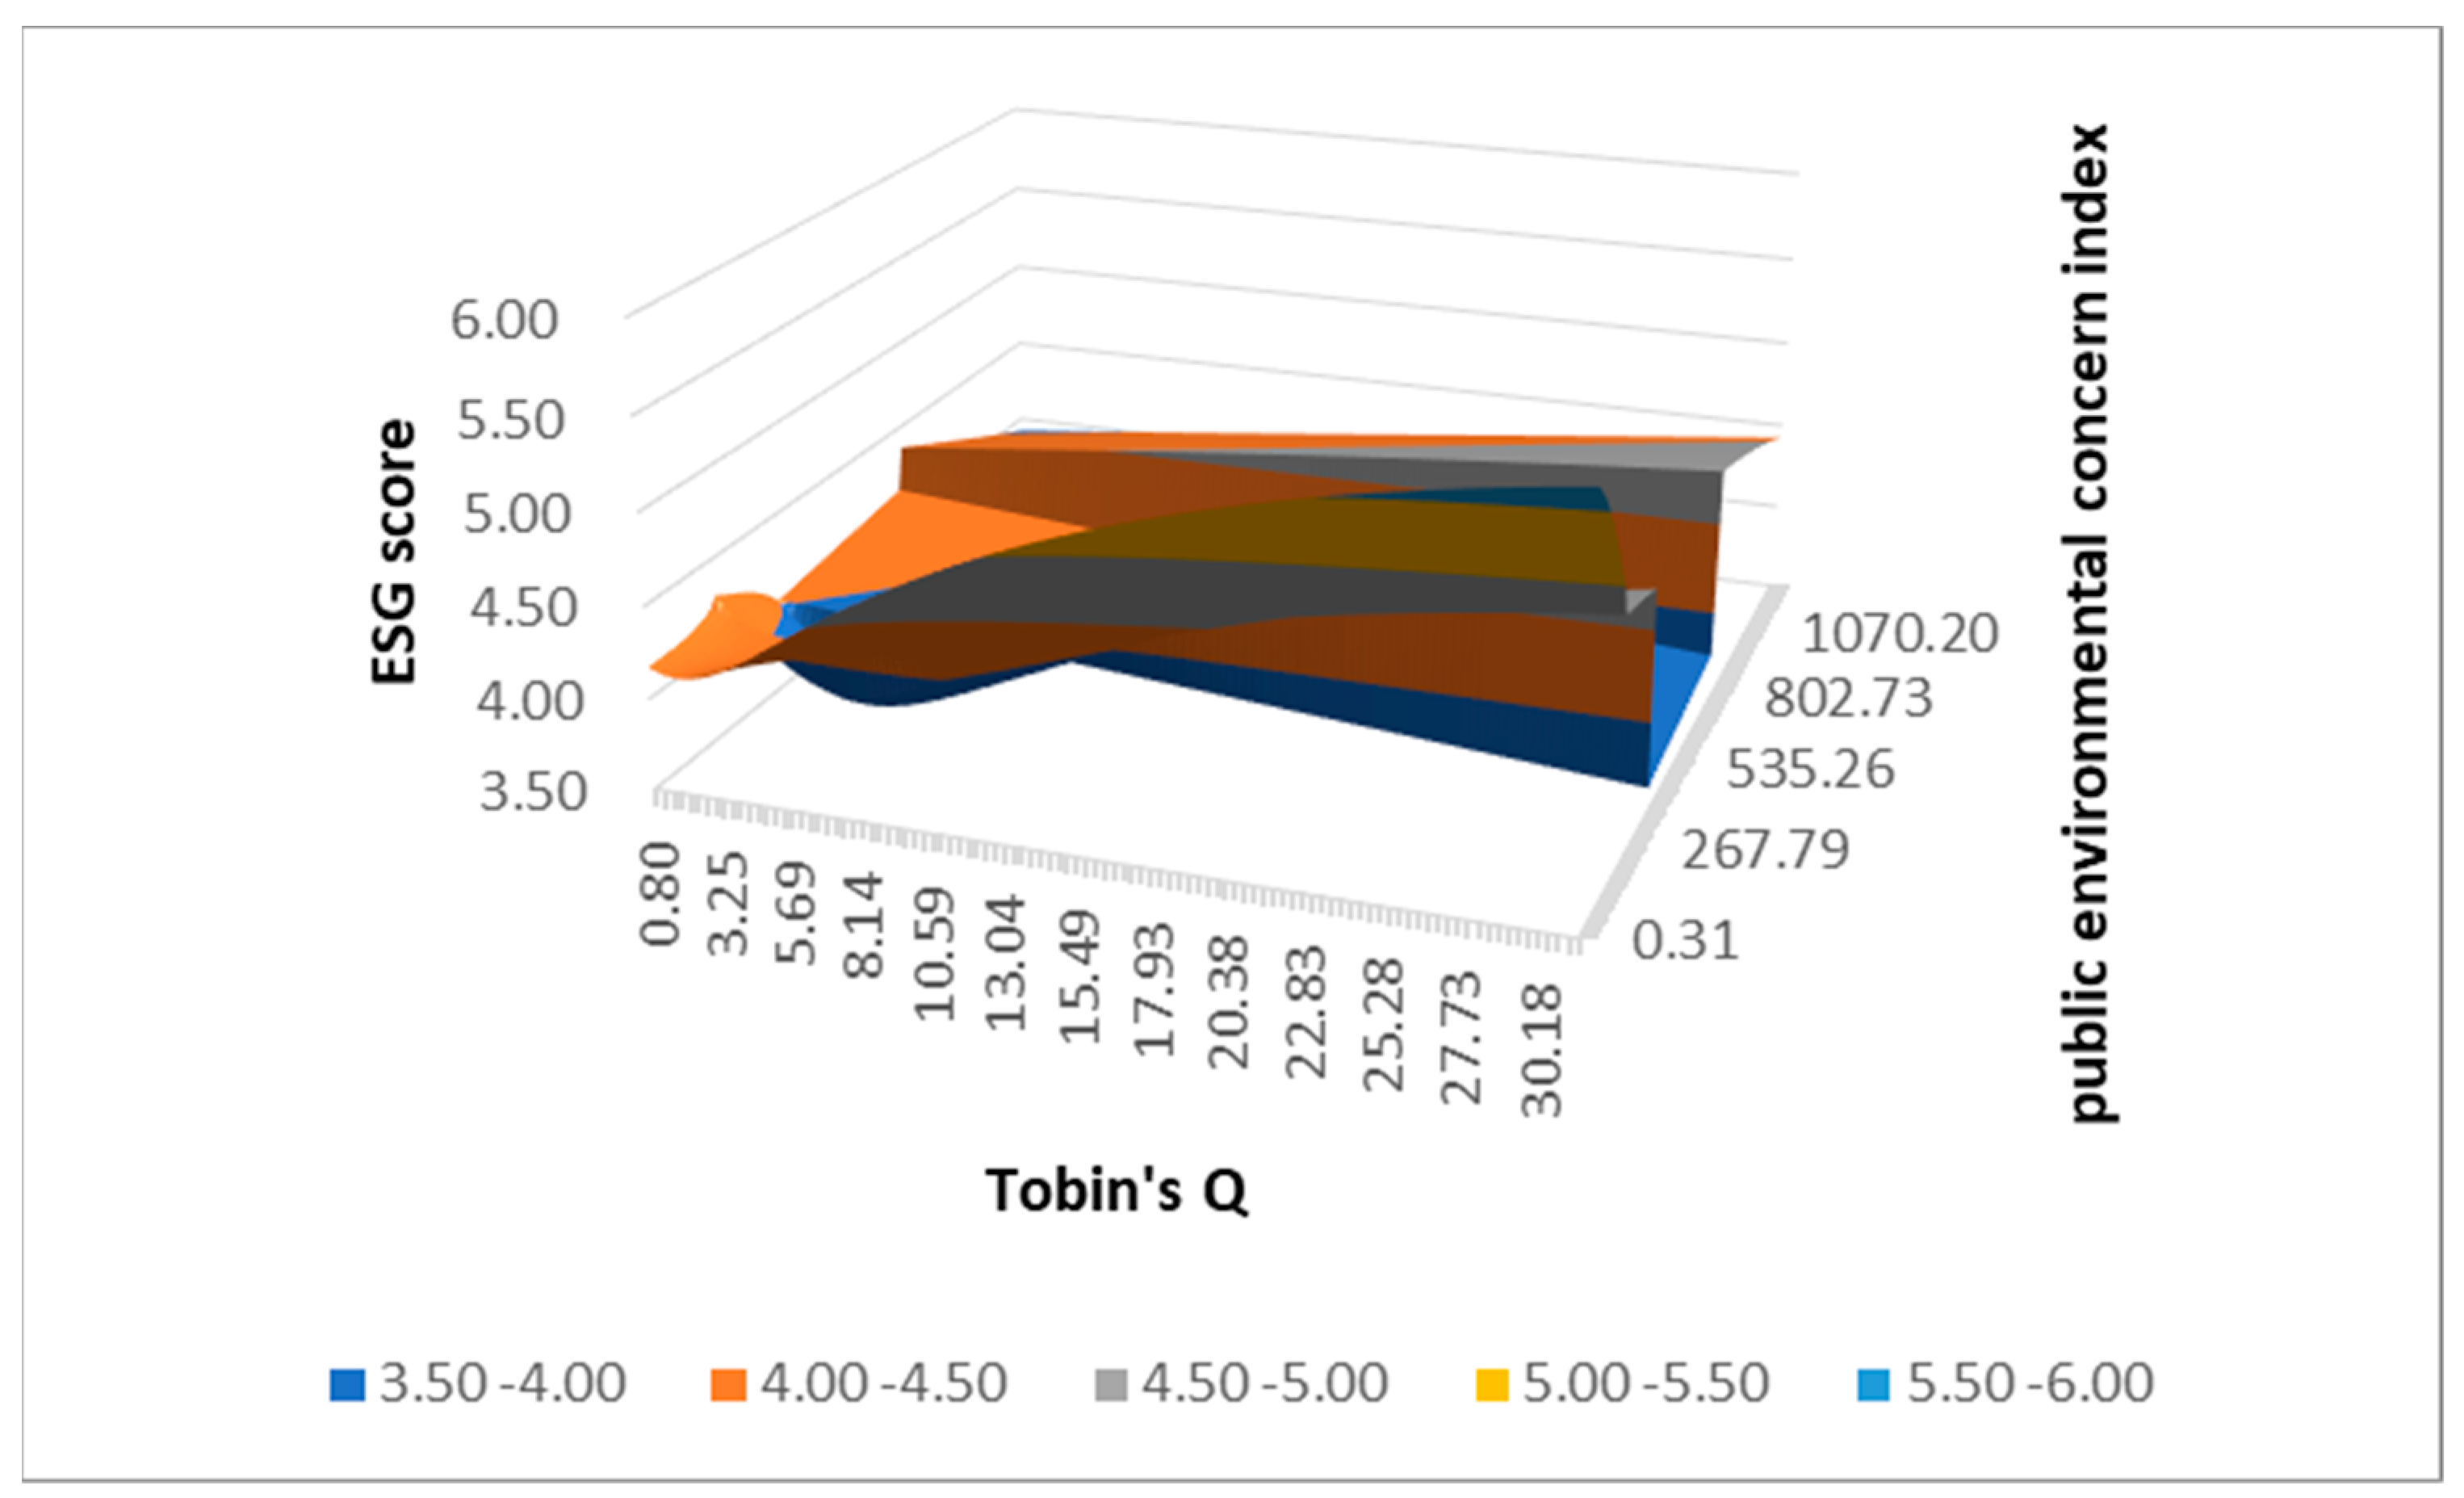
4.2.4. Firm Value Indicator (Tobin’s Q)
4.3. Model Accuracy
5. Conclusions
Author Contributions
Funding
Institutional Review Board Statement
Informed Consent Statement
Data Availability Statement
Conflicts of Interest
References
- Acemoglu, D., Johnson, S., & Robinson, J. A. (2001). The colonial origins of comparative development: An empirical investigation. American Economic Review, 91(5), 1369–1401. [Google Scholar] [CrossRef]
- Aksak, E. O., Ferguson, M. A., & Duman, S. A. (2016). Corporate social responsibility and CSR fit as predictors of corporate reputation: A global perspective. Public Relations Review, 42(1), 79–81. [Google Scholar] [CrossRef]
- Allen, F., Qian, J., & Qian, M. (2005). Law, finance, and economic growth in China. Journal of Financial Economics, 77(1), 57–116. [Google Scholar] [CrossRef]
- Avramov, D., Cheng, S., Lioui, A., & Tarelli, A. (2022). Sustainable investing with ESG rating uncertainty. Journal of Financial Economics, 145(2), 642–664. [Google Scholar] [CrossRef]
- Banerjee, S. B., Iyer, E. S., & Kashyap, R. K. (2003). Corporate environmentalism: Antecedents and influence of industry type. Journal of Marketing, 67(2), 106–122. [Google Scholar] [CrossRef]
- Beierle, T. C. (2010). Democracy in practice: Public participation in environmental decisions. Routledge. [Google Scholar]
- Brammer, S., Jackson, G., & Matten, D. (2012). Corporate social responsibility and institutional theory: New perspectives on private governance. Socio-Economic Review, 10(1), 3–28. [Google Scholar] [CrossRef]
- Broadstock, D. C., Chan, K., Cheng, L. T., & Wang, X. (2021). The role of ESG performance during times of financial crisis: Evidence from COVID-19 in China. Finance Research Letters, 38(11), 101716. [Google Scholar] [CrossRef] [PubMed]
- Carmichael, J. T., & Brulle, R. J. (2017). Elite cues, media coverage, and public concern: An integrated path analysis of public opinion on climate change, 2001–2013. Environmental Politics, 26(2), 232–252. [Google Scholar] [CrossRef]
- Chang, K., Cheng, X., Wang, Y., Liu, Q., & Hu, J. (2021). The impacts of ESG performance and digital finance on corporate financing efficiency in China. Applied Economics Letters, 30(4), 516–523. [Google Scholar] [CrossRef]
- Chatterji, A. K., Durand, R., Levine, D. I., & Touboul, S. (2016). Do ratings of firms converge? Implications for managers, investors and strategy researchers. Strategic Management Journal, 37(8), 1597–1614. [Google Scholar] [CrossRef]
- Chen, H., Kuo, T., & Chen, J. (2022). Impacts on the ESG and financial performances of companies in the manufacturing industry based on the climate change related risks. Journal of Cleaner Production, 380, 134951. [Google Scholar] [CrossRef]
- Chen, S., Mao, Z., Li, Y., & Kang, J. (2024). The effect of China’s public climate concern on ESG disclosure. Finance Research Letters, 62, 105132. [Google Scholar] [CrossRef]
- Cheong, T. S., Wan, G., & Chui, D. K. H. (2022). Unveiling the relationship between economic growth and equality for developing countries. China & World Economy, 30(5), 1–28. [Google Scholar] [CrossRef]
- Dai, Y., & Zhang, L. (2023). Regional digital finance and corporate financial risk: Based on Chinese listed companies. Emerging Market Finance and Trade, 59(2), 296–311. [Google Scholar]
- Daryaei, A. A., Askarany, D., & Fattahi, Y. (2024). Impact of Audit Fees on Earnings Management and Financial Risk: An Analysis of Corporate Finance Practices. Risks, 12(8), 123. [Google Scholar] [CrossRef]
- Davis, G. F., & Marquis, C. (2005). Prospects for organization theory in the early twenty-first century: Institutional fields and mechanisms. Organization Science, 16(4), 332–343. [Google Scholar] [CrossRef]
- DiMaggio, P. J., & Powell, W. W. (1983). The iron cage revisited: Institutional isomorphism and collective rationality in organizational fields. American Sociological Review, 48(2), 147–160. [Google Scholar] [CrossRef]
- Dong, K., Taghizadeh-Hesary, F., & Zhao, J. (2022). How inclusive financial development eradicates energy poverty in China? The role of technological innovation. Energy Economics, 109, 106007. [Google Scholar] [CrossRef]
- Drempetic, S., Klein, C., & Zwergel, B. (2020). The influence of firm size on the ESG score: Corporate sustainability ratings under review. Journal of Business Ethics, 167(2), 333–360. [Google Scholar] [CrossRef]
- Duque-Grisales, E., & Aguilera-Caracuel, J. (2021). Environmental, Social and Governance (ESG) Scores and financial performance of multilaminar: Moderating effects of geographic international diversification and financial slack. Journal of Business Ethics, 168, 315–334. [Google Scholar] [CrossRef]
- El Ghoul, S., Guedhami, O., & Jamshed, R. (2024). Global perspectives on corporate social responsibility, political institutions, and the political economy. Global Finance Journal, 60, 100936. [Google Scholar] [CrossRef]
- Feng, J., Goodell, J. W., & Shen, D. (2022). ESG rating and stock price crash risk: Evidence from China. Finance Research Letters, 46, 102476. [Google Scholar] [CrossRef]
- Figueira, S., Gauthier, C., & de Oliveira, R. T. (2023). CSR and stakeholder salience in MNE subsidiaries in emerging markets. International Business Review, 32(5), 102159. [Google Scholar] [CrossRef]
- Gu, Y., Ho, K., Xia, S., & Yan, C. (2022). Do public environmental concerns promote new energy enterprises’ development? Evidence from a quasi-natural experiment. Energy Economics, 109, 105967. [Google Scholar] [CrossRef]
- Gu, Y., Ho, K., Yan, C., & Gozgor, G. (2021). Public environmental concern, CEO turnover, and green investment: Evidence from a quasi-natural experiment in China. Energy Economics, 100, 105379. [Google Scholar] [CrossRef]
- Guiso, L., Sapienza, P., & Zingales, L. (2004). The role of social capital in financial development. American Economic Review, 94(3), 526–556. [Google Scholar] [CrossRef]
- Hao, X., Fu, W., & Albitar, K. (2023). Innovation with ecological sustainability: Does corporate environmental responsibility matter in green innovation? Journal of Economic Analysis, 2(3), 21–42. [Google Scholar] [CrossRef]
- Hårsman, B., & Quigley, J. M. (2010). Political and public acceptability of congestion pricing: Ideology and self-interest. Journal of Policy Analysis and Management, 29(4), 854–874. [Google Scholar] [CrossRef]
- Hornik, K. (1991). Approximation capabilities of multilayer feedforward networks. Neural Networks, 4(2), 251–257. [Google Scholar] [CrossRef]
- Houston, J. F., & Shan, H. (2022). Corporate ESG profiles and banking relationships. The Review of Financial Studies, 35(7), 3373–3417. [Google Scholar] [CrossRef]
- Huang, Q., Fang, J., Xue, X., & Gao, H. (2023). Does digital innovation cause better ESG performance? an empirical test of a-listed firms in China. Research in International Business and Finance, 66, 102049. [Google Scholar] [CrossRef]
- Huang, Q., Li, Y., Lin, M., & McBrayer, G. A. (2022). Natural disasters, risk salience, and corporate ESG disclosure. Journal of Corporate Finance, 72, 102152. [Google Scholar] [CrossRef]
- Ji, Y., Shi, L., & Zhang, S. (2022). Digital finance and corporate bankruptcy risk: Evidence from China. Pacific Basin Finance Journal, 72, 101731. [Google Scholar] [CrossRef]
- Jiang, Z., Ma, G., & Zhu, W. (2022). Research on the impact of digital finance on the innovation performance of enterprises. European Journal of Innovation Management, 25, 804–820. [Google Scholar] [CrossRef]
- Jin, I. (2023). Probability of achieving NDC and implications for climate policy: CO-STIRPAT approach. Journal of Economic Analysis, 2(4), 82–97. [Google Scholar] [CrossRef]
- Kathuria, V. (2007). Informal regulation of pollution in a developing country: Evidence from India. Ecological Economics, 63(2–3), 403–417. [Google Scholar] [CrossRef]
- Khan, A., Muttakin, M. B., & Siddiqui, J. (2013). Corporate governance and corporate social responsibility disclosures: Evidence from an emerging economy. Journal of Business Ethics, 114(2), 207–223. [Google Scholar] [CrossRef]
- Kirste, L., Oberhauser, M., & Holtbrügge, D. (2024). What drives the dissemination of CSR practices in global value chains? An institutional and psychological perspective. International Business Review, 33(1), 102218. [Google Scholar] [CrossRef]
- Langpap, C., & Shimshack, J. P. (2010). Private citizen suits and public enforcement: Substitutes or complements? Journal of Environmental Economics and Management, 59(3), 235–249. [Google Scholar] [CrossRef]
- Li, S. (2022). Natural extreme events, government subsidies and corporate environment responsibility: Evidence from China’s energy sector. Energy Economics, 114, 106278. [Google Scholar] [CrossRef]
- Li, Y., Gong, M., Zhang, X., & Koh, L. (2018). The impact of environmental, social, and governance disclosure on firm value: The role of CEO power. The British Accounting Review, 50(1), 60–75. [Google Scholar] [CrossRef]
- Liao, X., & Shi, X. (2018). Public appeal, environmental regulation and green investment: Evidence from China. Energy Policy, 119, 554–562. [Google Scholar] [CrossRef]
- Lin, B., Li, B., & Zhang, D. (2024). ESG implementation, public environmental concern, and corporate green technology innovation: Analysis based on the background of China’s “Dual Carbon” targets. Environment, Development and Sustainability, 2024, 1–38. [Google Scholar] [CrossRef]
- Lin, G., Wang, T., & Chen, L. (2016). A forecasting approach combining self-organizing map with support vector regression for reservoir inflow during typhoon periods. Advances in Meteorology, 3, 1–12. [Google Scholar] [CrossRef]
- List, J. A., & Sturm, D. M. (2006). How elections matter: Theory and evidence from environmental policy. The Quarterly Journal of Economics, 121(4), 1249–1281. [Google Scholar] [CrossRef]
- Liu, X., & Mu, R. (2016). Public environmental concern in China: Determinants and variations. Global Environmental Change, 37, 116–127. [Google Scholar] [CrossRef]
- Long, F., Liu, J., & Zheng, L. (2022). The effects of public environmental concern on urban-rural environmental inequality: Evidence from Chinese industrial enterprises. Sustainable Cities and Society, 80, 103787. [Google Scholar] [CrossRef]
- Mu, W., Liu, K., Tao, Y., & Ye, Y. (2023). Digital finance and corporate ESG. Finance Research Letters, 51, 103426. [Google Scholar] [CrossRef]
- Mullainathan, S., & Spiess, J. (2017). Machine learning: An applied econometric approach. Journal of Economic Perspectives, 31(2), 87–106. [Google Scholar] [CrossRef]
- Nirino, N., Santoro, G., Miglietta, N., & Quaglia, R. (2021). Corporate controversies and company’s financial performance: Exploring the moderating role of ESG practices. Technological Forecasting and Social Change, 162, 120341. [Google Scholar] [CrossRef]
- Nourani, V., Mehrvand, M., & Baghanam, A. H. (2014). Implication of SOM-ANN Based Clustering for Multistation Rainfall-Runoff Modeling. Journal of Urban and Environmental Engineering, 8, 198–210. [Google Scholar]
- Qiu, W., Li, Y., & Wu, H. (2023). The role of direct financing on regional green development: Inhibition or promotion? Economic Change and Restructuring, 56(5), 3665–3699. [Google Scholar] [CrossRef]
- Ren, S., Hao, Y., & Wu, H. (2021). Government corruption, market segmentation and renewable energy technology innovation: Evidence from China. Journal of Environmental Management, 300, 113686. [Google Scholar] [CrossRef]
- Ren, S., Hao, Y., & Wu, H. (2022). The role of outward foreign direct investment (OFDI) on green total factor energy efficiency: Does institutional quality matters? Evidence from China. Resources Policy, 76, 102587. [Google Scholar] [CrossRef]
- Ren, X., & Ren, Y. (2024). Public environmental concern and corporate ESG performance. Finance Research Letters, 61, 104991. [Google Scholar] [CrossRef]
- Ren, X., Li, J., He, F., & Lucey, B. (2023a). Impact of climate policy uncertainty on traditional energy and green markets: Evidence from time-varying granger tests. Renewable and Sustainable Energy Reviews, 173, 113058. [Google Scholar] [CrossRef]
- Ren, X., Zeng, G., & Zhao, Y. (2023b). Digital finance and corporate ESG performance: Empirical evidence from listed companies in China. Pacific-Basin Finance Journal, 79, 102019. [Google Scholar] [CrossRef]
- Renneboog, L., Ter Horst, J., & Zhang, C. (2011). Is ethical money financially smart? Nonfinancial attributes and money flows of socially responsible investment funds. Journal of Financial Intermediation, 20(4), 562–588. [Google Scholar] [CrossRef]
- Riedl, A., & Smeets, P. (2017). Why do investors hold socially responsible mutual funds? The Journal of Finance, 72(6), 2505–2550. [Google Scholar] [CrossRef]
- Rodrik, D., Subramanian, A., & Trebbi, F. (2004). Institutions rule: The primacy of institutions over geography and integration in economic development. Journal of Economic Growth, 9(2), 131–165. [Google Scholar] [CrossRef]
- Scott, W. R. (2013). Institutions and organizations: Ideas, interests, and identities. Sage Publications. [Google Scholar]
- Shrivastava, P. (1995). Industrial/environmental crises and corporate social responsibility. The Journal of Socio-Economics, 24(1), 211–227. [Google Scholar] [CrossRef]
- Tao, Y., Wang, D., Ye, Y., Wu, H., & Zhang, Y. (2023). The role of public environmental concern on corporate social responsibility: Evidence from search index of web users. Energy Economics, 126, 107041. [Google Scholar] [CrossRef]
- Tian, G., Li, B., & Cheng, Y. (2022). Does digital transformation matter for corporate risk-taking? Finance Research Letters, 49, 103107. [Google Scholar] [CrossRef]
- Wang, Z., & Sarkis, J. (2017). Corporate social responsibility governance, outcomes, and financial performance. Journal of Cleaner Production, 162, 1607–1616. [Google Scholar] [CrossRef]
- Weng, L., Omar, J. B., Siah, Y. K., Abidin, I. B. Z., & Ahmed, S. K. (2009, May 11–13). Improvement of ANN-BP by data pre-segregation using SOM. 2009 IEEE International Conference on Computational Intelligence for Measurement Systems and Applications (pp. 175–178), Hong Kong, China. [Google Scholar]
- Wong, W., Batten, J., Ahmad, A., Mohamed-Arshad, S. B., Nordin, S., & Adzis, A. A. (2021). Does ESG certification add firm value? Finance Research Letters, 39, 101593. [Google Scholar] [CrossRef]
- Wu, H., Wang, B., Lu, M., Irfan, M., Miao, X., Luo, S., & Hao, Y. (2023). The strategy to achieve zero-carbon in agricultural sector: Does digitalization matter under the background of COP26 targets? Energy Economics, 126, 106916. [Google Scholar] [CrossRef]
- Wu, H., Zhong, R., Wang, Z., Qu, Y., Yang, X., & Hao, Y. (2024). How does industrial intellectualization affect energy intensity? Evidence from China. The Energy Journal, 45(2), 01956574-45. [Google Scholar] [CrossRef]
- Wu, Y., & Huang, S. (2022). The effects of digital finance and financial constraint on financial performance: Firm-level evidence from China’s new energy enterprises. Energy Economics, 112, 106158. [Google Scholar] [CrossRef]
- Xia, Y., Qiao, Z., & Xie, G. (2022). Corporate resilience to the COVID-19 pandemic: The role of digital finance. Pacific-Basin Finance Journal, 74, 101791. [Google Scholar] [CrossRef]
- Yang, X., Wang, J., Cao, J., Ren, S., Ran, Q., & Wu, H. (2021). The spatial spillover effect of urban sprawl and fiscal decentralization on air pollution: Evidence from 269 cities in China. Empirical Economics, 63(2), 847–875. [Google Scholar] [CrossRef]
- Zhang, B., Zeng, C., Wang, S., & Xie, P. (2004, September 6–8). Forecasting market-clearing price in day-ahead market, using SOM-ANN. 39th International Universities Power Engineering Conference (pp. 390–393), Bristol, UK. [Google Scholar]
- Zhang, H., Xu, T., & Feng, C. (2022). Does public participation promote environmental efficiency? Evidence from a quasi-natural experiment of environmental information disclosure in China. Energy Economics, 108, 105871. [Google Scholar] [CrossRef]
- Zhang, X., Ji, C. E., Zhang, H., Wei, Y., & Jin, J. (2023). On the role of the digital industry in reshaping urban economic structure: The case of Hangzhou, China. Journal of Economic Analysis, 2(4), 123–139. [Google Scholar] [CrossRef]
- Zhao, X., Fang, L., & Zhang, K. (2023). Online search attention, firms’ ESG and operating performance. International Review of Economics and Finance, 88, 223–236. [Google Scholar] [CrossRef]
- Zheng, S., Wu, J., Kahn, M. E., & Deng, Y. (2012). The nascent market for “green” real estate in Beijing. European Economic Review, 56(5), 974–984. [Google Scholar] [CrossRef]
- Zhu, H., & Wagner, E. (2024). Is corporate social responsibility a matter of trust? A cross-country investigation. International Review of Financial Analysis, 93, 103127. [Google Scholar] [CrossRef]
- Zhuo, C., Wen, Y., & Wu, H. (2023). The environmental externality of China’s digital infrastructure: Does institution supply matter? Applied Economics, 56(41), 4875–4888. [Google Scholar] [CrossRef]


| LRM | ANN | Improvement (%) | |
|---|---|---|---|
| Overall | 0.907685 | 0.720027 | 20.67442 |
| Model 1 | 0.912727 | 0.695811 | 23.76576 |
| Model 2 | 0.985783 | 0.918827 | 6.792172 |
| Model 3 | 0.855619 | 0.705819 | 17.50773 |
| Model 4 | 0.902926 | 0.759431 | 15.89217 |
Disclaimer/Publisher’s Note: The statements, opinions and data contained in all publications are solely those of the individual author(s) and contributor(s) and not of MDPI and/or the editor(s). MDPI and/or the editor(s) disclaim responsibility for any injury to people or property resulting from any ideas, methods, instructions or products referred to in the content. |
© 2025 by the authors. Licensee MDPI, Basel, Switzerland. This article is an open access article distributed under the terms and conditions of the Creative Commons Attribution (CC BY) license (https://creativecommons.org/licenses/by/4.0/).
Share and Cite
Cheong, T.S.; Liu, S.; Ma, N.; Han, T. The Impact of Public Environmental Concern on Corporate ESG Performance. J. Risk Financial Manag. 2025, 18, 82. https://doi.org/10.3390/jrfm18020082
Cheong TS, Liu S, Ma N, Han T. The Impact of Public Environmental Concern on Corporate ESG Performance. Journal of Risk and Financial Management. 2025; 18(2):82. https://doi.org/10.3390/jrfm18020082
Chicago/Turabian StyleCheong, Tsun Se, Shuaiyi Liu, Ning Ma, and Tingting Han. 2025. "The Impact of Public Environmental Concern on Corporate ESG Performance" Journal of Risk and Financial Management 18, no. 2: 82. https://doi.org/10.3390/jrfm18020082
APA StyleCheong, T. S., Liu, S., Ma, N., & Han, T. (2025). The Impact of Public Environmental Concern on Corporate ESG Performance. Journal of Risk and Financial Management, 18(2), 82. https://doi.org/10.3390/jrfm18020082