Concept Paper

Proposal for a General Atmospheric Correction Method of Breakdown and Withstand Voltages of Air-Gap Insulated Configurations Based on a Streamer–Leader Differentiated Model of the Breakdown Process

1
E.cons GmbH, Powersystems Consulting, Technologie-Campus 1, 09126 Chemnitz, Germany
2
Department of Electrical Engineering and Informatics, University of Applied Sciences Zittau/Goerlitz, 02763 Zittau, Germany
3
Consultant, 14532 Kleinmachnow, Germany
*
Author to whom correspondence should be addressed.
Energies 2018, 11(4), 776; https://doi.org/10.3390/en11040776
Submission received: 9 January 2018 / Revised: 2 February 2018 / Accepted: 22 February 2018 / Published: 28 March 2018

Abstract

:
Current atmospheric correction methods for breakdown and withstand voltages in long air-gap configurations show deviations in comparison to measurement data when applied to correct for unusual or atypical atmospheric conditions (i.e., altitudes above 2000 m a.s.l.). The corresponding standards IEC 60060 and IEC 60071 show inconsistencies, although both are being based upon the same measurements and empirical models. In its first part, the concept paper at hand presents the current knowledge and problems of atmospheric correction. In the second part, the authors outline the possible steps for a necessary new investigation as well as the algorithm of a hypothetical correction method. The proposed research is based upon the recent knowledge that any breakdown process in air-gap insulation consists of the sub-processes streamer and leader. While their characteristics seem to be independent of configuration and voltage form, their ratio and proportion varies, which, in turn, defines the value of breakdown voltage. Therefore, the authors propose a sub-process differentiated, measurement-based evaluation of the atmospheric influences air pressure, air humidity, air conductivity and temperature. The main goal is to develop a generic physical model of the breakdown process.

1. Introduction

In power supply systems, the insulation of the equipment is stressed by temporary overvoltages due to impacts of lightning and switching. An effective insulation co-ordination and optimal dimensioning requires the knowledge of the correct breakdown voltage in order to avoid damage as a result of dielectric breakdown.
Especially for air-gap insulated equipment, the dielectric strength depends heavily on the atmospheric ambient conditions. In turn, the main ambient parameters temperature, air humidity, air pressure and air conductivity—and thereby the breakdown voltage—are dependent on the geographical location of the installation.
The influence of these atmospheric conditions on the breakdown voltage is described by different empiric models. The standardization of the current corrective procedures for the determination of valid voltage insulation levels is based upon these models and their corresponding measurements. The most important standards in this matter are the IEC 60060 [1] for high voltage testing and the IEC 60071 [2] for insulation co-ordination.
The different model concepts and separate boundary conditions for testing and co-ordination involve inconsistencies of the various calculation methods in the different standards. These inconsistencies are a result of the fact that currently known methods for atmospheric correction of breakdown voltages are based upon empirical approaches correlating voltage peak values with different atmospheric parameters, while often joining influences of configuration and voltage form into common approximation functions. An international discussion of this inadequacy caused the establishment of several working groups, yet, so far, a solution could not have been found (IEC JWG 42/22; CIGRE WG D1.50).
Therefore, the purpose of this concept paper is to point out and discuss the necessary groundwork and methods for a profound solution in the context of a research proposal. The main goal is to develop a generally valid, physical model of the breakdown process in dependence of the atmospheric parameters and in relation to distinct configurations and voltage forms.
The recent work of [3] has shown that the characteristics of the main breakdown sub-processes streamer and leader are independent of configuration and voltage form; only their ratio differs. Hence, the breakdown voltage can be determined analytically, if the behavior and dependencies of streamer and leader are known. However, an investigation involving a differentiated quantification of the atmospheric influences on streamer and leader hasn’t been conducted yet.
Thus, as a unified extension, a differentiated measurement-based evaluation of the entire breakdown process dependent on the atmospheric conditions is proposed. Based on the results of this parameter study, the atmospheric influences on the physical characteristics of the different breakdown sub-processes can be ascertained.
Upon the findings of the investigation, a physical model of the breakdown process with respect to its sub-processes streamer and leader and dependent on the atmospheric conditions can be developed. In relation to any of the examined atmospheric parameters, the model shall provide a reliable and consistent atmospheric correction method for any breakdown and withstand voltage. Regarding the atmospheric correction of withstand voltages in accordance with insulation co-ordination, the model shall be used to derive a correction method dependent on altitude.
The first part of this paper will provide a survey on the current state of knowledge regarding atmospheric correction of breakdown and withstand voltages. The second part will outline the necessary steps in developing the new physical model. This includes the illustration of a hypothetical atmospheric correction method based on that model and in relation to a freely chosen atmospheric parameter X.

2. State of Knowledge

The following survey is mainly written in reference to atmospheric influences on positive switching impulse (SI) voltage of long air-gap configurations. The focus lies on positive SI due to its characteristic minimal breakdown voltage (as a result of its critical time to crest) and thereby its importance for dimensioning of electrical equipment and installations.

2.1. Overview of Studies and Model Concepts

Aiming to increase the nominal voltage U n of the electrical transmission grids, in the 1970s, a great deal of research on the dielectric strength against switching impulse voltages at long air-gaps d > 1 m was conducted. Numerous international findings on the 50%-breakdown-voltage over gap-distance characteristic U b 50 ( d ) for different configurations were published (e.g., in [4]).
One of the first examinations of the breakdown process with switching impulse voltage was done by Lemke [5]. The respective findings include the knowledge of the length-related (positive) streamer and leader voltage gradients E S + = 500 kV m and E L + = 100 kV m at standard atmospheric conditions, which are still used in several standards, including IEC 60071-2 [2]. The research conducted by [5] was continued under the supervision of Mosch in Dresden. At the time, further studies mainly took place at the following three research centers:
  • Les Renardières Group [6,7];
  • Padua University [8,9];
  • Institut de recherche d’Hydro-Québec (IREQ) [10,11].
The breakdown mechanism of switching impulse voltages in long air gaps at standard atmospheric conditions was sufficiently examined during the 1970s. The respective measurement results include the acquisition of numerous waveforms of both the electrode voltage and the pre-discharge current, as well as some few photographs of the pre-discharge process. These findings were sufficient to describe the electrical and optical characteristics of the breakdown process and its sub-processes (corona-, streamer- and leader-discharges) at standard atmospheric conditions [4,6].
The corresponding empirical models explain the breakdown process, albeit not in quantification of the influences of specific atmospheric parameters [12]. Until the 1970s, these influences were empirically and analytical evaluated just for homogenous and slightly inhomogeneous electrode configurations.
Based on the well-known Paschen-Law, the air density correction function k d was introduced. In addition, an air humidity correction function k h based on empirical evaluated approximation was introduced as well. Until today, measurements have shown that air density is the atmospheric parameter with the highest impact on the breakdown voltage. Thus, in some publications, the influence of air humidity is neglected (e.g., [13,14]) (confer Appendix B.1).
The functions k d and k h were first used as in Equation (1), thereby correcting the breakdown voltage in arbitrary atmospheric conditions U b 50 to the corresponding breakdown voltage in standard atmospheric conditions U b 50 0 for said homogenous and slightly inhomogeneous configurations.
U b 50 0 = k h k d · U b 50
The air density correction function k d is assumed to be proportional, and, under certain circumstances equal, to the relative air density δ [18]. As depicted as in Equation (2), the relative air density δ is calculated in a first approximation, using the product of the air pressure p and temperature T, each with reference to the fixed values of standard atmospheric conditions.
k d δ = p p 0 · T 0 T
The Paschen-Law itself describes a quasi-linear reduction of breakdown voltage in relation to a decrease in relative air density, though only for homogenous and slightly inhomogeneous electrode configurations. Therefore, it is only valid for small gap distances. The equivalence k d = δ thereby only applies in a small range, given in Equation (3).
k d = δ for 0.9 δ 1.1
With increasing gap distance d (and therewith decreasing voltage gradient E b = U b 50 d and homogeneity of configuration), the influence of the atmospheric conditions on the breakdown process becomes under-proportional and decreases exponentially. This phenomenon is caused by a characteristic change in the breakdown process, i.e., the effect of streamer-leader-transition. The breakdown process is no longer mainly governed by streamer, but by leader as well. An increase in the proportion of leader decreases the atmospheric influence on the breakdown voltage. Considering the relative air density δ as the main atmospheric parameter, its influence on the proportions of streamer and leader seems to act contrary.
To take this effect into account, the CIGRE study committee 33 extended Equation (1) by exponent n, resulting in Equation (4) [18].
U b 50 0 = k h k d n · U b 50 with n < 1 at d > 1 m and pos . SI
The exponent n thereby basically represents the proportion of streamer discharges in the breakdown process: the maximum value of n = 1 leads to the maximum deviation of U b 50 to U b 50 0 . It corresponds to a mainly streamer-governed breakdown process, given in Equation (5).
U b 50 0 = k d k h · U b 50 mainly streamer - governed breakdown n = 1
Assuming a solely decrease in relative air density δ , first, the exponent n decreases, while the breakdown voltage decreases less rapid than in a scenario with a mainly streamer-governed breakdown. At some point, the contrarily behaving change in the streamer and leader proportions fully compensate each other and the exponent reaches the value n = 0 . In that point of conditions, the air density has no influence on the breakdown voltage when compared to its value at standard atmospheric conditions, thereby fulfilling Equation (6).
U b 50 0 = U b 50 streamer leader compensation n = 0
In addition to the generally representation of atmospheric influences on the breakdown process, the exponent n permits extending the validity of the equivalence of Equation (3) on an arbitrary range of air density.
During the 1970s, the exponent n was (only approximately) ascertained for different configurations and voltage forms through scattered measurements in dependence of gap distance d [18].
In the 1980s, there were a lot of attempts to find a generally valid function for n. The first success was the determination and limitation of the value range of n for various configurations, gap distances and voltage forms, all based on extensive measurements [19].
In order to summarize and simplify all the influences of atmosphere, configuration and voltage form, the reference factor G was introduced. It is used to normalize the breakdown voltage in arbitrary atmospheric conditions U b 50 on a breakdown process, which is only governed by positive streamers. It can be calculated using Equation (7).
G = U b 50 d · E S + = U b 50 d · k d · K h · 500 kV / m
The separate factor G 0 of Equation (8) therefore corresponds to factor G at standard atmospheric conditions.
G 0 = U b 50 0 d · E S 0 + = U b 50 0 d · 500 kV / m
The measurement results of various configurations and test sites were summarized as in Figure 1.
On that basis, the average approximation functions n ( G 0 ) and n ( G ) of the exponent n were evaluated. Using their independence of configuration, voltage form and gap distance, the breakdown voltage U b 50 could be calculated through Equation (9). This ‘semi-empirical’ approach provides a generally applicable correction method at the expanse of a statistical uncertainty due to the wide-scattered value range of n ( G 0 ) respective n ( G ) .
U b 50 = k d · K h n · U b 50 0
The air humidity correction function K h was used in [19] as a sheer humidity dependent approximation function. (Since [20], different air density and air humidity correction functions k d and K h were evaluated dependent on the voltage form. Furthermore, a leap in definition was implemented in accordance to Equation (10), in which the exponent n was separated into the exponents m and w, which represent the influences of air density and air humidity respectively and, apart from one another Since [20], the measurement results were no longer correlated to G 0 , but to G in order to allow atmospheric corrections of arbitrary conditions. Furthermore, for G > 1.2 , n was separated into the air density exponent m and the humidity exponent w. For G > 1 , m was set to unity (referring to a solely positive streamer discharge). In the range of 0 G 1.2 , m = w was determined. The range of G > 1.2 is generally irrelevant for dimensioning of equipment. Effectively, in terms of dimensioning, no real change in calculation was made when splitting the exponent n into the exponents m , w . Only, it is then possible to exclusively evaluate the respective influence of air density or air humidity.)
U b 50 = k d m · K h w · U b 50 0 with m , w = f ( G ) ; m = w for G 1.2 ; k d = δ
The respective measurements were conducted at three different test sites (with the highest at an altitude of 1800 m a.s.l.). The evaluated fitting function m ( G ) shows a sufficient accuracy in the corresponding range of 0.8 δ · K h 1.05 . The atmospheric influences on the approximated functions were further evaluated by CIGRE WG 33.03 and WG 33.07 [20]. Through introduction of the arrays of curves m ( G , δ ) and w ( G , δ ) , the correction methods can be specified for the greater range of 0.6 δ · K h 1.1 , as shown as in Figure 2.
Especially for switching impulse voltages, high discrepancies emerge between measured and calculated breakdown voltages in lower air densities. The correction functions are getting inaccurate due to the approach of configuration independence in m ( G ) and m ( G , δ ) .
Regarding this inaccuracies for SI voltage, further photographic evaluation of the pre-discharge process and measurements at altitudes of 3372 m a.s.l. were conducted [13,14]. The results provided SI-specialized variants of m ( G ) and m ( G , δ ) , through which the correction of switching impulse voltage can be adequately applied in a range of 0.7 δ · K h 1.05 (with K h = 1 ).
The dependence of m ( G , δ ) on electrode configuration could be quantified using an empirical approach in [13], and a verifying, analytical determination in [14]. Using the gap factor K of Equation (11) (confer Appendix B.2), the configuration can be considered.
K = U b 50 0 U b 50 0 RP
For some basic configurations, first qualitative findings on the behavior and ratio of the streamer and leader lengths were gathered (illustrating the atmospherically dependent changes of the ratio between the streamer and leader parts) [13,21].

2.2. Currently Standardized Atmospheric Correction Methods

The presented empirical knowledge is still used in international standards. Focusing on switching impulse voltage (confer Appendix B.3), there are essentially two different approaches for atmospheric correction: high voltage testing according to IEC 60060 and insulation co-ordination according to IEC 60071.
(a) High Voltage Testing—IEC 60060
In high voltage testing after IEC 60060-1 according to [1], the generally approximated functions m ( G ) and w ( G ) are used dependent on the air density and the air humidity, both incorporated in the factor G (see Equation (7)). In reference to Figure 3 and in accordance with Equation (10), m ( G ) = w ( G ) applies for the range of G 1.2 .
Considering the empirical basis of m ( G ) and w ( G ) , the correction procedure is only valid for a range of 0.8 δ · K h 1.05 .
Since IEC 60060 has the goal to be independent of configuration and voltage form, the presented, special SI-related functions m ( G , δ ) and w ( G , δ ) of [21], are not included in [1]. High statistical uncertainties of the calculated breakdown voltages must be expected due to the universally applicable approach of the single approximation function m ( G ) . As a result of its independence of voltage form and configuration, high deviations to real measured breakdown voltages may occur.
The breakdown voltage at standard atmospheric conditions U b 50 0 can be calculated according to Equation (12), knowing the breakdown voltage at arbitrary atmospheric conditions U b 50 and the corresponding factor G of Equation (7).
U b 50 0 = U b 50 ( k d ) m · ( K h ) w = U b 50 ( δ ) m · ( K h ) w
The necessary values of the exponents m and w can be derived from the functions m ( G ) and w ( G ) , depicted in Figure 3.
Equation (12) can be used vice versa to calculate the breakdown voltage at arbitrary atmospheric conditions U b 50 , replacing factor G with G 0 by using Equation (8) instead of Equation (7).
If U b 50 0 at standard atmospheric conditions is unknown, an iterative approximation procedure must be applied, which instead uses the rated withstand voltage U rw to calculate the sought breakdown voltage at arbitrary atmospheric conditions U b 50 [16].
(b) Insulation Co-Ordination—IEC 60071
In insulation co-ordination after IEC 60071-2 according to [2], the aim is to calculate the required rated withstand voltage U rw for equipment at standard atmospheric conditions (confer Appendix B.4). This is achieved by correcting the co-ordination withstand voltage of equipment U cw using Equation (13).
U rw = K S · U cw k d · K h m
Formally, the atmospheric correction according to Equation (13) is equivalent to the correction method of [1] in the range of G 1.2 , with K S added as an additional safety factor. However, in insulation co-ordination, the atmospheric correction is usually reduced to a correction in dependence of altitude A (confer Appendix B.5), depicted in Equation (14).
U rw = K S · U cw e m · A 8150 m
This is done based on the current knowledge that the influences of temperature and air humidity compensate each other at ‘typical’ installation sites [15,16,17]. Since the procedure requires the co-ordination withstand voltage U cw , it doesn’t directly employ the characteristic m ( G ) . Instead, the standard specifies the characteristic m ( U cw ) for four basic electrode configurations as shown in Figure 4.
The exact origin of the m ( U cw ) -curves in Figure 4 is unknown. They are presumably based on the same measurements as for [1], i.e., the research conducted in [19].
In order to derive m ( U cw ) , the analogies U cw U b 50 and U rw U b 50 0 have to be taken into account. For an arbitrarily given U b 50 of a rod-plane configuration and pos. SI voltage, m ( U cw ) can then be calculated over an iterative algorithm as described as in [17], using the known functions m ( G ) , G and U b 50 0 RP ( d ) . Considering the gap factor K, m ( U cw ) can be extracted for more configurations.
However, such an iteration would only be valid, if the considered U b 50 0 RP ( d ) corresponds to the respective voltage form in question. More than one possibilities for a seemingly single voltage form can arise, e.g., two possible functions U b 50 0 RP ( d ) for pos. SI voltage (for standard and critical time to crest). In the case of IEC 60071, one can only speculate about the specific function U b 50 0 RP ( d ) used to derive the four curves of m ( U cw ) . Furthermore, it remains unknown which exact form of m ( G ) was utilized, i.e., whether the single approximation of m ( G ) as shown as in Figure 3, or the SI-specialized variant of [13] (details of an iteratively re-determination of m ( U cw ) ) can be found in Appendix A).
Therefore, and in accordance to its origin, the atmospheric correction using Equation (14) is only valid in a range of altitude up to 2000 m a.s.l. [1].

2.3. Current Problems

The influence of certain atmospheric parameters on the entire breakdown process hasn’t been fully evaluated yet (furthermore not in the currently valid range of interest), neither empirically nor theoretically. Current approaches join different voltage forms and configurations in generally approximated functions ( m ( G ) , K, etc.) in light of a practical and easy application. However, compared to recent measurements, those methods aren’t valid in matters of high altitude and/or ‘extreme/unusual’ atmospheric conditions. These flaws are shown in deviations between the known m ( G , G 0 ) -characteristics and calculations of the exponent m based on high altitude measurements using the methods and equations described in current standards [16]. These deviations can’t only be presented empirically, but through analytical backward calculations as well, e.g., using iterative approaches to re-determine m ( U cw ) based on the knowledge of both standards, as pointed out in [17] (Since the cited source is written in German, the authors would like to refer to this papers Appendix A for further details.).
The resulting confusion as how to adequately correct atmospheric influences couldn’t have been lifted until this day, albeit discussion in the respective committees (e.g., IEC TC 42, TC 28) and the establishment of various working groups (e.g., CIGRE D 1.50).
Therefore, consistent and generally valid groundwork is needed to get rid of said deviations and borders of appliance. Based on the following groundwork, the authors believe that a universally applicable correction method for breakdown and withstand voltages could only be developed through differentiated, measurement-based analysis and modeling of the entire breakdown process dependent on the atmospheric parameters and in distinction of its sub-processes streamer and leader (In principle, such an approach already was suggested in the appendix of [19].).

2.4. Recent Dedicated Groundwork

The work on this research topic was motivated by the authors involvement in certain committees of insulation co-ordination. This applies especially to the shown discrepancies between the iteratively re-calculated m-curves of [17] and the ones given in [2]. A more detailed description is presented in Appendix A.
Recent related groundwork of the authors mainly refers to the sub-process differentiated evaluation of breakdown processes in small and large air-gaps with lightning impulse (LI) voltage at standard atmospheric conditions (in context of the PhD thesis [24], respectively [3,25,26,27]). This includes the development of a joint measurement system, which allows the synchronous measurement of electrical time signals (voltage and pre-discharge current) and optical signals, the latter being the photographic captured propagation of streamer and leader through a high-speed camera [25,26]. The principle block diagram of that measurement system is depicted in Figure 5.
An example of a measurement set is shown in Figure 6, depicting a representing discharge process of positive LI voltage in a rod-plane configuration.
Figure 6 displays four major stages of the breakdown process: the first stage (labeled as ‘Nr. 1’) depicts the positive streamer discharge, meaning an ionization wave propagating forward to the plane anode, growing through recurring creation of avalanches due to impact ionization in its high-field area (head of the streamer). The second stage (labeled as ‘Nr. 2’) marks the initialization of what the authors refer to as backward wave. In principle, once the streamer has reached the anode (given a sufficient voltage supply), the entire gap is ionized and electrons from the anode can move towards the high-field region of the rod cathode. The resulting flow of electrons continues from there on to the end of the discharge process (which in the depicted case results in breakdown). The third stage (labeled as ‘Nr. 3’ to ‘Nr. 5’) shows the formation of a narrow current-intensive canal as a result of higher electron density around the rod electrode (thermo-ionization). The length of the backward wave consequently decreases with an increase in canal length. The last stage (labeled as ‘Nr. 6’) shows the breakdown due to the highly conductive canal reaching the anode.
It has been controversially discussed whether the observed canal during all LI measurements is equivalent to the well-known leader discharge of SI voltage. Therefore, Ref. [3] deals with a quantifying comparison of the following characteristics of the LI-canal respectively the SI-leader: velocity, charge density and voltage gradient. The results show that, essentially, the LI-observed canal is equivalent to the SI-related leader, which implies a basic similarity in all breakdown processes, regardless of voltage form. Figure 7 illustrates the leader-similarity.
The conducted experiments also led to the development and verification of calculation models, which permit the determination of various physical characteristics of any breakdown process, based on the usage of the respective measured electrical and optical data. For instance, it was shown that the pre-discharge current can be calculated through the measured voltage and evaluated streamer and leader lengths. Even more, it is possible to compute the electrical field of a configuration in its temporal and spatial dependence through optical evaluation of the generated space charges, illustrated in Figure 8 [27].
In summary, the findings have shown that the sub-processes streamer and leader are present in all voltage forms, even in LI. Their proportion within the breakdown process is different, varying depending on the configuration. However, the physical characteristics of streamer and leader are independent of the configuration and voltage form and exhibit no significant variance [3]. However, so far, these statistical certainties only could have been determined for standard atmospheric conditions.

3. Research Proposal Outline

The key premise of the proposed research is the following hypothesis, based upon the findings of [3,25,26,27] (respectively [24]): in the determination of breakdown and withstand voltages, the influences of atmosphere can be decoupled from the influences of voltage form and configuration through a sub-process differentiated evaluation of the entire breakdown process, thereby quantifying these influences on streamer and leader separately.
The proposed future investigations can then roughly be divided into the following three major steps:
  • Electrical and optical measurements with different configurations, voltage forms and gap distances in dependence and variation of the ambient parameters air pressure, air humidity, temperature and air conductivity;
  • Development of physical model of breakdown process through sub-process differentiated analysis and evaluation of electrical and optical measurement data;
  • Derivation of universal atmospheric correction method for breakdown and withstand voltages in dependence of atmospheric parameters, configuration and voltage form.

3.1. Measurements

Using the measurement system of [26], the authors propose extensive measurements at rod-plane and rod-rod configurations. Since these two display the basic configurations with maximum streamer, respectively leader lengths/parts, further measurements at different configurations are currently not under consideration, except in the form of individual samples for questions of model verification. The intended measurements consist of step-wise voltage increase tests (mainly positive SI voltage; cf. Section 2) and comprise three major parts with the following aspects:
  • Combined short air-gap configuration study and atmospheric parameter study:
    • isolated test chamber with the possibilities to control and change the atmospheric parameters air pressure, air humidity, temperature and air conductivity (the latter through controlled UV-light-emission);
    • rod-plane and rod-rod configurations;
    • positive SI voltage and sample-wise further voltage forms;
    • gap distances up to 1.5 m (leader initiation at 0.8 m for rod-plane configuration with LI voltage [3]);
  • Long air-gap configuration study:
    • test site at de facto standard atmospheric conditions;
    • rod-plane and rod-rod configurations and sample-wise further configurations;
    • positive SI voltage and sample-wise further voltage forms;
    • gap distances from 1.0 m upwards;
  • Verification study:
    • various test sites at different altitudes in Germany (DE), Iran (IR) and China (CN) (equals not controllable, though different atmospheric conditions);
    • rod-plane and rod-rod configurations and sample-wise further configurations;
    • positive SI voltage and sample-wise further voltage forms;
    • gap distances from 0.5 m upwards.

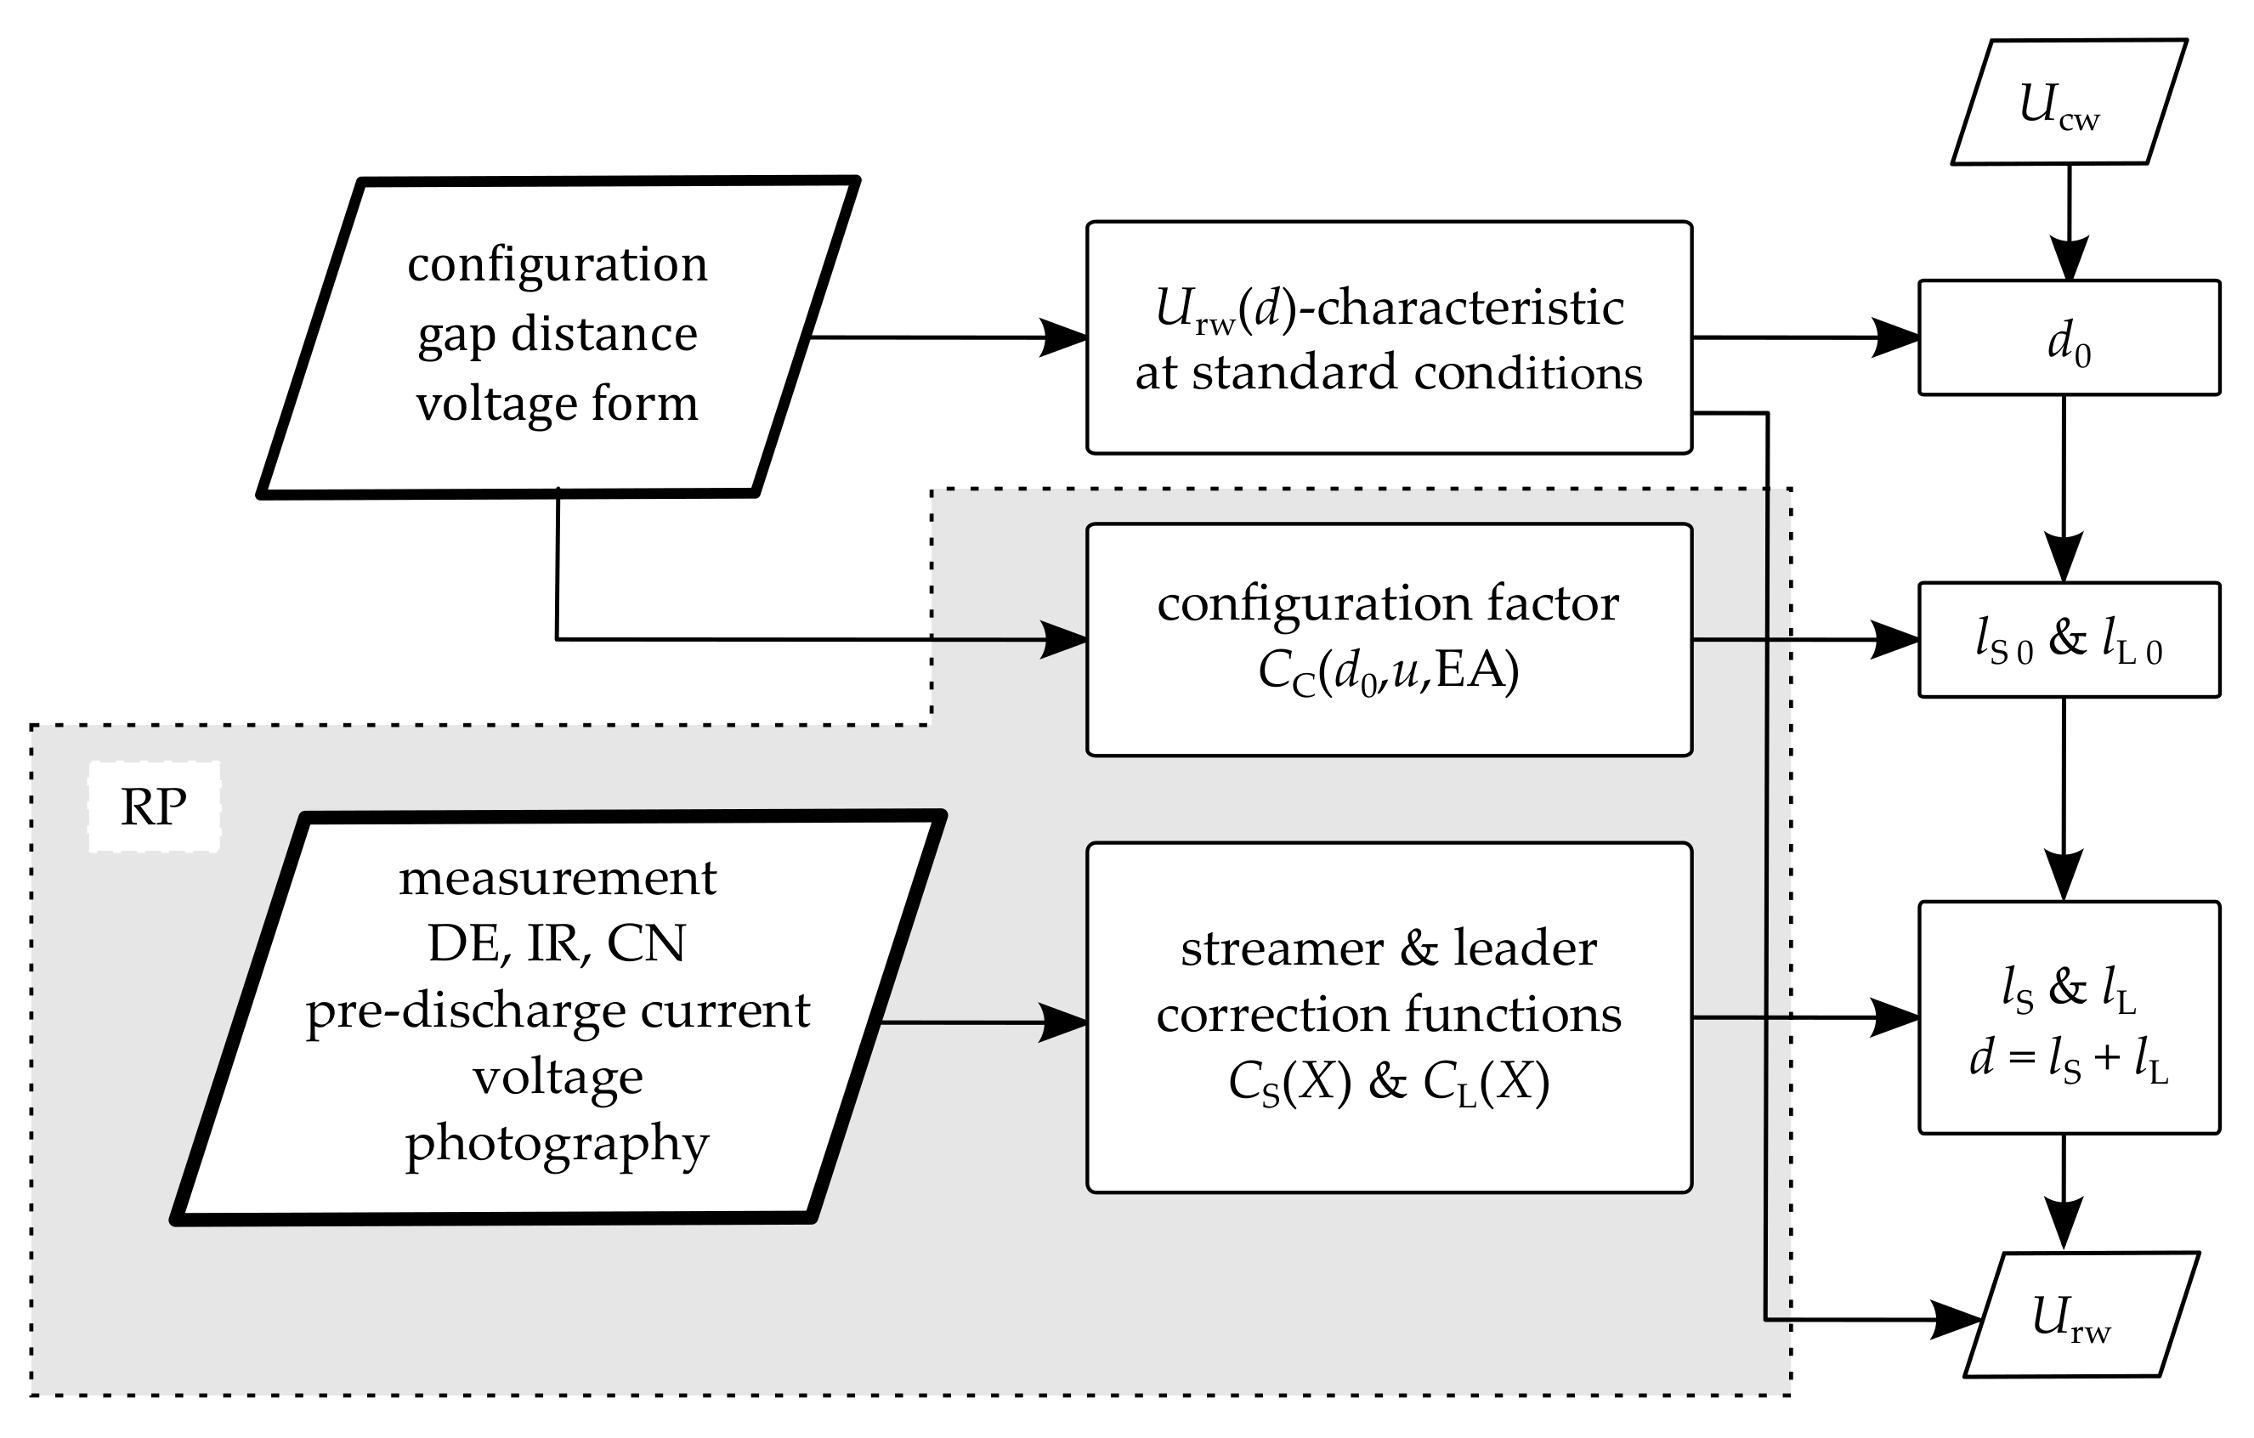
3.2. Hypothetical Atmospheric Correction Method Based on Physical Breakdown Model

(a) Theoretical Basis
The analysis and model development based on the measurement data shall be illustrated through the following description of a hypothetical atmospheric correction method for arbitrary configurations and voltage forms. The algorithm thereby corrects any of the atmospheric parameters mentioned above, hence the correction method will refer to a general, surrogate (X therefore symbolically represents air pressure p, air humidity ρ ( p , ϑ ) , temperature ϑ or air conductivity σ (all of them at the altitude A of the installation site).) atmospheric parameter X.
Furthermore, the description will refer to the correction of withstand voltages in context of insulation co-ordination, meaning the calculation of the rated withstand voltage at standard atmospheric conditions U rw based on the co-ordination withstand voltage U cw at the altitude-dependent atmospheric conditions of the installation site.
However, the method is also applicable for the correction of breakdown voltages in the context of high voltage testing. A principle flow-chart of the correction method under said conditions is illustrated in Figure 9, followed by a detailed clarification.
Any breakdown process in air-gap insulations consists two main sub-processes, namely streamer and leader discharges [3]. Considering the general Equation (15), any breakdown voltage U b 50 —and therefore any withstand voltage U b 10 = U cw as well—can be calculated with the exact knowledge of the involved lengths S , L and voltage gradients E S , E L of positive and negative streamers and leaders in the instant before the final jump [19].
U b 50 = E S + · S + + E L + · L + + E S · S + E L · L
For an arbitrary gap distance d, Equation (16) defines d as the sum of streamer and leader lengths. They can be ascertained using modern photographic high-speed equipment such as in [26].
d = S + L = S + + L + + S + L
The atmosphere-dependent characteristics of the streamer and leader parts (lengths, pre-discharge currents and voltage gradients) are determined and quantified in the analysis of the measurement data. Thus, among other evaluations, the X-dependent streamer and leader lengths for any configuration and fixed withstand voltage U b 10 are ascertained, as illustrated as in Equation (17).
d ( X ) = S ( X ) + L ( X )
A statistical analysis of the atmospheric parameter study permits the derivation of the two correction functions C S ( X ) and C L ( X ) for the streamer and leader lengths, respectively for each manifestation of X and in correspondence to Equations (18)–(20).
S ( X ) = C S ( X ) · S 0
L ( X ) = C L ( X ) · L 0
d 0 = S 0 + L 0
According to [14], the streamer voltage gradient E S is independent of the atmospheric conditions, while that independence doesn’t apply for the leader voltage gradient E L . However, for the illustrated correction method of the paper at hand, a general gradient independence is assumed. Should the investigations refute this assumption, the necessary gradient correction functions shall either be determined by the evaluation of separate gradient correction functions in analogy to C S ( X ) and C L ( X ) , or through usage of the calculation models of [27].
For each configuration and any fixed withstand voltage, the variables S ( X ) , L ( X ) and d ( X ) represent the equivalent, atmosphere-dependent lengths of streamer, leader and (flashover) gap distance (The approach over a fixed voltage (rather than a fixed gap distance) is based upon the quasi-linearity of equivalent flashover distances, as shown in [12,14] (similarity law)).
In order to decouple the influences of voltage form (u) and configuration (electrode assembly; EA) from the influence of atmospheric conditions, the definition of an atmosphere-independent configuration factor 0 C C 1 in accordance to Equation (21) is proposed.
C C d 0 , EA = S 0 d 0
The proposed configuration factor C C describes the length-related streamer part in the breakdown process dependent on the configuration and voltage form, all in reference to standard atmospheric conditions.
At standard atmospheric conditions, the streamer and leader lengths of any configuration and voltage form can then be calculated in accordance to Equations (22) and (23), if the configuration factor C C is known.
S 0 = C C · d 0
L 0 = 1 C C · d 0
The authors hypothesize that the streamer and leader correction functions C S ( X ) and C L ( X ) only depend on the respective atmospheric parameter X, while being quasi-independent of configuration and voltage form. Thus, for a known streamer to leader ratio by a given factor C C d 0 , u , EA of any configuration and voltage form at standard atmospheric conditions, it should be possible to describe the atmosphere-dependent change of that ratio by using only C S ( X ) and C L ( X ) .
In terms of determination of C C , the configuration factor shall first be evaluated during the planned measurements. Since they only include model configurations like rod-rod or rod-plane assemblies, it naturally begs the question of how to treat more realistic and therefore complex gap configurations. That, however, is essential in light of the intention to develop a universally applicable atmospheric correction. In this regard, the authors postulate that the configuration factor C C can be ascertained via already known factors and functions (like gap factor K, factor G 0 , the Schwaiger factor η , etc.), yet also via the calculation models of [27] (confer Appendix B.6).
Such a configuration factor C C should therefore permit the usage of the correction functions C S ( X ) and C L ( X ) to correct atmospheric influences in voltages without high variances in the results.
(b) Practical Application
The atmospheric correction has to be based upon already known voltage-gap-characteristics at standard atmospheric conditions for any configuration in question. For instance (and with reference to the beginning of this section), the basis for insulation co-ordination shall be the known U rw ( d ) -curves (They are equivalent to the U b 10 0 ( d ) -curves, which, in turn, are deduced from the well known U b 50 0 ( d ) -characteristics.) for typical standard configurations at standard atmospheric conditions. Considering atypical, more realistic configurations, the required U rw ( d ) -curves can be calculated, if the corresponding configuration factor C C has been determined beforehand.
The algorithm of the proposed atmospheric correction method is illustrated in Figure 10, thereby in the context of insulation co-ordination and under the assumption that C S ( X ) , C L ( X ) and various C C were determined in the course of these investigations (confer Appendix B.7). The algorithm can be summarized in the three following steps:
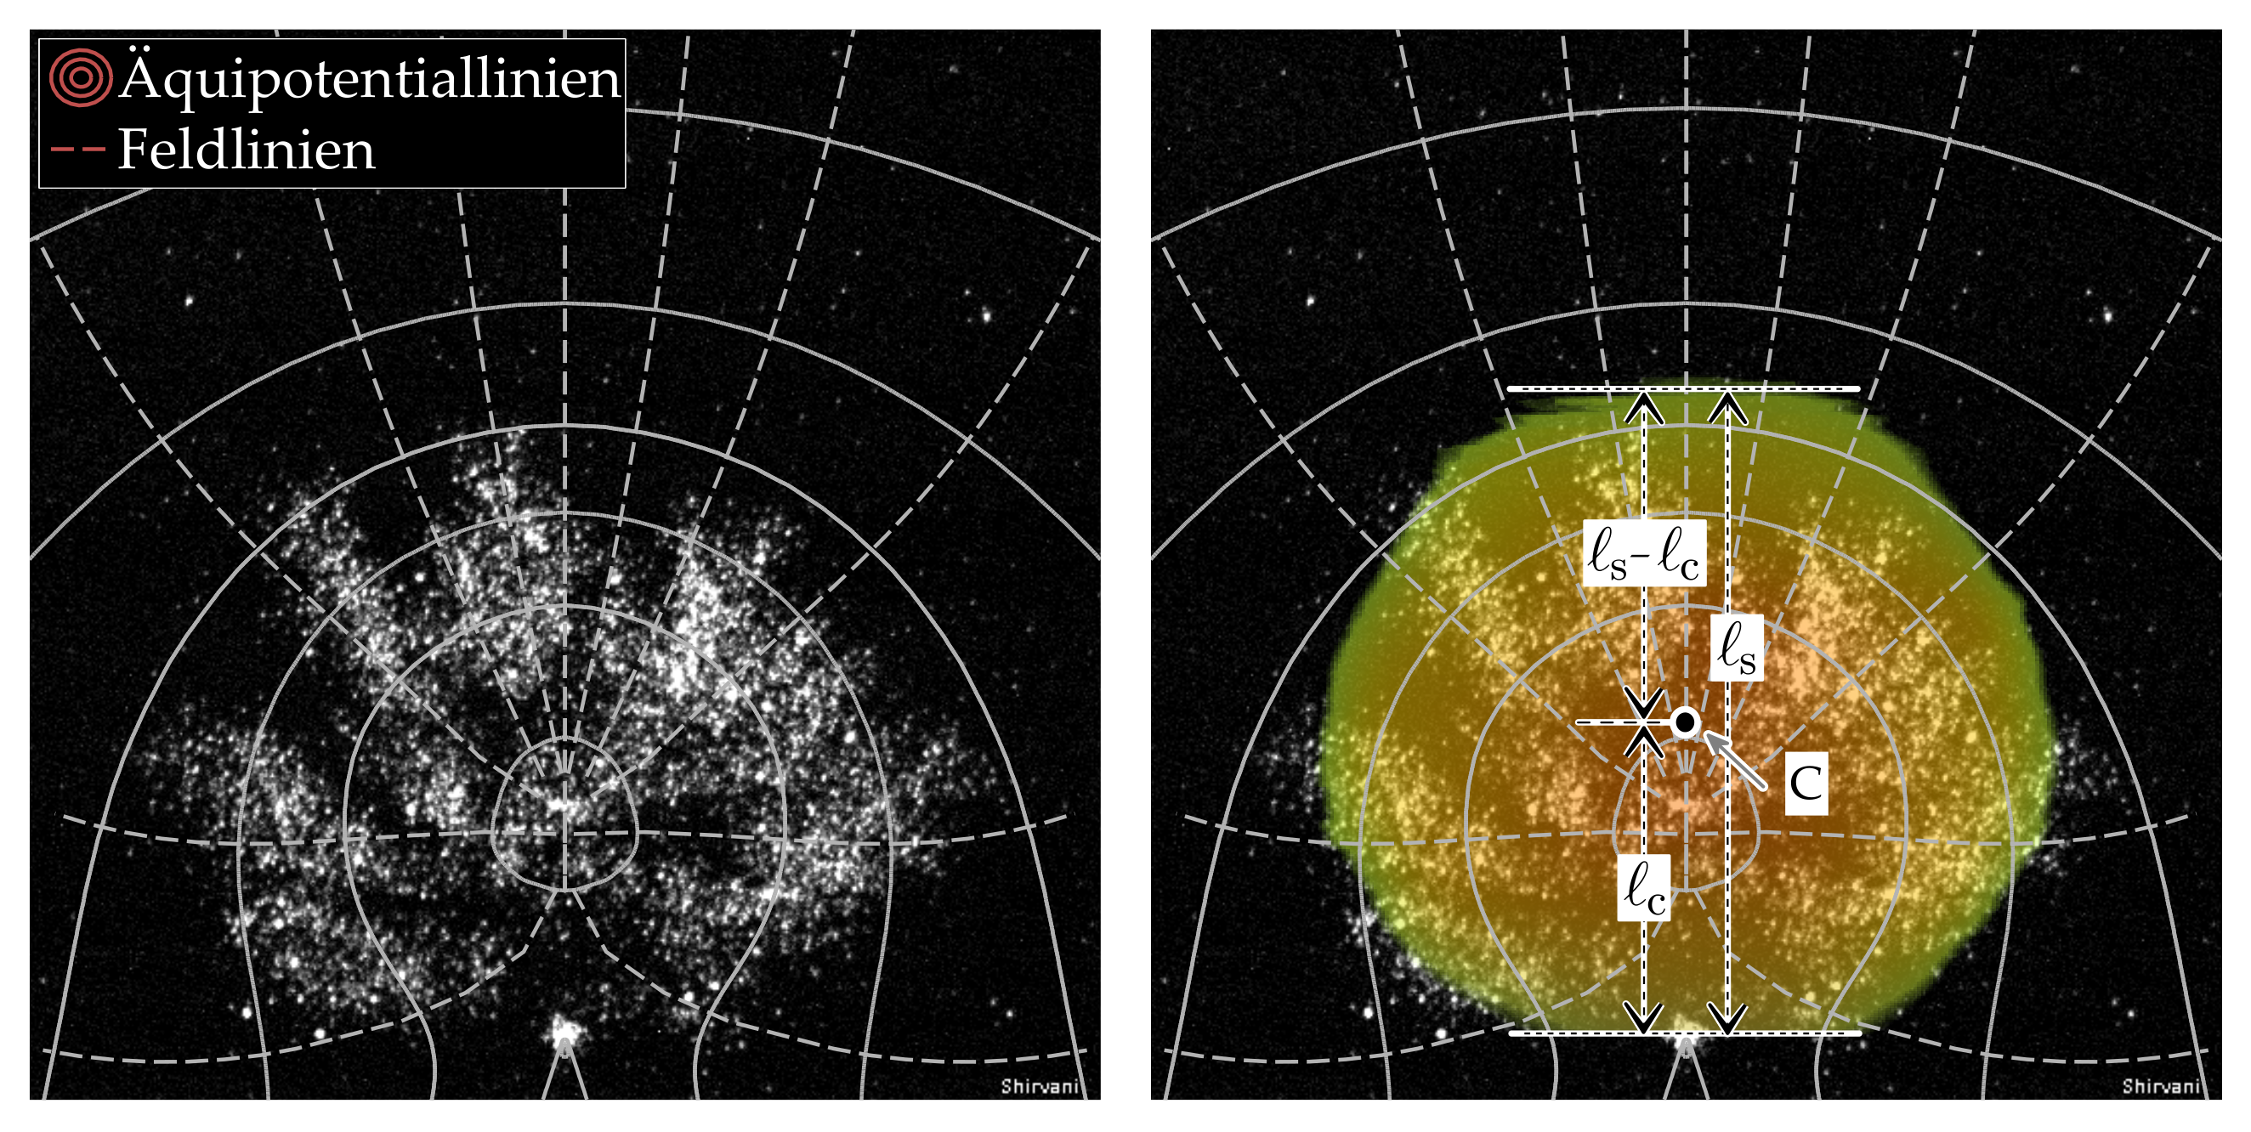
  • At the installation site of a freely chosen altitude A, arbitrary conditions of the surrogate atmospheric parameter X apply. Based upon the U rw ( d ) -curves (either already known for typical model configurations, or calculated through C C d 0 , u , EA ), first, the co-ordination withstand voltage U cw (part of the dimensioning process) for a given configuration is employed in U rw ( d ) to obtain the corresponding gap distance d 0 at standard atmospheric conditions. Then, using C C d 0 , u , EA , the corresponding streamer and leader lengths S 0 and L 0 at standard atmospheric conditions are calculated.
  • Using C S ( X ) and C L ( X ) , the real streamer and leader lengths S and L at the atmospheric conditions of the installation site can be calculated. The initially calculated gap distance d 0 at standard atmospheric conditions can then be corrected to the value d = S + L , representing the necessary, real gap distance at the atmospheric conditions of the installation site.
  • The necessary rated withstand voltage U rw can be calculated through the U rw ( d ) -curves by employing the corrected gap distance d of step 2. U rw represents the required testing withstand voltage of the equipment at standard atmospheric conditions.

4. Conclusions

The paper at hand presents the current knowledge of the atmospheric influences on breakdown and withstand voltages, mainly in the context of (but not restricted to) positive switching impulse voltage, long air gaps and standardization of high voltage testing and insulation co-ordination.
The current methods used for atmospheric correction of breakdown and withstand voltages are derived of empirical models. On the one hand, these models and their corresponding correction methods show inconsistencies when compared against each other, albeit being based upon the same measurements. On the other hand, they are neither suited to correct for atmospheric conditions of altitudes higher than 2000 m a.s.l., nor to correct for ‘extreme/unusual’ atmospheric conditions. Both disadvantages are a result of the historically prudent approach, in order to join various influences into a few single correction functions in light of a simple and universal application.
The authors believe that resolving the inconsistencies and limitations of the current empirical models can only be achieved by developing a new, physical model, which describes different atmospheric influences on the breakdown process in a general validity.
The work of [3] has shown that the commonly known sub-processes streamer and leader are part of any breakdown process, regardless of the respective voltage form. The physical characteristics of streamer and leader seem to be independent of voltage form and configuration and exhibit no significant variance at standard atmospheric conditions.
Therefore, the authors propose a sub-process-differentiated, measurement-based evaluation of the atmospheric influences on streamer and leader, employing the measurement system and models introduced in [25,26]. As a key element, it is hypothesized that the influences of the atmospheric conditions can be decoupled from the influences of voltage form and configuration.
By introduction of the hypothetical configuration factor C C , and the streamer and leader atmospheric correction functions C S and C L , an exemplary concept for a universally applicable atmospheric correction method has been depicted.

Acknowledgments

The publication costs of this article were funded by the University of Applied Sciences Zittau/Goerlitz.

Author Contributions

Uwe Schubert analyzed the current knowledge on atmospheric correction methods. Ali Shirvani performed the depicted groundwork of [24] during his PhD thesis. Ali Shirvani and Uwe Schubert developed the concept for the hypothetical, physical atmospheric breakdown model and a derived correction method. Stefan Kornhuber and Uwe Schmidt contributed the initial motivation and ideas due to their collaborations in committees and working groups of insulation co-ordination. Ede Kynast, the first author of the groundwork of [17], contributed valuable views on state of the art methods and on the key premises of the proposed concept.

Conflicts of Interest

The authors declare no conflict of interest. The founding sponsors had no role in the design of the study; in the collection, analysis, or interpretation of data; in the writing of the manuscript, and in the decision to publish the results.

Abbreviations

The following abbreviations are used in this manuscript:
CNChina
DEGermany
IRIran
LILightning Impulse
RPRod-Plane Configuration
SISwitching Impulse

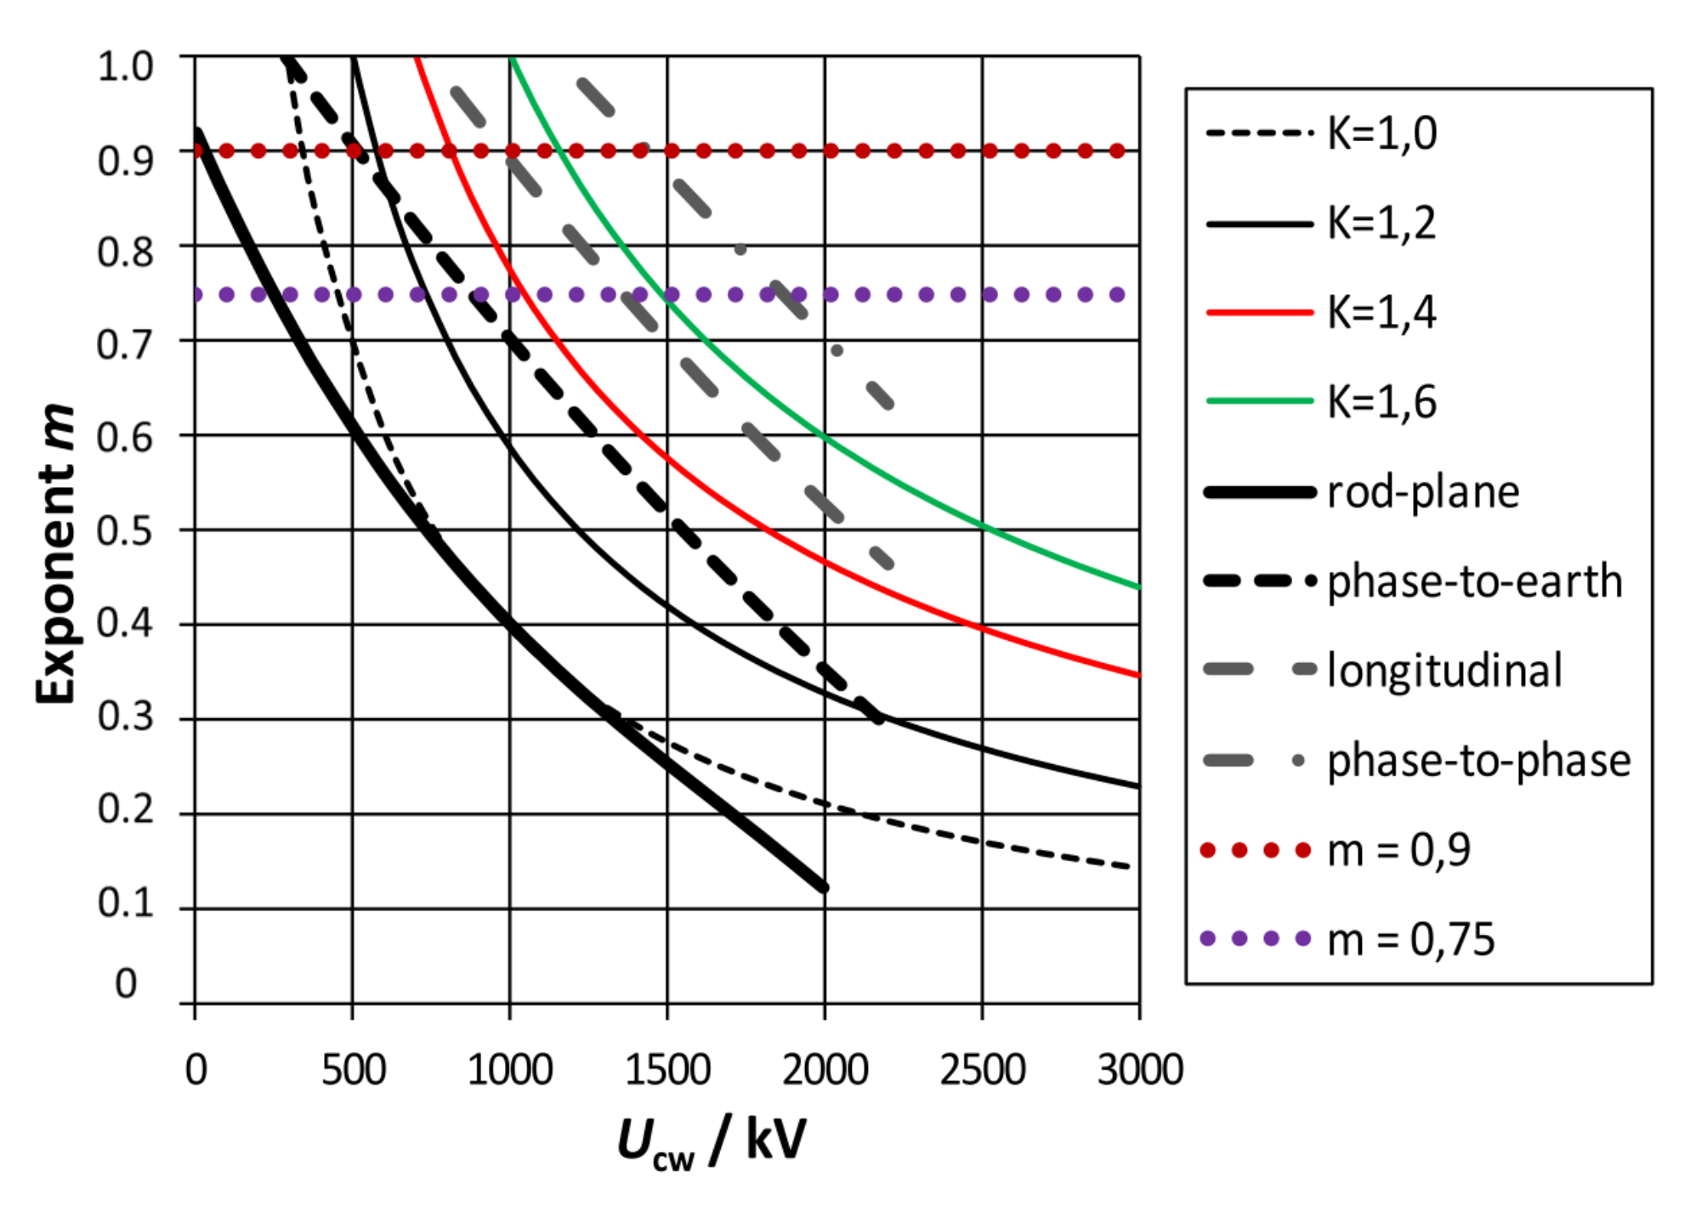
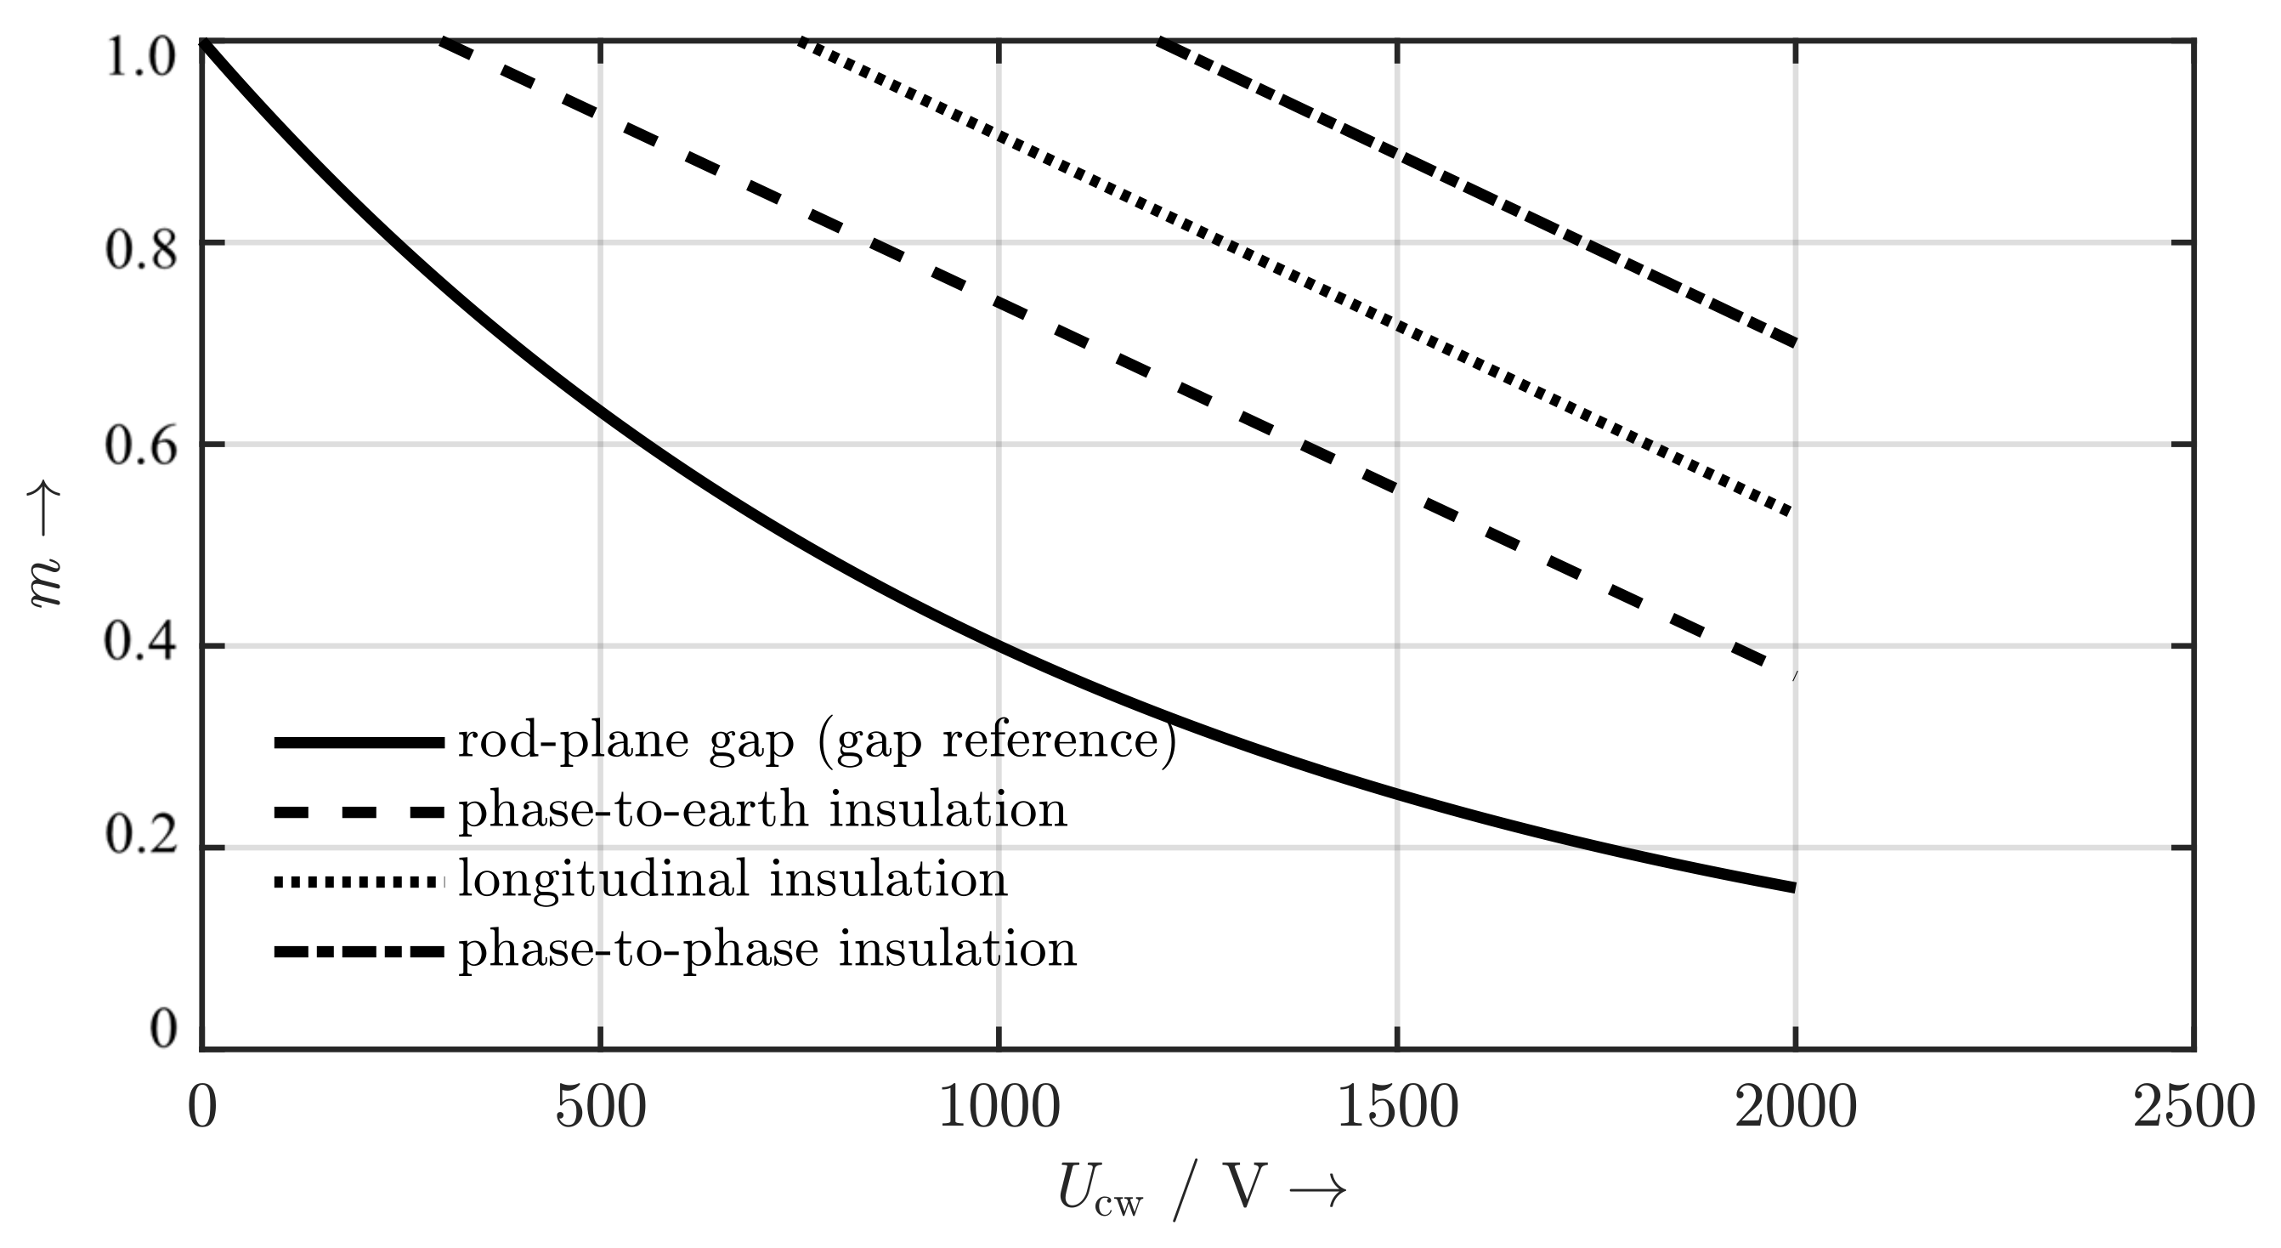
Appendix A. Comparison of Original and Re-Determined m(Ucw)-Characteristics of IEC 60071-2

As stated in Section 2.3, the correction methods and functions of IEC 60060-1 [1] and IEC 60071-2 [2] are derived of the same sets of measurement data. Unfortunately, in the case of IEC 60071-2, the origin of the m ( U cw ) -characteristics is not completely clarified. Therefore, Ref. [17] deals with an approach to iteratively re-determinate these functions. The corresponding algorithm is based upon the following functions: the standardized m ( G ) -characteristic and G-factor of [1], the Paris-formula of Equation (A1) for standard SI breakdown voltage of [2,22], the gap factor K of [2,22] and the 50%-breakdown-voltage over gap-distance characteristics U b 50 ( d ) for typical configurations.
U 50 0 = K · E S + · d 0.6 = K · 500 kV m · d 0.6 for standard SI voltage
The results and findings of the re-determination shall be recited and translated in this appendix in order to emphasize the mentioned inconsistencies between the standards.
The basis for the re-determination algorithm is given through the following steps: Utilizing the equivalencies U cw = U b 10 and U rw = U b 10 0 , Equation (A1) can be inserted in Equation (13) (or Equation (14)) and can then be equated with Equation (7) through d-elimination. For any fixed value of U cw , the resulting equation can be iteratively solved for m using the characteristic m ( G ) .
Figure A1. Functions m ( U cw ) of [2] in comparison to their re-determined counterparts of [17]. Figure reproduced with permission from Kynast, [17]; published by VDE-Verlag, 2016.
Energies 11 00776 g0a1
Figure A1 shows the standardized m ( U cw ) -curves of Figure 4, corresponding to four model configurations, as well as the re-determined m ( U cw ) -curves relating to these configurations through their respective gap factors K.
Distinctive deviations between the standard and re-determined curves can be noticed. It is presumed that the re-determination algorithm depends heavily on the choice of which specific m ( G ) -function to employ, since [21] contains specialized SI-related functions (in contrast to IEC 60060-1 [1]). Furthermore, it might also be possible that the original m ( G ) -curves of [2] were derived by utilization of Equation (A2) instead of Equation (A1), since both are given by IEC 60071-2 [2].
U 50 0 = K · 1080 kV m · ln 0.46 · d + 1 m for SI voltage with critical time to crest
The shown discrepancies and non-replicable function-derivations underline the need for the proposed investigations.

Appendix B. Additional Information

Appendix B.1. Comments on Aspects of Humidity

Furthermore, for open-air installations at ‘common’ installation sites, a compensation of the influences of temperature and air humidity is assumed. All atmospheric influences can then be reduced to an altitude-dependent change of air-pressure [2,15,16,17]. In addition, the current knowledge of the air humidity influence shows a yet to be researched interdependence to the leader length [16]. Hence, further aspects of air humidity won’t be a topic in this overview section. Albeit, the authors strongly endorse more precise studies and plan to conduct those in the course of the proposed research project.

Appendix B.2. Comments on the Gap Factor K

The gap factor K, first introduced in [22], sets the breakdown voltage of any configuration in reference to the breakdown voltage of an equivalent rod-plane-configuration (RP) with the same gap distance. It is specifically valid only under standard atmospheric conditions.

Appendix B.3. Comments on Positive Switching Impulse Voltage

For any fixed gap distance, the minimal breakdown voltage results in scenarios with positive switching impulse voltage due to the optimal leader propagation conditions at the critical time to crest [23] (negative switching impulse voltages result in much higher breakdown voltages). Hence, the positive switching impulse voltage is the most relevant form for questions of dimensioning.

Appendix B.4. Comments on the Equivalences between Breakdown and Withstand Voltages

Thereby, the following equivalences apply: U cw = U b 10 at the installation site in arbitrary atmospheric conditions, and U rw = U b 10 0 at standard atmospheric conditions (10%-breakdown-quantiles represent withstand voltages, 50%-breakdown-quantiles represent breakdown voltages).

Appendix B.5. Comments on Altitude Correction Methods

An essentially equivalent correction method is used in equipment standards, such as IEC 62271-1, only with a more conservative approach for altitudes of more than 1000 m a.s.l. [17].

Appendix B.6. Comments on the Definition of the proposed Configuration Factor CC

The authors acknowledge that the terminus ‘configuration’ usually refers to the sole combination of electrode assembly and gap distance, which can be described through the voltage-form independent Schwaiger factor η . However, for a fixed configuration, the voltage form also determines the ratio of streamer and leader. Thus, in order to implement the proposed streamer-leader-ratio-based approach, the voltage form must be considered. Either within the configuration factor of Equation (21), or through a combination of the Schwaiger factor and the to be determined voltage form factor.

Appendix B.7. Comments on the proposed Correction Algorithm

It should be equally applicable to the correction of breakdown and withstand voltages of high voltage testing applications, since the validity of the mentioned analogies U cw U b 50 and U rw U b 50 0 . Furthermore, the algorithm is not limited to the SI voltage form, since the work of [3] has shown the presence of streamer and leader in all voltage forms at all non-homogeneous configurations.

References

  1. High-Voltage Test Techniques—General Definitions and Test Requirements; IEC: Geneva, Switzerland, 2010; IEC 60060-1.
  2. Insulation Co-Ordination—Application Guide; IEC: Geneva, Switzerland, 1996; IEC 60071-2.
  3. Shirvani, A.; Gürlek, A.; Malekian, K.; Schufft, W. An Analysis of the Lightning Breakdown and its Analogies to the Switching Breakdown. In Proceedings of the 19th International Symposium on High Voltage Engineering (ISH 2015), Pilsen, Czech Republic, 23–28 August 2015. [Google Scholar]
  4. Paris, L.; Cortina, R. Switching and Lightning Impulse Discharge Characteristics of Large Air Gaps and Long Insulator Strings. IEEE Trans. Power Appar. Syst. 1968, PAS-87, 947–957. [Google Scholar] [CrossRef]
  5. Lemke, E. Durchschlagmechanismus und Schlagweite-Durchschlagspannungs-Kennlinien von Inhomogenen Luftfunkenstrecken bei Schaltspannungen. Ph.D. Thesis, TU Dresden, Dresden, Germany, 1967. [Google Scholar]
  6. Group, L.R. Research on long air gap discharges at Les Renardières—1973 results. Electra 1973, 35, 49–156. [Google Scholar]
  7. Hutzler, B.; Hutzler-Barre, D. Leader Propagation Model for Predetermination of Switching Surge Flashover Voltage of Large Air Gaps. IEEE Trans. Power Appar. Syst. 1978, PAS-97, 1087–1096. [Google Scholar] [CrossRef]
  8. Gallimberti, I.; Hepworth, J.K.; Klewe, R.C. Spectroscopic investigation of impulse corona discharges. J. Phys. D Appl. Phys. 1974, 7, 880. [Google Scholar] [CrossRef]
  9. Baldo, G.; Gallimberti, I.; Garcia, H.; Hutzler, B.; Jouaire, J.; Simon, M. Breakdown phenomena of long gaps under switching impulse conditions influence of distance and voltage level. IEEE Trans. Power Appar. Syst. 1975, 94, 1131–1140. [Google Scholar] [CrossRef]
  10. Rizk, F.A.M. Influence of rain on switching impulse sparkover voltage of large-electrode air gaps. IEEE Trans. Power Appar. Syst. 1976, 95, 1394–1402. [Google Scholar] [CrossRef]
  11. Rizk, F.A.M. Effect of Large Electrodes on Sparkover Characteristics of Air Gaps and Station Insulators. IEEE Trans. Power Appar. Syst. 1978, PAS-97, 1224–1231. [Google Scholar] [CrossRef]
  12. Cigre, W.G. Switching Overvoltages in EHV and UHV Systems with special Reference to Closing and Reclosing Transmission Lines. Electra 1973, 30, 70–122. [Google Scholar]
  13. Ramírez, M.; Moreno, M.; Pigini, A.; Rizzi, G.; Garbagnati, E. Air Density Influence on the Strength of External Insulation under Positive Impulses: Experimental Investigation up to an Altitude of 3000 m a.s.l. IEEE Trans. Power Deliv. 1990, 5, 730–737. [Google Scholar] [CrossRef]
  14. Rizk, F.A.M. Critical switching impulse strength of long air gaps: Modelling of air density effects. IEEE Trans. Power Deliv. 1992, 7, 1507–1515. [Google Scholar] [CrossRef]
  15. Gutman, I.; Pigini, A.; Rickmann, J.; Fan, J.; Wu, D.; Gockenbach, E. Atmospheric and Altitude Correction of Air Gaps, Clean and Polluted Insulators: State-of-the-Art Within CIGRE and IEC; D1-213; CIGRÉ Session 2014: Paris, France, 2014. [Google Scholar]
  16. Rickmann, J.; Elg, A.P.; Fan, J.; Li, Q.; Liao, Y.; Pigini, A.; Tabakovic, D.; Wu, D.; Yujian, D. Current State of Analysis and Comparison of Atmospheric and Altitude Correction For Air Gaps and Clean Insulators. In Proceedings of the 19th International Symposium on High Voltage Engineering (ISH 2015), Pilsen, Czech Republic, 23–28 August 2015. [Google Scholar]
  17. Kynast, E.; Schmidt, U.; Hinrichsen, V.; Weck, K.H.P. Von der Atmosphärenkorrektur zur Höhenkorrektur für Luftfunkenstrecken—Hintergründe, Zusammenhänge und neue Ansätze. In Proceedings of the VDE-Fachtagung Hochspannungstechnik 2016 (Hochspannungstechnik 2016), Berlin, Germany, 14–16 November 2016. [Google Scholar]
  18. Kučera, J.; Liao, T.W.; Rohlfs, A.F. Atmospheric Correction Factors For High Voltage Testing. Electra 1972, 21, 74–85. [Google Scholar]
  19. Pigini, A.; Sartorio, G.; Moreno, M.; Ramírez, M.; Cortina, R.; Garbagnati, E.; Britten, A.C.; Sadurski, K.J. Influence of Air Density on the Impulse Strength of External Insulation. IEEE Trans. Power Appar. Syst. 1985, PAS-104, 2888–3000. [Google Scholar] [CrossRef]
  20. Feser, K.; Pigini, A. Influence of Atmospheric on the Dielectric Strength of External Insulation. Electra 1987, 112, 83–112. [Google Scholar]
  21. Cigre, W.G. Guidelines for the Evaluation of the Dielectric Strength of External Insulation; Cigré Brochure: Paris, France, 1992. [Google Scholar]
  22. Paris, L. Influence of Air Gap Characteristics on Line-To-Ground Switching Surge Strength. IEEE Trans. Power Appar. Syst. 1967, PAS-86, 936–947. [Google Scholar] [CrossRef]
  23. Beyer, M.; Boeck, W.; Möller, K.; Zaengl, W. Hochspannungstechnik—Theoretische und Praktische Grundlagen für die Anwendung; Springer: Berlin, Germany, 1986. [Google Scholar]
  24. Shirvani, A. Ein Beitrag Zum Entladungsverhalten Langer Luftfunkenstrecken bei Blitzspannung. Ph.D. Thesis, Universitätsverlag Chemnitz, Chemnitz, Germany, 2015. [Google Scholar]
  25. Shirvani, A.; Schufft, W.; Pampel, H.P.; Schmidt, U. Spatial-temporal investigation of breakdown of long air gaps by lightning voltages up to 2.4 MV. In Proceedings of the IEEE Electrical Insulation Conference (EIC), Ottawa, ON, Canada, 2–5 June 2013; pp. 351–355. [Google Scholar]
  26. Shirvani, A.; Schufft, W.; Pampel, H.P.; Schmidt, U. Spatial-temporal investigation of breakdown mechanism of lightning over-voltages: The measurement system. In Proceedings of the International Symposium on High Voltage Engineering (ISH), Seoul, Korea, 25–30 August 2013. [Google Scholar]
  27. Shirvani, A.; Malekian, K.; Schufft, W. A transient model of lightning breakdown process based on photographic measurements. In Proceedings of the IEEE Electrical Insulation Conference (EIC), Ottawa, ON, Canada, 2–5 June 2013; pp. 90–94. [Google Scholar]
Figure 1. Combined results of various configurations, voltage forms and test sites (qualitatively): Functions n ( G 0 ) after [19] (left) and m ( G ) after [20] respective [21] (right).
Energies 11 00776 g001
Figure 2. Characteristic arrays of curves m ( G , δ ) and w ( G , δ ) after [20] respective [21] (qualitatively).
Energies 11 00776 g002
Figure 3. Functions m ( G ) and w ( G ) according to [1] and after [21].
Energies 11 00776 g003
Figure 4. Functions m ( U cw ) according to and after [2] (qualitatively).
Energies 11 00776 g004
Figure 5. Electrical and optical measurement system out of [25]. Figure reproduced with permission from Shirvani, [25]; published by IEEE, 2013.
Energies 11 00776 g005
Figure 6. Electrical and optical time characteristics out of [24].
Energies 11 00776 g006
Figure 7. (Left): conductive canal and backward wave during LI-breakdown—(Right): leader discharge and streamer head during SI-breakdown. Figure out of [24].
Energies 11 00776 g007
Figure 8. (Left): optical shot of streamer discharge with corresponding computation of the electrical field lines (dotted) and the equipotential lines (drawn through)—(Right): overlay of space charge including the distances of the equivalent representative charge point C. Figure out of [24].
Energies 11 00776 g008
Figure 9. Outline of the proposed research project (RP) and flowchart of the hypothetical atmospheric correction method in reference to the withstand voltage correction of insulation co-ordination.
Energies 11 00776 g009
Figure 10. Algorithm of the hypothetical atmospheric correction method in reference to the withstand voltage correction of insulation co-ordination (qualitative illustration).
Energies 11 00776 g010

