Abstract
This paper proposes a phasor measurement algorithm that is suitable for a distribution network. Under the condition of fixed interval and high frequency sampling, the algorithm uses a dynamic calibration factor to correct the traditional Discrete Fourier Transform (DFT) algorithm, which solves the shortcomings of the rapid decline in traditional algorithm measurement accuracy under the condition of power system frequency deviation or dynamic measurement. Under the high sampling rate of the international distribution network waveform data, the conventional phasor is used to represent the theoretical phasor, and the value of the conventional phasor is compensated to make the result closer to the theoretical value. Finally, the phasor measurement software simulation platform is built in Matlab/Simulink, based on the principle of the algorithm, providing a simulation environment for researchers to verify the phasor measurement algorithm of the distribution network and the fault location, state estimation, or other advanced applications.
1. Introduction
With the development of a wide-area measurement system (WAMS) based on phasor measurement units (PMU), PMU has been fully developed and widely used in the transmission network, which has formed the pattern of many distributions and wide detection ranges, with the ability of dynamic monitoring and online diagnostics [1]. But in the distribution network, phasor measurement technology has not been paid attention to; compared with the transmission network, the technology lags behind for several decades, this is because the traditional distribution network structure is simple, mostly radiate, and the unidirectional tidal current only needs to evaluate the peak load and the fault current, and so on, for transient information, but does not need the PMU to monitor the distribution network time running state in real time [2]. However, with the development of new energy technologies, a large number of distributed energy resource (DER), such as distributed generation (DG), electric vehicles, and controllable loads, are used, resulting in breaking the single-phase power flow mode of traditional distribution networks, affecting the reliability of the power supply and worsening the deterioration of the power quality, and so on. So, the protection and monitoring of the distribution network has been paid more and more attention [3,4,5].
As the last link of power system to the user, the distribution system has great difference in network structure, structure stability, three-phase equilibrium, and load type. Phasor measurement technology has been widely used in transmission systems, but in distribution systems, phasor measurement techniques must be changed, as follows [6,7,8]:
- With the limitation of the feeder line length, the phasor measurement precision of the voltage at both ends of the distribution system will be one of one-tenth or dozens of points of the transmission system measurement error.
- The distribution network line is affected more seriously by the harmonics and noise, so the phasor measurement algorithm has a high stability under the dynamic condition.
- The cost of a phasor measurement device is greatly reduced for the large number of distribution network nodes.
The algorithm is the core of phasor measurement technology [9] and studies the phasor measurement algorithm that is suitable for the distribution network to ensure that the algorithm meets the requirements of the distribution network phasor measurement in three aspects of precision, response time, and real-time performance [10].
Aiming at the above problems, this paper proposes a phasor measurement algorithm based on the Discrete Fourier Transform (DFT) principle, which has the following advantages over existing algorithms:
1. This algorithm solves the general problem of the phasor measurement algorithm, and makes great improvement in real-time, accuracy, and stability, which is applicable to all kinds of situations.
The current phasor measurement algorithms in the transmission field are as follows: Discrete Fourier Transform method, over 0 detection method, wavelet transform method, small phasor method, Kalman filter method, and least square algorithm. Among them, the over 0 detection method’s [11] principle is the simplest, with a relatively easy realization for software and hardware design, but the real time performance is poor and is easily affected by 0 point high harmonics. The Kalman filter [12,13] has good real-time performance, but the Kalman filter belongs to Infinite Impulse Response filter, and with its uncertain group delay, it is difficult to calculate the phase angle accurately. As the object of the phasor estimation is a narrow band signal with a rated frequency as the center frequency, the advantage of wavelet transform [14,15] cannot be well reflected in the narrowband signal with rated frequency as the center frequency, but the complexity of the wavelet analysis affects the processing speed of the phasor measurement. The small phasor method [16] can choose different resolutions according to different applications, to improve the accuracy of the phasor estimation, but its precision is influenced by harmonics, and the data processing is large and the calculation speed is slow. The disadvantage of these algorithms is that they are limited in phasor measurement applications on distribution networks.
2. Compared with the existing DFT algorithm, this algorithm has good dynamic characteristics, which is of great practical significance for judging the distribution network status, predicting the development direction of distribution network, and taking correct and fast protection measures.
The traditional Discrete Fourier Transform (DFT) has a fast operation speed with little computation, and the harmonics have a good inhibitory effect, but the error of the algorithm is larger because of the spectrum leakage under the condition of the frequency shift. In view of the phenomenon of spectrum leakage, some scholars put forward the adaptive correction algorithm, making a synchronous sampling of signals, which means maintaining a multiple relationship of the signal sampling frequency and the actual frequency of the signal. The advantage of this algorithm is its high precision and small computation, but, the window function interception length changes, leading to a poor real-time. The phasor estimation algorithm of the existing commercial PMU is improved by the traditional DFT algorithm, and the amplitude and phase correction make it still have a high measurement accuracy under the condition of a frequency shift. However, when the voltage and current amplitude, frequency, and phase angle show the dynamic conditions, such as low-frequency oscillation, the accuracy of the commercial DFT algorithm drops sharply [17].
3. The algorithm based on the principle of DFT is proposed, and the phasor value of the traditional DFT algorithm is corrected by the idea of the dynamic correction factor, which makes the algorithm not only have the advantage of a fast operation of the DFT algorithm, but also a good estimation accuracy under the dynamic condition. Finally, a platform of phasor measurement software is built on the Simulink, which can measure the phasor parameters of the standard power grid model, and provide researchers with a research platform that can observe the phasor measurement process and verify the accuracy of the algorithm in the software environment.
2. Algorithm Analysis
2.1. Principle Analysis of Phasor Measurement Algorithm
Signal model:
In this formula, A is signal amplitude, f is the actual frequency of the signal, and ϕ0 is the signal’s initial phase angle. A synchronous sampling of x(t) with the sample frequency of fs = Nf0. N is the truncated length of the rectangular window, and f0 is the power signal working frequency, which is 50 Hz. The corresponding sampling interval is Ts = 1/fs = 1/(Nf0). The expression of the discrete sampled signal is obtained as follows:
Using a rectangular window function of length, N, to intercept signal x(k) for DFT transform, as follows:
In the formula, n takes 0 to N, the spectral components of the base frequency of 50 Hz, two harmonics, and high harmonics are obtained respectively X0, X1, X2, …, and XN. Now, the fundamental spectrum X1 is analyzed, and because the power frequency, f0 is 50 Hz, it is also called the frequency phase of signal x(t).
Including Formula (4):
Considering the characteristics of the expressions in the Formulas (5) and (6), now let the dynamic correction factor be P and Q, as follows:
The expression of the fundamental wave spectrum X1, is as follows
For Formula (7), P and Q are the only independent variables of the actual frequency, f, of the power signal, and in practical engineering, the actual frequency range of the signal varies between 45–55 Hz. In MATLAB (R2016a, The MathWorks, Natick, MA, USA), the simulation is shown in Figure 1.
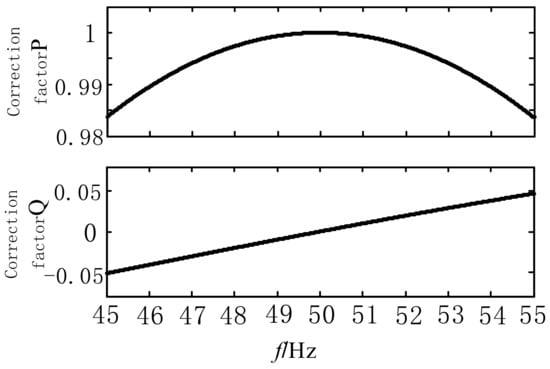
Figure 1.
Change curve of the calibration factor P and Q with respect to frequency.
According to the simulation analysis, as long as the intercept length, n, of the window function is determined, the value of the correction factor P and Q remains unchanged within the 45–55 Hz range; P and Q are very important parameters in the subsequent phasor correction.
The known signal x(t) at the starting point of the theoretical phasor value X is as follows:
The relationship between the power frequency phasor, X1, and the theoretical phasor, X, is known from Formulas (7)–(9), as follows:
From Formula (4), the power frequency phasor X1 can be obtained using DFT. If the frequency X1 can be used to accurately represent the theoretical phasor X, that is, X = f(X1), then the power frequency phasor can be corrected by the correction idea, so that the corrected phasor value is close to the theoretical value. Obviously, in the above expression case, it is not easy to get the correct relationship between the two.
In the actual project, the sampling rate of PMU in the transmission network is generally under 10 kHz [18]. At present, the sampling rate of the PMU product is generally 1200 Hz/4800 Hz/9600 Hz/10 Hz, and the corresponding data window width is 24/96/192/200 points. The phasor data reflects the real-time state of the power grid, and it is of great value for the control, protection, and prediction of the power system to transmit the phasor data to the control center of the power systems at a certain rate. In the theoretical case, the upload rate of the phasor data is fs, that is, the higher the sampling rate, the more the phasor data is obtained in the unit time. Compared with the transmission network, the power quality of the distribution network has deteriorated rapidly because of the variable access and structure of the distributed power system, and the actual engineering monitoring shows that the waveform oscillation of the distribution network is much more severe than that of the grid. In order to grasp the real-time state of the distribution network, in the unit time, the Distribution Network Analysis Control Center needs more phasor data, at which time, the low sampling rate of the transmission grid phase measurement algorithm is no longer suitable for the distribution network phasor measurement requirements. At present, the sampling rate of the foreign distribution network waveform data reaches about [18], and the intercept length of the corresponding window function is at least 4000 points. Based on this, the following approximation is made here:
The Formula (10) can approximate the following:
From the formula, X1 can be used to represent the theoretical phasor X, such as Formula (13).
Because of the mean effect of the DFT algorithm, the amplitude value estimated by this algorithm is the value of the midpoint of the corresponding time window, and the phase value is the value of the first point of the corresponding time window.
2.2. Principle Analysis of Frequency Tracking Algorithm
Frequency is an important parameter of the power system; it is very important to accurately measure the actual frequency of the power system to ensure the stable operation of the power system and flow analysis. At present, the measurement algorithm of the signal frequency has been studied [17], and the precision has reached 0.001 Hz. In this paper, a fast algorithm for the instantaneous frequency of power system oscillation is obtained based on the mathematical analysis combined with iterative and Taylor expansion methods.
From the Formula (2), with the interval of Ts for x(t) sampling, then, the expression of point k, k + 1, k + 2, and k + 3 corresponding to the sample value is as follows:
The result of adding x(k) to x(k + 3) divided by x(k + 1), and x(k + 2) is as follows:
Formula (15) is calculated for m times and the absolute sum is used for compensation, then the equal-ratio theorem is used to obtain the result.
In the formula, a is an x(k) absolute value polynomial summation of the parameters, m, for the molecular denominator absolute values of the number of items added. The idea of the summation of the absolute number of items can not only eliminate the influence of the denominator over 0 points, but also play a role in suppressing the noise. The expression of the real time frequency of the signal is as follows:
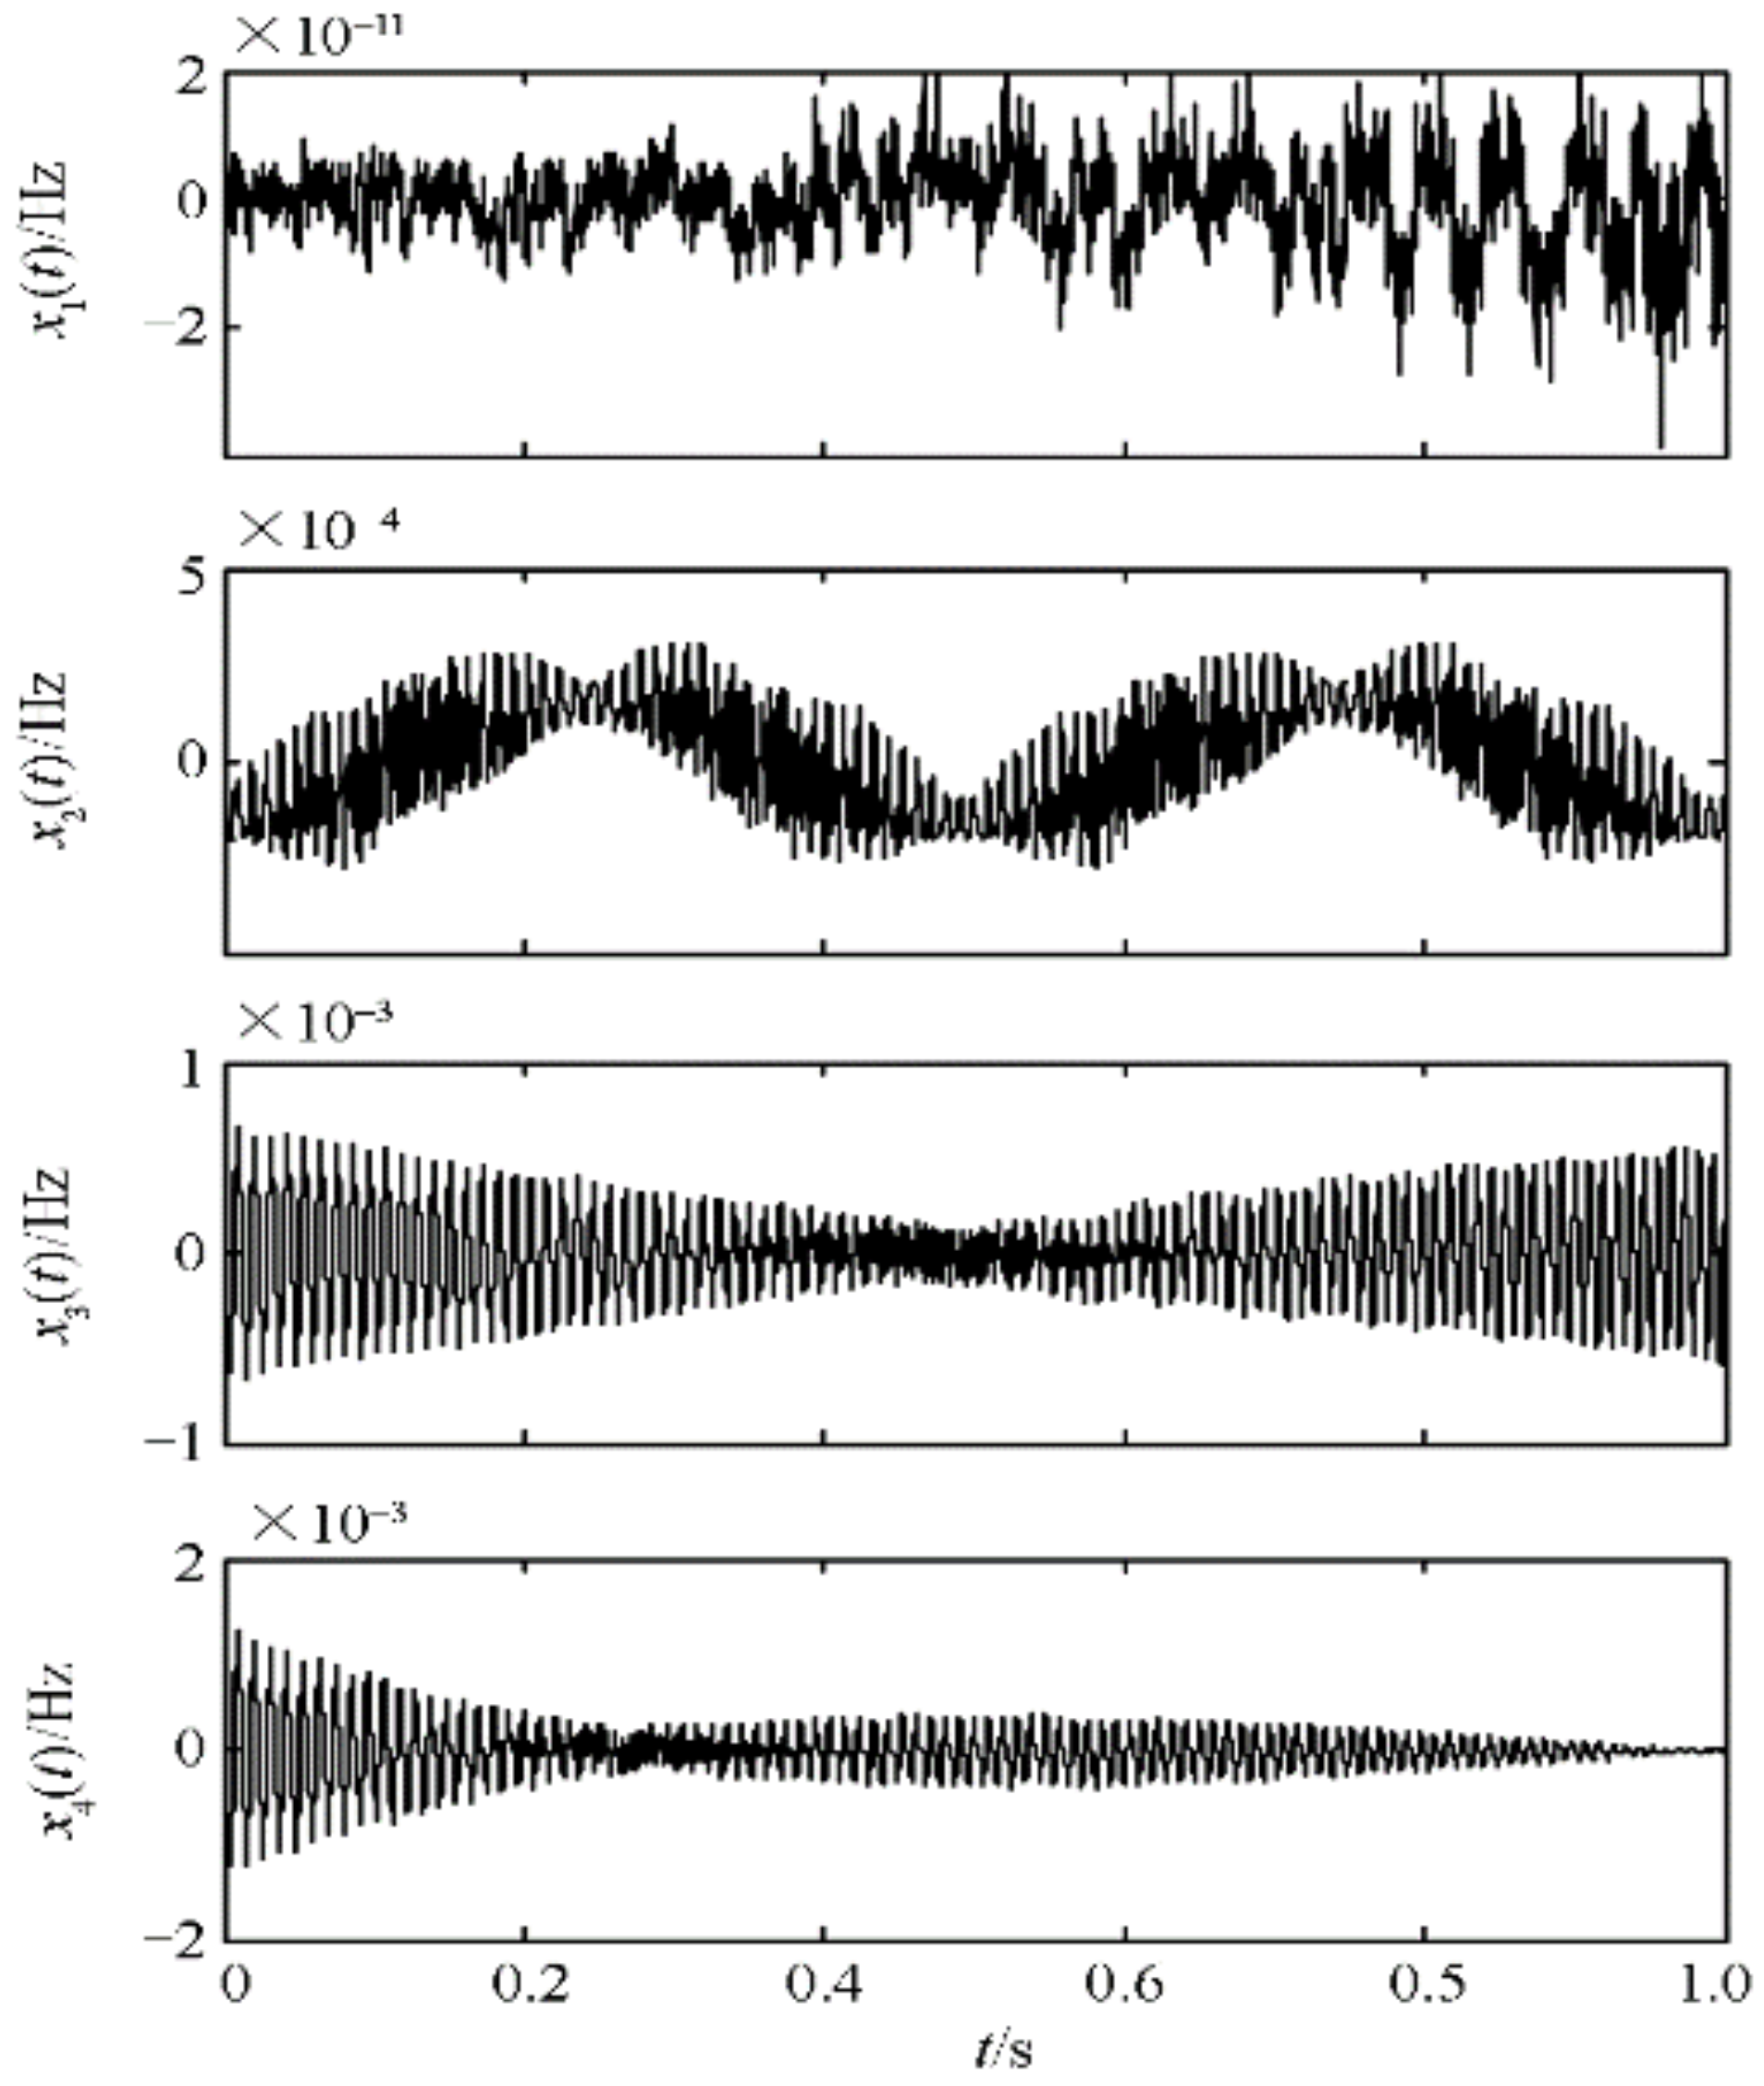
In order to test the accuracy of the frequency tracking algorithm, four different types of input signals are selected, and the frequency tracking accuracy of the algorithm is verified on MATLAB. Table 1 shows the different characteristics of the four signals and the maximum estimation error. Figure 2 is the simulation error of the four signals under the frequency measurement algorithm, and the simulation time is 1 s.

Table 1.
Tracking precision of frequency measurement algorithm.
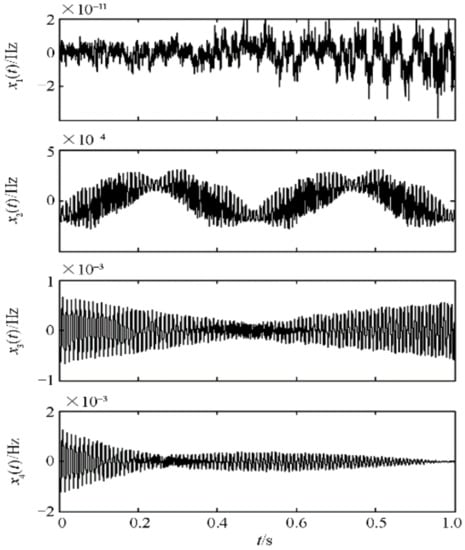
Figure 2.
Frequency tracking error of four different types of signals.
From the above simulation figure, under different types of input signals, the slower the frequency of the signal, the higher the measurement accuracy, especially when the signal only occurs when the frequency is offset, the measurement error reached the 10–11 Hz level. Even in extreme conditions, such as frequency oscillation, the maximum frequency error of the frequency measurement algorithm is 0.001 Hz, which meets the accuracy requirements for 0.002 Hz, as stipulated by the Institute of Electrical and Electronics Engineers Standards.
2.3. Error Analysis of Phasor Measurement Algorithm
In the above two sections, the theory derivation process of the phasor measurement algorithm is completed, and the high accuracy estimation of the power signal parameters, such as amplitude, phase angle, and frequency, are realized. This section mainly simulates the phasor estimation accuracy of this algorithm on the MATLAB platform.
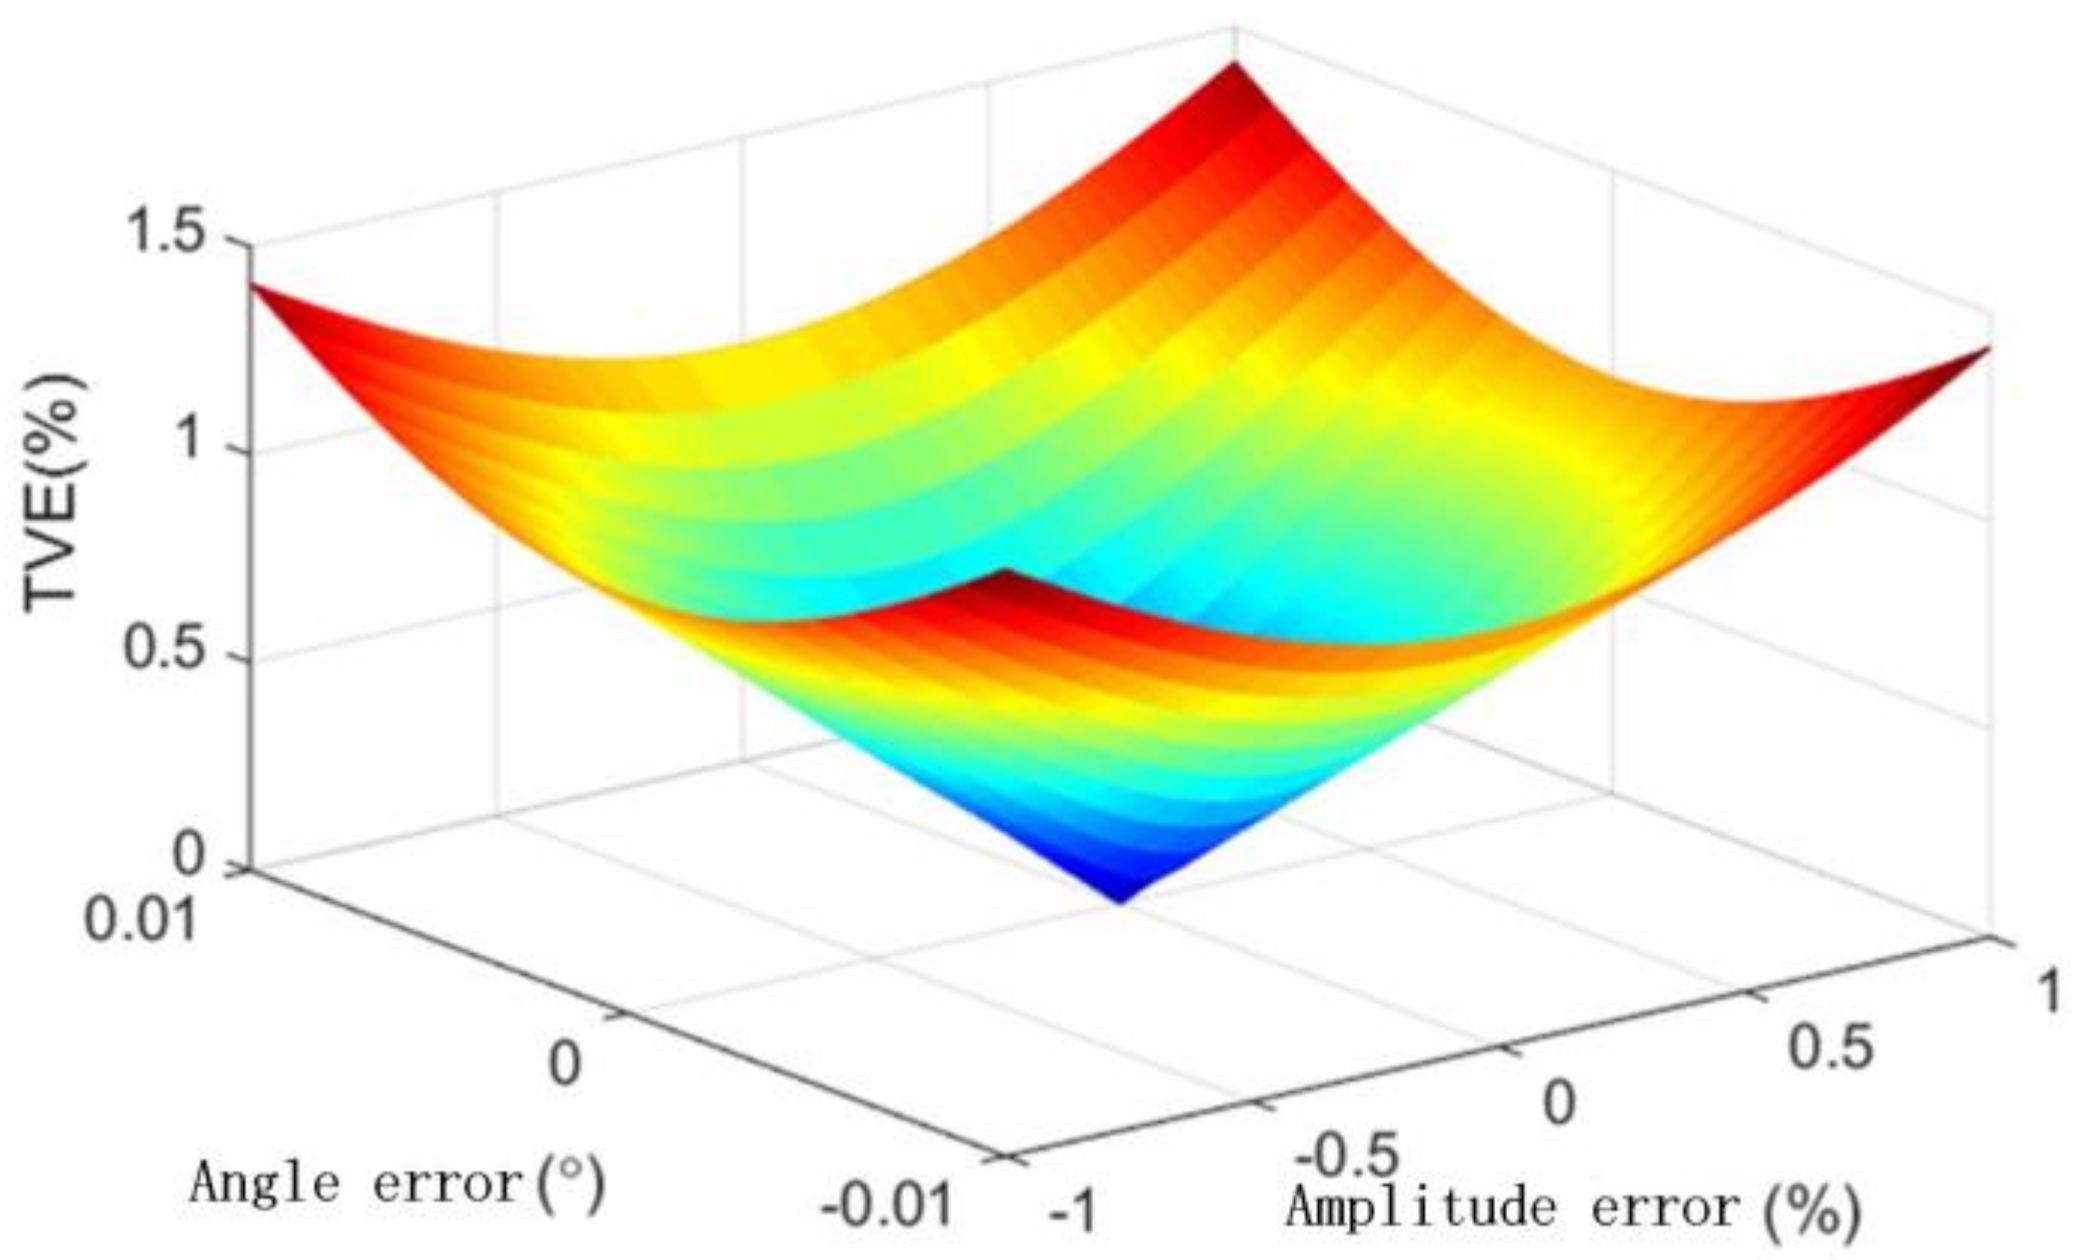
According to the IEEE measurement standard [18], the phasor measurement error adopts the total vector error (TVE), while the Chinese standard ‘synchronous phasor measurement device detection specification for power system’ uses amplitude error and phase angle error to characterize the phasor measurement accuracy [19,20]. Figure 3 shows the relationship between the two standards in China and abroad, and the error analysis in this paper is based on the Chinese standards.

Figure 3.
Total vector error (TVE) on the relationship between the amplitude error and angle error.
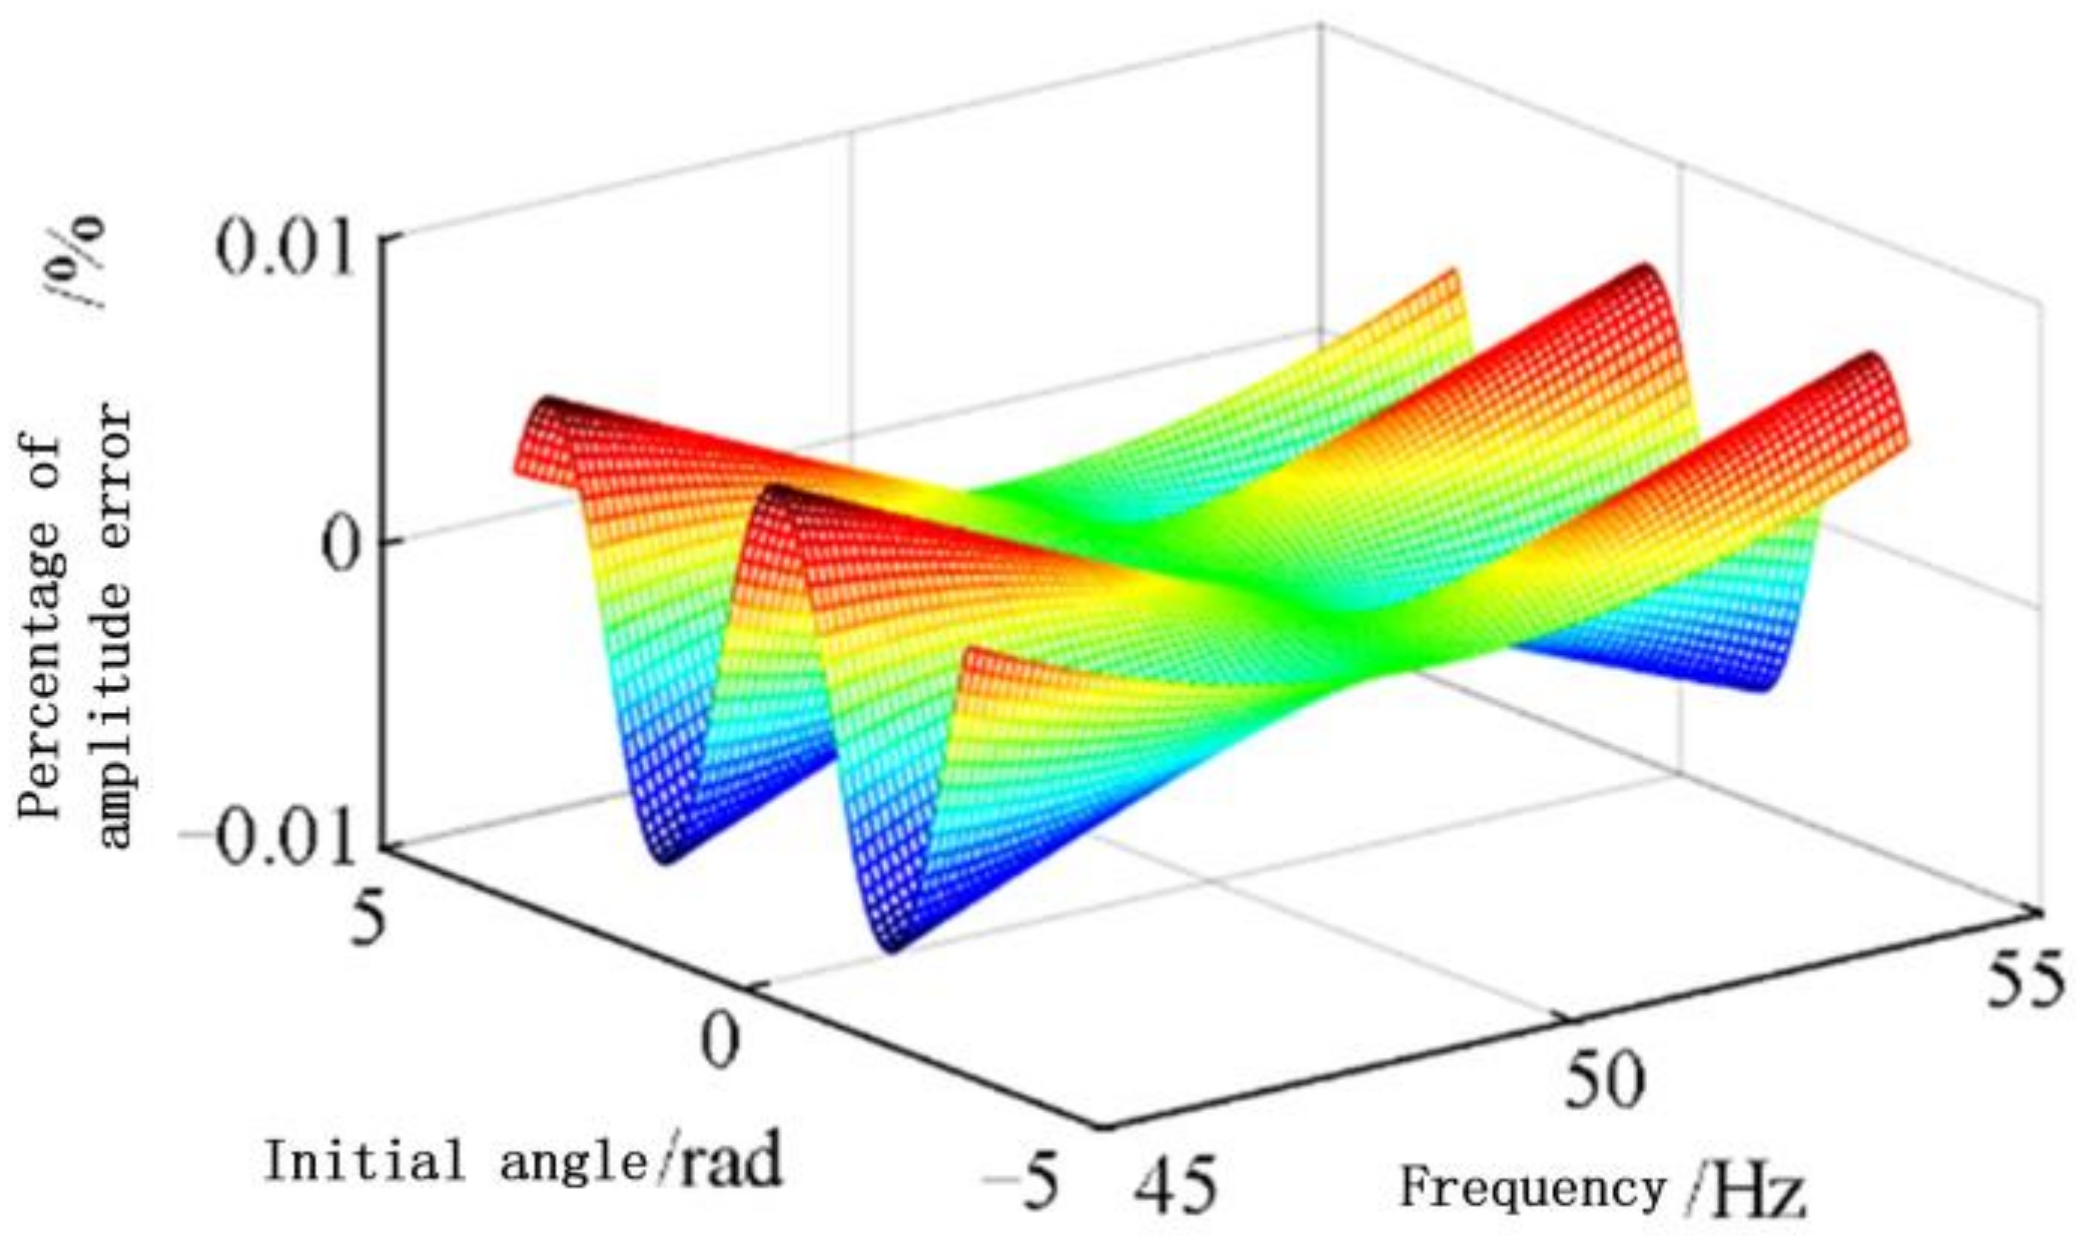
Figure 4 and Figure 5 show the variation of the amplitude error percentage and the phase angle error of the corresponding phasor estimates of the actual frequency, f, of the signal at 45–55 Hz, and the initial phase range from −π to π, in which the sampling frequency, fs, is 200 kHz and the window function length N is 4000.
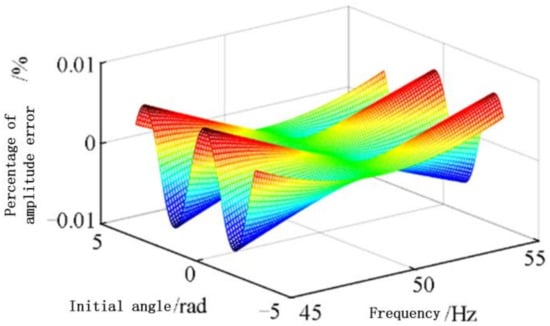
Figure 4.
Amplitude error on the change of relationship between frequency and initial angle.
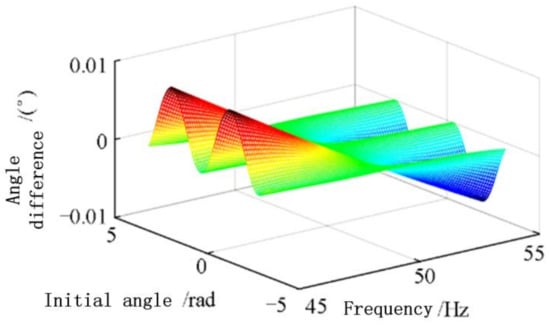
Figure 5.
Angle error on the change of the relationship between frequency and initial angle.
The simulation results show that, when the frequency is constant, the estimation accuracy of this algorithm is similar to that of the sinusoidal law, when the initial phase angle changes. When the phase angle is constant, the estimation precision of the algorithm increases with the error of the frequency offset increasing. In the extreme case of a frequency offset of ±5 Hz, the maximum amplitude error of the algorithm is 0.006%, and the maximum phase angle error is 0.007°, in comparation to the Chinese standard, which has stipulated that the transmission amplitude error is not more than 0.2% and the phase angle error does not exceed the 0.2° precision, which improves by a magnitude of nearly two. In the actual project, the signal frequency fluctuation range of the power system is 50 ± 0.2 Hz, the corresponding amplitude error is within 0.0001%, and the phase angle error is within 0.0001°.
3. Simulation Test of an Example
At present, there is no relevant standard for phasor measurement in China and abroad, but researchers can provide guidance for the phasor measurement of the distribution network according to the current grid measurement standard. The measured performance is mainly composed of static performance, dynamic performance, and response time, which are promulgated by domestic and foreign measurement standards [16,17]. The static performance mainly investigates the frequency offset test, harmonic test, and noise test. The dynamic performance mainly investigates the signal amplitude, frequency, and the modulation test, under the condition of the low frequency oscillation of the phase angle. The response time is mainly for the step test.
In MATLAB software, under the simulation test, the simulation conditions are as follows: sampling frequency fs = 200 kHz, data window length N = 4000, and power frequency f0 = 50 Hz.
3.1. Static Test
Under the static condition, the amplitude and frequency of the power signal are not changed, and the noise, harmonics, and frequency shift are mainly concerned. Because the algorithm is based on the principle of DFT, the DFT algorithm has advantages of suppressing the harmonics and anti-noise, so that the static test only investigates the frequency offset. The static signal model is as follows:
Then, the theoretical phasor of the signal at the t = nTs moment is as follows:
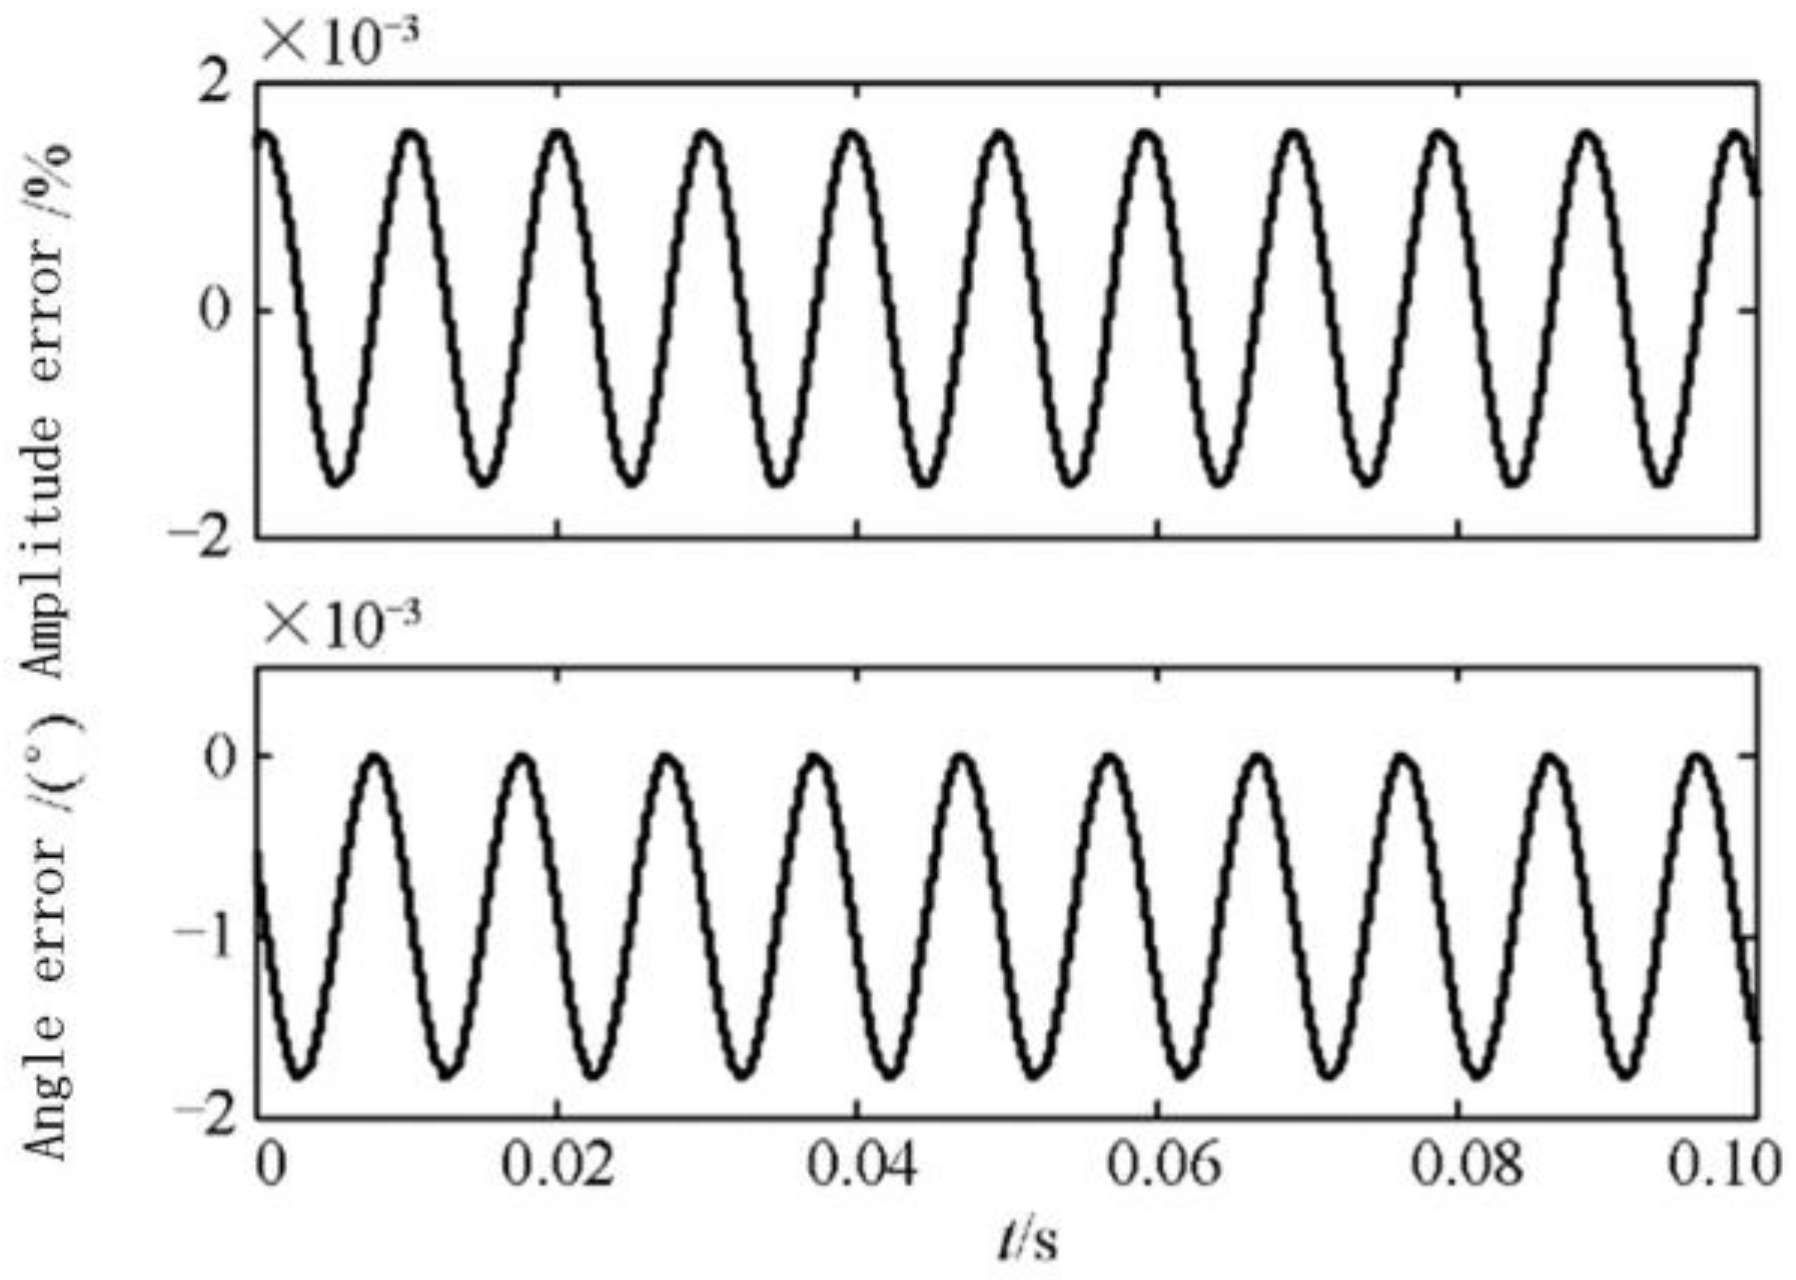
Figure 6 shows the variation of the phasor estimation error over time with the frequency f = 49 Hz, amplitude A = 1, and the initial phase angle ϕ0 = π/6 condition, and the simulation time is 0.1 s. It is observed that, in the case of a frequency shift, the phase error curve is changed with the sine law, and the amplitude error percentage is less than 0.002% and the phase angle error is less than 0.002°. Therefore, the algorithm has high measurement accuracy under the static condition.

Figure 6.
Phasor measurement error under the condition of off-nominal frequency.
3.2. Dynamic Test
In the dynamic condition of the power system, the amplitude, frequency, or phase of the signal is oscillating slowly, which is reflected in the mathematical response to the amplitude modulation signal, Frequency Modulation signal and phase modulation signal.
When the amplitude of the power signal is oscillating, the corresponding expression is as follows:
In the formula, A is the base amplitude, ka is amplitude modulation depth, f0 is the base wave frequency, fa is the modulation frequency, and ϕa is the modulation part of the initial phase angle. At this point, the theoretical phasor corresponding to the signal at t = nTs moment is as follows:
Formula (20) using the formula of accumulation and difference, is as follows:
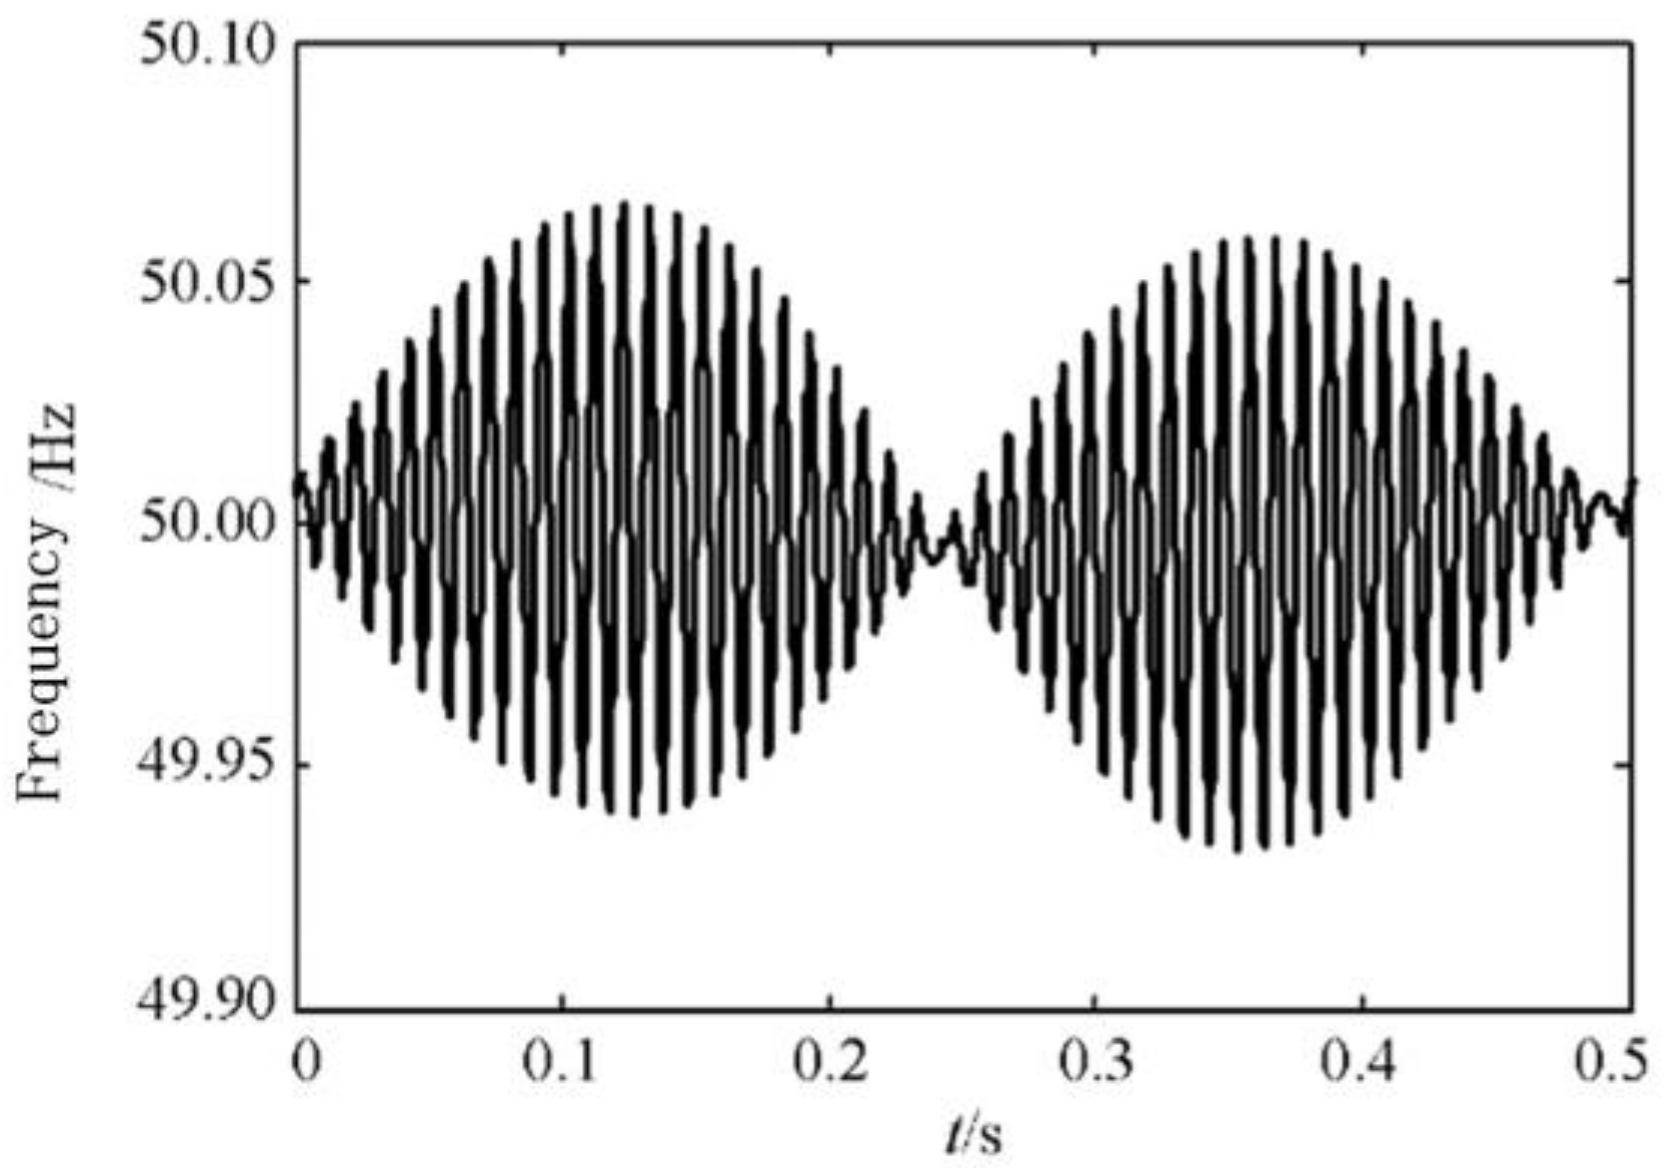
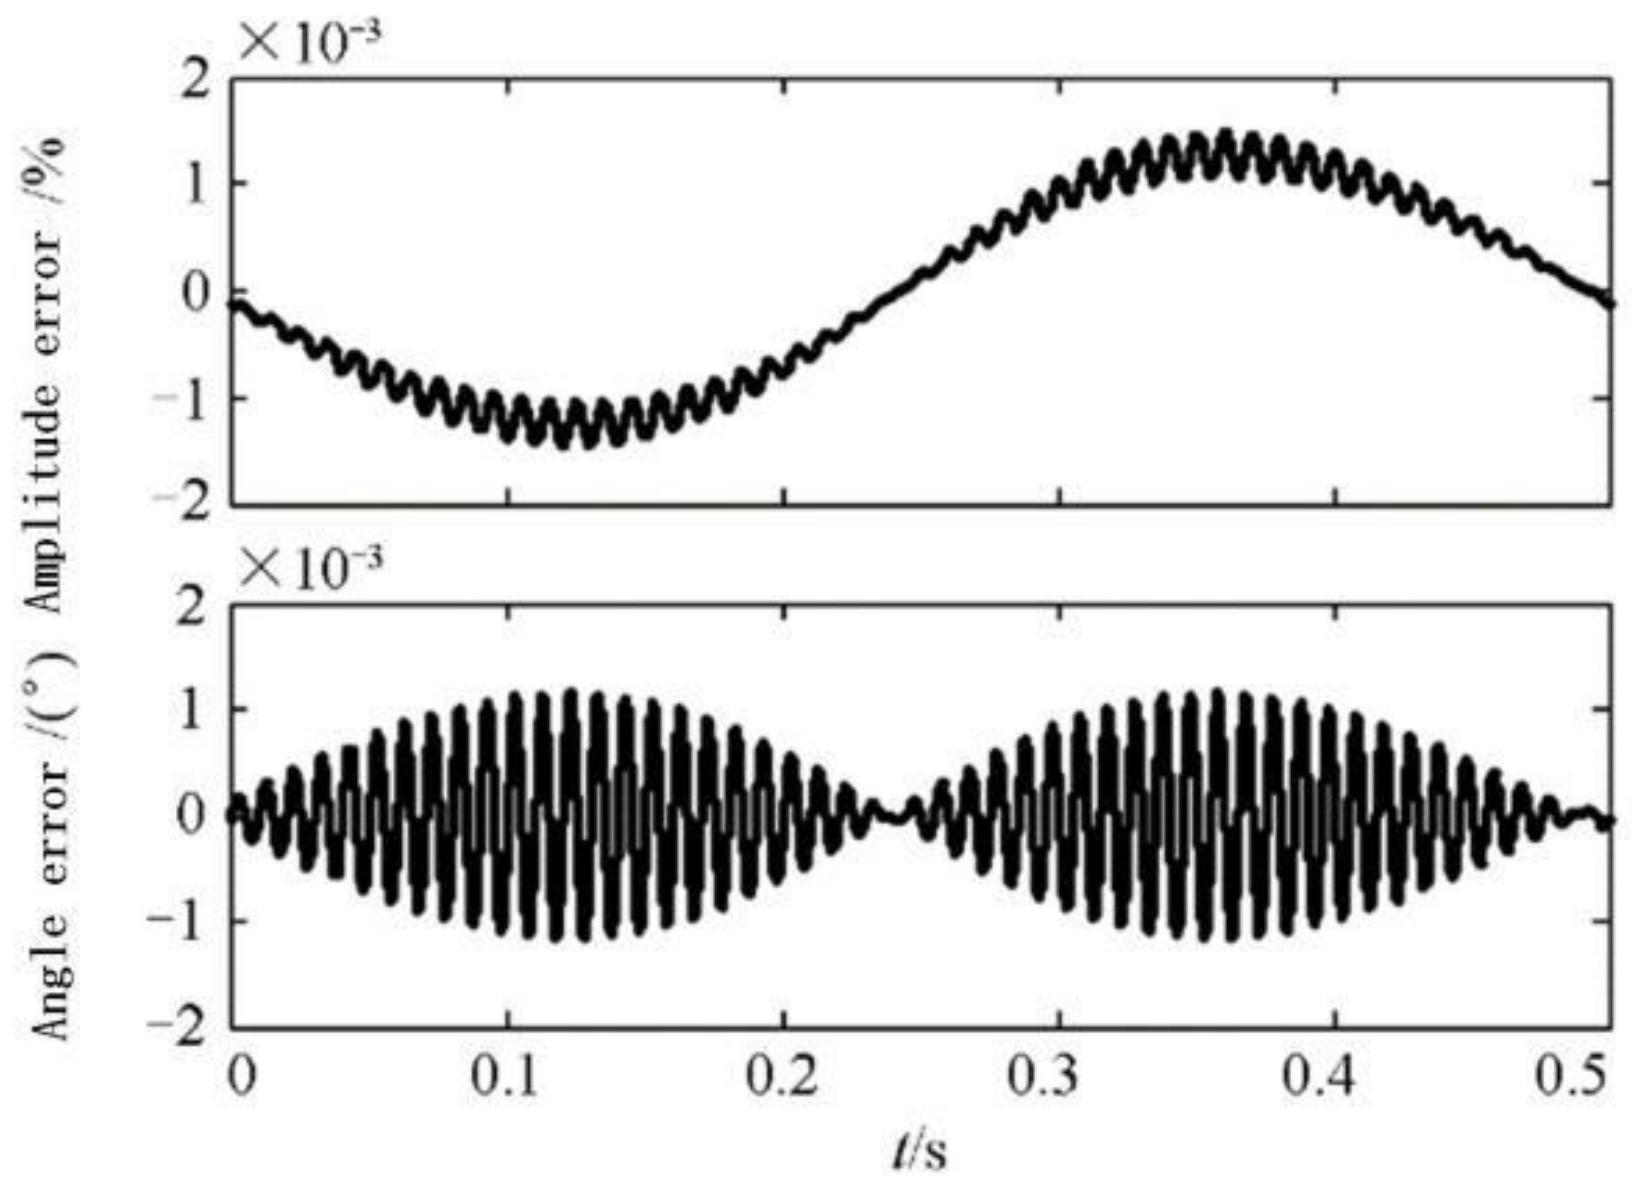
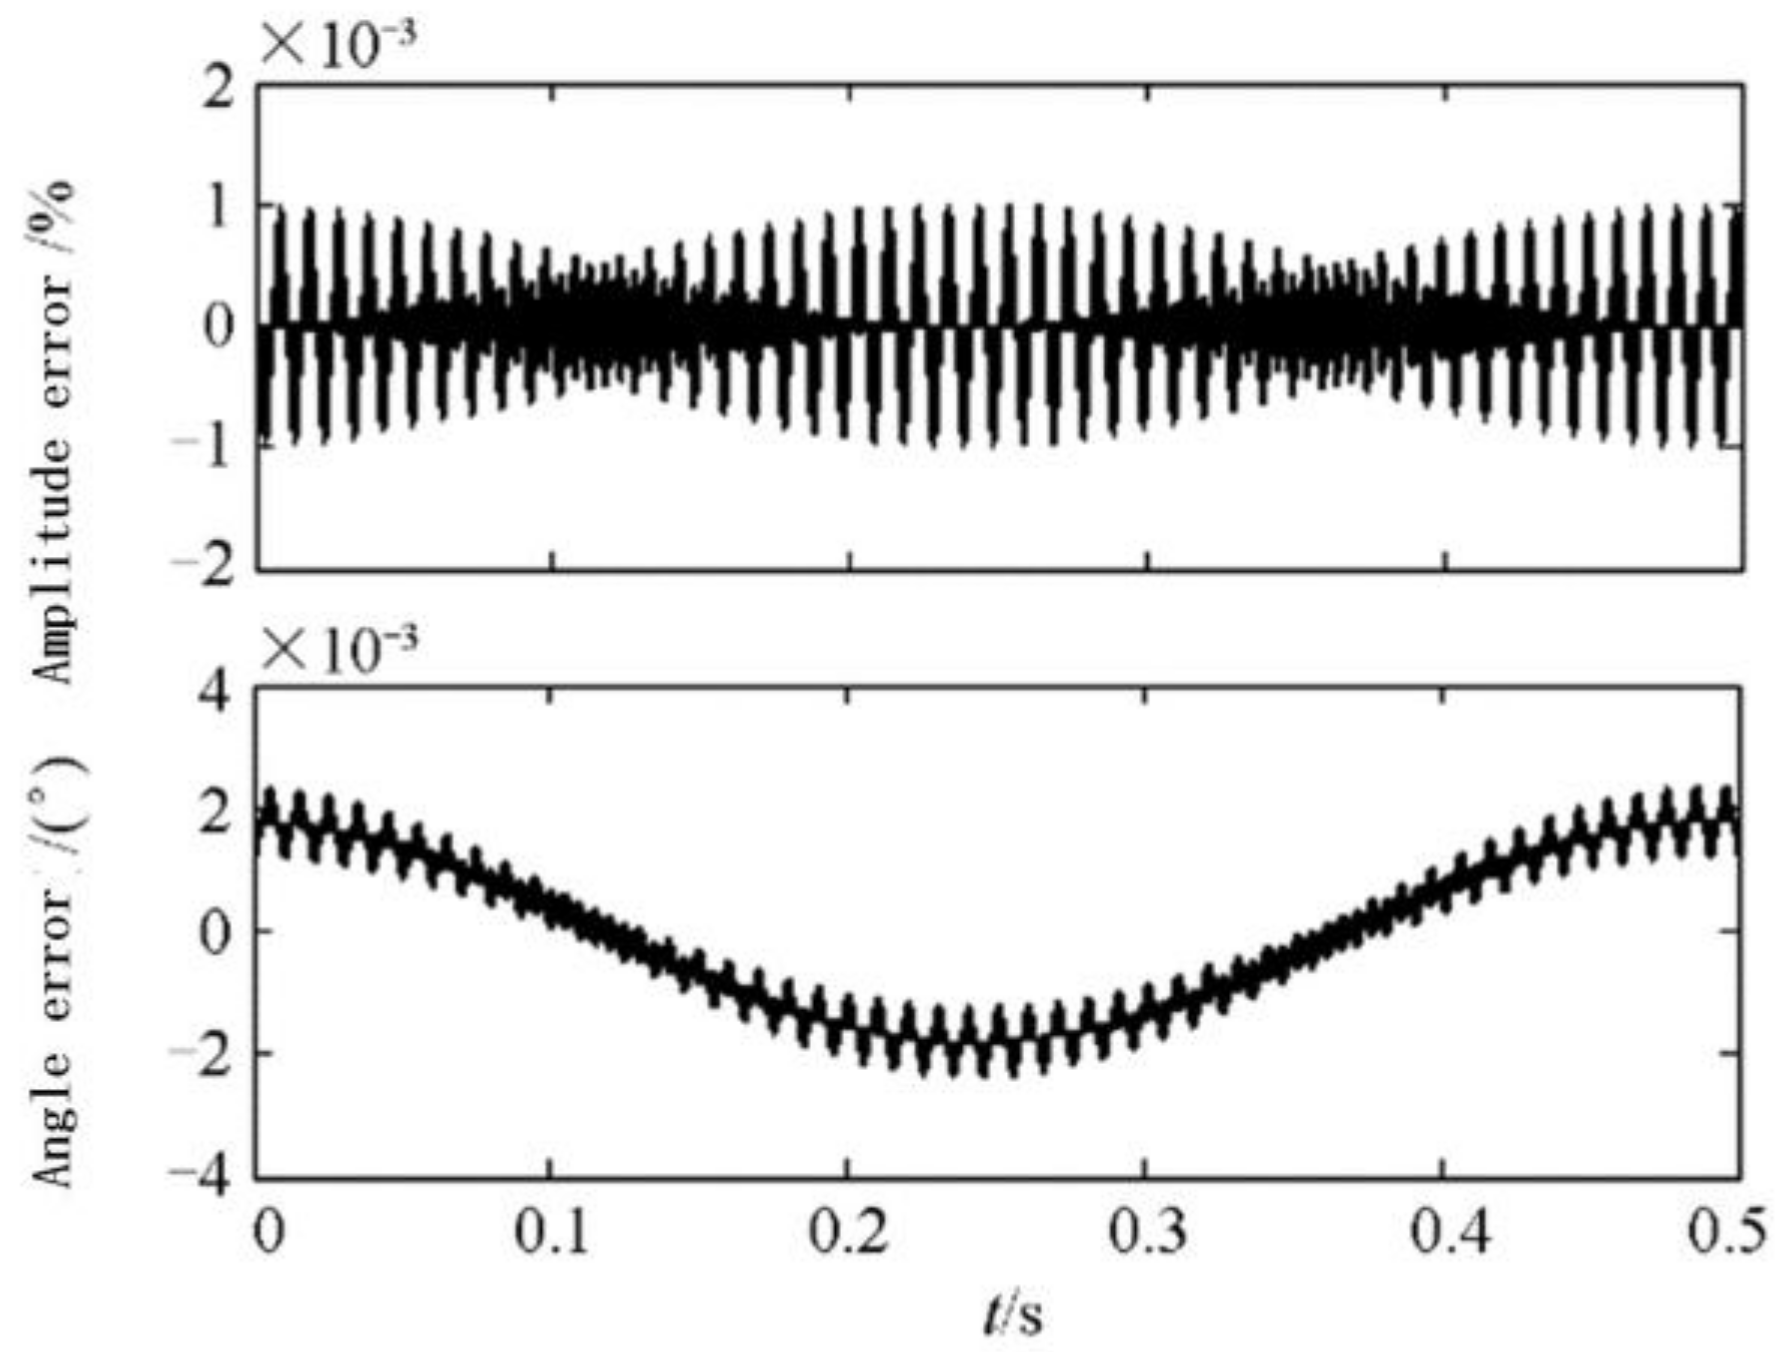
In addition to the base frequency f0 component, the amplitude modulated signal also has the frequency component of (f0 ± fa). Figure 7 shows the real-time tracking effect of the signal frequency under the condition of A = 1, ka = 10%, fa = 2 Hz, ϕa = 0, ϕ0 = π/6. It is shown from Figure 7 that the frequency of the amplitude modulation signal is oscillating with sinusoidal regularity. Figure 8 shows the measurement error of the amplitude modulation signal, the amplitude error percentage is less than 0.0012% and the phase angle error is less than 0.0011°. Therefore, the algorithm has a good measurement accuracy under the amplitude oscillation condition. By comparing Figure 7 with Figure 8, the higher the nominal frequency of the signal is, the greater the corresponding measurement error is, and the simulation results coincide with the theory.

Figure 7.
Real-time frequency of amplitude oscillation.
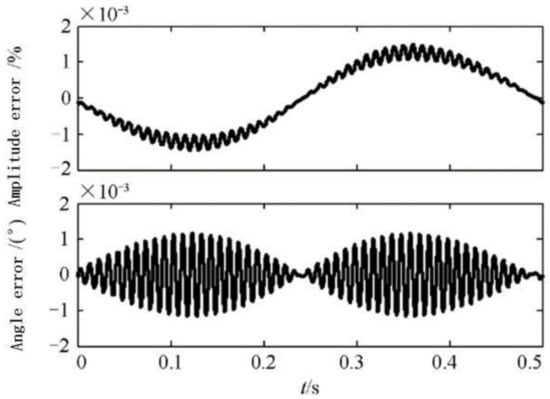
Figure 8.
Phasor measurement error under the condition of amplitude oscillation.
When the power signal frequency is in oscillation, the corresponding expression is as follows:
In the formula, fd is frequency modulation depth, fp is modulation frequency, ϕp is modulation part initial phase, and f0 is base wave frequency. At this time, the theoretical phasor corresponding to signal at the t = nTs moment is as follows:
Because of the differential relationship between the frequency and the phase of the signal, the real-time theoretical frequency of the signal can be the following:
Figure 9 gives the measurement error of the FM signal in the condition of f0 = 50 Hz, fd = 0.5 Hz, fp = 2 Hz, and ϕp = 0 rad, and the amplitude error percentage is less than 0.001% and the phase angle error is less than 0.002°. Therefore, the algorithm has a good measurement accuracy under the dynamic condition of frequency oscillation.

Figure 9.
Phasor measurement error under the condition of frequency oscillation.
3.3. Step Test
Step mutation mainly simulates the change of voltage and the current signal caused by the grounding fault, short circuit, or large disturbance in distribution network. The step test mainly includes the amplitude step test and frequency step test, which verifies the response time of the algorithm in the event of signal mutation. Amplitude Step test signal is as follows:
In the formula, At is the amplitude mutation size and ε(t) is a step function. The frequency step test signal is as follows:
In the formula, ft is the frequency step mutation size. The simulation results show that when A = 1, At = 1, τ = 0.2 s, ft = 0.5 Hz, the response time of amplitude step test is 20 ms, and the response time of frequency step test is 16 ms, which is much smaller than the standard 30 ms, so it verifies that the algorithm has a fast response speed.
4. Software Platform for Phasor Measurement
In the first three sections, a phasor measurement algorithm for a distribution network is proposed, and the simulation results show that the algorithm has a high measurement accuracy under static and dynamic conditions. In order to verify that the algorithm can realize the function of the phasor measurement in the power grid model, this section proposes to build the phasor measurement software platform on the MATLAB/Simulink platform. Figure 10 shows the internal structure of the software platform to help researchers understand the phasor measurement processes and validate the phasor measurement algorithms on software platforms.
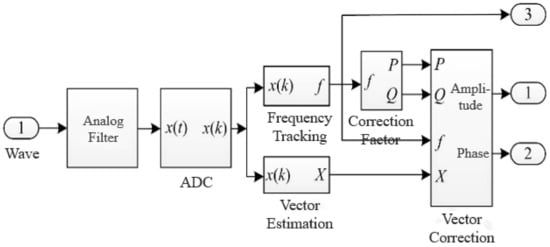
Figure 10.
Internal structure of the phasor measurement simulator.
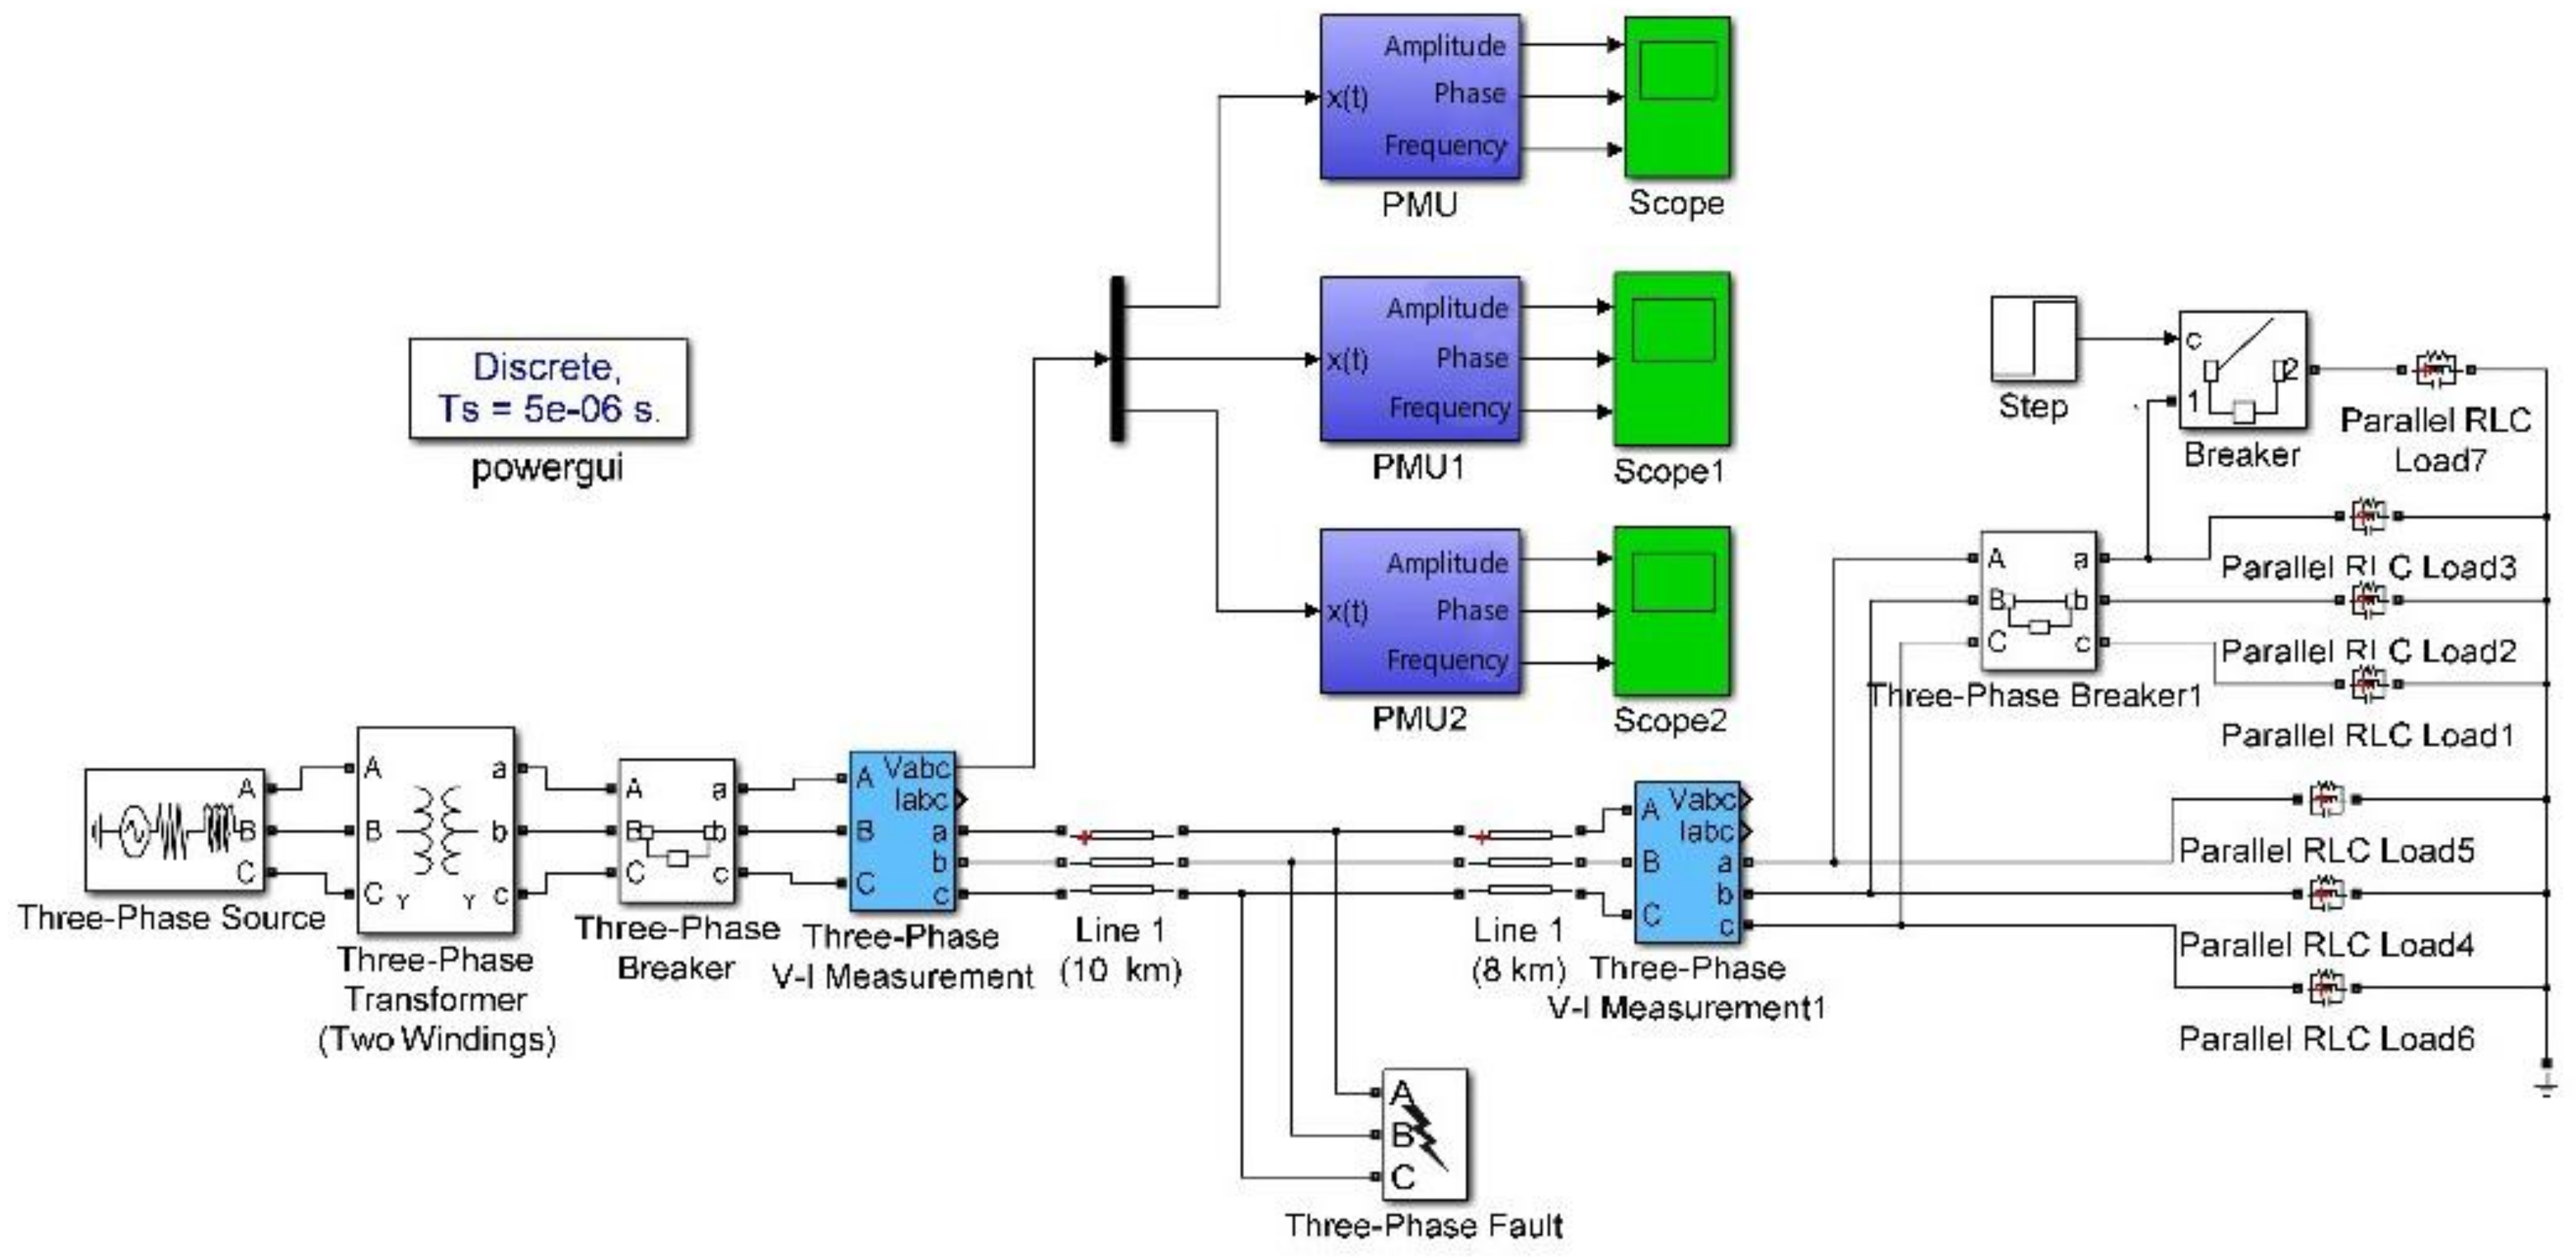
Several standard power grid models have been provided in the MATLAB/Simulink Simpowersystems Toolbox, such as IEEE 5-node and 39-node grid models, and so on, and Figure 11 shows a two-node distribution network simulation model. Among them, PMU is a phasor measurement module. The power grid model is divided into seven parts, such as power supply, transformer, circuit breaker, transmission line, Voltage-Current measuring unit, fault, and load, which can simulate the different working states in the power system, such as the normal state, single-phase grounding fault, dual-phase short-circuit fault, and load surge or sudden drop, and so on.

Figure 11.
A 10 kV distribution network model.
Combined with the power grid model and the phasor measurement software platform, the researchers only need to realize the phasor measurement through IEEE multi-node network simulation model in a software environment, and master the line parameters and real-time running state of the distribution network. Based on this, the phasor measurement simulator is built on the Simulink, and the phasor measurement technology and more advanced application (fault location, state estimation, etc.) can be realized on the software simulation platform. For example, the operating state of the power system can be set to some kind of fault, through the simulator to provide real-time measurement data, using an impedance matching method, traveling wave method or artificial neural network fault location algorithms, fault type identification, or fault location.
5. Concluding Remarks
In this paper, the research on the performance of the phasor measurement algorithm in the distribution network takes into account the response time and the real-time and measurement accuracy of three aspects of consideration, combined with the current high-performance hardware products such as Xilinx company ( San Jose, CA, USA), and launched a seven series integrated circuit board to ensure that the algorithm has a very good engineering research significance and suitable for application in the project. The team's follow-up research will be further studied in the distribution network distributed synchronous phasor measurement devices.
After the full text of the theoretical analysis and simulation test, you can get the following three conclusions:
- In this paper, the algorithm based on DFT for the phasor measurement of a distribution network has high real-time performance. The signal adopts a synchronous sampling, the sampling frequency does not change with the actual frequency, so the window size is kept constant for every time of calculation, which ensures that the algorithm has a high real-time performance.
- This algorithm has good techno-economic benefits. The algorithm is an improved algorithm based on DFT, which inherits the advantages of the fast operation of the traditional DFT algorithm. The algorithm has the characteristics of small computational complexity and effectively reduces the cost of phasor measurement devices.
- The algorithm has a superior performance. The dynamic correction factor is used to ensure that the algorithm has an excellent measurement performance under the condition of static, dynamic test, and step test. Amplitude error, angle error, and response time are much smaller than the international standard.
Author Contributions
Supervision, Project Administration, Z.Z.; Investigation, Resources, Data Curation, R.L. and L.W.; Methodology, Software, Validation, Formal Analysis, Y.W.; Writing-Review & Editing, H.L.
Funding
This research was funded by [National High-tech R & D Program of China (863 Program)] grant number [2011AA 040103].
Acknowledgments
In this section you can acknowledge any support given which is not covered by the author contribution or funding sections. This may include administrative and technical support, or donations in kind (e.g., materials used for experiments).
Conflicts of Interest
The authors declare no conflict of interest.
References
- Duan, G.; Yan, Y.; Xie, X.; Tao, H.; Yang, D.; Wang, L.; Zhao, K.; Li, J. Development status quo and tendency of wide area phasor measuring technology. Autom. Electr. Power Syst. 2015, 39, 73–80. [Google Scholar]
- Fan, M.; Zhang, Z.; Su, A.; Su, J. Enabling technologies for active distribution systems. Proc. CSEE 2013, 33, 12–18. [Google Scholar]
- Wang, C.; Li, P. Development and challenges of distributed generation, the micro–grid and smart distribution systems. Autom. Electr.Power Syst. 2010, 34, 10–14. [Google Scholar]
- Zhao, J.; Zhang, Y.; Zhang, P.; Jin, X.; Fu, C. Development of a WAMS based test platform for power system real–time transient stability detection and control. Prot. Control Mod. Power Syst. 2016, 1, 9–19. [Google Scholar] [CrossRef]
- You, Y.; Liu, D.; Yu, W.; Chen, F.; Pan, F. Technology and its trends of active distribution network. Autom. Electr. Power Syst. 2012, 36, 10–16. [Google Scholar]
- Von Meier, A.; Culler, D.; McEachern, A.; Arghandeh, R. Micro-synchrophasors for distribution systems. In Proceedings of the 2014 IEEE PES Innovative Smart Grid Technologies Conference (ISGT), Washington, DC, USA, 19–22 April 2013. [Google Scholar]
- Wang, B.; Sun, H.; Zhang, D. Review on data sharing and synchronized phasor measurement technique with application in distribution systems. Proc. CSEE 2015, 35, 1–7. [Google Scholar]
- Liu, Y. A US-wide power systems frequency monitoring network. In Proceedings of the 2006 IEEE PES Power Systems Conference and Exposition, Atlanta, GA, USA, 29–30 October 2006; pp. 159–166. [Google Scholar]
- Lin, Z.; Liu, Y.; Jia, Y.; Zhang, Y.; Xia, T.; Liu, Y.; Wen, F. Dynamic performance test of single–phase phasor measurement units. In Proceedings of the 2011 IEEE Power and Energy Society General Meeting, Detroit, MI, USA, 24–29 July 2011; pp. 1–7. [Google Scholar]
- Aminifar, F.; Fotuhi-Firuzabad, M.; Safdarian, A.; Davoudi, A.; Shahidehpour, M. Synchrophasor measurement technology in power systems: Panorama and state-of-the-art. IEEE Access. 2014, 2, 1607–1628. [Google Scholar] [CrossRef]
- Nguyen, C.T.; Srinivasan, K. A new technique for rapid tracking of frequency deviations based on level crossings. IEEE Trans. Power Appar. Syst. 1984, PAS-103, 2230–2236. [Google Scholar] [CrossRef]
- Kim, S.; McNames, J. Tracking tremor frequency in spike trains using the extended Kalman smoother. IEEE Trans. Biomed. Eng. 2006, 53, 1569–1577. [Google Scholar] [PubMed]
- Wu, Z.; Zhao, Q.; Chen, H.; Han, X.; Guo, H. A Kalman-filter based phasor measurement algorithm under low sampling frequency. Power Syst. Prot. Control 2014, 42, 94–99. [Google Scholar]
- Serna, J.A. Reducing the error in phasor estimates from phasorlets in fault voltage and current signals. IEEE Trans. Instrum. Meas. 2007, 56, 856–866. [Google Scholar] [CrossRef]
- Zhang, S.; He, Z.; He, W. A recursive wavelet-based algorithm for phasor measurement. Power Syst. Technol. 2011, 35, 194–200. [Google Scholar]
- Zhang, X.; Xu, Y.; Liu, H.; Tang, F.; Zhao, Y. Research of a new algorithm to improve dynamic performance for phasor measurement unit and test verification. Power Syst. Prot. Control 2015, 43, 48–54. [Google Scholar]
- Shen, J.; Zhou, B.; Wang, Y.; Zhang, D.; Hou, M.; Zhang, M.; Tan, Y.; Xiang, R. Methods for improvement of dynamic performance of PMU. Power Syst. Technol. 2015, 43, 89–94. [Google Scholar]
- IEEE Standard Association. IEEE Standard for Synchro Phasors for Power Systems; IEEE Standard Association: Piscataway, NJ, USA, 2011. [Google Scholar]
- Zhang, D.; Liu, H.; Bi, T.; Hu, Y.; Zhang, X. Comparison of the PMU static and dynamic standards and evaluation methods between Chinese standards and IEEE. Power Syst. Prot. Control 2013, 41, 140–145. [Google Scholar]
- National Power System Management and Its Information Exchange Standardization Technical Committee. Code for Detection of Synchronous Phasor Measurement Devices for Power Systems; China Standard Press: Beijing, China, 2012.


© 2018 by the authors. This article is an open access article distributed under the terms and conditions of the Creative Commons Attribution license (http://creativecommons.org/licenses/by/4.0/).