Article

Comparison and Optimization of Methane Hydrate Production Process Using Different Methods in a Single Vertical Well

1
State Key Laboratory of Coal Mine Disaster Dynamics and Control, Chongqing University, Chongqing 400044, China
2
College of Resources and Environmental Science, Chongqing University, Chongqing 400044, China
*
Author to whom correspondence should be addressed.
Energies 2019, 12(1), 124; https://doi.org/10.3390/en12010124
Submission received: 17 November 2018 / Revised: 25 December 2018 / Accepted: 26 December 2018 / Published: 30 December 2018

Abstract

:
Natural gas hydrate (NGH) is a potential type of clean and efficient energy that is widely distributed in the ocean and permafrost, and most of the present researches are mainly focused on finding out efficient exploitation methods. Taking the effects of natural gas productivity and extraction time into account, one of the exploitation methods that are most commonly investigated is depressurization combined with thermal stimulation. However, few studies considered the effect of different mining methods on NGH production in vertical wells, especially aiming at the in-situ electric heating without mass injection and the comparison of production efficiency in different modes. Considering the current research status, four exploitation methods which are pure depressurization (PD), pure heating (PH), simultaneous depressurization combined with electric heating (SDH) and huff and puff (H&P) were carried out in this paper to study the influences of different production methods on NGH exploitation in a vertical well. Some parameters such as gas production (VP), water production (CP) and the energy efficiency (η) were investigated to evaluate the production performance of these methods. The results suggest that the temperature in the reactor is affected by the exploitation methods as well as the water production during exploitation. For PD, although it has no extra energy consumption, the longest production period is seen in it due to the insufficient pressure driving force. On the contrary, the NGH cannot be completely exploited only triggered by heating driving force with PH method. So there is a limited decomposition effect with it. Taking the gas production time, the VP, and the NGH dissociation rate into account, the production effects of SDH are more beneficial than other methods as the dual decomposition driving force was adopted in it. Furthermore, a reasonable heating power can result in a better production performance. On the other hand, promoted by pressure difference and discontinuous heating, H&P shows its obvious advantage in shortening production duration and improving energy efficiency, which is therefore believed to have the best commercial exploitation value among the four methods.

1. Introduction

Natural gas hydrate (NGH) is a kind of crystal compound that is mainly formed by water molecules binding methane molecules under the condition of low temperature and high pressure [1]. The hydrate-forming gas molecules (e.g., CH4, C2H6 and CO2) are usually small and light, and the hydrate is found to have three types of structures in nature (i.e., Type I, II and H) [2,3]. Formation and dissociation processes of NGH can be simply expressed by the reversible reaction equation below [4,5,6]:
CH 4 + n H H 2 O CH 4 · n H H 2 O + Δ H e n
In Equation (1), nH is the hydration number, and ΔHen is the enthalpy of hydrate formation or dissociation. NGH is a high-density energy source. Under standard condition, one unit volume of gas hydrate can be decomposed to produce 160 to 180 volumes of methane gas [4,7].
The occurrence of gas hydrate is strongly dependent on the factors including temperature, pressure and constituent components, which result in the formation of NGH in polar and oceanic regions [7,8,9]. In polar regions, NGH exists in the permafrost at both onshore and offshore of the continental shelves. While in oceanic regions, it is deposited in the natural slope under cold water along the bottom of the continental margin. Thus, NGH has been found to be contained in about 95% of the Atlantic regions, 85% of the Pacific districts and 96% of the Indian Ocean areas [10].
It is inevitable to study NGH exploitation as NGH is a kind of high-reserved energy resource, which can help to cope with the growing global energy demand [8,11,12]. Therefore, it will become the research focus all over countries to ensure the efficiency and safety of NGH exploitation, and then the commercial exploitation will be realized in the near future [4,7,9,13].
In recent years, NGH production study has progressed significantly. For instance, Japan has successfully conducted NGH exploitation test in 2012 for the first time [14,15]. China has actively carried out the field-scale production test of NGH in the Shenhu area, in the South China Sea. The NGH has been successfully exploited for 60 days by depressurization, and the total volume of the produced methane gas has accumulated up to 300,000 m3. On the other hand, many other countries (i.e., United States, Germany, Korea, India, etc.) are all running projects for drilling natural gas hydrates from sea floors [16,17,18], so many theoretical studies on methane hydrate production also have been published in the last few years [19,20,21,22,23,24]. So far, people have proposed a variety of hydrate exploitation methods, which are generally divided into the following categories: (1) Depressurization [25,26,27,28,29,30,31,32]. The reservoir pressure is dropped below the hydrate equilibrium pressure and NGH dissociation is driven by pressure difference and the heat transferred from the surroundings; (2) Thermal stimulation [33,34,35,36]. By this method the temperature of the reservoir rises higher than the hydrate equilibrium temperature by adding extra heat; (3) Thermodynamic inhibitor injection [37]. The thermodynamic chemicals are injected to destroy current hydrate equilibrium conditions; (4) Displacement method [38,39,40]. Other gases, such as carbon dioxide and nitrogen, displace methane gas in the hydrate lattices in this way. However, by now, the most acceptable methods should be depressurization and thermal stimulation, which can be used alone or in combination (Combination method) [32,41,42,43].
Depressurization is believed to be the most energy-efficient way of NGH exploitation since no extra heat injection is needed during production [23,27]. (Many related studies thus have been carried out on this method. NGH decomposition experiment was conducted by Lee et al. [44] to study the dissociation characteristics in depressurization. Through the analysis of flow properties of the produced gas and exploitation efficiency, they believed that the blockage caused by the hydrate regeneration could be avoided by decreasing the pressure difference to maintain stable thermal conductivity. After conducting experiments in a cubic hydrate simulator (5.8 L) and a newly developed pilot-scale hydrate simulator (PHS) (117.8 L), firstly, Li et al. [6,27,45] defined the change processes of gas production and temperature with depressurization into three periods and five stages, respectively. They found the decrease of the exploitation pressure resulted in the rise of the gas production rate and the water production. Afterwards, combined with numerical simulations, it indicated that a larger pressure difference led to the faster gas and water production, and the mass and heat transfer processes were the major determinant of hydrate exploitation by depressurization. In addition, after conducting the experiments with the exploitation pressure of 2.2, 2.6 and 3.0 MPa, Zhao et al. [26] thought that after the free gas production, NGH decomposition firstly relied on the sensible heat of the sediment, and then the heat transfer from surrounding environment further promoted this. Therefore, the insufficient heat for NGH decomposition was the main reason for ice formation in the porous media. Based on the results of Zhao et al., Li et al. [46] simulated NGH dissociation around the freezing point by depressurization, and they confirmed the existence of the ‘‘freezing stage’’ (i.e., the coexistence of gas, water, ice, and NGH). Besides, around this point, the latent heat released by the formed ice contributed to the hydrate decomposition despite the block effect on fluids.
Yet, considering the exploitation effects such as gas production rate and exploitation time, depressurization combined with thermal stimulation is believed to be another most potential exploitation method. Some research has also been done in thermal stimulation to make a comparison of the production effects with the former. Tang et al. [47] set up six experimental runs for NGH exploitation by thermal injection with hot water of different temperatures or injection rates; And the results showed that the lower temperature and injection rate of water and the higher hydrate saturation resulted in the higher energy ratio. By combination method with wellbore heating, Falser et al. [48] studied the impact of in-situ heating on gas production. The result also suggested that under the same extraction pressure, the extra heat could greatly raise the gas production. Using the PHS with horizontal wells, Li et al. [49] investigated NGH decomposition by the steam assisted gravity drainage (SAGD) method. With different steam injection rates, they found that the increase of it led to a higher gas production rate, but the opposite trend was seen for the Energy Efficiency Ratio (EER) and the gas-to-water ratio. Furthermore, the assessment and comparison of gas production between SAGD and anti-gravity drainage (SAAD) method were firstly applied by Li et al. [50]. Then the analysis of the hydrate dissociation rate, the gas production rate and EER proved the suitability of the two methods for NGH exploitation in hydrate sediments with high permeability, although SAAD might be more suitable for gas production than SAGD. Yang et al. [51] employed a middle-size 3D reactor for the study of gas production by hot-water cyclic injection. They found that the rise of hydrate saturation and temperature resulted in the increase of the energy efficiency ratio. However, the efficiency was reduced with the increases of liquid injection temperature and production pressure. Similarly, Li et al. [52] carried out hydrate dissociation experiments in a three dimensional cubic hydrate simulator (CHS) using huff and puff method, and the experimental results showed that the heat from the well had limited effect on hydrate dissociation and it cannot transfer evenly in all directions. Apart from these, Song et al. [41,53] adopted depressurization, warm-water injection and combination method to study the gas production behaviors of NGH. The combination method was found to be the most advantageous exploitation method compared with others in gas production and energy efficiency. After this, by adding the analysis results of magnetic resonance imaging (MRI), they further proved the advantages of this method especially in dealing with difficulties in low gas production and energy efficiency. Found from above studies, previous studies have focused on combination method with hot water injection, while there is less research on heating and heating combined depressurization without external mass injection.
In addition to exploitation methods, we need to consider the type of the production well as it will also influence the gas production in hydrate sediments [5,54,55,56,57,58,59]. In this paper, the NGH exploitation by a single vertical well is mainly studied. And due to the simplest well arrangement as well as relatively short well length, many experts have made some achievements in this aspect. Loh et al. [54] investigated the hydrate dissociation behaviors by depressurization combined with wellbore heating in two wells for gas production and heating respectively. Based on the previous study, they suggested that in a single vertical well by depressurization combined with wellbore heating, the flow direction of the produced liquid and gas was opposite to that of the heat transfer from the heating well, which caused forced convection, weakening the driving force of NGH decomposition. The results also indicated that the effect of depressurization could be improved by thermal injection. In addition, by reducing the exploitation pressure at the same heating power, higher energy efficiency could be obtained. However, this could not be achieved by increasing the heating power, even though a higher heating power could lead to a higher gas production rate. In addition, according to the data obtained from the drilling site of GMGS2-08, Wang et al. [60] stimulated NGH exploitation in a single vertical well by depressurization, and they found the decrease of pressure led to the rise of gas production. Li et al. [6] drew the same conclusion according to the results of experiment and numerical simulation. Furthermore, they also thought the mass and heat transfer mainly dominated the hydrate decomposition by depressurization in the pilot-scale simulator. Besides, after the comparison of NGH exploitation in a vertical well with that in a horizontal well, Qorbani et al. [9] suggested a slightly higher hydrate decomposition rate with the former well pattern than the later.
From these studies, it is easy to recognize that there are few studies focusing on the effects of the application of different exploitation methods on NGH production in a vertical well, especially aiming at the in-situ electric heating without mass injection and the comparison of production effects in different depressurization and heating modes. Considering the present research status, we have developed an experimental instrument that is equipped with a resistance heating system in the center of the reactor. It can simulate the exploitation of NGH in porous media. In this apparatus, four exploitation methods: pure depressurization (PD), pure electric heating (PH), simultaneous depressurization combined with electric heating (SDH), and huff and puff method (H&P) are employed to simulate the decomposition of NGH and to optimize the production process. By analyzing the changes of various parameters (i.e., temperature, gas production and energy efficiency) in the process of decomposition, it is aimed to find out the most efficient exploitation way. The applicability of commercial exploitation by these methods is compared by taking into consideration the factor of energy quality, which has never been considered for the evaluation of energy efficiency in previous studies.

2. Experiments

2.1. Apparatus

Figure 1 shows the schematic of the experimental system for the methane hydrate formation and dissociation, which are carried out in a stainless steel pressure reactor. The effective volume of the reactor is 1.5 L (length × width × height: 100 × 100 × 150 mm). And the container can withstand a maximum pressure of 30 MPa. Two pressure sensors are connected to the pipe at the top and bottom of the container for the measurement of the system pressure.
The methane gas needed for hydrate formation is supplied by a gas tank with the volume of 2.0 L and the bearable pressure range of 0–25 MPa. And through a PID controller (0–6000 psi, ±0.1%, Tescom) located at the inlet of the reactor, the methane gas can be pumped into the reactor to a specific pressure. The production pressure is controlled by a back pressure regulator installed at the outlet of the container, the bearable pressure of which is 0–30 MPa with the accuracy of ±0.05 MPa. After being dried, the instantaneous gas production rate and the volume of the accumulative gas are measured by the gas flow meter with the measuring range of 0–5 L/min and the accuracy of ±1%. The produced gas and water are separated with the use of the gas/water separator. The water is weighed by an electronic balance, of which the measuring range is 0–2200 g with the accuracy of ±0.01 g. All the experimental data obtained from these sensors and equipment are sent to the data acquisition system.

2.2. Well Configuration

Figure 2 shows the schematic of the well design and the distribution of thermometers in the container. The vertical well is located in the center of the reactor with the effective length of 120 mm and the radius (rw) of 3 mm. In the axis direction of the well, there is a resistance-heating rod (73.5 Ω) with almost the same length as the well. The heating rod is powered by a DC power to heat the wellbore evenly. The electric insulating material film is used to seal the resistance-heating rod to ensure the safety of the electric heating process. On the surface of the vertical wellbore, eight rows of small holes are set up to release the gas and water, and these holes are small enough to make sure that no solid particles can enter the pipelines and result in flow problem.
The whole reactor is immersed in the water bath. Nine temperature sensors are set up in a square area with the size of 80 × 80 mm in the middle of the reactor, and they are used to monitor the temperature changes in this container. The central thermometer is T5, and the thermometers in the four corners are T1, T3, T7 and T9, respectively. The distance of T5 to its adjacent thermometer is 40 mm.

2.3. Hydrate Formation Procedure

Before the formation of hydrates, the quartz sand with a diameter of 270–380 μm was cleaned in advance with deionized water, and then it was dried and packed tightly in the closed reactor. The porosity of it was measured to be 44.2% by the drainage method and a vacuum pump was used to remove the air remaining in the sand void. At last, a certain amount of methane gas and deionized water were injected into the reactor to form NGH at constant temperature. In the hydrate formation process, the gas saturation (SG), the water saturation (SA) and the hydrate saturation (SH) can be calculated as follows [6,61,62]:
S G + S A + S H = 1
S G = v m n m , G V p o r e
S A = m W 0 n H ( n m 0 n m , G n m , W ) M W ρ W V p o r e
S H = ( n m 0 n m , G n m , W ) M H ρ H V p o r e
where vm represents the molar volume of methane gas (mL/mol), which is calculated using the Peng-Robinson EOS; nm0 stands for the total amount of the injected methane gas, and nm,G and nm,W are the amount of methane remaining in the gas phase and dissolved in the liquid phase, respectively (mol). The total pore volume of quartz sand (Vpore) remains constant during the experiment (mL), as the sand is considered incompressible under high pressure; mW0 is the total mass of the injected water (g); nH is hydration number; MW and MH are the molar mass of water and NGH, respectively (g/mol); ρW and ρH are the density of water and NGH, respectively (g/mL). Among them, the gas solubility is calculated using Henry’s law based on the experimental pressure and temperature data. The total amount of gas and water injected in each experiment group were 3.30 mol and 370.23 mL, respectively. And the temperature of water bath was controlled at 7.8 °C. The formation of hydrates was terminated at pressure P = 8.0 MPa. At this time the three phase saturations (i.e., hydrate, water and gas) were SH = 0.440, SA = 0.200, and SG = 0.360, respectively. However, especially in PH, since the production pressure was above the equilibrium pressure, the target saturation of hydrate formation (SH) was about 0.300 in this experimental group.

2.4. Decomposition Procedure

We conducted five groups of experiments with different exploitation methods in this study, which were named as Run 1–5. Run 1 adopted pure depressurization (PD). Depressurization combined with electric heating method (SDH) was employed in Run 2 and 3. Run 4 and 5 used pure electric heating (PH) and huff and puff method (H&P), respectively. The NGH exploitation was characterized by two stages: 1. The depressurizing stage (stage I), during which the pressure in the reactor was decreased from the initial pressure (about 8.0 MPa) to the final production pressure (i.e., 5.0 and 5.9 MPa).
In this stage, the pressure was set to the production pressure by the back pressure regulator. The opening of the outlet valve caused the gas and water to be continuously produced; 2. The constant pressure production stage, namely, the production stage (stage II). Due to pressure changes and free gas production in the depressurizing stage, this paper mainly studied the exploitation behaviors of NGH during the production stage. And the parameters of each run were shown in Table 1. And the detailed calculation process can be found in the published papers [63,64]. The detailed experimental processes of each method in the production stage are as follows:
(1)
PD. After the depressurizing stage, the pressure was decreased to 5.0 MPa. During the production stage, the production pressure was fixed at approximately 5.0 MPa with the accuracy of ±0.05 MPa by adjusting the back pressure regulator. There was no electric heat supplied during the whole experiment.
(2)
PH. The resistance rod began to work at a constant electric heating power when the production pressure was adjusted at approximately 5.9 MPa, which indicated the start of the production stage. Since this pressure is a little higher than the equilibrium pressure of 5.7 MPa, there was no depressurizing driving force for hydrate dissociation in this case.
(3)
SDH. The experimental process of SDH was basically the same as that of PH. And the only difference was the production pressure of SDH (5.0 MPa), which was lower than the phase equilibrium pressure.
(4)
H&P. The production stage was composed of several cycles and there were three steps in each cycle, which were the heat injection, the soaking and the production step. The first step of this stage was the heat injection, in which the heating was lasted at a constant electric heating power for 5 min with the reactor closed. The soaking was the second step, in which the electric heating was stopped, and the reactor was closed for 3 min for heat diffusion. During this step, the pressure in the reactor increased gradually. And in the final step (the production step), the back pressure regulator was opened and the gas and water began to produce. Once the pressure in the reactor decreased to 5.0 MPa again, the reactor was closed and the electric heating started again, indicating the beginning of the next production cycle. Each cycle of the above three steps was called a H&P cycle. This was thus a kind of combination method of depressurization and thermal stimulation operated in a single vertical well.
For the above four exploitation methods, when there was no gas released from the reactor and the temperature of each thermometer increased above the phase equilibrium temperature in each situation, the experiments were accomplished.

3. Results and Discussion

3.1. Temperature Profiles

As shown in Table 1, Run 3 adopted SDH with the heating power and production pressure of 25 W and 4.5 MPa respectively. According to the experimental conditions of the five Runs, Run 3 was set to be the reference group. Figure 3 shows the temperature changes of T1, T2, T8 and T9 under the combined action of the depressurization and electric heating in this Run. It could be seen that the temperatures at different locations of the reactor increased gradually, meaning that the heat originated from electric heating could be efficiently transferred from the heating well to the hydrate sediment. At the beginning, the temperatures of T1 and T2, T8 and T9 could be kept constant for some time because the injected heat had not affected these locations, followed by the rise of T1 and T9 at point A, T2 and T8 increased at point B. This was because T1 and T9 were located in the corners of the reactor, the hydrate around which could absorb heat from two adjacent boundaries of the reactor. However, the temperatures of T2 and T8 accelerated to rise at point C, which was earlier than that of T1 and T9 at point D, and the final temperatures of the former were higher than that of T1 and T9. The reason of this was that the heat transfer distance from the center well to T2 was closer than that to T1. Moreover, the heat transferred to water bath from only one boundary, resulting in a smaller amount of heat loss. At the same time, we could see that each temperature curve tends to be stabilized at a temperature higher than the water bath during the later stage of Run 3, indicating that the heat transfer between the inside and the outside of the reactor gradually reached an equilibrium state and the hydrate was completely decomposed. In addition, in the process of the experiment, the temperature profiles of T1 and T9, and T2 and T8 were basically the same respectively, which also confirmed the roughly even distribution of the hydrate inside the reactor [64].
Figure 4a,b show the temperature changes of T5 and water production respectively in the five runs, and the experimental parameters are listed in Table 1. As the water production in the stage I influenced the water distribution and then the water production in the stage II, the start point of Figure 4b chose the water production at the end of the stage I. Since the hydrate absorbed heat to decompose during the depressurizing stage, the initial points of the curves in all runs were below 7.8 °C (Run 1, 2, 3 and 5: 6.84, 6.93, 6.96 and 7.56 °C respectively) except Run 4 with PH (7.8 °C). This was because the production pressure of Run 4 did not drop below the equilibrium point, and the hydrate in the reactor was still in a phase equilibrium state without decomposition, making the initial temperature of the curve the same as that of the water bath.
With the use of PD in Run 1, the hydrate decomposition was only promoted by depressurizing driving force during the production stage, and the pressure fluctuation range was within ±0.05 MPa. Meanwhile, the temperature of T5 remained stable at around 6.84 °C during a long period before a gradual increase to 7.01 °C. This was due to that the heat was transferred slowly from the water bath with a higher temperature to the reactor center in a lower temperature, and the rate of hydrate decomposition was controlled within a certain range. Thus, the temperature of T5 remained unchanged until the heat was transferred to the central areas. Moreover, the temperature in the reactor tended to approach the temperature of the water bath if the duration was long enough to reach the heat transfer balance between the hydrate sediment and the water bath.
Run 2 and 3 adopted SDH for hydrate exploitation. The temperatures of T5 in these two runs showed rapid increases, and then slightly decreased and fluctuated between 40 and 55 min, and between 25 and 45 min respectively. Afterwards, the curves of the two runs continued to increase and quickly reached their maximum values and stabilized. The first increases of T5 in two runs were due to the continuous heat injection. And the reason for the slight decrease and fluctuation of T5 was that the cumulative water production increased during this period, and the flow of gas and water took a lot of heat out of the reactor. Meanwhile, the hydrate sediment around the vertical well, the hydrate decomposition and the liquid in the reactor absorbed a large amount of heat. On the other hand, it was also possible that the hydrate near the boundary partially decomposed and became small particles, which quickly flowed to the vicinity of the production well with the gas and liquid, and then the violent decomposition of these small particles led to this change in temperature. However, due to the difference in electric heating power, the severity of hydrate decomposition was different, as well as the degree of temperature drop.
In Figure 4a, the temperature curve of Run 4 with PH rose firstly with a rapid rate before a slight decrease at the inflection point. Afterwards, it slowly rose again until reaching a stable level. We could see from Figure 4b that about 18 g water was produced in Run 4 at the beginning of the production stage, at which some methane gas filled the sediment pores around the central well due to the release of the water. When the production started, this part of gas in the pores absorbed less heat than the hydrate for decomposition, thus the temperature of T5 arranged next to the vertical well rose sharply. As the hydrate around the vertical well was further decomposed, the water produced by hydrate decomposition in the reactor was brought to the vicinity of the central well under the influence of pressure difference and gas flow, and the cold water began to absorb heat, causing the temperature around the well to decrease. Then an inflection point appeared in the temperature curve of T5 in Run 4 after 10 min. When this water was heated, the temperature of T5 continued to rise slowly after 20 min. It could be seen from Figure 4a that under the same heating power, the temperature and the increasing rate of it in Run 4 with PH were consistently higher than that in Run 3 with SDH during the first 10 min. However, the temperature of Run 3 exceeded that of Run 4 after 50 min. Comparing the cumulative water production of Run 3 (SDH) with that of Run 4 (PH), Run 3 brought out a large amount of water, while there was little water produced outside the reactor in Run 4 within the first 10 min. Besides, the decomposition rate of hydrate under double driving force of depressurizing and heating was faster than that driven by heating alone. Under the same heating power, the hydrate decomposition with SDH was thus faster than that with PH. Therefore, the temperature rising rate of SDH was lower than that of PH in the early stage. The entire exploitation duration of the Run 3 and Run 4 was 94 min and 326 min, respectively. And when the experiment was carried out to 50 min, the production of Run 4 was just begun, while that of Run 3 was already half-expired. It indicated that the mass of the undecomposed hydrate of Run 4 remained in reactor was more than that of Run 3 at 50 min. Affected by the endothermic decomposition of undecomposed hydrates in the reactor, the temperature rising rate of Run 4 became lower than that of Run 3. Hence, the temperature rising rate and the temperature of Run 3 with SDH were higher than that of Run 4 with PH in the later period.
Since the heating of H&P in Run 5 was not continuous but cyclic with a fixed heating time, the temperature curve during the production stage was consisted with multiple cyclic groups. The temperature peak value of cyclic group with H&P was increasingly higher as the experiment proceeded, showing an upward trend. This was because the heat provided by the electric heating in each cycle was greater than the heat required for hydrate decomposition, and there was residual heat provided by the electric heating in the reactor after the end of each cycle, resulting in a higher initial temperature in the next cycle than the previous one. Therefore, the temperature of T5 tended to increase with the same amount of heat provided by the electric heating in each cycle.

3.2. Gas Production

Figure 5 shows the change of the cumulative gas production (VP) and the hydrate undecomposed mass (mH) with four exploitation methods, in which the heavy line indicated VP, and the thin line represented mH. And the heating power of the three Runs requiring electric heating was 25 W. From the comparison of VP with mH, it was found that the VP and mH curves of the same Run intersected at one point, where the total amount of undecomposed hydrate was just equal to that of decomposed hydrate in the reactor. Besides, the cease of the increase in the VP curve corresponded exactly to the stop of hydrate decomposition. This showed that the free gas in the reactor made no contribution to the gas production in the experiment in stage II, and the hydrate decomposition was the only source of gas production.
The VP curve gradually increased but the mH curve gradually decreased by PD, in which the production duration was the longest due to the slow heat absorption rate from the water bath for decomposition; Furthermore, the rates of gas production and hydrate decomposition continued declining over time. This was because the hydrate decomposition front moved from the surrounding boundary to the central well, and the heat transfer distance became longer, which increased the heat transfer resistance. Thus, the heat transfer rate was increasingly slower from the water bath to the central area. The experimental run with SDH showed the shortest period of production, while its VP and mH curves maintained a large slope to increase and decrease respectively at the same coordinate scale as other experimental runs. In contrast with PD method, extra heating driving force was provided in SDH. In addition to the endothermic decomposition of the hydrate promoted by the water bath at the boundary of the reactor, the hydrate surrounding the vertical well was also rapidly decomposed by the heat, which greatly increased the decomposition rate of hydrate and gas production to show a promising exploitation effect. With PH method, the rate of gas production and hydrate decomposition was larger than that with PD during the early production period, while it was slower than that in SDH as the higher initial temperature of the hydrate sediment led to the larger heating transfer resistance. In the later production period, the rates of gas production and hydrate decomposition with PH became increasingly smaller due to the continuously larger heat loss, and even the VP of PH fell below that of PD at 300 min. Only promoted by heating driving force, although the electric heating could provide continuous heat, more and more heat provided by it per unit time was absorbed by the quartz sand and water in the reactor and the external water bath as the interface of hydrate decomposition moved away from the well. Besides, the flow of gas and water would take away some heat out of the reactor. So all of these parts caused a large amount of heat loss. Meanwhile, since the PW of PH was higher than the equilibrium pressure, the hydrate around the reactor boundary was not decomposed by absorbing heat from the water bath. And the residual hydrate in the reactor continuously reduced as well. Thus, heat transfer and the remained hydrate within the heating surface affected the hydrate decomposition, and the continuous decrease of above two factors resulted in the increasingly faster decreases of the gas production and hydrate decomposition rates after 80 min. In addition, the total amount of gas production was the lowest among other runs because of the incomplete hydrate decomposition, and one could see from Figure 5 that the mH curve in PH did not drop to 0. These residual hydrates might be distributed away from the heating well and close to the inner wall of the reactor. When the limited heat transferred to the boundary, it was absorbed by the external water bath with a constantly lower temperature, and the temperature in the region near the reactor wall could not rise above the phase equilibrium temperature corresponding to the production pressure, thus the hydrate around the reactor wall would not dissociate. It could be concluded that the effect of electric heating in PH was limited when exploiting the NGH existed in a large scale or in the situation with an insufficient heating rate. Thus, it might be impossible for the exploitation of the hydrate located far from the heating well.
The VP and mH curves in H&P showed a step-like rise and serrated decrease respectively, and the reasons were as follows:
(1)
During the heat injection and the soaking step, the reactor was closed, and the gas was discharged quickly after the opening of the reactor in the production step. The VP curve of H&P thus increased in a ladder shape. It was observed that the step height of the VP curve with H&P continuously decreased, indicating that the gas production during each cycle gradually dropped with time. This was due to the continuous reduction of the total amount of the hydrate and the increase of the hydrate decomposition regions. The heat transfer rate and the heat utilization efficiency from the vertical well to the hydrate zone were significantly reduced, resulting in a gradual decline in gas production in the later cycles of huff and puff process.
(2)
In each cycle of huff and puff process, during the heat injection and the soaking step, the production well was not open for gas production, and the pressure in the reactor continued rising, leading to the decrease of the pressure driving force. Electric heating at this time mainly provided the driving force for hydrate decomposition. When gas was produced from the vertical well, the pressure rapidly dropped and the pressure driving force increased. Under the dual driving forces, the decomposition rate of hydrate was faster than that before the production step. The mH curve thus continuously reduced in a serrated shape. However, in the later period of the production stage, the serrated shape became less obvious. This was due to the heat loss and hydrate consumption in the reactor, making the difference between the slopes of the mH curve increasingly smaller during the closure of the reactor and the gas generation period.
Although extra energy was not consumed in PD, it took the longest time for gas recovery with a low gas production rate and the low extraction efficiency. The production time of PH was less than that of PD, but when compared with the SDH and H&P method under the same extraction power, the production time of the former was about three times longer than that of the latter two. At the same time, it was found that the effect of the electric heating on gas production was limited with PH and the hydrate around the reactor wall could not be fully exploited. Due to the higher hydrate saturation in Run 5 with H&P, the accumulative gas production of it was slightly larger than that with SDH. However, the H&P method took a little more time for gas production than the SDH method, and the hydrate decomposition rate of the former was lower than the later. As a result, the SDH method was considered relatively superior by comparing with these four methods from the three parameters, which were gas production time, gas production rate and hydrate decomposition rate.
In order to investigate the effect of heating power on hydrate exploitation with SDH method, an additional run with Q = 12.5 W was carried out, and its VP and mH curves were drawn with Run 3 in Figure 6. One could see that the starting points of the two mH curves were very close, which was due to almost the same initial hydrate saturation in two runs with SDH. However, in this method, the decrease of mH curve with 25 W was faster than that with 12.5 W, and the exploitation time of the former was shorter than that of the later. This was because under the same production pressure, the heating power of 25 W could provide larger driving force for hydrate decomposition within the same duration. For the VP curves, they were very close within 10 min. This suggested that when using the SDH method in a single vertical well, although different electric heating power provided different thermal driving force, the pressure driving force dominated the hydrate decomposition in the early production period, making the hydrate decomposition around the boundary through heat absorption from the water bath more obvious. On the other hand, there might be more hydrate around the center well in Run 2, so Run 2 with a lower heat injection rate shared the same decomposition rate with Run 3. The effect of hydrate decomposition was thus the same before the electric heating was able to offer sufficient heat. Afterwards, the VP curve of SDH with 25 W continued increasing at a larger rate, while the growth rate of SDH with 12.5 W began to decrease, and the difference between the two curves gradually increased. The reason for this phenomenon was that with the gradual expansion of the hydrate-decomposed region after 10 min, the heated area increased. At this time, the thermal driving force provided by electric heating with 12.5 W gradually decreased to be failed to meet the rapid decomposition of the hydrate, and the rates of hydrate decomposition and gas production therefore began to gradually decline over time. However, the thermal driving force provided by that with 25 W could temporarily satisfy the rapid decomposition of the hydrate, thus the rates of hydrate decomposition and gas production in this run were not affected, and the VP curve continued rising with nearly the same growth trend until the provided thermal driving force was unable to maintain the rapid hydrate decomposition rate. From the above analysis, we can consider controlling the hydrate decomposition rate and production time by changing the heating power, which provides a mean for commercial exploitation.

3.3. Energy Consumption and Gain

Figure 7 shows the net energy (Enet) and the total energy consumption (EC) obtained from the production stage in the five runs. As the most important assessment criteria, the definitions of Enet and EC are:
E n e t = Δ H E c
E c = Q · Δ t
In (6) and (7), ΔH is the total enthalpy produced by methane combustion (889.6 KJ per mole at 1 atm and 25 degrees Celsius). Δt represents the electric heating time (s), and Q is the heating power (W).
The PD method showed the longest production time, but the Enet curve of it was the highest at the end of the exploitation. And the Ec curve coincided with a line on the x-axis. It was because no extra heating was supplied in this method, and the energy consumption was 0. The slope of Enet curve gradually fell due to the decrease of the gas production rate, as discussed in Figure 5.
In Figure 7, with the PH method, a significant bending point was seen in Enet curve as well as the VP curve at 80 min. However, unlike the VP curve, which continued rising slowly and stabilized after 80 min, the Enet curve slowly increased to a maximum value after 80 min and then began to bend down until the end of the experiment. The reason was that the cumulative gas production increased with the decrease of the increasing rate, while the amount of heat consumption increased linearly. At this time, the gaining rate of net energy began to decrease and then it even became negative. Although the production duration of PH was shorter than that of PD, the total net energy gain was much lower. This was due to the less obtained energy caused by the incomplete decomposition of the hydrate and the highest EC for gas production.
Under the dual driving forces of electric heating and depressurization, the amount of the gained Enet in two runs of SDH was a little less than that of PD. The Enet curve was growing at a high rate almost throughout the production stage before the Enet slowly declined when reaching its maximum value. However, its trend was different from that with SDH in Figure 6 where the end of the VP curve tended to be stable. This was because the hydrate was completely decomposed and no gas was produced when approaching the end of production. At this point, electric heating still consumed energy, and the total amount of Enet thus began to slowly decline. From the comparison of the Enet curves in the two runs by SDH, it was found that the case with 25 W showed faster increasing rate than that with 12.5 W, but the total Enet of the former was less than that of the later. This was because the higher electric heating power accelerated the decomposition of the hydrate, and led to the higher gaining rate of net energy. However, the run with lower electric heating power consumed less energy when the accumulated gas production was basically the same, as shown in Figure 6 and Figure 7.
The EC curve of the H&P was in a step-up shape. Moreover, due to the cyclic heating with a fixed power and heating time, the height of each step was the same. On the other hand, the Enet curve in H&P was similar to the step shape, where each step represented a huff and puff cycle. In each step, the Enet curve first gradually fell during the heat injection step within 3 min, and then it remained horizontal in the next 5 min. This was because there was no gas production during the heat injection and soaking step, resulting in no energy gain. However, during the heat injection step, the Enet reduced due to the energy consumption, while for no energy consumption during the soaking step, the Enet was kept constant. The Enet curve rose sharply during the production step. The increase in Enet was directly determined by the amount of gas produced during this step. Since there was no heat provided during the production step, the energy obtained from the produced methane gas was exactly the obtained net energy. As exploitation progressed, the amount of Enet in each cycle became increasingly less. This was also due to the decrease of the total amount of hydrate in the reactor and the backward movement of the hydrate decomposition interface, which reduced the gas production during the gas production step.
Although the electric heating power of the H&P (25 W) was twice as large as that of the SDH (12.5 W), the energy consumption of them was almost the same because the heating in H&P was not continuous. Furthermore, the duration for obtaining the maximum net energy in H&P was shorter than that in SDH as a larger driving force with a higher heating power was provided by the H&P method for hydrate decomposition. One could see that under the same heat injection conditions, different exploitation methods showed different effects on hydrate decomposition and extraction time. On the other hand, under the same consumption of electric heating energy, because of higher initial hydrate saturation of the H&P, the Enet of the H&P with 25 W was larger than that of the SDH with 12.5 W. Then comparing H&P with SDH in 25 W, the energy consumption of SDH was about 1.5 times more than that of H&P. This was because the heat from the heating well could be diffused freely into the interior of the hydrate sediment with H&P due to no fluid flowing to the production well during the heat injection and soaking step. Besides, heat injection was stopped during the production step to prevent the gas-liquid flow from carrying more heat. In addition, in the production step, the hydrate continued dissociating by absorbing the heat from the sediment sand that was heated during the heat injection and soaking step, so the temperature in the reactor rose to increasingly lower level in each cycle. As a result, the energy provided by electric heating was mainly absorbed by the hydrate for decomposition rather than by the sediment sand and water in the reactor, and the heat transferred to the water bath was small enough to cause less energy loss. On the other hand, the heating in SDH was continuous, and in order to maintain a continuous temperature gradient, the electric heating consumed a larger amount of energy. Therefore, the final heat loss was smaller and the Enet was higher with H&P than with SDH.
In accordance with the analysis of the four methods in terms of Enet, EC, production time and the gaining rate of net energy, one could see that no extra energy was consumed in PD, but it showed a low net energy obtaining rate and the longest time for production. For the PH method, it had a long period of production, and the most energy consumption and the lowest net energy gain were seen with it. With the same heating power (25 W), the H&P method consumed less heat compared to that of the SDH method, and the former showed the largest Enet with just a slightly longer production duration. In addition, with the same energy consumption, comparing the SDH of 12.5 W with the H&P of 25 W, the later took less time for exploitation with a higher Enet. From the above analysis, the H&P method was considered to have the most promising exploitation effect.

3.4. Energy Efficiency

In this paper, we define energy efficiency (η) as follows:
η = Δ H E c Δ H
In (8), ΔH and EC are the same as those in (6). Because of different energy qualities of the above two energy sources, they should be transformed into the same energy quality when analyzing the energy efficiency. At present, the electric energy is converted from other forms, such as fire, water, nuclear and wind energy. Since the combustion heat of methane determines the obtained energy, the conversion efficiency of fire energy is chosen as the conversion coefficient. And it is generally between 32% and 34% [65], so this paper takes the middle value of 33%. Subsequently, the modified net energy (MEnet) and energy efficiency are further defined as follows:
M E n e t = Δ H × 33 % E c
η = M E n e t M E n e t + E c
The energy-obtaining period should be considered in NGH exploitation for the promotion of commercial production. In accordance with this, the time factor is introduced when comparing the obtained net energy from each experiment to form a new time-energy indicator: the average net energy acquisition (AEnet). And it can be adopted to measure the commercial applicability of various methods. The definition of AEnet is as follows:
A E n e t = M E n e t t
Figure 8 compares the final MEnet, EC and η among five Runs and shows the average Enet of them. In Figure 8a, since the EC of PD was 0, the MEnet and the energy efficiency (100%) of it were the highest. However, from Figure 8b, the AEnet of the PD was found to be small, below 1 KJ/min, thus the commercial production value of it was low. The value of MEnet with PH became negative, and the EC was the biggest. This indicated that the total energy consumed for exploitation was greater than the energy gained from the combustion of the produced methane. In addition, the heat provided only by electric heating above the equilibrium point was insufficient to provide enough dissociation driving force, and the continuous exploitation required a lot of energy. This suggests that excessive energy was wasted in the later period in the PH run. By this method, the values of energy efficiency and AEnet were both negative and the production effect was not ideal, showing no commercial exploitation value. In the other three runs of the experiment, the MEnet in H&P was slightly higher than that in SDH with 12.5 W, but the energy consumption and energy efficiency of the two were almost the same. However, one could see from Figure 8b that the AEnet in H&P was significantly higher than that in SDH with 12.5 W and it was the highest. Under the same heating power of 25 W, the MEnet, energy efficiency and AEnet of H&P were better than that of SDH, indicating that the use of different exploitation methods posed a significant impact on the effect of hydrate production.
Given the above results, we can consider the different heating way to optimize the exploitation effect. For example, an ideal exploitation effect and better commercial value are shown in the H&P, and actually, it is a kind of depressurization combined with heating method, which changes the heating to be discontinuous. In addition, by comparing the two runs of SDH, one can see that energy efficiency and MEnet can be increased by reducing the electric heating power, although AEnet decreases slightly with a lower heating power. It shows that a better production effect can be achieved by choosing reasonable electric heating power and optimizing the production process. In all, the H&P is concluded to be the most commercially profitable and optimized method through the comparison of MEnet, the energy efficiency and AEnet.

4. Conclusions

After experimentally simulating NGH exploitation by the above four methods, and based on the analysis of experimental data, we can draw the following conclusions:
(1)
The heat from electric heating can be effectively transferred to the hydrate deposit. The hydrate distribution in the reactor is considered to be relatively uniform. The temperatures of PD, SDH and PH method increase at different growth rates until the heat transfer between the internal and the external of the reactor reaches in a balance. However, the temperature-changing trend in the H&P process is a cyclical rise that fluctuates with time. Besides, the temperature change in the reactor is affected not only by the production method but also by the produced water in the production process.
(2)
The VP and mH curves in the same run of the experiment intersected at one point, showing the total amount of undecomposed hydrate was just equal to that of the dissociated in the reactor. Besides, the hydrate decomposition is the only source of gas production.
(3)
In the PD method, the decomposition front moves from the boundary to the central vertical well by absorbing heat from water bath. In contrast to PD, additional heating driving force is provided in the PH, SDH and H&P method, with which the hydrate mainly decomposes from the center well to the boundary of the reactor. In addition, the hydrate cannot be completely exploited by PH, indicating that the heat offered by it shows a limited influence range.
(4)
The VP in the H&P process continues increasing in the step shape, and the quality of the undecomposed hydrate shows a gradual serrated decrease. The qualities of gas production and undecomposed hydrate are gradually changed with time in PD, SDH and H&P. From the aspect of gas production time, gas production rate, and hydrate decomposition rate, the SDH method is considered relatively superior.
(5)
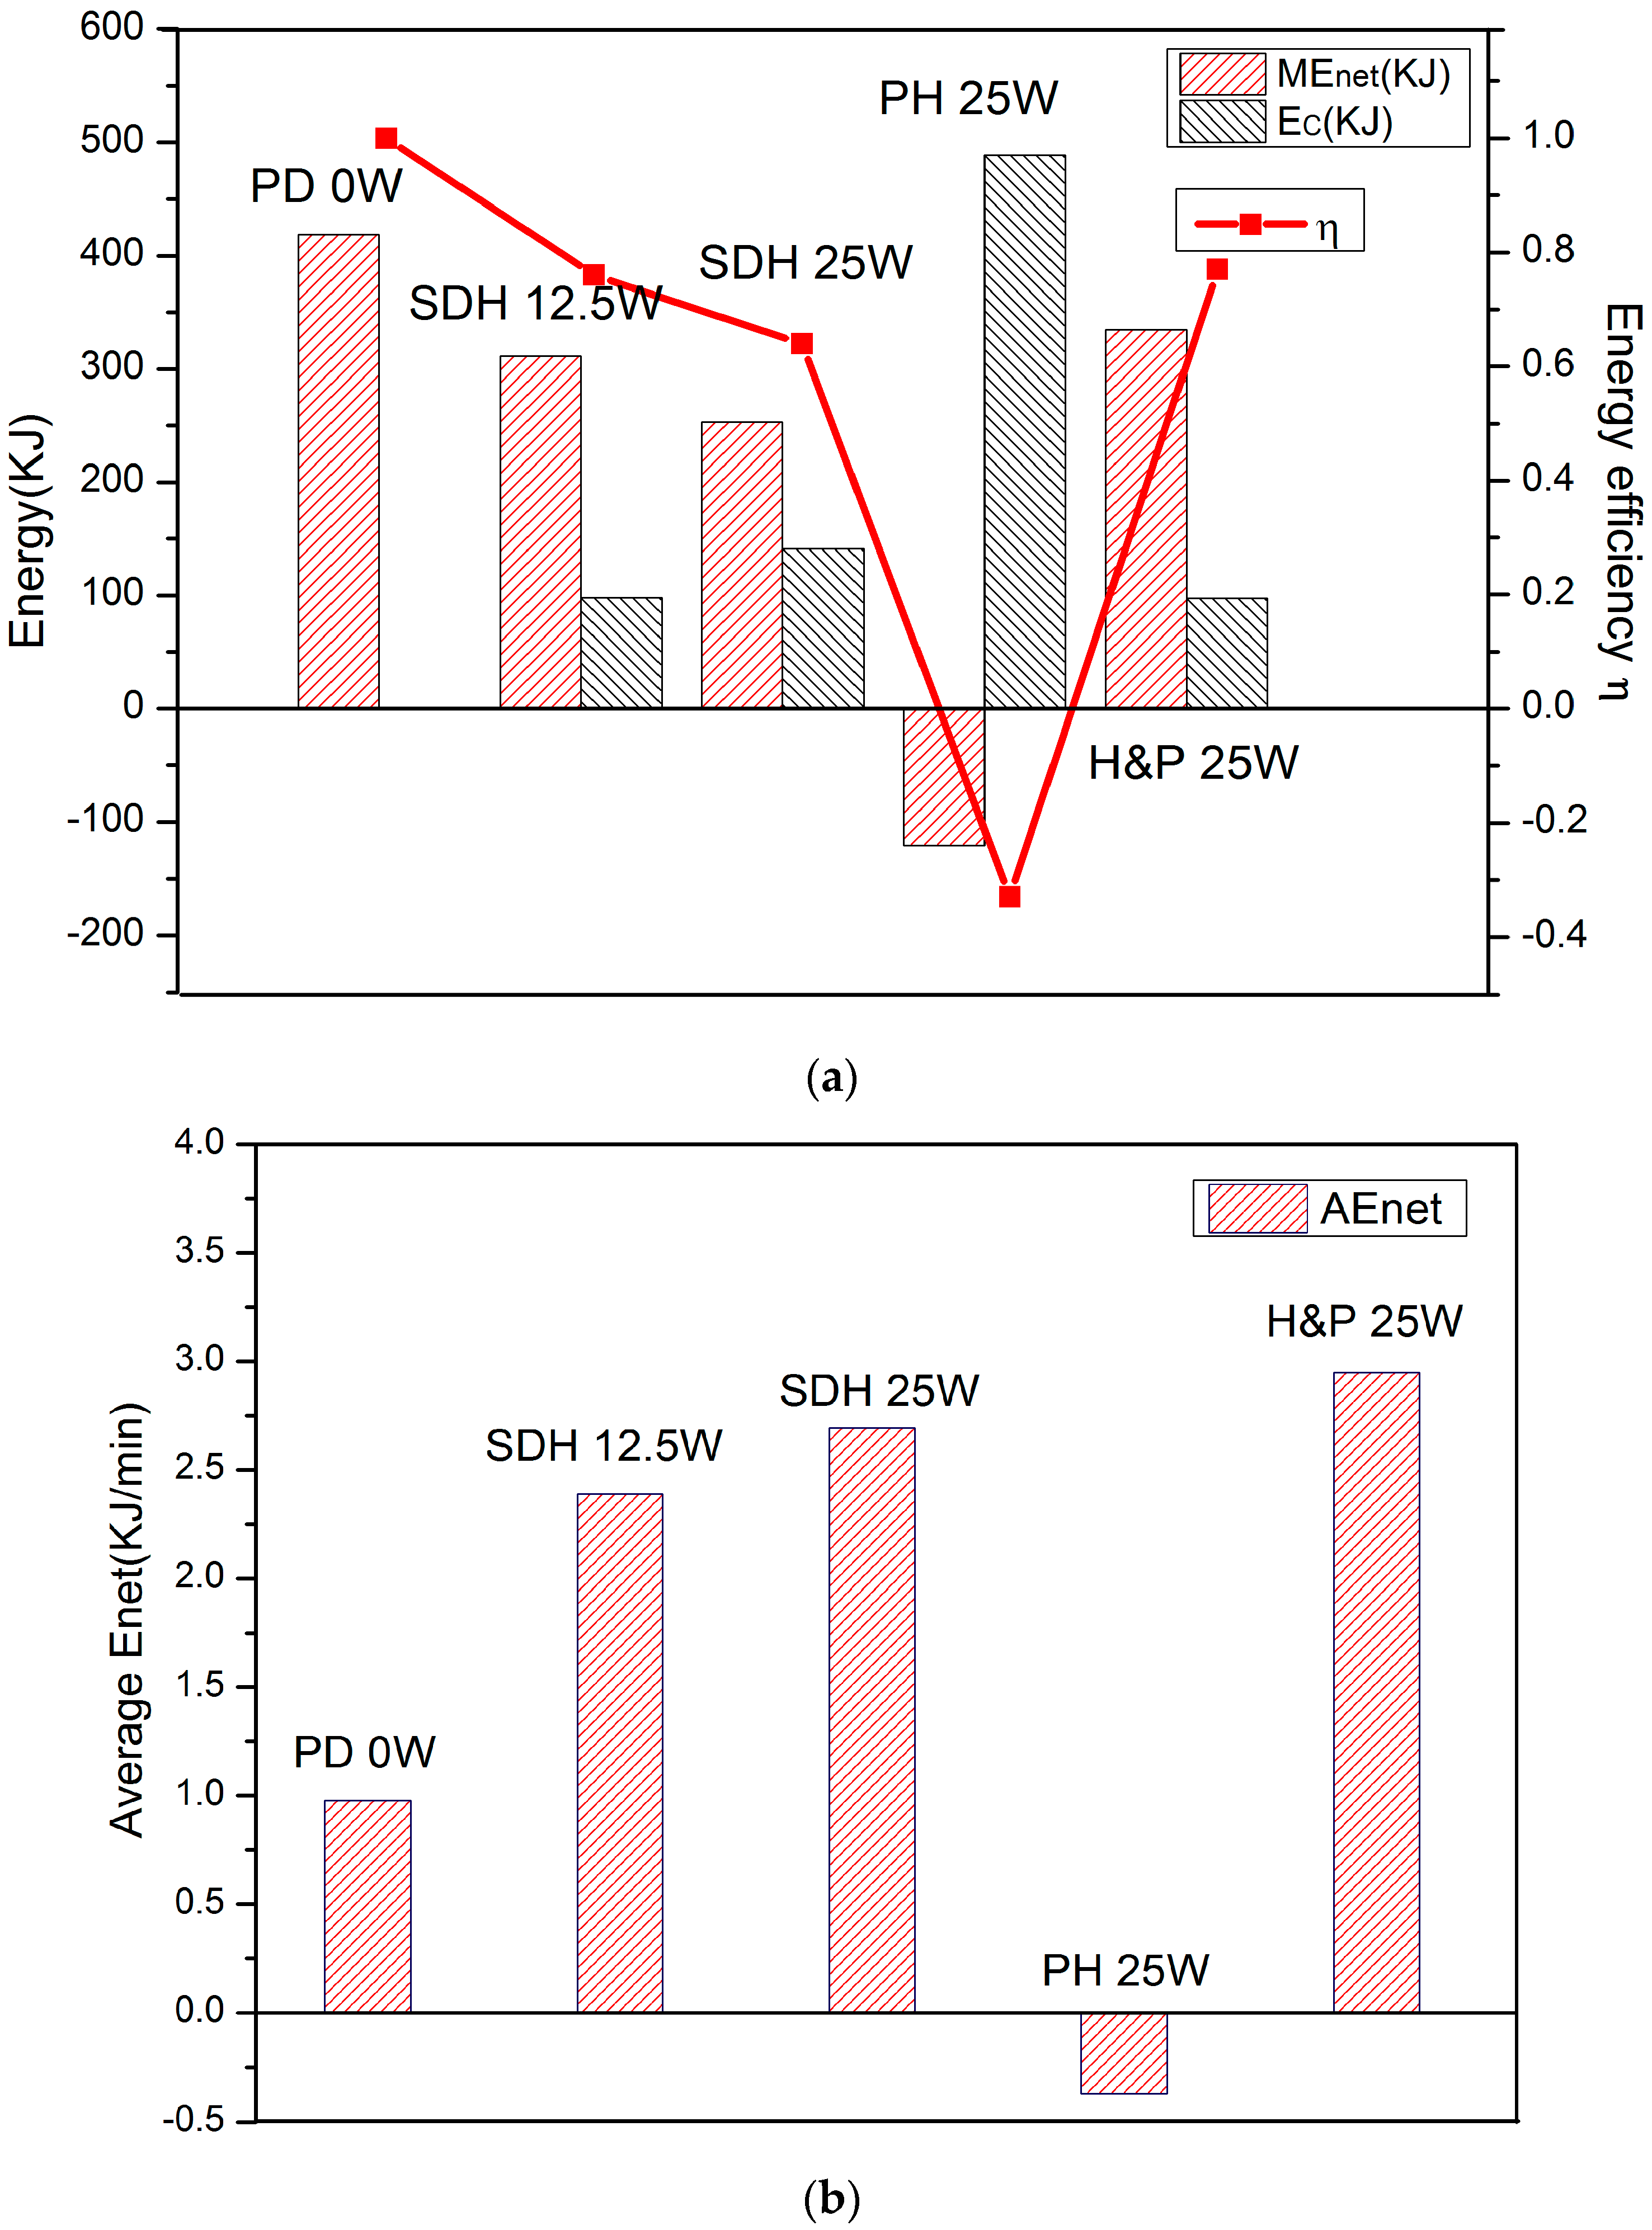
With different electric heating powers in SDH, the production effect is the same before the thermal driving force provided by the lower heating power can meet the rapid decomposition of hydrates. After this duration, the group with higher heating power shows a better decomposition effect. It is a mean for commercial exploitation to change heating power for the control of the decomposition rate and the production time. However, it should be realized that the increase of the electric heating power has limited impact on the net energy gain.
(6)
When consuming the same total energy, H&P with a bigger heating power provides a larger thermal driving force for decomposition than in SDH. In addition, the rise of the pressure in the reactor during the soaking step increases the driving force for decomposition, and the exploitation duration is shorter than that of SDH. On the other hand, at the same power, continuous heating with SDH consumes a large amount of energy to maintain a continuous temperature gradient in the reactor; while, during the production step of H&P, the heating process is stopped, and the hydrate absorbs the heat stored in quartz sand in the heated area and continues decomposing, resulting in less heat loss with H&P. After the analysis of the energy aspect and exploitation duration, the H&P method is believed to show the best exploitation effect among the four methods.
(7)
The use of different exploitation methods will have a significant impact on the hydrate production effect. The AEnet of PD is such small to have less commercial value. Besides, the PH method has no commercial extraction value as the energy efficiency and AEnet are the lowest in four methods, and the exploitation effect is not ideal. However, an ideal exploitation effect is shown in the H&P method, and it has the most commercial exploitation value in the four methods. Moreover, the production effect can be optimized by choosing a reasonable electric heating power.

Author Contributions

Conceptualization, B.L.; Formal analysis, H.L.; Funding acquisition, Y.-P.L.; Project administration, Q.-C.W.; Resources, Y.-P.L. and B.L.; Software, B.L.; Supervision, Y.-P.L. and B.L.; Visualization, Q.-C.W. and X.H.; Writing—original draft, S.L. and H.L.; Writing—review & editing, S.L. and B.L.

Acknowledgments

This work is financially supported by the National Natural Science Foundation of China (51876017, 51674050 and 51506016), the State Key Research Development Program of China (Grant No. 2016YFC0801404), the National Science and Technology Major Project of China (Grant No. 2016ZX05043005), which are gratefully acknowledged.

Conflicts of Interest

The authors claim no conflicts of interest.

References

  1. Sloan, E.D.S., Jr.; Koh, C.A. Clathrate Hydrates of Natural Gases; CRC Press: Boca Raton, FL, USA, 2007. [Google Scholar]
  2. Koh, C.A. Towards a fundamental understanding of natural gas hydrates. Chem. Soc. Rev. 2002, 31, 157–167. [Google Scholar] [CrossRef] [PubMed]
  3. Loveday, J.S.; Nelmes, R.J.; Guthrie, M.; Klug, D.D.; Tse, J.S. New gas hydrate structures. Dokl. Phys. Chem. 2001, 381, 303–305. [Google Scholar] [CrossRef]
  4. Chong, Z.R.; Yang, S.H.B.; Babu, P.; Linga, P.; Li, X.S. Review of natural gas hydrates as an energy resource: Prospects and challenges. Appl. Energy 2016, 162, 1633–1652. [Google Scholar] [CrossRef]
  5. Sun, Z.; Xin, Y.; Sun, Q.; Ma, R.; Zhang, J.; Lv, S.; Cai, M.; Wang, H. Numerical simulation of the depressurization process of a natural gas hydrate reservoir: An attempt at optimization of field operational factors with multiple wells in a real 3D geological model. Energies 2016, 9, 714. [Google Scholar] [CrossRef]
  6. Li, B.; Li, X.S.; Li, G.; Feng, J.C.; Wang, Y. Depressurization induced gas production from hydrate deposits with low gas saturation in a pilot-scale hydrate simulator. Appl. Energy 2014, 129, 274–286. [Google Scholar] [CrossRef]
  7. Schicks, J.M.; Spangenberg, E.; Giese, R.; Luzihelbing, M.; Priegnitz, M.; Beeskowstrauch, B. A Counter-Current Heat-Exchange Reactor for the Thermal Stimulation of Hydrate-Bearing Sediments. Energies 2013, 6, 3002–3016. [Google Scholar] [CrossRef] [Green Version]
  8. Liu, B.; Yuan, Q.; Su, K.H.; Yang, X.; Wu, B.C. Experimental Simulation of the Exploitation of Natural Gas Hydrate. Energies 2012, 5, 466–493. [Google Scholar] [CrossRef] [Green Version]
  9. Qorbani, K.; Kvamme, B.; Kuznetsova, T. Utilizing Non-Equilibrium Thermodynamics and Reactive Transport to Model CH4 Production from the Nankai Trough Gas Hydrate Reservoir. Energies 2017, 10, 1064. [Google Scholar] [CrossRef]
  10. Li, X.-S.; Xu, C.-G.; Zhang, Y.; Ruan, X.-K.; Li, G.; Wang, Y. Investigation into gas production from natural gas hydrate: A review. Appl. Energy 2016, 172, 286–322. [Google Scholar] [CrossRef] [Green Version]
  11. Zhao, J.; Song, Y.; Lim, X.-L.; Lam, W.-H. Opportunities and challenges of gas hydrate policies with consideration of environmental impacts. Renew. Sustain. Energy Rev. 2017, 70, 875–885. [Google Scholar] [CrossRef]
  12. Yin, Z.; Chong, Z.R.; Tan, H.K.; Linga, P. Review of gas hydrate dissociation kinetic models for energy recovery. J. Nat. Gas Sci. Eng. 2016, 35, 1362–1387. [Google Scholar] [CrossRef]
  13. Song, Y.; Yang, L.; Zhao, J.; Liu, W.; Yang, M.; Li, Y.; Liu, Y.; Li, Q. The status of natural gas hydrate research in China: A review. Renew. Sustain. Energy Rev. 2014, 31, 778–791. [Google Scholar] [CrossRef]
  14. Yamamoto, K. Overview and introduction: Pressure core-sampling and analyses in the 2012–2013 MH21 offshore test of gas production from methane hydrates in the eastern Nankai Trough. Mar. Pet. Geol. 2015, 66, 296–309. [Google Scholar] [CrossRef]
  15. Yamamoto, K.; Terao, Y.; Fujii, T.; Ikawa, T.; Seki, M.; Matsuzawa, M.; Kanno, T. Operational overview of the first offshore production test of methane hydrates in the Eastern Nankai Trough. In Proceedings of the Offshore Technology Conference, Houston, TX, USA, 5–8 May 2014. [Google Scholar]
  16. Konno, Y.; Fujii, T.; Sato, A.; Akamine, K.; Naiki, M.; Masuda, Y.; Yamamoto, K.; Nagao, J. Key Findings of the World’s First Offshore Methane Hydrate Production Test off the Coast of Japan: Toward Future Commercial Production. Energy Fuels 2017, 31, 2607–2616. [Google Scholar] [CrossRef]
  17. Yamamoto, K.; Kanno, T.; Wang, X.X.; Tamaki, M.; Fujii, T.; Chee, S.S.; Wang, X.W.; Pimenov, V.; Shako, V. Thermal responses of a gas hydrate-bearing sediment to a depressurization operation. RSC Adv. 2017, 7, 5554–5577. [Google Scholar] [CrossRef] [Green Version]
  18. Lee, M.W.; Collett, T.S. Gas hydrate saturations estimated from fractured reservoir at Site NGHP-01-10, Krishna-Godavari Basin, India. J. Geophys. Res. Solid Earth 2009, 114. [Google Scholar] [CrossRef] [Green Version]
  19. Jang, J.; Santamarina, J.C. Hydrate bearing clayey sediments: Formation and gas production concepts. Mar. Pet. Geol. 2016, 77, 235–246. [Google Scholar] [CrossRef] [Green Version]
  20. Katagiri, J.; Yoneda, J.; Tenma, N. Multiobjective optimization of the particle aspect ratio for gravel pack in a methane-hydrate reservoir using pore scale simulation. J. Nat. Gas Sci. Eng. 2016, 35, 920–927. [Google Scholar] [CrossRef]
  21. Qorbani, K.; Kvamme, B.; Kuznetsova, T. Using a Reactive Transport Simulator to Simulate CH4 Production from Bear Island Basin in the Barents Sea Utilizing the Depressurization Method. Energies 2017, 10, 187. [Google Scholar] [CrossRef]
  22. Ruan, X.; Li, X.S.; Xu, C.G. Numerical Investigation of the Production Behavior of Methane Hydrates under Depressurization Conditions Combined with Well-Wall Heating. Energies 2017, 10, 161. [Google Scholar] [CrossRef]
  23. Li, G.; Moridis, G.J.; Zhang, K.; Li, X.S. Evaluation of Gas Production Potential from Marine Gas Hydrate Deposits in Shenhu Area of South China Sea. Energy Fuels 2010, 24, 6018–6033. [Google Scholar] [CrossRef]
  24. Wang, Y.; Feng, J.C.; Li, X.S.; Zhang, Y.; Li, G. Analytic modeling and large-scale experimental study of mass and heat transfer during hydrate dissociation in sediment with different dissociation methods. Energy 2015, 90, 1931–1948. [Google Scholar] [CrossRef]
  25. Jiang, X.; Li, S.; Zhang, L. Sensitivity analysis of gas production from Class I hydrate reservoir by depressurization. Energy 2012, 39, 281–285. [Google Scholar] [CrossRef]
  26. Zhao, J.; Zhu, Z.; Song, Y.; Liu, W.; Zhang, Y.; Wang, D. Analyzing the process of gas production for natural gas hydrate using depressurization. Appl. Energy 2015, 142, 125–134. [Google Scholar] [CrossRef]
  27. Li, X.-S.; Yang, B.; Zhang, Y.; Li, G.; Duan, L.-P.; Wang, Y.; Chen, Z.-Y.; Huang, N.-S.; Wu, H.-J. Experimental investigation into gas production from methane hydrate in sediment by depressurization in a novel pilot-scale hydrate simulator. Appl. Energy 2012, 93, 722–732. [Google Scholar] [CrossRef]
  28. Wang, Y.; Feng, J.-C.; Li, X.-S.; Zhang, Y.; Li, G. Large scale experimental evaluation to methane hydrate dissociation below quadruple point in sandy sediment. Appl. Energy 2016, 162, 372–381. [Google Scholar] [CrossRef]
  29. Zhang, L.; Zhao, J.; Dong, H.; Zhao, Y.; Liu, Y.; Zhang, Y.; Song, Y. Magnetic resonance imaging for in-situ observation of the effect of depressurizing range and rate on methane hydrate dissociation. Chem. Eng. Sci. 2016, 144, 135–143. [Google Scholar] [CrossRef]
  30. Yang, M.; Fu, Z.; Zhao, Y.; Jiang, L.; Zhao, J.; Song, Y. Effect of depressurization pressure on methane recovery from hydrate–gas–water bearing sediments. Fuel 2016, 166, 419–426. [Google Scholar] [CrossRef]
  31. Gao, Y.; Yang, M.; Zheng, J.N.; Chen, B. Production characteristics of two class water-excess methane hydrate deposits during depressurization. Fuel 2018, 232, 99–107. [Google Scholar] [CrossRef]
  32. Zhan, L.; Wang, Y.; Li, X.S. Experimental study on characteristics of methane hydrate formation and dissociation in porous medium with different particle sizes using depressurization. Fuel 2018, 230, 37–44. [Google Scholar] [CrossRef]
  33. Kawamura, T.; Ohtake, M.; Sakamoto, Y.; Yamamoto, Y.; Haneda, H.; Komai, T.; Higuchi, S. Experimental study on steam injection method using methane hydrate core samples. In Proceedings of the Seventh ISOPE Ocean Mining Symposium, Lisbon, Portugal, 1–6 July 2007. [Google Scholar]
  34. Li, B.; Liang, Y.P.; Li, X.S.; Zhou, L. A pilot-scale study of gas production from hydrate deposits with two-spot horizontal well system. Appl. Energy 2016, 176, 12–21. [Google Scholar] [CrossRef]
  35. Zhao, J.; Wang, J.; Liu, W.; Song, Y. Analysis of heat transfer effects on gas production from methane hydrate by thermal stimulation. Int. J. Heat Mass Transf. 2015, 87, 145–150. [Google Scholar] [CrossRef]
  36. Chong, Z.R.; Pujar, G.A.; Yang, M.; Linga, P. Methane hydrate formation in excess water simulating marine locations and the impact of thermal stimulation on energy recovery. Appl. Energy 2016, 177, 409–421. [Google Scholar] [CrossRef]
  37. Li, G.; Li, X.-S.; Tang, L.-G.; Zhang, Y. Experimental Investigation of Production Behavior of Methane Hydrate under Ethylene Glycol Injection in Unconsolidated Sediment. Energy Fuels 2007, 21, 180–186. [Google Scholar] [CrossRef]
  38. Boswell, R.; Schoderbek, D.; Collett, T.S.; Ohtsuki, S.; White, M.D.; Anderson, B.J. The iġnik sikumi field experiment, alaska north slope: Design, operations, and implications for CO2-CH4 exchange in gas hydrate reservoirs. Energy Fuels 2016, 31, 140–153. [Google Scholar] [CrossRef]
  39. Darnell, K.N.; Flemings, P.B.; DiCarlo, D. Subsurface injection of combustion power plant effluent as a solid-phase carbon dioxide storage strategy: Injections of flue gas for CO2 storage. Geophys. Res. Lett. 2017, 44, 5521–5530. [Google Scholar] [CrossRef]
  40. Kvamme, B. Thermodynamic Limitations of the CO2/N2 Mixture Injected into CH4 Hydrate in the Ignik Sikumi Field Trial. J. Chem. Eng. Data 2016, 61, 1280–1295. [Google Scholar] [CrossRef]
  41. Song, Y.; Wang, J.; Liu, Y.; Zhao, J. Analysis of heat transfer influences on gas production from methane hydrates using a combined method. Int. J. Heat Mass Transf. 2016, 92, 766–773. [Google Scholar] [CrossRef]
  42. Jin, Y.; Li, S.; Yang, D.; Jiang, X. Determination of dissociation front and operational optimization for hydrate development by combining depressurization and hot brine stimulation. J. Nat. Gas Sci. Eng. 2017, 50, 215–230. [Google Scholar] [CrossRef]
  43. Giraldo, C.; Klump, J.; Clarke, M.; Schicks, J.M. Sensitivity Analysis of Parameters Governing the Recovery of Methane from Natural Gas Hydrate Reservoirs. Energies 2014, 7, 2148–2176. [Google Scholar] [CrossRef] [Green Version]
  44. Lee, J.; Park, S.; Sung, W. An experimental study on the productivity of dissociated gas from gas hydrate by depressurization scheme. Energy Convers. Manag. 2010, 51, 2510–2515. [Google Scholar] [CrossRef]
  45. Li, X.-S.; Zhang, Y.; Li, G.; Chen, Z.-Y.; Wu, H.-J. Experimental Investigation into the Production Behavior of Methane Hydrate in Porous Sediment by Depressurization with a Novel Three-Dimensional Cubic Hydrate Simulator. Energy Fuels 2011, 25, 4497–4505. [Google Scholar] [CrossRef]
  46. Li, B.; Liang, Y.-P.; Li, X.-S.; Wu, H.-J. Numerical Analysis of Methane Hydrate Decomposition Experiments by Depressurization around Freezing Point in Porous Media. Fuel 2015, 159, 925–934. [Google Scholar] [CrossRef]
  47. Tang, L.; Xiao, R.; Huang, C.; Feng, Z.; Fan, S. Experimental investigation of production behavior of gas hydrate under thermal stimulation in unconsolidated sediment. Energy Fuels 2005, 19, 2402–2407. [Google Scholar] [CrossRef]
  48. Falser, S.; Uchida, S.; Palmer, A.C.; Soga, K.; Tan, T.S. Increased Gas Production from Hydrates by Combining Depressurization with Heating of the Wellbore. Energy Fuels 2012, 26, 6259–6267. [Google Scholar] [CrossRef]
  49. Li, X.S.; Yang, B.; Duan, L.P.; Li, G.; Huang, N.S.; Zhang, Y. Experimental study on gas production from methane hydrate in porous media by SAGD method. Appl. Energy 2013, 112, 1233–1240. [Google Scholar] [CrossRef]
  50. Li, G.; Li, X.-S.; Yang, B.; Duan, L.-P.; Huang, N.-S.; Zhang, Y.; Tang, L.G. The use of dual horizontal wells in gas production from hydrate accumulations. Appl. Energy 2013, 112, 1303–1310. [Google Scholar] [CrossRef]
  51. Yang, X.; Sun, C.Y.; Yuan, Q.; Ma, P.C.; Chen, G.J. Experimental Study on Gas Production from Methane Hydrate-Bearing Sand by Hot-Water Cyclic Injection. Energy Fuels 2010, 24, 5912–5920. [Google Scholar] [CrossRef]
  52. Li, X.S.; Wang, Y.; Duan, L.P.; Li, G.; Zhang, Y.; Huang, N.S.; Chen, D.F. Experimental investigation into methane hydrate production during three-dimensional thermal huff and puff. Appl. Energy 2012, 94, 48–57. [Google Scholar] [CrossRef]
  53. Song, Y.; Zhang, L.; Lv, Q.; Yang, M.; Ling, Z.; Zhao, J. Assessment of gas production from natural gas hydrate using depressurization, thermal stimulation and combined methods. RSC Adv. 2016, 6, 47357–47367. [Google Scholar] [CrossRef]
  54. Loh, M.; Too, J.L.; Falser, S.; Linga, P.; Khoo, B.C.; Palmer, A. Gas Production from Methane Hydrates in a Dual Wellbore System. Energy Fuels 2015, 29, 35–42. [Google Scholar] [CrossRef]
  55. Feng, J.C.; Wang, Y.; Li, X.S.; Li, G.; Zhang, Y.; Chen, Z.Y. Effect of horizontal and vertical well patterns on methane hydrate dissociation behaviors in pilot-scale hydrate simulator. Appl. Energy 2015, 145, 69–79. [Google Scholar] [CrossRef]
  56. Wang, Y.; Li, X.S.; Li, G.; Zhang, Y.; Li, B.; Chen, Z.Y. Experimental investigation into methane hydrate production during three-dimensional thermal stimulation with five-spot well system. Appl. Energy 2013, 110, 90–97. [Google Scholar] [CrossRef]
  57. Wang, Y.; Li, X.S.; Li, G.; Zhang, Y.; Li, B.; Feng, J.C. A three-dimensional study on methane hydrate decomposition with different methods using five-spot well. Appl. Energy 2013, 112, 83–92. [Google Scholar] [CrossRef]
  58. Wang, Y.; Li, X.S.; Li, G.; Huang, N.S.; Feng, J.C. Experimental study on the hydrate dissociation in porous media by five-spot thermal huff and puff method. Fuel 2014, 117, 688–696. [Google Scholar] [CrossRef]
  59. Zhao, J.; Yu, T.; Song, Y.; Liu, D.; Liu, W.; Liu, Y.; Yang, M.; Ruan, X.; Li, Y. Numerical simulation of gas production from hydrate deposits using a single vertical well by depressurization in the Qilian Mountain permafrost, Qinghai-Tibet Plateau, China. Energy 2013, 52, 308–319. [Google Scholar] [CrossRef]
  60. Wang, Y.; Feng, J.C.; Li, X.S.; Zhang, Y.; Li, G. Evaluation of Gas Production from Marine Hydrate Deposits at the GMGS2-Site 8, Pearl River Mouth Basin, South China Sea. Energies 2016, 9, 222. [Google Scholar] [CrossRef]
  61. Li, B.; Li, X.-S.; Li, G. Kinetic Studies of Methane Hydrate Formation in Porous Media Based on Experiments in a Pilot-Scale Hydrate Simulator and a New Model. Chem. Eng. Sci. 2014, 105, 220–230. [Google Scholar] [CrossRef]
  62. Feng, J.C.; Wang, Y.; Li, X.S. Entropy generation analysis of hydrate dissociation by depressurization with horizontal well in different scales of hydrate reservoirs. Energy 2017, 125, 62–71. [Google Scholar] [CrossRef]
  63. Li, B.; Liu, S.D.; Liang, Y.P.; Liu, H. The use of electrical heating for the enhancement of gas recovery from methane hydrate in porous media. Appl. Energy 2018, 227, 694–702. [Google Scholar] [CrossRef]
  64. Liang, Y.; Liu, S.; Zhao, W.; Li, B.; Wan, Q.; Li, G. Effects of vertical center well and side well on hydrate exploitation by depressurization and combination method with wellbore heating. J. Nat. Gas Sci. Eng. 2018, 55, 154–164. [Google Scholar] [CrossRef]
  65. Callarotti, R.C. Energy Return on Energy Invested (EROI) for the Electrical Heating of Methane Hydrate Reservoirs. Sustainability 2011, 3, 2105–2114. [Google Scholar] [CrossRef] [Green Version]
Figure 1. Schematic of the experimental system.
Energies 12 00124 g001
Figure 2. Reactor internal structure and well design.
Energies 12 00124 g002
Figure 3. The temperature change curve of Run 3.
Energies 12 00124 g003
Figure 4. (a) The temperature change of T5 in five Runs during the production stage; (b) The cumulative water production of five Runs in the production stage.
Energies 12 00124 g004aEnergies 12 00124 g004b
Figure 5. The volume of produced CH4 (VP) and undissociated hydrate mass (mH) with different exploitation methods.
Energies 12 00124 g005
Figure 6. Cumulative gas production (VP) and undecomposed hydrate mass (mH) under different electric heating power.
Energies 12 00124 g006
Figure 7. The curves of net energy (Enet) and the total energy consumption (EC) of four runs in the production stage.
Energies 12 00124 g007
Figure 8. (a) The comparison of the MEnet, EC and η in the five Runs; (b) The average net energy of five Runs.
Energies 12 00124 g008
Table 1. Summary of experimental conditions and results of methane hydrate dissociation in the reactor in stage II.
RunCategoryPower Q (W)PW (MPa)t (min)SH1SG1SA1VP (L)T5 (°C)CP (g)
1PD05.00427.530.3020.3780.32031.9767.0110.25
2SDH12.55.00130.280.2980.3930.30831.22318.7820.81
3SDH255.0093.920.2950.3820.32330.06828.6139.74
4PH255.90325.930.2980.4150.28728.11027.061.73
5H&P255.00113.430.3140.4280.25832.98416.7634.92
Where Run represents the test serial number; Category stands for the category of each experimental method; Power Q and PW represent the heating power and the production pressure in each experiment group, respectively, and t is the duration of the production stage; SH1, SG1, and SA1 represent the initial saturations of NGH, methane gas and water when the pressure was just dropped to the production pressure; VP is the total amount of gas accumulated in the stage II after exploitation; T5 represents the temperature at the center of the reactor in each run at the end of the production stage; CP stands for the total amount of water produced outside the reactor.

