Article

A Study on Urea-Water Solution Spray-Wall Impingement Process and Solid Deposit Formation in Urea-SCR de-NOx System

by
G.M. Hasan Shahariar
1 and
Ock Taeck Lim
2,*
1
Graduate School of Mechanical Engineering, University of Ulsan, Ulsan 680-749, Korea
2
School of Mechanical Engineering, University of Ulsan, Ulsan 680-749, Korea
*
Author to whom correspondence should be addressed.
Energies 2019, 12(1), 125; https://doi.org/10.3390/en12010125
Submission received: 3 December 2018 / Revised: 24 December 2018 / Accepted: 28 December 2018 / Published: 30 December 2018
(This article belongs to the Section A: Sustainable Energy)

Abstract

:
Selective catalytic reduction (SCR) has been exhibited as a promising method of NOx abatement from diesel engine emissions. Long-term durability is one of the key requirements for the automotive SCR system. A high NOx conversion, droplet distribution and mixing, and fluid film and solid deposit formation are the major challenges to the successful implementation of the SCR system. The current study is therefore three-fold. Firstly, high-speed images disclose detailed information of the spray impingement on the heated impingement surface. The spray impingement investigation took place in a specially-designed optically-accessible visualization chamber where the Z-type shadowgraph technique was used to capture the high-speed images. Wall temperature has a great influence on the film formation and wall wetting. A higher wall temperature can significantly increase the droplet evaporation, and consequently, wall wetting decreases. The numerical analysis was performed based on the Eulerian-Lagrangian approach using STAR CCM+ CFD code. Secondly, the resultant phenomena due to spray-wall impingement such as fluid film generation and transport, solid deposit formation, and thermal decomposition were recorded using a high-speed camera operating at a low frame rate. Infrared thermal imaging was used to observe the spray cooling effect after impingement. Spray impingement caused local cooling, which led to wall film formation, which introduced urea crystallization. Finally, solid deposits were analyzed and characterized using Fourier transform infrared spectroscopy (FTIR) and thermogravimetric analysis (TGA). FTIR analysis revealed that urea decomposition products vary based on the temperature, and undecomposed urea, biuret, cyanuric acid, ammeline, and melamine can be formed at different temperatures. TGA analysis showed that accumulated deposits were hard to remove. Moreover, complete thermal decomposition of deposits is not possible at the regular exhaust temperature, as it requires a comparatively long time span.

1. Introduction

Energy is omnipresent with respect to life, and the quest to obtain energy without interrupting the environment is growing at an exponential rate. At present, 27% of global energy is being utilized by the transportation sector, which mainly in the form of crude oil (about 95%) to power automobiles [1]. As a result of better thermal efficiency, which can effectively lead to a better fuel economy, an increased interest can be seen in diesel engines. An improved injection system and application of the EGR system [2] or improvement of fuel properties [3] significantly increase the output power. There is no effective alternative to diesel engines in the case of heavy-duty transportation, off-road machinery, construction, and the agricultural and mining industries because of their proven fuel economy, durability, and reliability. Unfortunately, diesel engine gaseous exhaust emissions contain a significant percentage of NOx, a combustion by-product that is generated in the combustion chamber, due to the high temperatures produced by compression in the engine cylinders because of diesel fuel ignition. NOx, a major air pollutant induced by the transportation sector, has detrimental effects on the environment and human health, contributes to smog formation, and can cause heart disease, various respiratory problems, lung cancer, and exacerbation of asthma. By reducing the combustion temperature, NOx generation may be controlled. To maintain a high engine performance, the combustion temperature cannot be lowered. Instead, mitigation of NOx emissions can be obtained by post-treatment of the exhaust gas stream from diesel engines. To meet the challenges of current strengthened emission standards like EURO 6, automobile brands are being pressured to include emission reduction devices in their newly-manufactured engines. The current EURO 6 emission standard has introduced a significant NOx limit of 80 gm/km from the 180 gm/km one in EURO 5 [4]. To fulfill this rising challenge, an effective emission reduction method is necessary. Over the last few years, the SCR system has been a proven technology for NOx emission reduction for the transportation sector, which can achieve over 90% NOx conversion to satisfy the existing emission standards [5]. Usually, this method uses an injector to inject the urea water solution (UWS) (the commercial name is AdBlue) in the exhaust gas flow before the catalyst. After the injection into the hot exhaust stream, urea decomposes into NH3, which chemically reacts with the NOx molecules and subsequently produces N2 [6]. This urea decomposition process is completed as follows: (i) liquid droplet evaporation, (ii) ammonia (NH3) and isocyanic acid formation through urea thermolysis, and (iii) hydrolysis of isocyanic acid [7,8,9]. A uniform urea droplet distribution [10,11] and the reduction of undesired solid deposit formation [12,13] are the main challenges in implementing the SCR NOx reduction system in the transportation sector. The recent modern SCR system requires a complex exhaust pipe geometry design including a mixer [14], and complete thermal decomposition of urea requires long time scales, so droplet impingement on the exhaust pipe wall and the mixer blade cannot be avoided [15]. Because of spray impingement, the wall temperature falls at a definite level; therefore, liquid film formation occurs [15]. Further cooling occurs due to liquid film evaporation, which raises deposit formation risk [16,17,18]. The conventional pressure-driven urea-SCR injector works at a low injection pressure; hence, no secondary droplet breakup occurs, and relatively large-sized droplets are produced, which leads to spray cooling, as well as wall film generation, which is the predecessor to urea deposit generation [19].
During urea thermal decomposition, two molecules of NH3 are produced by the thermolysis (1) and hydrolysis (2) reaction of urea:
NH2CONH2 → NH3 + HNCO
HNCO + H2O → NH3 + CO2
The SCR solid deposit chemical composition is temperature dependent [20], and several deposit components can be produced at various decomposition temperatures [17,21]. In the first step of the urea decomposition process, the generated isocyanic acid can make a chemical reaction with the undecomposed urea, which produces biuret, triuret, and other heterocyclic compounds like ammelide, cyanuric acid, melamine, and ammeline; these contribute to the solid deposit formation depending on the decomposition temperature [17,22,23]. Solid deposit formation is not only harmful to SCR hardware components like the injector, mixer, and exhaust pipe, but also generate backpressure, which reduces engine performance. Moreover, deposit accumulated on the SCR catalyst can lower the catalyst activity, which seriously affects the NOx conversion rate. In order to prevent the solid deposit formation or to remove the accumulated deposits efficiently, it is important to investigate the chemical composition [20,21] and thermal decomposition behavior of the urea solid deposits [24]. Figure 1 shows the overall process (spray to solid deposit formation) in the SCR system.
Several numerical simulation studies regarding urea-SCR sprays have been conducted [7,15,25,26]. On the other hand, recently, a limited amount of SCR experimental spray investigation data has been made available to disclose the droplet breakup, distribution, and associated phenomena [4,14,27,28,29,30]. Investigation of UWS spray impingement and urea-SCR spray optimization can be the possible measure for discovering the mechanisms and subsequent phenomena for spray-wall impingement, hence, to mitigate the solid deposit formation risk [20]. In the case of UWS spray impingement, multi-step droplet evaporation phenomena of UWS droplets [31,32] and the impingement regime map depending on the kinetic features of the droplets and impingement wall temperature have been reported [7,15,19]. Besides, droplet wall impingement of fuel spray [33,34], spray cooling [35], and other applications by implementing Mie scattering [28], backlight imaging [4], or other imaging techniques have been conducted, and these techniques can be successfully implemented for urea-SCR spray impingement investigation. Therefore, the basic perspective of the UWS spray impingement and associated circumstances of wall film and solid deposit formation have not been thoroughly investigated.
Abu-Ramadan et al. [36], F. Birkhold [37], and Shahariar et al. [19] conducted numerical investigations of UWS spray-wall impingement. A complete SCR CFD model includes spray parameters, droplet evaporation, and heat transfer, spray-wall impingement, etc. [38]. Conventional CFD models include complicated meshing, which should be done using an advanced method and having delayed solver time. However, the execution of the automatic meshing technique can be operative here [39]. Spray wall interaction is a very complicated phenomenon modeled by Bai-Gosman [40,41] and further developed by other researchers [42]. Different modeling concepts have been established for SCR numerical analysis, like droplet evaporation [43], deposit formation [44], ammonia homogenization [45], etc. However, to understand the UWS spray impingement phenomena and the mechanisms underlying urea deposit creation to mitigate the process, a proper investigation is mandatory in an intensive closed vessel environment having clear optical access [19,27,36,37,46,47].
The present work is a methodical investigation of UWS spray impingement and subsequent phenomena in the SCR system in an intensive closed vessel environment, where the physical and chemical analysis were combined to obtain a complete understanding of the spray to solid deposit formation. The SCR spray impingement phenomenon was investigated both qualitatively and quantitatively to disclose the droplet interaction behavior at varying physical conditions. The spray-wall impingement process of the SCR system has been researched by both numerical and experimental study. A high-speed imaging technique together with the Z-type shadowgraph were used to capture the spray impingement process. Numerical analysis was performed based on the Eulerian-Lagrangian approach using STAR CCM+ simulation code. A halogen lamp was illuminated during the capturing of the film generation, urea crystallization, and deposit creation process. Infrared thermography was implemented to assess the spray cooling of the impingement wall surface at an improved temporal and spatial resolution along the impingent area. Solid deposits formed because of wall impingement and imperfect urea decomposition were characterized by FTIR measurement to obtain the chemical composition at different operating temperature. Furthermore, the thermal decomposition behavior of the solid deposits was investigated by TGA analysis. Results and analysis of the current study provide detailed insights into the UWS spray impingement, which leads to solid deposit formation and the thermochemical properties of urea deposits. The information can be used for the layout of an effective NOx post-treatment system design and offers the possibility to validate numerical simulations.

2. Experimental Setup and Method

2.1. Optical Chamber and Heating Arrangement

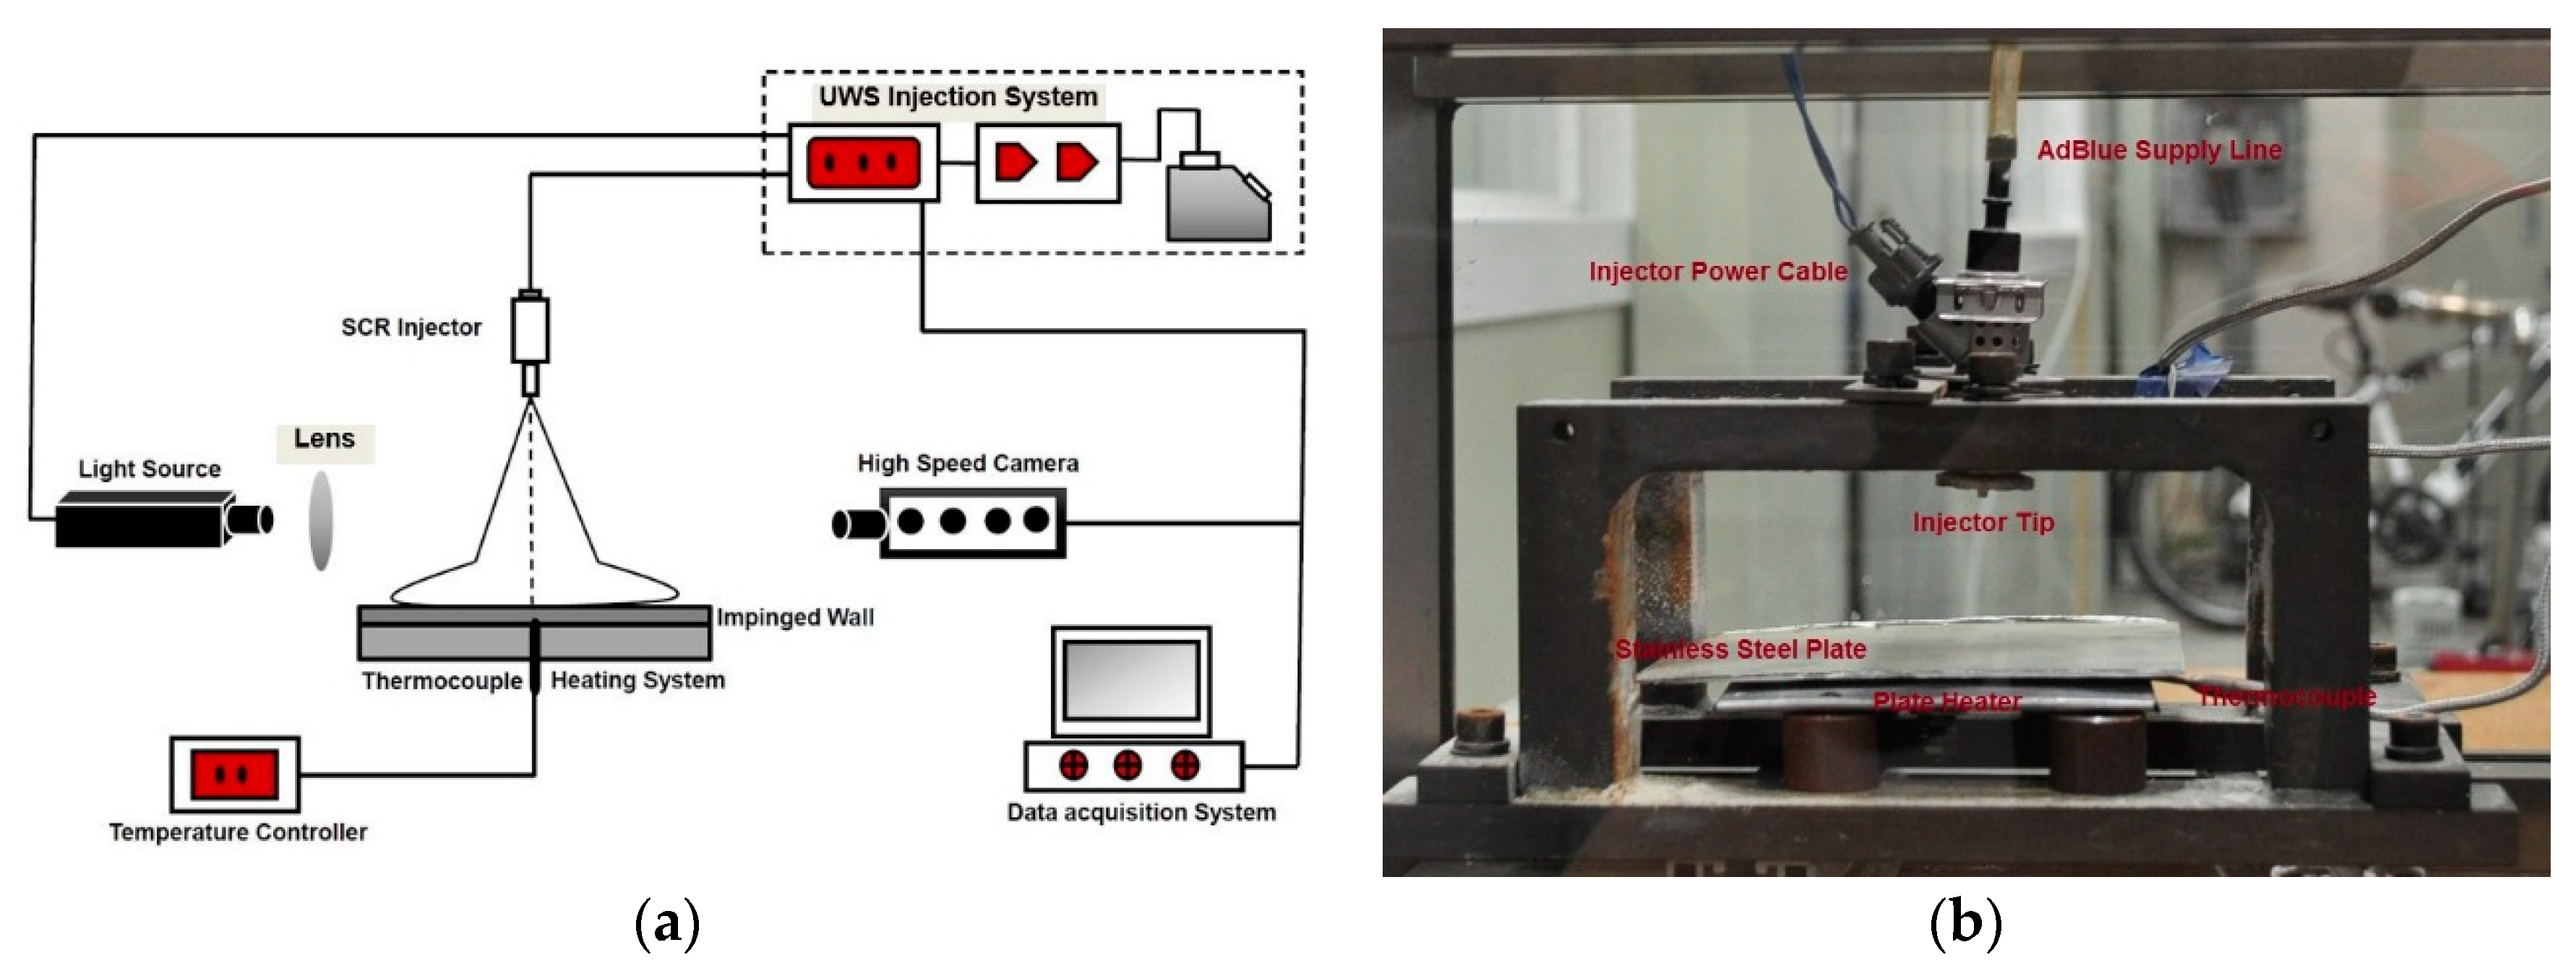
Visualization and capturing of the UWS spray structure in the SCR setup are not possible because of the high density of particulate matter (PM) and smoke elements in the exhaust stream. Exhaust pipe vibration due to the random fluctuation of pressure may also cause distortion in the spray structure while capturing. Researchers have introduced optically-accessible visualization chambers to capture the urea-SCR spray images [27,48]. An optical chamber was designed and constructed to visualize the UWS spray-wall impingement phenomena in the current investigation. The chamber contained four optically-visible windows made of Pyrex glass, which has a high resistance to temperature and pressure. Figure 2a shows the schematic diagram of the UWS spray-wall impingement experimental setup. Figure 2b shows the injector setup and impingement wall heating unit in the optical visualization chamber. A 3-hole commercial urea-SCR injector was mounted in the vertical direction to the specially-designed injector holder, which allows the flexibility of adjusting the injection height and position with respect to the impinging wall depending on the experiment requirements. The spray impingement wall was a stainless-steel plate having a dimension of 150 × 150 mm and a thickness of 2 mm, which was placed 30 mm down toward the injector tip. The impinged plate was heated using a plate-type heater, and the heater temperature was controlled by means of a solid-state relay (SSR) and PID temperature controller. The impingement surface temperature was maintained by a k-type thermocouple with a flat probe, and this thermocouple was connected to the PID controller. A high-pressure urea dosing system injected the UWS, and the pressure and duration of the injection were maintained by the dosing control unit. The injection quantity of the experimental injector was measured in our previous study for different rpm to determine the injector mass flow rate, and the value was found as 4.824 kg/h [27].

2.2. Optical and Imaging Arrangement

A Z-type focused shadowgraph imaging technique was applied to capture the spray-wall impingement. A 532-nm high-power diode-pumped solid state (DPSS) green-type laser was used as the illumination source (Model MGL-W-532 8W). A pair of cylindrical lenses was used to diverge the point laser beam initially, then a concave mirror of 150 mm in diameter and having a 2000-mm focal length was used to collimate the beam. The collimated light beam then passed through the optical window, refocused by another concave mirror of the same type, and finally, the returning beam from the second mirror was guided towards the high-speed camera lens to capture the transient spray-wall impingement image sequence. Using a Photron SA3 high-speed camera with a 300-mm cylindrical lens (AF Nikkor 300 mm), the experimental images were captured at 7500 fps, and the image resolution was 512 × 512 pixels. Figure 3a presents the schematic diagram of the optical setup and camera arrangement for the investigation. The captured images were recorded in the computer, and the high-speed camera signal was triggered as the injector’s transistor-transistor logic (TTL) signal. The high intensity of the laser helped to obtain an excellent spatiotemporal quality in the spray-wall impingement images with a clearly-defined boundary and sharp edges. Table 1 presents the relevant high-speed camera configurations for the spray-wall impingement image capturing. The obtained images were analyzed by a digital image processing technique. First, the RGB images were transformed into grayscale images. The spatial intensity distribution of the grayscale images was rectified by the background subtraction. Then, the relevant dimensions (axial and radial distance after impingement, penetration length, film and deposit area, etc.) of the obtained images were measured. UWS spray-wall impingement dimensions can be seen in Figure 3b. The fluid film and deposit creation because of wall impingement and imperfect urea decomposition were captured using the high-speed camera at a frame rate of 60 fps and a resolution of 768 × 512 pixels. The high-speed camera was vertically mounted above the spray impingement surface, and a halogen light source was implemented to provide the illumination.

2.3. Experimental Conditions and Method

Ambient temperature, injector configuration, optical arrangement, and illumination properties were kept unchanged during the plenary experiment. The investigation conditions and associated parameters are provided in Table 2. Each experimental condition was repeated five times to obtain the best average result for each experimental condition. The spray cooling of the heated wall due to wall impingement was captured by infrared thermography. The infrared thermal camera was fixed below the impingement wall, and the thermal images were recorded on the computer. The urea deposit formed due to spray-wall impingement and imperfect urea decomposition were characterized by FTIR and thermogravimetric analysis (TGA) to discover the deposit’s chemical composition and thermal decomposition behavior.

3. Numerical Modeling

In multiphase flow modeling, the most popular approaches with better accuracy are direct numerical simulation (DNS), the Eulerian-Eulerian model, and the Eulerian-Lagrangian model. Multiphase flow modeling by the DNS approach can predict more accurate results, but this is a relatively bulky computational method. It can take a number of weeks to complete the computation with the increased computational expense; that is why this is not preferred by experts for use in industry [49]. The convenience of using the Eulerian-Lagrangian approach over the Eulerian-Eulerian approach is a thorough indication of the discrete behavior of the particles rather than continuum dynamics. Eulerian-Eulerian modeling causes a high computational cost, while multiplex sets of equations are adopted. On the other hand, the Eulerian-Lagrangian approach works in two different ways, the droplet particles usually being modeled as individual droplets or simultaneously as a bundle. Separate droplet particle modeling can predict a comparatively precise outcome over parcels or bundles; however, this approach causes high computational cost. The bundle’s dynamic features (e.g., size, velocity) are usually analogous within the same bundle. The particles’ or parcels’ interaction among each other with the continuous phases is modeled by the Eulerian-Lagrangian concept applying the incompressible and unsteady Reynolds-averaged Navier–Stokes (RANS) equations for mass, momentum, energy, and species. The realizable k-ε model is implemented to model the turbulent flow as it shows better accuracy than the standard k-ε model to estimate the turbulence, and temperature effects were included by using the temperature heat flux model. A better mesh can result in precise calculations of urea-SCR wall impingement; though, traditional CFD modeling applies a complex mesh, which requires an improved technique, as well as extending the computational period. The current study implemented an automatic meshing technique where the volume mesh of a base of a size of 5 mm was used. Two prism layers were implemented to resolve the near-wall region flow precisely with a 2-mm thickness. Prism layers have an important role when determining the forces and heat transfer on the walls and near-wall flow separation. It also interrupts the numerical diffusion and leads to an accurate result. The STAR CCM+ commercial code was used to solve the modeled governing equations. The second order upwind scheme was implemented for multiphase flow calculation, as it provides precise results over the first order. The temporal discretization scheme implemented was the implicit method, which is bounded unconditionally, having a longer time step. Droplet particle influence on the continuous phases and the phases’ interactions were included in the simulation by two-way couplings with an under relaxation factor of 0.7. The Leidenfrost temperature effect was included in the droplet wall interaction model by using a specially-developed user-defined function (UDF) subroutine. All y+ treatment was implemented together with the two-layer concept, which can perform high y+ wall treatment in the coarse mesh zone and low y+ treatment in the fine mesh zone. Sensitivity analysis was performed for a 4-mm and a 3-mm mesh size; prism layers and the other settings were kept constant. The residuals for energy, momentum, turbulent kinetic energy, temperature, continuity, turbulent dissipation rate, and each species were monitored until stabilization to confirm the convergence. The detailed numerical modeling and parameters were described in our previous study [19], which were implemented in the current investigation.

4. Results and Discussion

4.1. UWS Spray-Wall Impingement Phenomena

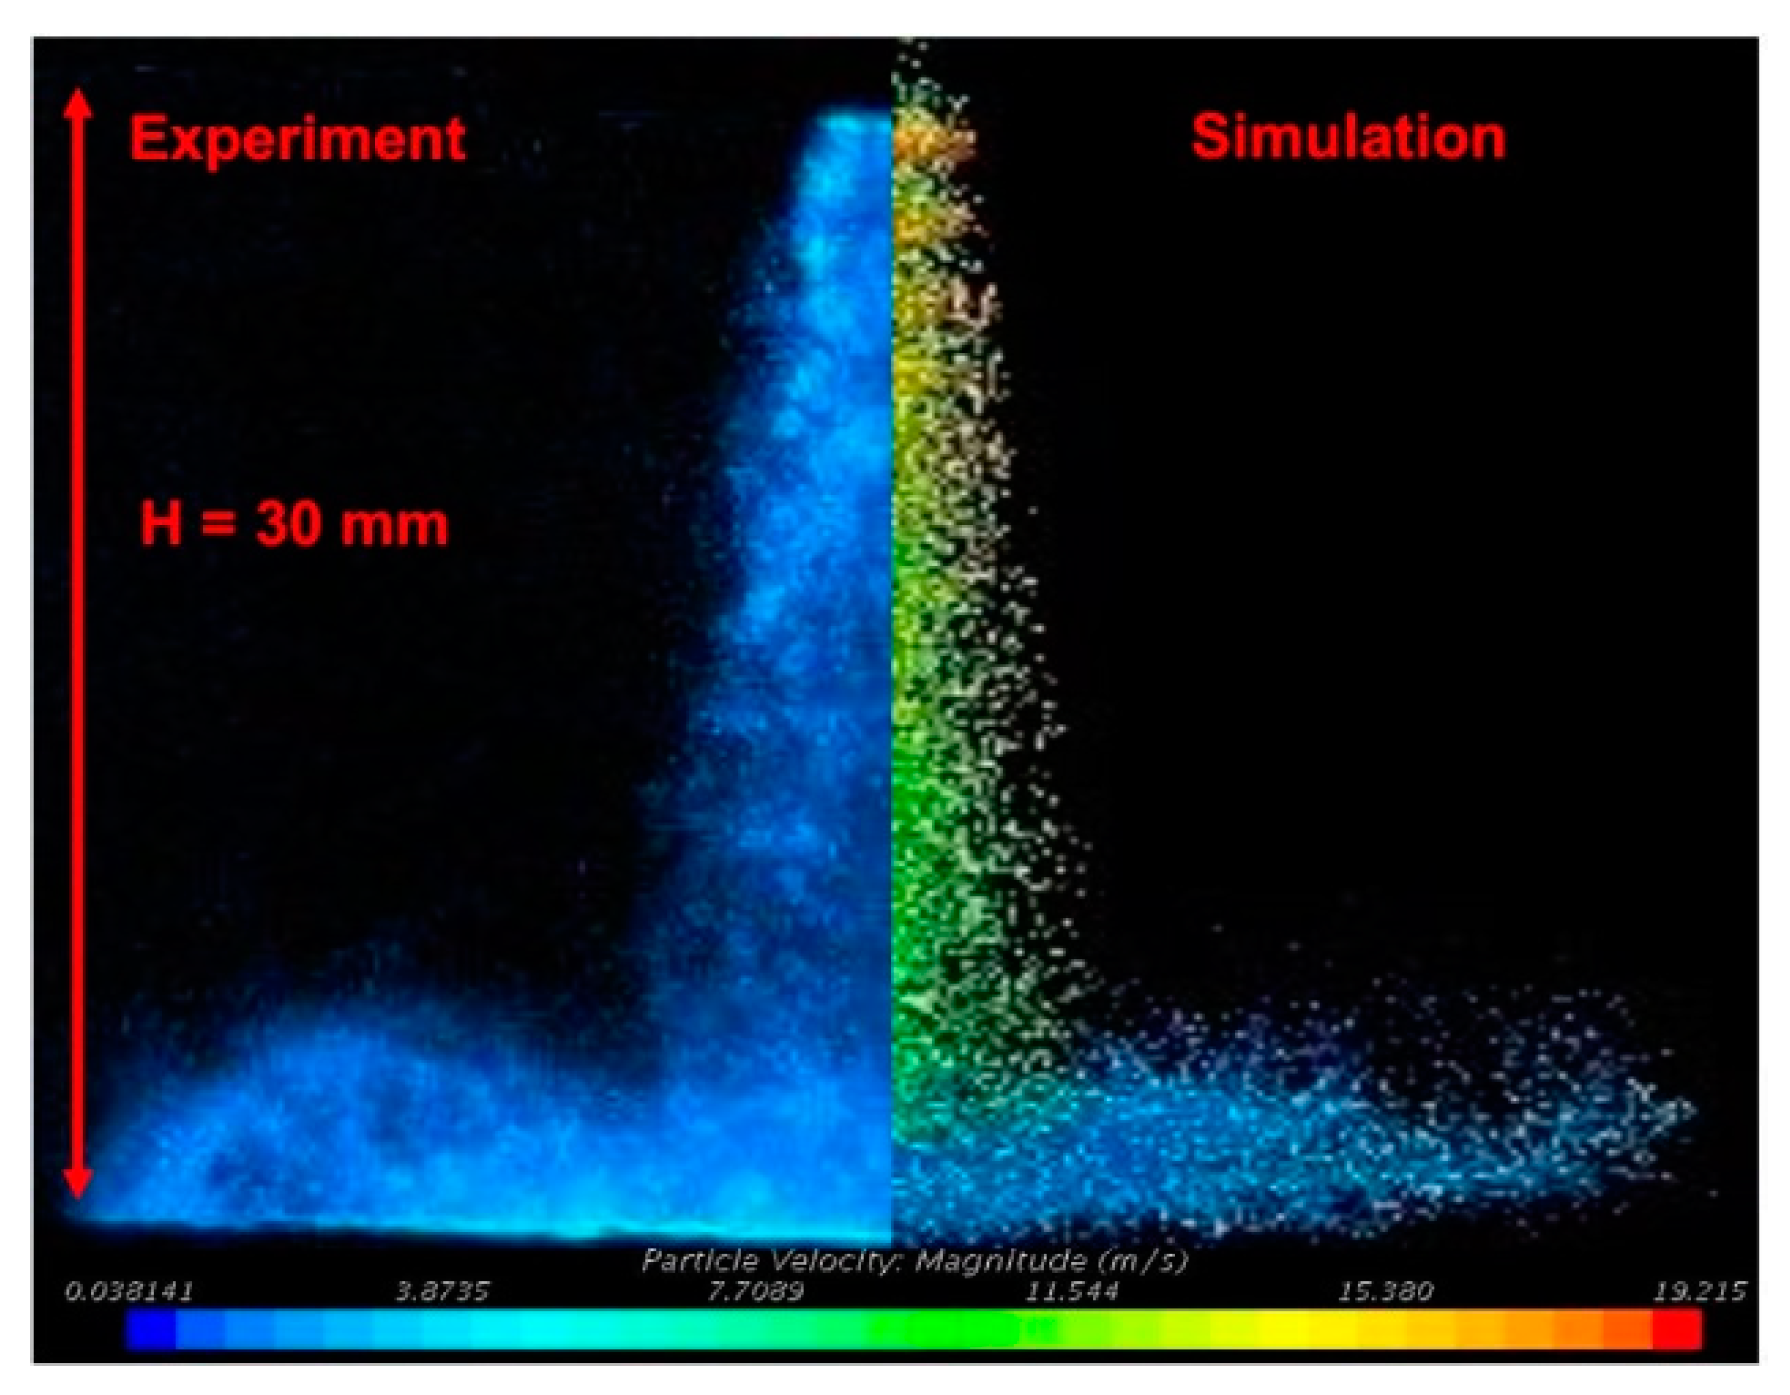
In the SCR system, investigation of UWS spray-wall impingement is important because droplet impingement has significant effects on urea distribution, mixing of the reductant with the exhaust gas, and thus, urea decomposition and solid deposit formation. UWS spray-wall impingement, spray propagation, and distribution in the SCR system mainly depend on injection pressure, injector position, and exhaust pipe wall temperature. Figure 4 shows the comparison of the experimental and numerical spray-wall impingement phenomena of UWS for a 30-mm injection height.
After the injection, UWS droplets impinged on the exhaust pipe wall. These impinging droplets caused an interaction and propagated on to the wall surface. Several fluid-dynamic and thermo-dynamic phenomena can occur during the process, which have remarkable effects on droplet evaporation, fluid film formation, and consequently, overall system performance. UWS spray droplets interacted with the impinging wall, and depending on the governing parameters, such as droplet velocity, droplet diameter, and wall surface temperature, different phenomena can occur [50,51]. Different outcomes can occur by relying on these parameters, for example the wetting regime causes a liquid film that acts as the precursor of urea deposit creation. On the other hand, the boiling regime leads to droplet evaporation, which will produce active substances for NOx conversion in the SCR system.
After the droplet entrainment depending on the droplet Weber number and wall surface temperature, different phenomena can occur for an impinging droplet, such as deposition, rebounding, or thermal breakup. The rebounding and thermal breakup of the droplets are advantageous, as breaking up large-sized droplets due to thermal breakup causes improved droplet evaporation and the generation of more active substances. Hence, proper mixing of SCR reductant and exhaust gas can take place. During droplet rebounding, momentum and surface energy loss occur in the droplets, and a secondary breakup may happen. This phenomenon accelerates the droplet evaporation, which resultantly increases the urea decomposition rate. On the other hand, the deposition of droplets on the impinging wall causes wall wetting, which introduces the wall film generation. This wall film acts as the nucleus of the solid deposit, which is a significant threat for efficient operation of the SCR system in diesel engines.
UWS impingement and spray propagation after impingement for 313 K and 573 K wall temperatures are shown in Figure 5a,b. The experimental and numerical spray-wall impingement images are given for the time frame from 4 ms–12 ms and for a time interval of 12 ms. The impingement wall height from the injector tip was h = 30 mm, and the injector was connected perpendicular to the wall. The spray droplets of the images obtained from the numerical simulation are colored based on their velocities.
The measurement of axial and radial distance traveled after the impingement can be the measure of the contact surface of the spray droplets and the exhaust pipe wall. If the axial and radial distance are higher, especially at a lower wall temperature, this may increase the wall wetting area, which increases the risk of fluid film formation and solid deposit formation. In Figure 5a, the working wall temperature (313 K) is much lower than the decomposition temperature of urea. Therefore, the atomization of the droplets is not good, and most of the droplets adhere to the impingement wall and cause further local cooling on the impinged area. At a high wall temperature (573 K) in Figure 5b, rebounding and thermal breakup occurred; thus, the evaporation rate after impingement increased significantly. At a higher temperature, the heat transfer rate between the UWS droplets and the impinging wall was better, and due to the rapid droplet evaporation, a significant amount of gas was produced. Moreover, because of the urea decomposition, NH3 and HNCO gases were produced. These gaseous elements together formed a hot turbulence zone and lifted and squeezed the UWS droplets. In Figure 5b can be seen a significant curl and bouncing occurring after the impingement on the hot surface at a 573 K wall temperature. During the continuous injection, spray droplets impinged on this very hot turbulence zone; a better mix formed, and the chance of droplet wall impingement reduced significantly. As a result, droplet evaporation and urea decomposition increased dramatically, and the risk of wall wetting reduced remarkably.
Figure 6a,b presents a detailed look at the axial and radial distance measurement of UWS spray impingement at wall temperatures of 313 K and 573 K. At a 313 K wall temperature, the axial height of the impinging spray was much higher than the 573 K wall temperature. This is a clear indication that at a low wall temperature, more wall wetting occurred, and the wall film thickness also became much greater. On the other hand, the radial distance was larger at a high wall temperature. This is because, at a high temperature, due to the rapid evaporation, the generated turbulence propagated the spray more quickly along the impinged wall. Hence, the hot spray droplets distributed in a comparatively bigger area of the impinging wall, which is advantageous for urea decomposition and for the mitigation of solid deposit formation.
Figure 7a shows the experimental and numerical spray projection area after impingement for the wall temperatures of 313 K and 573 K. The spray projection area was large at a low wall temperature because at a low temperature, the droplet evaporation rate was very slow. Therefore, most of the droplets impinged on and adhered to the wall. Hence, wall wetting, and the fluid film formed, and finally, the solid deposit formed, which may block the exhaust pipe and increase the engine backpressure.
Figure 7b shows the experimental and numerical spray tip penetration of UWS spray until the droplet impingement. A high wall temperature slightly influenced the spray droplet velocity as the wall temperature depends on the exhaust temperature; at 573 K, the wall temperature impingement occurred around 1750 µs, and at a 313 K wall temperature, impingement occurred at 2250 µs. Therefore, the temperature had an effect on spray propagation, and this may affect the wall impingement, droplet evaporation, and other associated phenomena.

4.2. Effects of UWS Spray-Wall Impingement

During the spray impingement on the heated wall surface, the accumulated liquid due to the wall wetting was transported and distributed by the momentum of each spray injection, and eventually, the wall film was formed. Figure 8a,b shows the wall film formation phenomena and film area development after impingement. ASOI denotes the time instant of the start of the first injection. The impingement surface temperature was kept at 573 K during the investigation. After the start of the injection, UWS spray droplets impinged on the hot surface of the impingement wall, hence the resultant initial footprint of the fluid film, which can be seen in Figure 8a (i). UWS droplets partially evaporated after the first injection, which is seen in Figure 8a (ii); however, the droplet evaporation rate between two injections was much low than the further impinging droplets during continuous injection. The liquid film area showed an increasing trend from injection to injection (Figure 8a (iii)). Kuhnke [42] and Liao et al. [52] showed in their study that the spray-wall interaction of the droplets led to rebounding and thermal breakup if the impinging surface temperature was above 553 K. As the impingement surface temperature was maintained at 573 K in the current study and yellowish smoke was emitted in downstream of the fluid film area (Figure 8a (iii)), it is evident from the image that thermal breakup of the UWS droplets occurred in the rebounding droplets; hence, urea particles decomposed to ammonia and isocyanic acid. After the end of the injection, the water content evaporated gradually due to the high wall surface temperature, and the initial footprint of the solid deposit can be seen in Figure 8a (iv), which acted as the nuclei for further deposit formation. During continuous injection, wall wetting increased over time. Wall film area was estimated for the injection durations of 30 ms and 60 ms. The measurement (Figure 8b) reveals that the injection duration significantly influenced fluid film development when other conditions remained unchanged. The liquid film accumulated on the plate surface was a urea-enriched solution. Due to the film formation, wall temperature dropped, and local cooling occurred; as result, urea started to crystallize. Increasing the injection duration led to faster development of the film area; hence, the risk of solid deposit formation increased in the corresponding impingement region for a longer injection duration. The measurements and visualization of this investigation reveal that the optical chamber can disclose the film formation phenomena in a more realistic pathway, and the outcomes clearly indicate that all the areas associated with wall wetting can be the subject to film formation prior to solid deposit formation.
After the end of injection, water particles started to evaporate from the wall film, and the first footprint of solid deposit could be visualized; thus, urea began to crystallize from the urea-enriched wall film (Figure 9a (i)). Twelve seconds after the end of injection (AEOI) for that specific injection event, the maximum amount of solid deposit formed, which can be seen in Figure 9a (ii). After that, as the UWS injection stopped, there was no more spray impingement; hence, further local cooling was not occurring, and the impinged surface started to recover the temperature. As a result, the solid deposit started to decompose due to the high heat, which can be seen in Figure 9a (iii). The solid deposit components almost disappeared after 40 s, which can be seen in Figure 9a (iv). From the graph (Figure 9b), it is evident that the solid deposit growth rate was much higher than the thermal decomposition, and the decomposition process strongly depended on the heat transfer rate of the plate. The complete thermal decomposition of the accumulated solid deposits may not be possible in the regular exhaust physical conditions, and this takes a long time to decompose. Therefore, redesigning the SCR spray system by improving the droplet properties may avoid or minimize the spray impingement, which can reduce the deposit formation risk. Solid deposits can form on the geometrical features like blade edge, holes, and gaps, as well as on the plane surfaces, which can seriously affect the SCR system performance. Moreover, the exhaust pipe can be blocked by the accumulated solid deposits, which will directly affect the engine performance by increasing the backpressure.
The spray cooling of the heated wall due to UWS spray impingement was captured by infrared thermography. The thermograph image sequence indicated the temperature drop of the impingement region and heat recovery phenomena after the end of injection. UWS was injected at an injection duration of 60 ms with five successive injections in each event. Figure 10a shows the impingement wall surface temperature map before the start of injection. Figure 10b–d displays the first, second, and third group of the injection events. After the injection, the temperature of the front cone of the impingement region dropped gradually, and the low-temperature region increased injection to injection. UWS injection was stopped after the third group of injections, and after that, the impingement plate started to recover the temperature, which can be seen in Figure 10e,f. The spray impingement caused strong spray cooling in the impingement area, creating a huge temperature difference with the non-impingement area, and liquid film formation occurred in the cooled region, which was the initial footprint of the solid deposit. However, due to the increasing number of injections, the local cooling increased, and the wall wetting area propagated radially by the injection momentum. Therefore, during continuous operation, the overall plate temperature decreased and the cooled zone increased, leading to water droplets’ evaporation and incomplete urea decomposition; finally, this accelerated the solid deposit formation.

4.3. Characterization of Urea Deposits

Solid deposits formed on the injector tip and wall surface because of spray impingement and imperfect urea decomposition, as shown in Figure 11. The generated deposits were removed and made into finely-ground samples for IR spectroscopy and TGA measurement. To mitigate the solid deposit formation, to remove the accumulated solid deposits successfully, and therefore, to ensure the efficient operation of the SCR system, the proper investigation of the chemical composition and thermal decomposition behavior of the deposit components is mandatory. From the IR spectra, the chemical composition of the solid deposit elements can be revealed, which were formed at different operating temperature. The IR spectra of the primary components are presented in Figure 12 [21], used as the standard for the identification of the chemical species available in the urea deposit samples generated at different operating temperatures. The UV-visible spectra of the deposit components showed a single strong peak in the UV region, mostly for a very low wavelength. The IR spectra obtained for the acting temperature of 423 K are shown in Figure 13, which were analyzed to identify the major components present. From the IR spectra bands at 1460 cm−1, 1680 cm−1, and 3430 cm−1, it can be seen that there are strong peaks for urea, that is the mean major amount of unreacted urea present in the decomposition product. The other major product detected in the FTIR spectra of the 423 K residue was biuret, with bands at 1070 cm−1 and 1406 cm−1 attributable to it. There may also have been some cyanuric acid present, as there was a band at 3042 cm−1, and the 3202 cm−1 band could also be due to cyanuric acid. The IR spectrum of the urea deposit product at 573 K (Figure 14) had 1049 cm−1 and 1460 cm−1 bands, which indicated that there may have been some cyanuric acid present. However, the major mass percentage of highly dense peaks for the bands at 780 cm−1, 1708 cm−1, and 3068 cm−1 stands for ammeline, and the 3322 cm−1 and 3470 cm−1 bands indicate melamine, which are the major components at 573 K of the decomposition product.
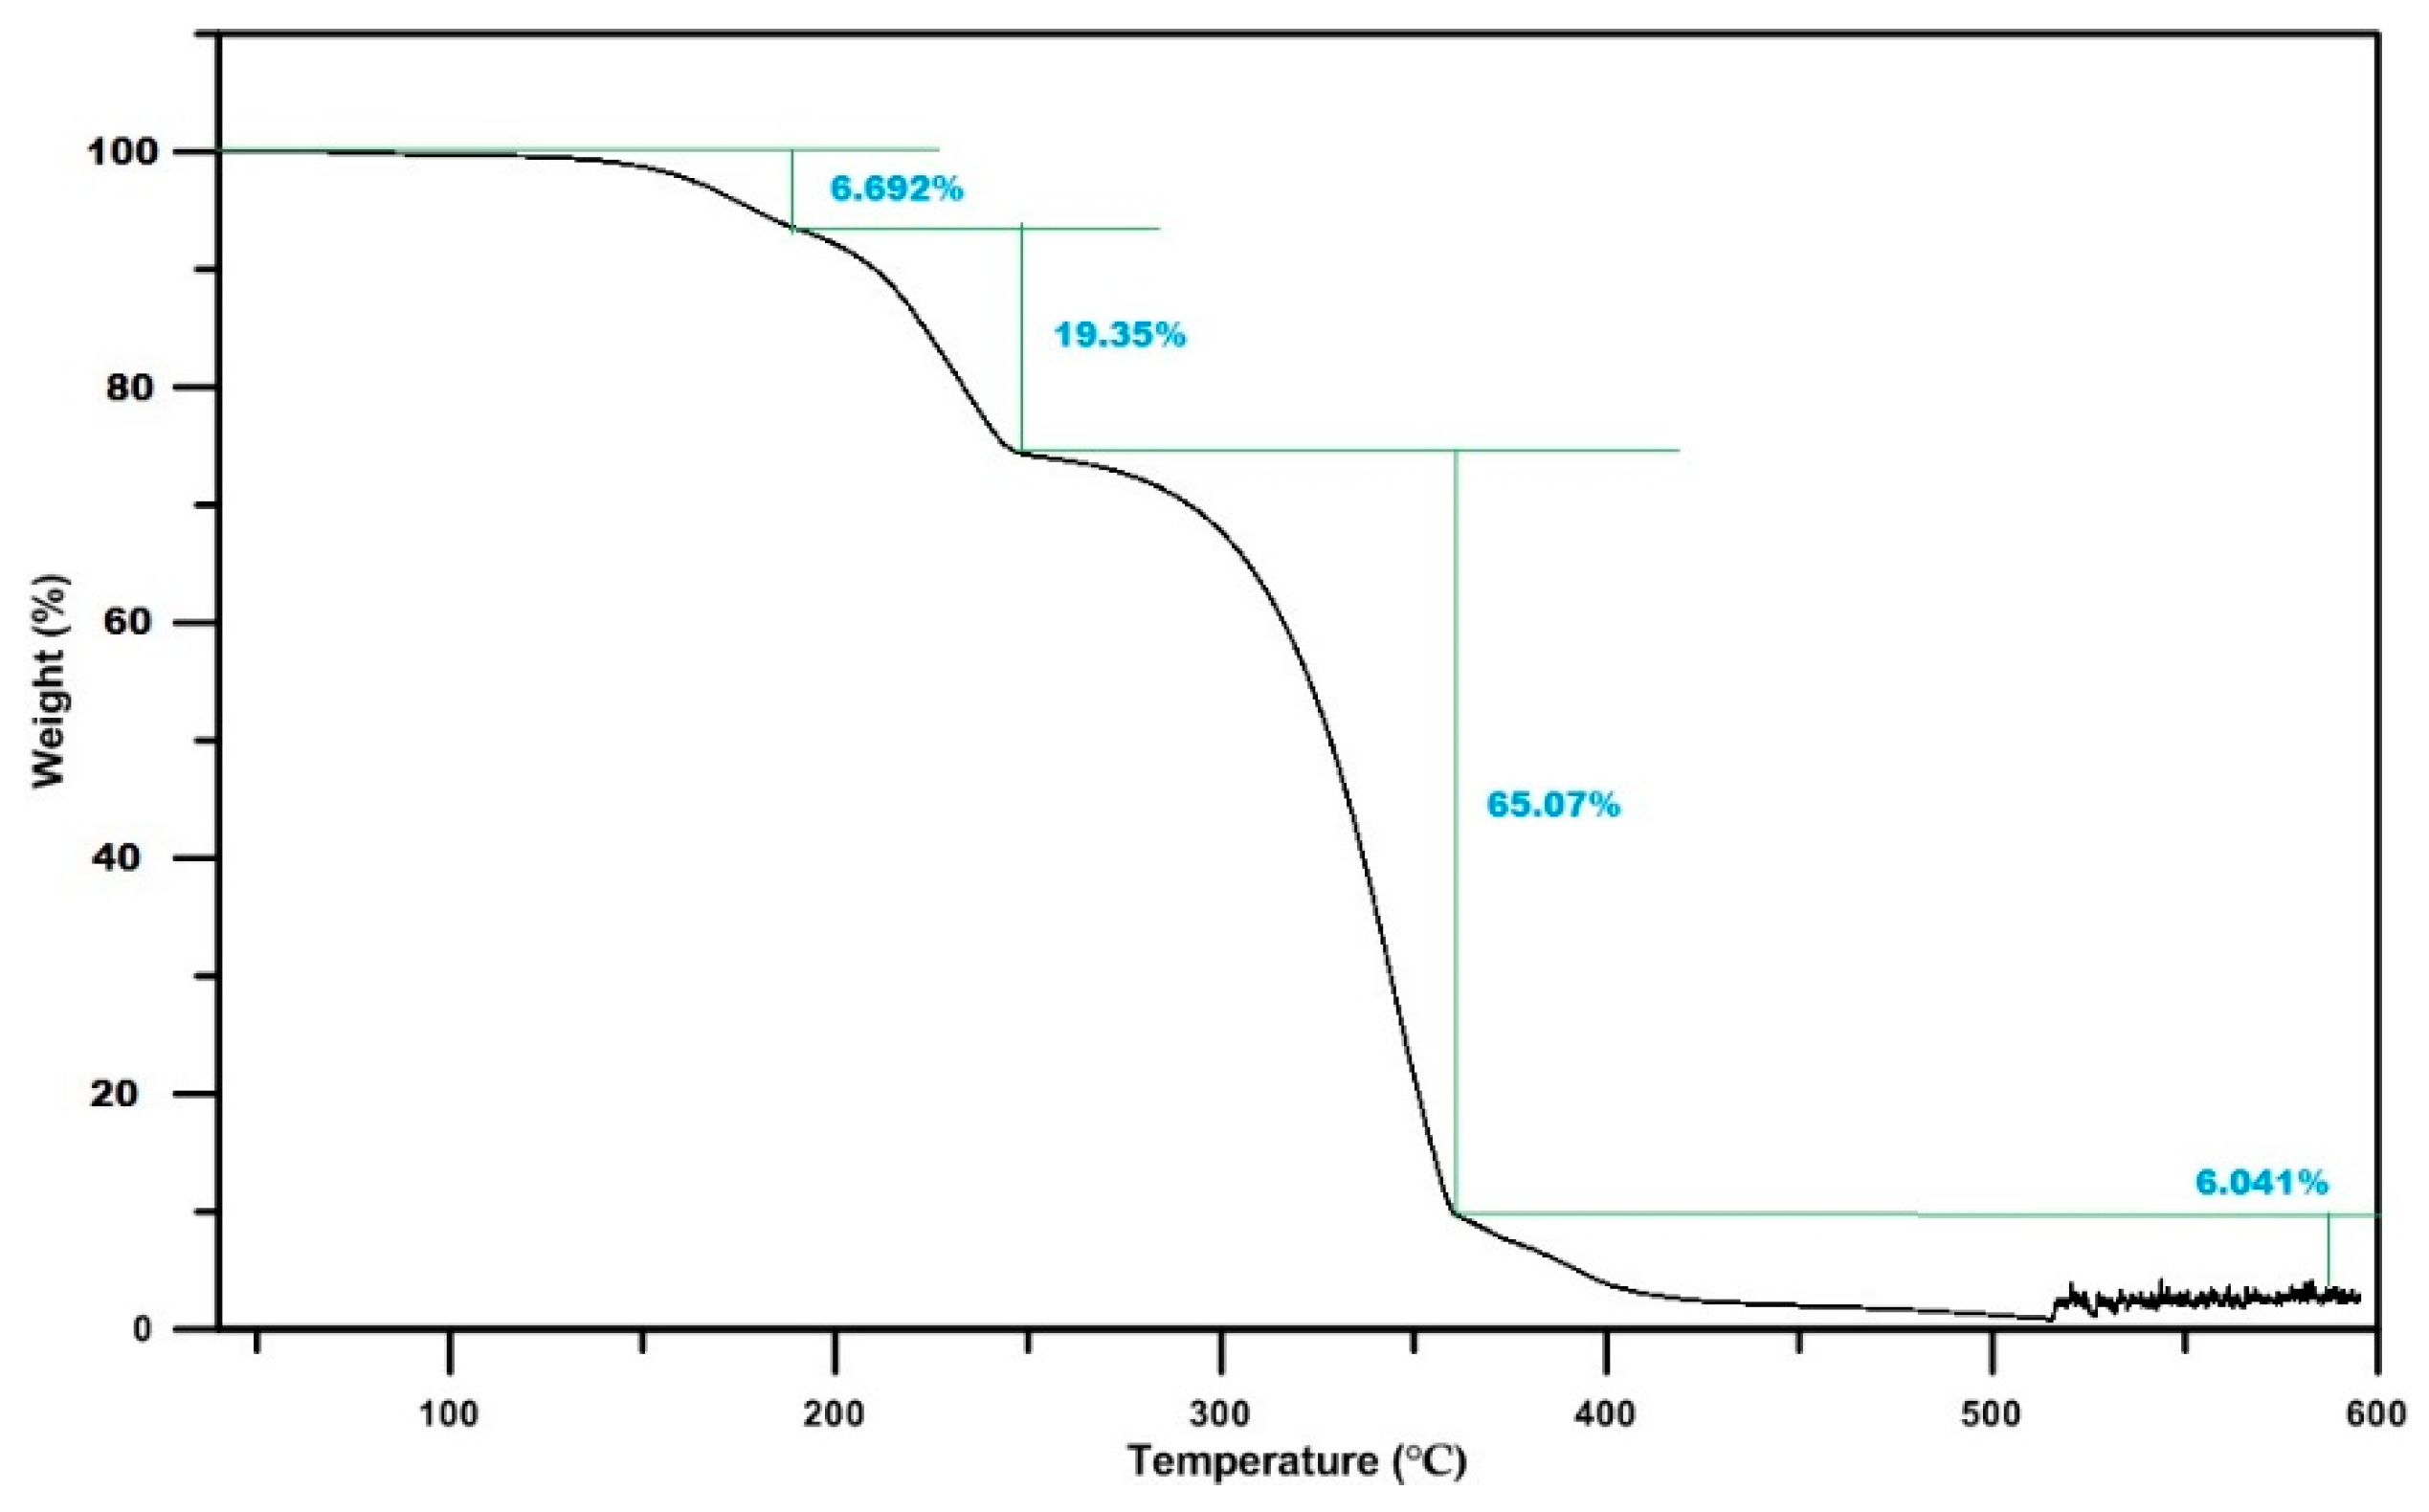
The TGA measurements showed that urea deposit products’ thermal decomposition occurred in multiple steps. The obtained urea deposit samples, representative of the different product compositions of the urea deposits at different operating temperatures, were thermally decomposed under a nitrogen atmosphere while heating from 313 K–873 K. Figure 15 shows the TGA measurement for the 423 K urea deposit sample. From the IR spectrum, it was found that this deposit sample contained undecomposed urea, which is the major percentage, biuret, and a small amount of cyanuric acid. The TGA measurement shows that the thermal decomposition completed in four steps. In the first step, a small amount (6.692%) of urea and biuret decomposed at 463 K, and more than 19.35% of the mass decomposed at 528 K. The majority of the mass decomposed from 533–638 K, which is analogous to the decomposition behavior of urea and cyanuric acid. Figure 16 shows the TGA measurement for the 573 K deposit sample, which contained ammeline, melamine, and a small amount of cyanuric acid. Around 40% of the mass decomposed until the 535 K temperature, and the majority of the mass percentage decomposed until the temperature of 638 K, which is analogous to the decomposition behavior of melamine. From the TGA measurements, it can be concluded that most of the urea deposits formed at different operating temperature conditions, usually decomposing around the 673 K temperature, which can be obtained in the exhaust system under standard engine operating conditions. In the current TGA measurement, a small amount of deposit (10–15 mg) was taken as the sample, which took about 10 minutes to decompose. However, in the real SCR system, the large-scale deposit formed cannot be thermally decomposed by the regular hot exhaust gas flow within this short time period. The thermal decomposition of the urea solid deposit strongly depends on the mass percentage.

5. Conclusions

A detailed investigation of UWS spray-wall impingement in the SCR system has been conducted in a closed vessel environment. First, the spray impingement was captured using the Z-type shadowgraph imaging technique and numerically by the STAR CCM+ CFD code. Then, the fluid film and solid deposit formation due to impingement were captured by high-speed imaging at a lower frame rate. Moreover, impingement spray cooling was assessed by infrared thermography. Finally, the solid deposit chemical composition was analyzed by FTIR, and thermal decomposition was measured by TGA analysis. The key conclusions and findings of the overall investigation can be summarized as follows:
  • Because of the droplet entrainment and evaporation, spray-wall impingement has significant effects on SCR performance. At a low temperature, droplets adhered on the wall increase wall wetting, which can maximize the deposit formation risk. On the other hand, at a high wall temperature, rebounding and thermal breakup occur, which increase the droplet evaporation. Rapid heat transfer between the droplets and wall surface causes enhanced urea decomposition, and a significant amount of gas is produced. As a result, a hot turbulence zone is formed by curl and bouncing, and the chance of wall wetting, as well as the risk of deposit formation reduced significantly.
  • The liquid film formed on the wall due to droplet spray-wall impingement and the accumulated film was further transported and distributed by the momentum of the subsequent injections. This liquid film is a urea-enriched solution, and solid deposits are generated in the film accumulation area.
  • The spray cooling first starts at the spray cone core region and then spreads radially to the periphery of the impingement region.
  • The chemical composition of the solid deposit samples obtained from FTIR analysis significantly varies depending on the decomposition temperature. The major compounds found at different temperatures are unreacted urea, biuret, cyanuric acid, ammeline, and melamine.
  • TGA measurements show that the majority of the solid deposits thermally decompose around the 673 K temperature. Though this temperature can be achieved by the regular exhaust temperature condition, complete thermal decomposition takes a long time period, and the decomposition rate strongly depends on the mass percentage.
The accumulated solid deposits on the exhaust pipe wall surface, mixing blade, and injector tip are hard to remove completely. A high wall temperature can significantly reduce the film formation and urea crystallization.

Author Contributions

G.M.H.S. and O.T.L. developed the idea and method. G.M.H.S. designed the numerical and experimental setup and organized the entire numerical and experimental process. He also wrote the paper, while O.T.L. supervised throughout the process.

Funding

This research was funded by the Global-Top Project of Korea Ministry of Environment, grant number 2016001420002, Title: Development of the PM·NOx purifying system and the core technology.

Acknowledgments

The authors gratefully acknowledge the Research Institute of Materials Science, University of Ulsan for the help during FTIR and TGA analysis.

Conflicts of Interest

The authors declare no conflict of interest.

References

  1. Tartakovsky, L.; Mosyak, A.; Zvirin, Y. Energy analysis of ethanol steam reforming for hybrid electric vehicle. Int. J. Energy Res. 2013, 37, 259–267. [Google Scholar] [CrossRef]
  2. Lee, H.; Ha, T.; Choi, H. Experimental verification of optimized NOX reduction strategies in a decrepit Euro-3 diesel engine retrofitted with a cooled EGR system. J. Mech. Sci. Technol. 2016, 30, 2873–2880. [Google Scholar] [CrossRef]
  3. Datta, A.; Mandal, B.K. Numerical investigation of the performance and emission parameters of a diesel engine fuelled with diesel-biodiesel-methanol blends. J. Mech. Sci. Technol. 2016, 30, 1923–1929. [Google Scholar] [CrossRef]
  4. Grout, S.; Blaisot, J.-B.; Pajot, K.; Osbat, G. Experimental investigation on the injection of an urea–water solution in hot air stream for the SCR application: Evaporation and spray/wall interaction. Fuel 2013, 106, 166–177. [Google Scholar] [CrossRef]
  5. Johnson, T.V. Vehicular emissions in review. SAE Int. J. Engines 2012, 5, 216–234. [Google Scholar] [CrossRef]
  6. Fritz, A.; Pitchon, V. The current state of research on automotive lean NOx catalysis. Appl. Catal. B 1997, 13, 1–25. [Google Scholar] [CrossRef]
  7. Birkhold, F.; Meingast, U.; Wassermann, P.; Deutschmann, O. Analysis of the Injection of Urea-Water-Solution for Automotive SCR DeNOx-Systems: Modeling of Two-Phase Flow and Spray/Wall-Interaction; SAE Technical Paper; SAE International: Warrendale, PA, USA, 2006. [Google Scholar]
  8. Yim, S.D.; Kim, S.J.; Baik, J.H.; Nam, I.-S.; Mok, Y.S.; Lee, J.-H.; Cho, B.K.; Oh, S.H. Decomposition of Urea into NH3 for the SCR Process. Ind. Eng. Chem. Res. 2004, 43, 4856–4863. [Google Scholar] [CrossRef]
  9. Kleemann, M.; Elsener, M.; Koebel, M.; Wokaun, A. Hydrolysis of isocyanic acid on SCR catalysts. Ind. Eng. Chem. Res. 2000, 39, 4120–4126. [Google Scholar] [CrossRef]
  10. Koebel, M.; Strutz, E.O. Thermal and hydrolytic decomposition of urea for automotive selective catalytic reduction systems: thermochemical and practical aspects. Ind. Eng. Chem. Res. 2003, 42, 2093–2100. [Google Scholar] [CrossRef]
  11. Sluder, C.S.; Storey, J.M.E.; Lewis, S.A.; Lewis, L.A. Low Temperature Urea Decomposition and SCR Performance; SAE Technical Paper; SAE International: Warrendale, PA, USA, 2005. [Google Scholar]
  12. Strots, V.O.; Santhanam, S.; Adelman, B.J.; Griffin, G.A.; Derybowski, E.M. Deposit formation in urea-SCR systems. SAE Int. J. Fuels Lubr. 2010, 2, 283–289. [Google Scholar] [CrossRef]
  13. Munnannur, A.; Chiruta, M.; Liu, Z.G. Thermal and Fluid Dynamic Considerations in Aftertreatment System Design for SCR Solid Deposit Mitigation; SAE Technical Paper; SAE International: Warrendale, PA, USA, 2012. [Google Scholar]
  14. Spiteri, A.; Eggenschwiler, P.D.; Liao, Y.; Wigley, G.; Michalow-Mauke, K.A.; Elsener, M.; Kröcher, O.; Boulouchos, K. Comparative analysis on the performance of pressure and air-assisted urea injection for selective catalytic reduction of NOx. Fuel 2015, 161, 269–277. [Google Scholar] [CrossRef]
  15. Birkhold, F.; Meingast, U.; Wassermann, P.; Deutschmann, O. Modeling and simulation of the injection of urea-water-solution for automotive SCR DeNOx-systems. Appl. Catal. B 2007, 70, 119–127. [Google Scholar] [CrossRef]
  16. Sebelius, S.; Le, T.T.; Pettersson, L.J.; Lind, H. Identification of urea decomposition from an SCR perspective; A combination of experimental work and molecular modeling. Chem. Eng. J. 2013, 231, 220–226. [Google Scholar] [CrossRef]
  17. Schaber, P.M.; Colson, J.; Higgins, S.; Thielen, D.; Anspach, B.; Brauer, J. Thermal decomposition (pyrolysis) of urea in an open reaction vessel. Thermochim. Acta 2004, 424, 131–142. [Google Scholar] [CrossRef]
  18. Eichelbaum, M.; Farrauto, R.J.; Castaldi, M.J. The impact of urea on the performance of metal exchanged zeolites for the selective catalytic reduction of NOx: Part I. Pyrolysis and hydrolysis of urea over zeolite catalysts. Appl. Catal. B 2010, 97, 90–97. [Google Scholar] [CrossRef]
  19. Shahariar, G.M.H.; Wardana, M.K.A.; Lim, O.T. Investigation of urea-water solution spray impingement on the hot surface of automotive SCR system. J. Mech. Sci. Technol. 2018, 32, 2935–2946. [Google Scholar] [CrossRef]
  20. Zheng, G.; Fila, A.; Kotrba, A.; Floyd, R. Investigation of Urea Deposits in Urea SCR Systems for Medium and Heavy Duty Trucks; SAE Technical Paper; SAE International: Warrendale, PA, USA, 2010. [Google Scholar]
  21. Weeks, C.L.; Ibeling, D.R.; Han, S.; Ludwig, L.; Ayyappan, P. Analytical investigation of urea deposits in SCR system. SAE Int. J. Engines 2015, 8, 1219–1239. [Google Scholar] [CrossRef]
  22. Fang, H.L.; DaCosta, H.F.M. Urea thermolysis and NOx reduction with and without SCR catalysts. Appl. Catal. B 2003, 46, 17–34. [Google Scholar] [CrossRef]
  23. Lundström, A.; Andersson, B.; Olsson, L. Urea thermolysis studied under flow reactor conditions using DSC and FT-IR. Chem. Eng. J. 2009, 150, 544–550. [Google Scholar] [CrossRef]
  24. Dong, H.; Shuai, S.; Wang, J. Effect of Urea Thermal Decomposition on Diesel NOx-SCR Aftertreatment Systems; SAE Technical Paper; SAE International: Warrendale, PA, USA, 2008. [Google Scholar]
  25. Jeong, S.-J.; Lee, S.-J.; Kim, W.-S. Numerical study on the optimum injection of urea–water solution for SCR DeNOx system of a heavy-duty diesel engine to improve DeNOx performance and reduce NH3 slip. Environ. Eng. Sci. 2008, 25, 1017–1036. [Google Scholar] [CrossRef]
  26. de Risi, A.; Donateo, T.; Sciolti, A.; Calò, M.; Gaballo, M.R. A New Energy-Based Model for the Prediction of Primary Atomization of Urea-Water Sprays; SAE Technical Paper; SAE International: Warrendale, PA, USA, 2009. [Google Scholar]
  27. Shahariar, G.M.H.; Lim, O.T. Investigation of urea aqueous solution injection, droplet breakup and urea decomposition of selective catalytic reduction systems. J. Mech. Sci. Technol. 2018, 32, 3473–3481. [Google Scholar] [CrossRef]
  28. Spiteri, A.; Dimopoulos Eggenschwiler, P. Experimental Fluid Dynamic Investigation of Urea–Water Sprays for Diesel Selective Catalytic Reduction–DeNOx Applications. Ind. Eng. Chem. Res. 2014, 53, 3047–3055. [Google Scholar] [CrossRef]
  29. Oh, J.; Lee, K. Spray characteristics of a urea solution injector and optimal mixer location to improve droplet uniformity and NOx conversion efficiency for selective catalytic reduction. Fuel 2014, 119, 90–97. [Google Scholar] [CrossRef]
  30. Shi, X.; Deng, J.; Wu, Z.; Li, L. Effect of injection parameters on spray characteristics of urea-SCR system. SAE Int. J. Engines 2013, 6, 873–881. [Google Scholar] [CrossRef]
  31. Musa, S.N.A.; Saito, M.; Furuhata, T.; Arai, M. Evaporation characteristics of a single aqueous urea solution droplet. In Proceedings of the ICLASS-2006, Kyoto, Japan, 27 August–1 September 2006. Paper ID ICLASS06-195. [Google Scholar]
  32. Wang, T.J.; Baek, S.W.; Lee, S.Y.; Kang, D.H.; Yeo, G.K. Experimental investigation on evaporation of urea-water-solution droplet for SCR applications. AIChE J. 2009, 55, 3267–3276. [Google Scholar] [CrossRef]
  33. Wang, Z.; Ding, H.; Ma, X.; Xu, H.; Wyszynski, M.L. Ultra-high speed imaging study of the diesel spray close to the injector tip at the initial opening stage with single injection. Appl. Energy 2016, 165, 335–344. [Google Scholar] [CrossRef]
  34. Das, S.K.; Kim, K.; Lim, O. Experimental study on non-vaporizing spray characteristics of biodiesel-blended gasoline fuel in a constant volume chamber. Fuel Process. Technol. 2018, 178, 322–335. [Google Scholar] [CrossRef]
  35. Li, B.Q.; Cader, T.; Schwarzkopf, J.; Okamoto, K.; Ramaprian, B. Spray angle effect during spray cooling of microelectronics: experimental measurements and comparison with inverse calculations. Appl. Therm. Eng. 2006, 26, 1788–1795. [Google Scholar] [CrossRef]
  36. Abu-Ramadan, E.; Saha, K.; Li, X. Numerical Modeling of the Impingement Process of Urea-Water Solution Spray on the Heated Walls of SCR Systems; SAE Technical Paper; SAE International: Warrendale, PA, USA, 2012. [Google Scholar]
  37. Birkhold, F. Selektive katalytische Reduktion von Stickoxiden in Kraftfahrzeugen: Untersuchung der Einspritzung von Harnstoffwasserlösung; Shaker: Aachen, Germany, 2007. [Google Scholar]
  38. Senecal, P.K.; Pomraning, E.; Richards, K.J.; Som, S. An investigation of Grid Convergence for Spray Simulations Using an LES Turbulence Model; SAE Technical Paper; SAE International: Warrendale, PA, USA, 2013. [Google Scholar]
  39. Drennan, S.; Kumar, G.; Quan, S.; Wang, M. Application of Automatic Meshing to Urea-Water Injection Simulation for Engine Aftertreatment; SAE Technical Paper; SAE International: Warrendale, PA, USA, 2015. [Google Scholar]
  40. Bai, C.; Gosman, A.D. Development of Methodology for Spray Impingement Simulation; SAE Technical Paper; SAE International: Warrendale, PA, USA, 1995. [Google Scholar]
  41. Bai, C.X.; Rusche, H.; Gosman, A.D. Modeling of gasoline spray impingement. Atomization Sprays 2002, 12, 1–28. [Google Scholar] [CrossRef]
  42. Kuhnke, D. Spray/Wall Interaction Modelling by Dimensionless Data Analysis; Shaker: Aachen, Germany, 2004. [Google Scholar]
  43. Dan, H.J.; Lee, J.S. Modeling and measurement of boiling point elevation during water vaporization from aqueous urea for SCR applications. J. Mech. Sci. Technol. 2016, 30, 1443–1448. [Google Scholar] [CrossRef]
  44. Smith, H.; Lauer, T.; Mayer, M.; Pierson, S. Optical and numerical investigations on the mechanisms of deposit formation in SCR systems. SAE Int. J. Fuels Lubr. 2014, 7, 525–542. [Google Scholar] [CrossRef]
  45. Fischer, S.; Bitto, R.; Lauer, T.; Krenn, C.; Tauer, J.; Pessl, G. Impact of the Turbulence Model and Numerical Approach on the Prediction of the Ammonia Homogenization in an Automotive SCR System. SAE Int. J. Engines 2012, 5, 1443–1458. [Google Scholar] [CrossRef]
  46. Li, Z.; Deng, J.; Li, L.; Cao, L.; Wu, Z. A Study on the Factors Affecting Heated Wall Impinging Characteristics of SCR Spray; SAE Technical Paper; SAE International: Warrendale, PA, USA, 2011. [Google Scholar]
  47. Shahariar, G.M.H.; Wardana, M.K.A.; Lim, O.T. A study on post impingement effects of urea-water solution spray on the heated wall of automotive SCR systems. IOP Conf. Ser. Earth Environ. Sci. 2018, 133, 12025. [Google Scholar] [CrossRef]
  48. Gaynor, P.D.; Reid, B.A.; Hargrave, G.K.; Lockyer, T.O.; Wilson, J. An experimental investigation into DEF dosing strategies for heavy duty vehicle applications. SAE Int. J. Engines 2015, 8, 1196–1206. [Google Scholar] [CrossRef]
  49. Crowe, C.T.; Schwarzkopf, J.D.; Sommerfeld, M.; Tsuji, Y. Multiphase Flows With Droplets and Particles; CRC Press: Boca Raton, FL, USA, 2011. [Google Scholar]
  50. Bernardin, J.D.; Mudawar, I. The Leidenfrost point: experimental study and assessment of existing models. J. Heat Transfer 1999, 121, 894–903. [Google Scholar] [CrossRef]
  51. Dunand, P.; Castanet, G.; Gradeck, M.; Maillet, D.; Lemoine, F. Energy balance of droplets impinging onto a wall heated above the Leidenfrost temperature. Int. J. Heat Fluid Flow 2013, 44, 170–180. [Google Scholar] [CrossRef] [Green Version]
  52. Liao, Y.; Eggenschwiler, P.D.; Rentsch, D.; Curto, F.; Boulouchos, K. Characterization of the urea-water spray impingement in diesel selective catalytic reduction systems. Appl. Energy 2017, 205, 964–975. [Google Scholar] [CrossRef]
Figure 1. Overall process (spray to deposit creation) in the SCR system.
Energies 12 00125 g001
Figure 2. (a) The schematic diagram of the UWS spray-wall impingement experimental setup; (b) the pictorial layout of the injector and the impingement wall temperature control unit inside the optical chamber.
Energies 12 00125 g002
Figure 3. (a) The schematic diagram of the optical setup; (b) the definition of the spray impingement parameters.
Energies 12 00125 g003
Figure 4. Comparison of experimental and simulated UWS spray wall impingement.
Energies 12 00125 g004
Figure 5. Comparison of the experimental and numerical spray-wall impingement of UWS: (a) at Tw = 313 K; (b) at Tw = 573 K.
Energies 12 00125 g005
Figure 6. Comparison between the experimental and numerical measurement of radial and axial distance after impingement: (a) at Tw = 313 K; (b) at Tw = 573 K.
Energies 12 00125 g006
Figure 7. (a) Comparison between the experimental and numerical measurement of the spray projection area after impingement, at Tw = 313 and 573 K.; (b) comparison between the experimental and simulation measurement of the spray penetration length, at Tw = 313 and 573 K.
Energies 12 00125 g007
Figure 8. (a) Wall film formation phenomena: (i) ASOI, (ii) ASOI + 1 s, (iii) ASOI + 2 s, (iv) ASOI + 4 s; (b) wall film area development.
Energies 12 00125 g008
Figure 9. (a) Solid deposit formation: (i) after the end of injection (AEOI), (ii) AEOI + 12 s, (iii) AEOI + 27 s, (iv) AEOI + 40 s; (b) evolution of the solid deposit.
Energies 12 00125 g009
Figure 10. The temperature map of the impingement wall (a) before SOI, (b) after the first injection event, (c) after the second injection event, (d) after the third injection event, (e) AEOI + 5s, (f) AEOI + 7s.
Energies 12 00125 g010
Figure 11. The solid deposit formed during the experiment at different conditions: (a) on the injector tip; (b) on the impingement wall.
Energies 12 00125 g011
Figure 12. IR spectra of the reference compounds [21].
Energies 12 00125 g012
Figure 13. IR spectra of deposit samples produced from urea decomposition products at 423 K.
Energies 12 00125 g013
Figure 14. IR spectra of deposit samples produced from urea decomposition products at 573 K.
Energies 12 00125 g014
Figure 15. TGA trace for the decomposition of the urea deposit sample prepared at 423 K.
Energies 12 00125 g015
Figure 16. TGA trace for the decomposition of the urea deposit sample prepared at 573 K.
Energies 12 00125 g016
Table 1. Camera configuration for the high-speed imaging.
ParameterValueUnit
Frame rate7500fps
Resolution512 × 512Pixels
Aperturef/2.8-
Shutter speed1/300,000Seconds
Table 2. Experimental conditions and parameters.
ParameterValue
Working fluidUWS (32.5% urea by weight)
Injection duration, ting10, 30, 60 ms
Injection pressure, Ping5 bar
Injection rate, Ring40,824 kg/h
Nozzle diameter, d0.12 mm
Number of nozzle holes, n3
Injection height, h30 mm