Article

Numerical Analysis on the Effect of the Tunnel Slope on the Plug-Holing Phenomena

School of Mechanical Engineering, Chung-Ang University, Seoul 06974, Korea
*
Author to whom correspondence should be addressed.
Energies 2019, 12(1), 59; https://doi.org/10.3390/en12010059
Submission received: 30 November 2018 / Revised: 18 December 2018 / Accepted: 21 December 2018 / Published: 25 December 2018
(This article belongs to the Special Issue Engineering Fluid Dynamics 2018)

Abstract

:
Preventing the plug-holing phenomena of a natural ventilation system in a shallow underground tunnel is important for improving the ventilation performance, and the tunnel slope has a significant influence on the smoke flow. In this study, the effect of the tunnel slope on plug-holing in a shallow underground tunnel was analyzed by numerical method. The tunnel slope was increased by 0–8 degrees and the fire source was assumed to be 5 MW, which is equivalent to one sedan vehicle. As a result, the possibility of plug-holing decreased as the tunnel slope increased. However, when the tunnel slope is more than 4°, the fresh air from the entrance of the tunnel and smoke are diluted before reaching the shaft, so the flow temperature passing through the shaft is lowered, and the ventilation performance begins to decrease. In particular, plug-holing does not occur at the tunnel slopes of 6 and 8°, but the ventilation performance is expected to decrease because the temperature of the smoke discharged to the shaft is much lower than the general smoke temperature. Therefore, it is necessary to design the natural ventilation system considering the influence of the tunnel slope.

1. Introduction

Statistics and reports by NFPA (National Fire Protection Association in USA) have shown that smoke inhalation is a major fatal factor in fire accidents [1]. Therefore, it is very important to ensure the good operation of the smoke ventilation system to reduce human casualties.
Generally, the vertical natural ventilation system is widely used in the shallow road tunnel due to low installation and maintenance costs [2]. In order to design an accurate vertical natural ventilation system, it is necessary to understand the tunnel fire phenomena in order to effectively exhaust the smoke, which is generated by the fire.
The plug-holing phenomena is one of the important factors to vertical natural ventilation systems. The plug holing phenomena is defined as: The fresh air beneath the smoke layer is exhausted through the shaft with smoke. Therefore, understanding the plug-holing phenomena, and preventing the plug-holing phenomena, is an important factor in improving the performance of the natural exhaust system.
Some researchers have shown that the horizontal momentum force of the ceiling jet and the buoyancy force of the vertical shaft play an important role in the plug-holing phenomena, and suggests the criterion is the modified Froude number for the effective ventilation system design without plug-holing. Hinkley et al. [3] introduced the plug-holing phenomena and presented a modified Froude number, which is defined as the ratio of the momentum force of the smoke to the buoyancy force in the shaft and the height of the tunnel. J. Ji et al. [4] analyzed the effect of the heat release rate on plug-holing, and proposed a modified Richardson number as the criterion for plug-holing. Additionally, J. Ji et al. [5] shows the influence of the cross-section area and aspect ratio of the shaft. D. Baek et al. [6,7] presented, through numerical analysis, a modified Froude number with the effect of the hydraulic diameter and tunnel aspect ratio on the plug-holing phenomena.
As reported in previous studies, the effect of geometry is an important factor affecting the ventilation performance of the vertical natural ventilation system. Particularly, it is known that the slope of the tunnel greatly affects the buoyancy force of the smoke flow, the critical velocity, and the back layering length [8,9,10].
Therefore, the slope of the tunnel relates to the plug-holing phenomena, which reduces the ventilation performance in the vertical natural ventilation system. However, the effect of the tunnel slope on the plug-holing phenomena has not been clearly understood yet.
Therefore, in this study, a numerical study was carried out to analyze the effect of the tunnel slope on the plug-holing phenomena in a shallow underground tunnel.

2. Numerical Details

2.1. Geometry and Boundary Conditions

Figure 1 presents the geometry of the tunnel for analyzing the plug-holing phenomena according to the tunnel slope. Generally, the tunnel slope of the shallow underground tunnel is constructed less than 8 degrees below the urban center to relieve traffic congestion in urban areas. In the shallow underground tunnel, the vertical shaft vents are installed at intervals of about 100 to 180 m [9].
Therefore, in this study, five tunnel slopes were selected at 0, 2, 4, 6, and 8 degrees. The tunnel is assumed to be a two-lane tunnel, and the width of the tunnel was set to 10 m and the height of the tunnel to 6 m. In addition, the length of the tunnel was set to be installed at intervals of 140 m with repeated shafts. The center of the vertical shaft was located at a distance of 58 m from the entrance of the tunnel, as shown in Figure 1d. The width and depth of the vertical shaft were 3.2 and 2 m, respectively, and the height was 3 m. The walls of the tunnels were assumed to be adiabatic, and zero-gauge pressure was applied to the atmospheric conditions at the exit of both ends of the tunnel and the outlet of the vertical shaft, as shown in Figure 1a,b,d, respectively. The fire source in tunnels is assumed to occur in passenger cars. According to previous studies, the maximum heat release rate (HRR) is known to be about 3–5 MW [11,12]. Thus, in this study the fire source was located at y = 0, as shown in Figure 1a and the maximum HRR was set to 5 MW. The size of the fire was x = 1.2 m, y = 1.2 m, and z = 1 m, and heat release rate applied to the surface was z = 1 m.

2.2. Numerical Methods

The fire dynamics simulator (FDS), developed by the National Institute of Standards and Technology (NIST), was used to analyze the fire-driven fluid flow. NIST performed the verification and validation of the models used in the FDS, and provided validated values such as turbulent Prandtl number, turbulent Schmidt number, convective heat transfer coefficient, and radiation fraction from fire source.
FDS solves the low Mach number Navier—Stokes equation (Ma < 0.3). The large eddy simulation (LES) model was used to calculate turbulence for the fire driven flow. The Deardorff model was used for turbulent viscous model [5]. The gray gas model was used to analyze the radiative heat transfer. Radiation fraction of fire was set to 0.35 and gravity was applied to 9.81 m/s in the −z direction. The atmospheric temperature was set at 25 ℃. The grid for numerical analysis was generated at 0.2 m, by grid independency test between 0.1 and 0.4 m in grid size, based on equation (1), which was recommended in the FDS user guide. Where D * is grid size, Q ˙ is heat release rate, ρ is ambient density, c P is heat capacity of the inflow at constant pressure, T is ambient temperature, and g is gravity.
Also, near the fire source and the shaft, the grid size was formed at 0.1 m to improve the accuracy of the numerical analysis.
D * = ( Q ˙ ρ c P T g ) 2 5

3. Results and Discussion

Figure 2 shows the temperature contour at x = 0 for the average value about 20 s after the flow due to the quasi-steady state. The tunnel slope was 0 degrees, the high-temperature combustion products generated from the fire source formed a smoke layer along the tunnel ceiling. The smoke layer was formed with a similar temperature field in both directions of the tunnel. The slope of the tunnel was 2 degrees, the flow of the smoke layer was relatively shifted toward the +y direction of the tunnel. Moreover, the tunnel slope was 4 degrees or more, and the flow of the smoke layer formed toward the entrance of the tunnel with a back layering of about 2 m.
Also, the slope of the tunnel was 0 degrees, fresh air flowed in both directions of the tunnel, and a flow field of about 25 °C was formed below the smoke layer. The angle of the tunnel angle was 2 degrees, the temperature of the flow from the fire source to the shaft was about 45 °C near the tunnel floor, as shown in the Figure 2b. The temperature field of 0 and 2 degrees were deeply related with the flow field. The slope of the tunnel was 0 degrees, the flow of the high temperature smoke products spread in both directions from the fire source, and the fresh air flow below the smoke layer was formed from both tunnel ends to the fire source. However, as shown in the Figure 3b, the slope of the tunnel was 2 degrees, and only the flow was formed in the +y direction from the fire source, with some very low velocity flows. Thus, the low velocity flow increased the temperature of the flow near the tunnel bottom.
In addition, as shown in the Figure 2c–e, when the slope of the tunnel was more than 4 degrees, it can be seen that the temperature below the smoke layer was about 30 °C or more, which was higher than the fresh air by more than 5 °C.
As shown in the Figure 3c–e, the flow velocity near the bottom of the tunnel was relatively higher, from the tunnel slope of 4 degrees. Because, the fresh air flow into from the −y direction was heated by the fire source and flows only in the +y direction by buoyancy.
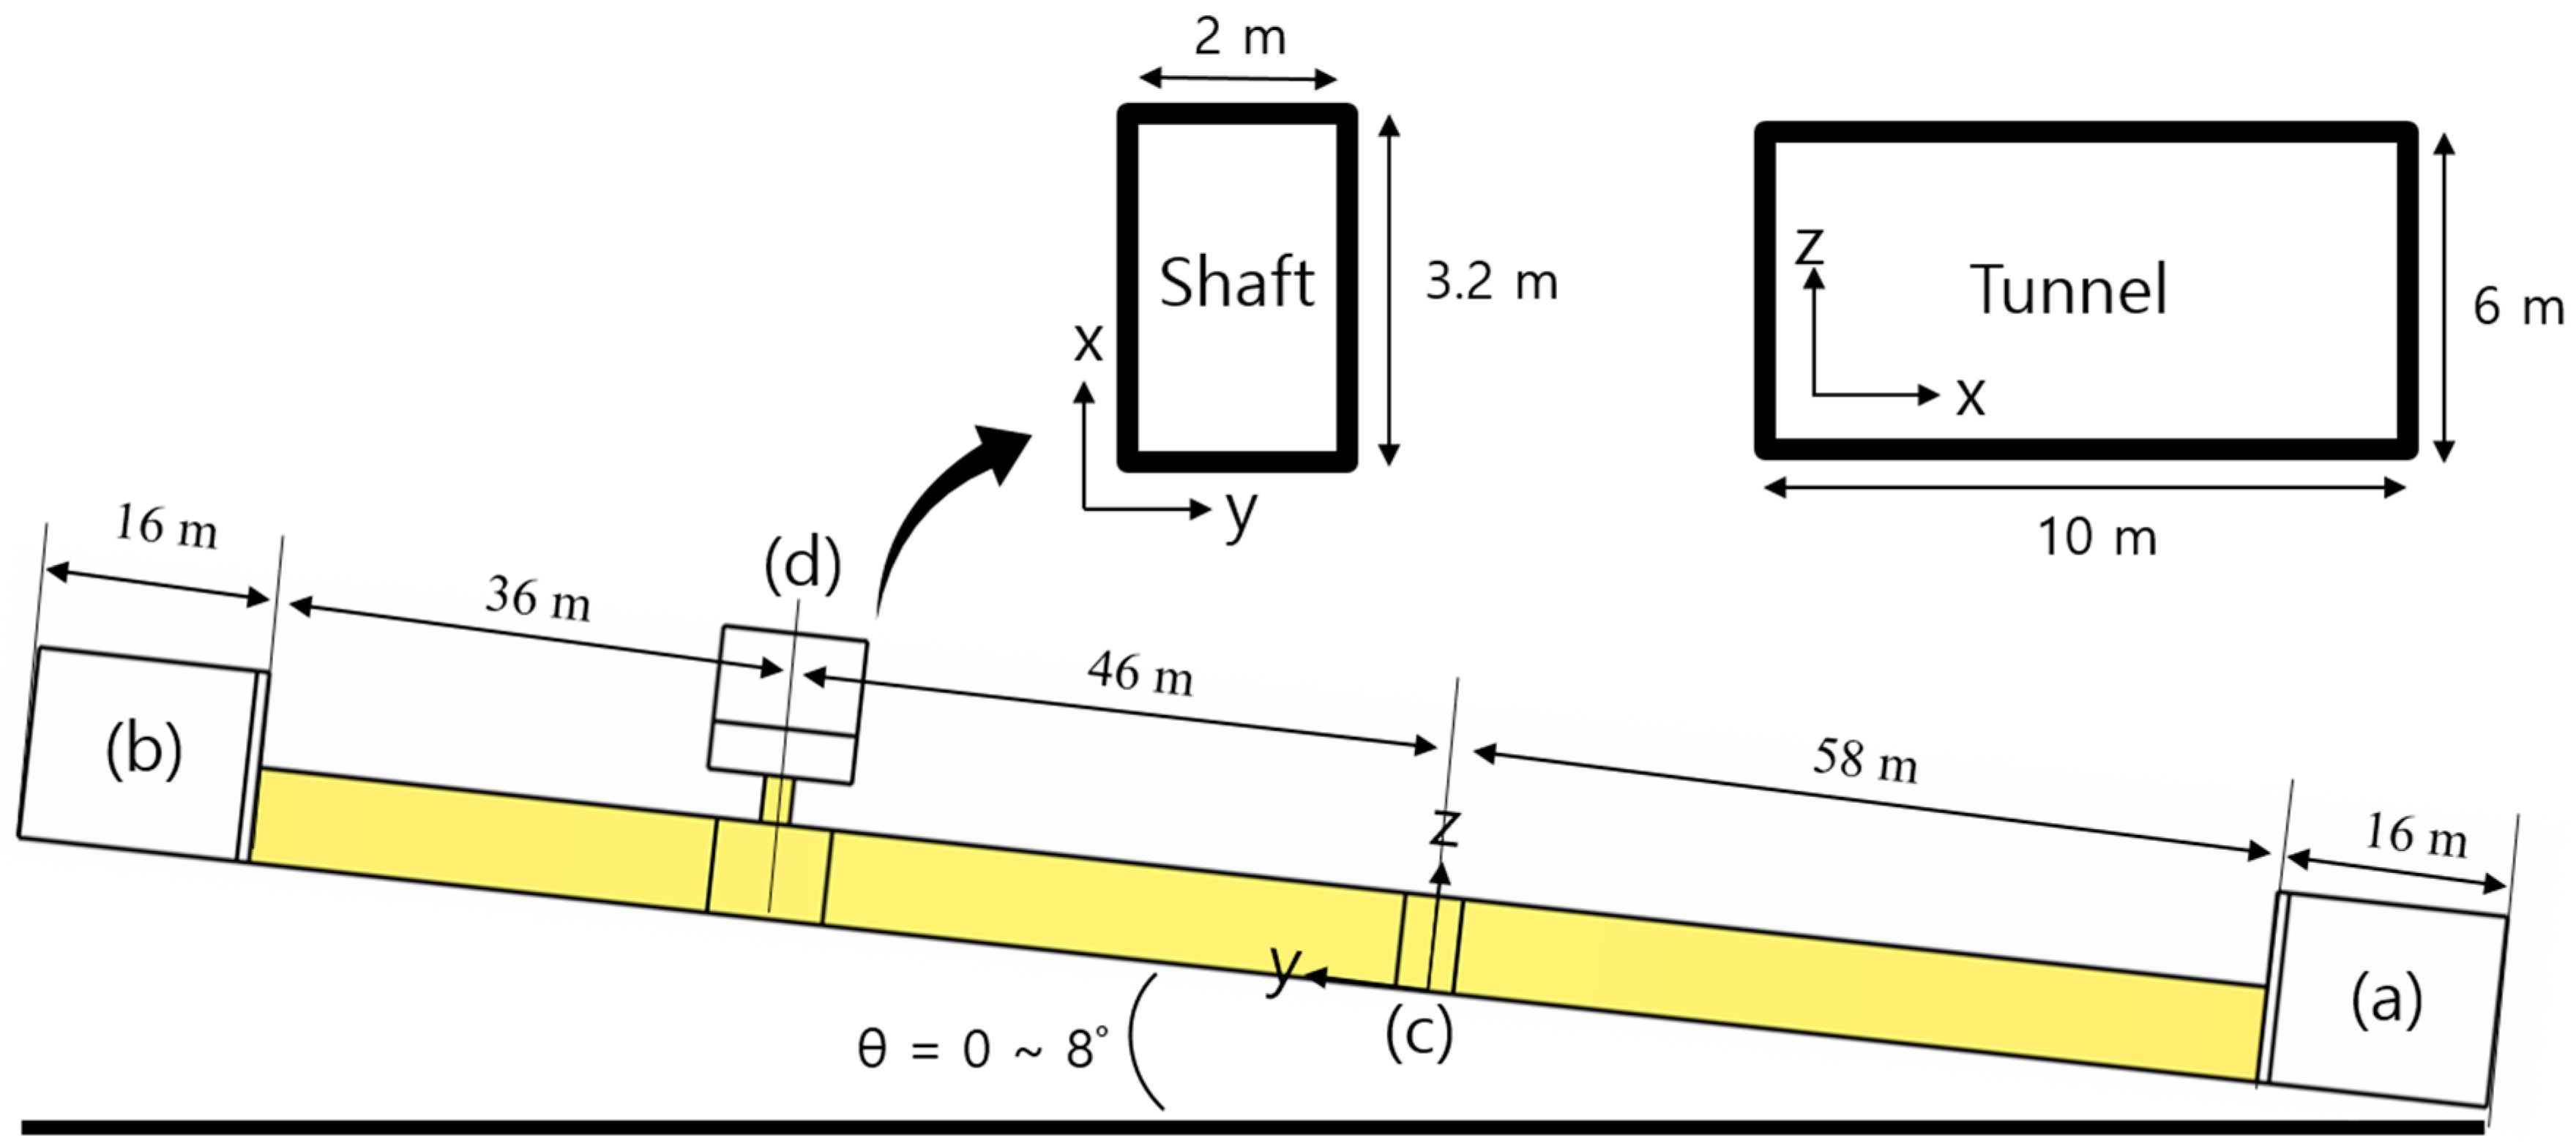
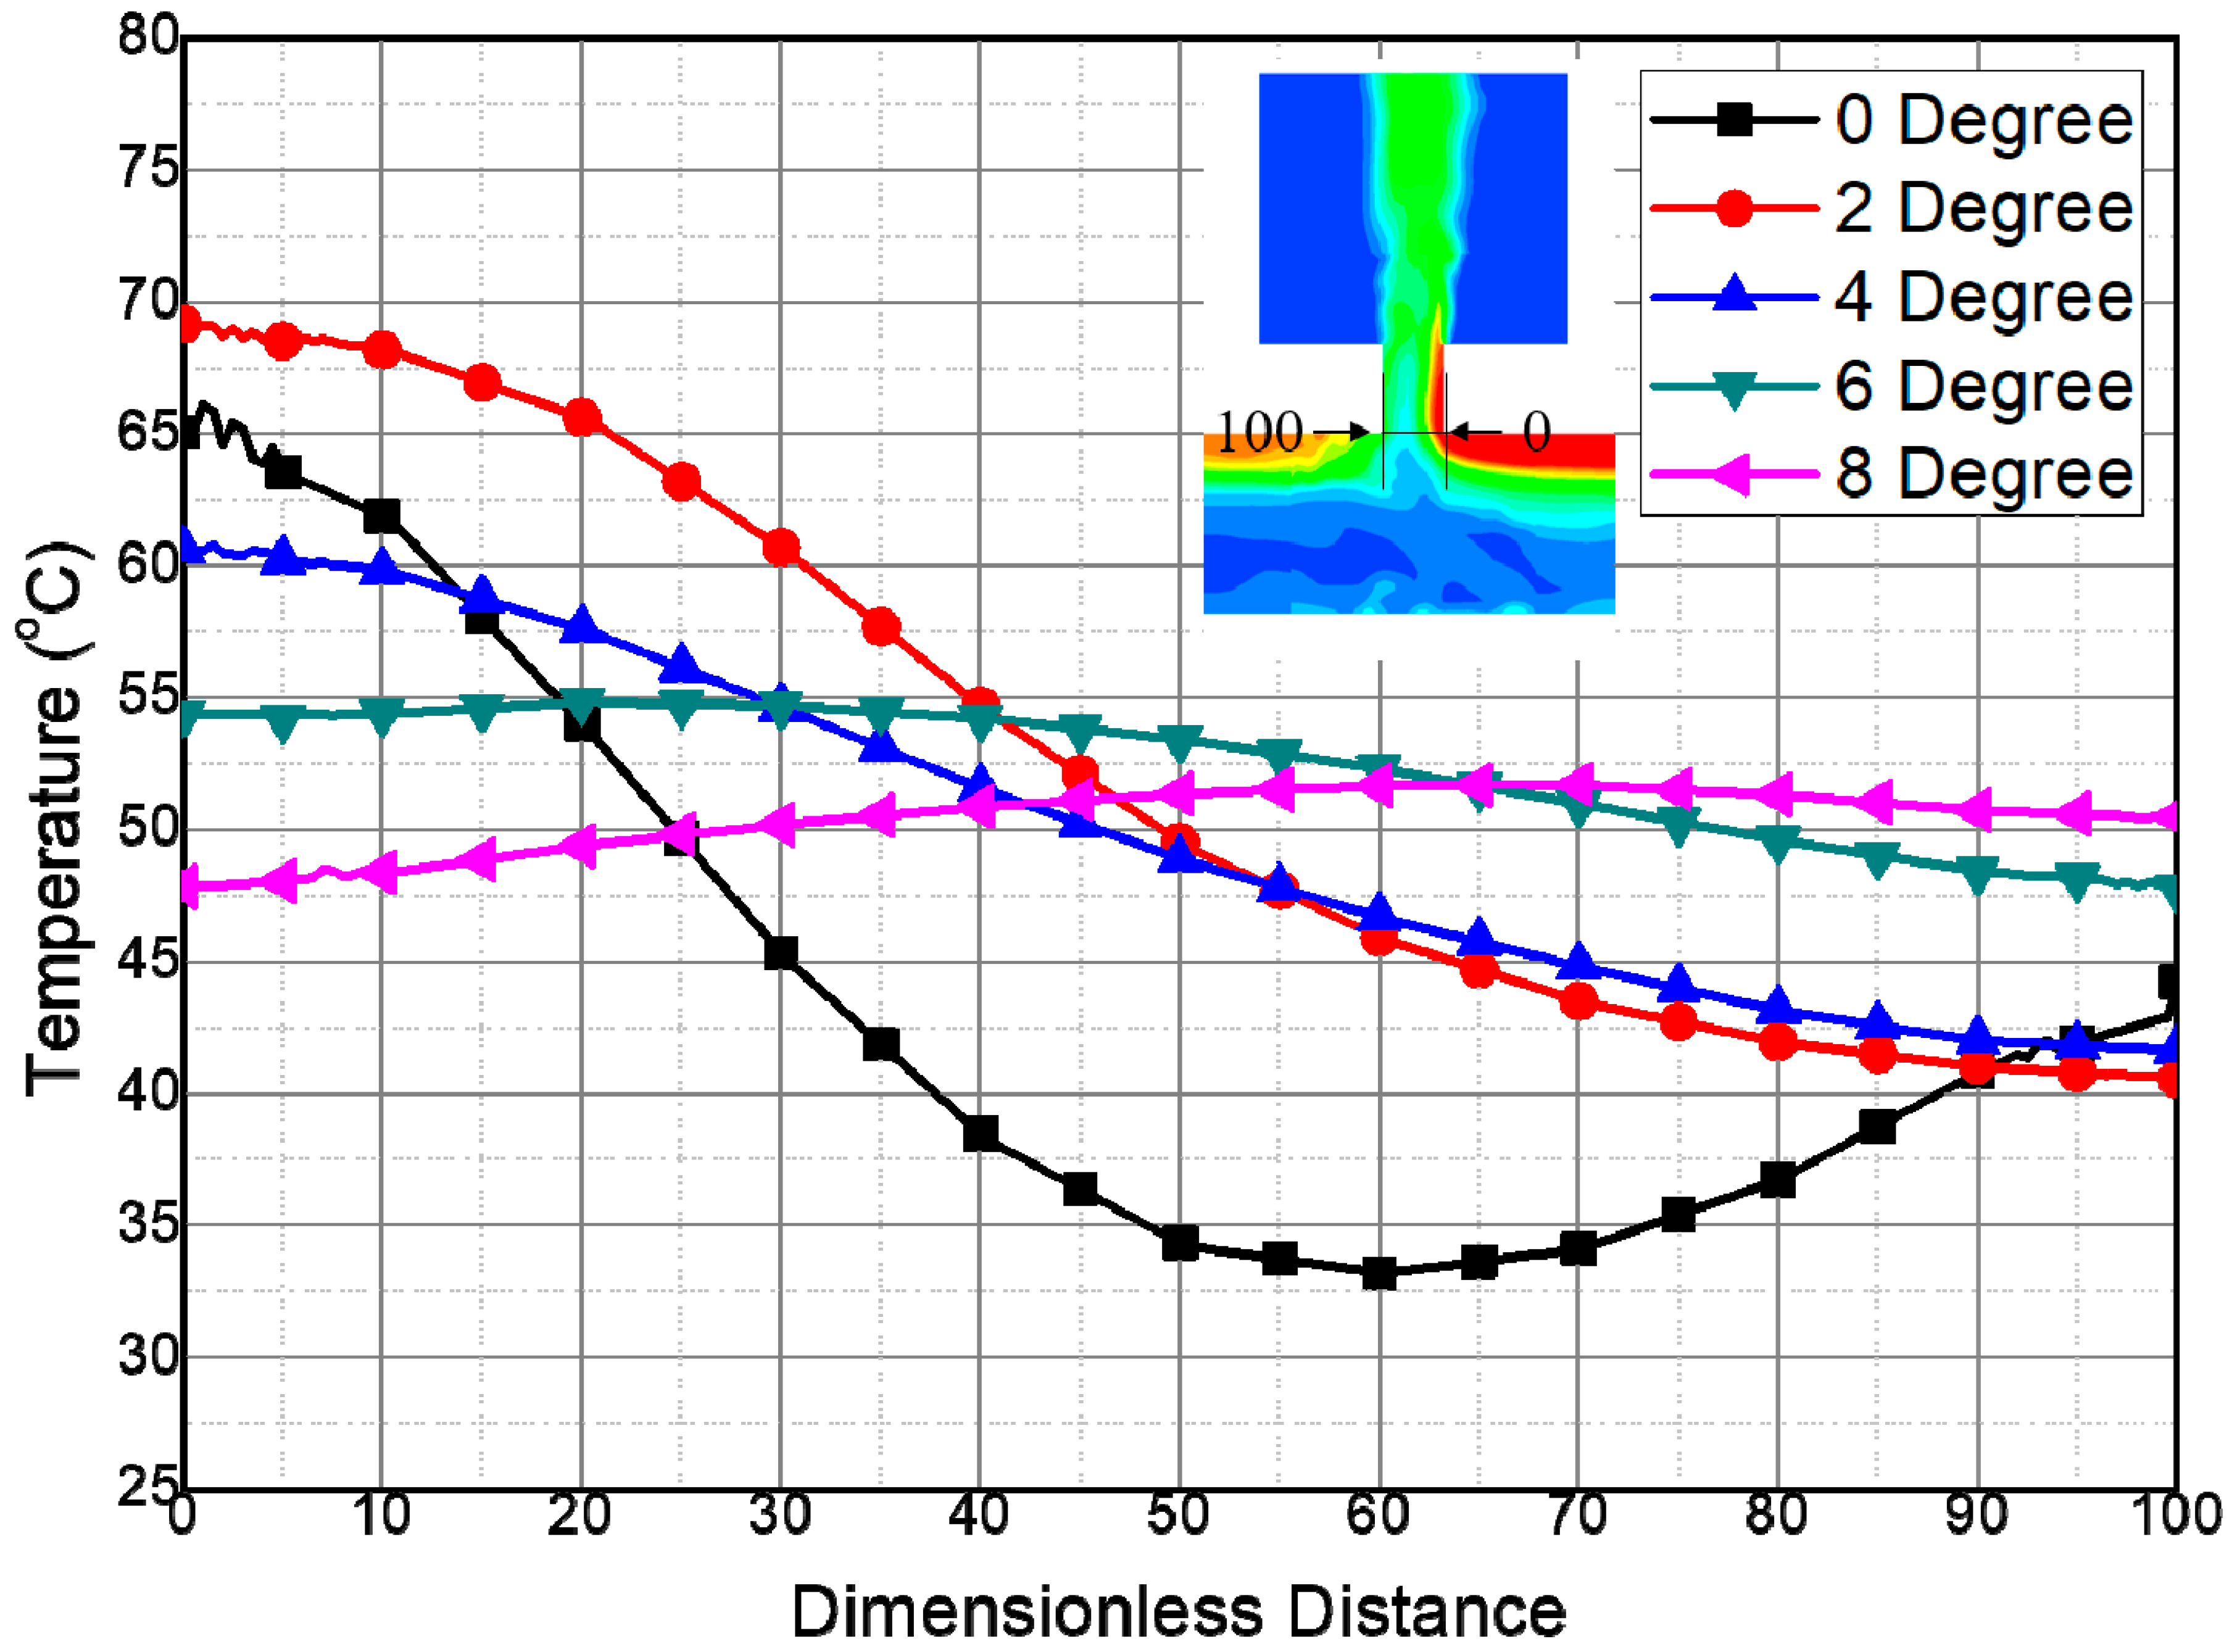
Figure 4 represents the temperature distribution of the flow inside of the shaft. The temperature distribution was obtained from x = 0, y = 0, the dimensionless distance 0 was the starting location of the shaft, and the end location in the y direction was the dimensionless distance 100. The internal temperature of the shaft according to the tunnel slope at the dimensionless distance zero was similar to the smoke layer temperature at the shaft start location.
Generally, when plug-holing occurs, a flow of fresh air that has a lower temperature than the smoke layer flows into the shaft. When the tunnel slope was 0 degrees, the flow temperature inside the shaft was 33.5 °C at the dimensionless distance 60, which means that a flow lower than the temperature of the smoke layer flows into the shaft, which means the possibility of plug-holing is high.
However, the possibility of plug-holing will decrease at the tunnel slope of 2 and 4° because of the temperature at the shaft being higher than the fresh air temperature. In particular, when the tunnel slope exceeds 6 degrees, the maximum temperature deviation inside the shaft is significantly decreased about 8 °C.
These temperature characteristics inside the shaft were deeply related to flow field in the tunnel according to the tunnel slope.
As shown in Figure 5, the smoke layer that flows in the direction of the tunnel exit was exhausted vertically at the shaft. The smoke and the fresh air flows into the shaft and recirculation flow occurs at the region where these two flows collide.
However, as the tunnel slope increases, the velocity of the flow increases with the longitudinal direction of the tunnel. Therefore, as can be seen from the vector near the inlet of the shaft, the flow is oriented longitudinally, to the vertical direction of the shaft, at the tunnel slope of more than 4 degrees.
Figure 6 represents the velocity distribution inside the shaft. The velocity of the shaft is strongly related to buoyancy force, which is influenced by the smoke layer temperature. As shown in Figure 4, the velocity inside of the shaft increases the slope of the tunnel to 4 degrees, and the temperature distribution inside of the shaft decreases by greater than 6 degrees.
As shown in Figure 4 and Figure 5, the plug-holing phenomena will not occur even if the slope of the tunnel exceeds 2 degrees. Additionally, the ventilation performance of the shaft is expected to increase because the flow temperature and flow velocity of the shaft are higher than the tunnel slope of 0 degrees, and until the slope of the tunnel reaches 4 degrees. However, above the tunnel slope of 6 degrees the ventilation performance is expected to decrease, because the internal velocity of the shaft is lower than the tunnel slope of 4 degrees.

4. Conclusions

The plug-holing phenomenon and the ventilation performance of the tunnel are affected by the tunnel slope. The possibility of plug-holing decreases as the slope of the tunnel increases. Moreover, when the tunnel slope is 4 degrees, the flow and temperature of the flow exhausted through the shaft are the highest. Therefore, the ventilation performance is the best when the tunnel slope is 4 degrees.
However, when the tunnel slope is greater than 4 degrees, fresh air from the entrance of the tunnel is diluted with smoke before reaching the shaft, thus the possibility of plug-holing is very low above 6 degrees and the ventilation performance begins to decrease. Therefore, it is necessary to design the shaft for the natural ventilation system considering the influence of the tunnel slope.

Author Contributions

Investigation, J.T.K.; Writing-Original Draft Preparation, J.T.K.; Writing-Review & Editing, J.T.K.; Supervision, H.S.R.; Funding Acquisition, K.-B.H.

Funding

This research was supported by the Fire Fighting Safety and 119 Rescue Technology Research and Development Program, funded by the Ministry of Public Safety and Security (MPSS-Fire Fiting-2015-80).

Conflicts of Interest

The funders had no role in the design of the study; in the collection, analyses, or interpretation of data; in the writing of the manuscript, and in the decision to publish the results.

References

  1. Alarie, Y. The toxicity of smoke from polymeric materials during thermal decomposition. Annu. Rev. Pharmacol. Toxicol. 1985, 25, 325–347. [Google Scholar] [CrossRef] [PubMed]
  2. Heskestad, G. Smoke distributions from fire plumes in uniform downdraft from a ceiling. Fire Saf. J. 2004, 39, 358–374. [Google Scholar] [CrossRef]
  3. Hinkley, P.L. The flow of hot gases along an enclosed shopping mall a tentative theory. Fire Saf. Sci. 1970, 807, 1–17. [Google Scholar]
  4. Ji, J.; Gao, Z.H.; Fan, C.G.; Zhong, W.; Sun, J.H. A study of the effect of plug-holing and boundary layer separation on natural ventilation with vertical shaft in urban road tunnel fires. Int. J. Heat Mass Transf. 2012, 55, 6032–6041. [Google Scholar] [CrossRef]
  5. Ji, J.; Han, J.Y.; Fan, C.G.; Gao, Z.H.; Sun, J.H. Influence of cross-sectional area and aspect ratio of shaft on natural ventilation in urban road tunnel. Int. J. Heat Mass Transf. 2013, 67, 420–431. [Google Scholar] [CrossRef]
  6. Baek, D.; Bae, S.; Ryou, H.S. A numerical study on the effect of the hydraulic diameter of tunnels on the plug-holing phenomena in shallow underground tunnels. J. Mech. Sci. Technol. 2017, 31, 2331–2338. [Google Scholar] [CrossRef]
  7. Baek, D.; Sung, K.H.; Ryou, H.S. Experimental study on the effect of heat release rate and aspect ratio of tunnel on the plug-holing phenomena in shallow underground tunnels. Int. J. Heat Mass Transf. 2017, 113, 1135–1141. [Google Scholar] [CrossRef]
  8. Ko, G.H.; Kim, S.R.; Ryou, H.S. An experimental study on the effect of slope on the critical velocity in tunnel fires. J. Fire Sci. 2010, 28, 27–47. [Google Scholar]
  9. Chow, W.K.; Wong, K.Y.; Chung, W.Y. Longitudinal ventilation for smoke control in a tilted tunnel by scale modeling. Tunn. Undergr. Space Technol. 2010, 25, 122–128. [Google Scholar] [CrossRef] [Green Version]
  10. Atkinson, G.T.; Wu, Y. Smoke control in sloping tunnels. Fire Saf. J. 1996, 27, 335–341. [Google Scholar] [CrossRef]
  11. Okamoto, K.; Watanabe, N.; Hagimoto, Y.; Chigira, T.; Masano, R.; Miura, H.; Ochiai, S.; Satoh, H.; Tamura, Y.; Hayano, K.; et al. Burning behavior of sedan passenger cars. Fire Saf. J. 2009, 44, 301–310. [Google Scholar] [CrossRef]
  12. Shintani, Y.; Kakae, N.; Harada, K.; Masuda, H.; Takahash, W. Experimental investigation of burning behavior of automobiles. Fire Saf. Sci. 2004, 6, 1–13. [Google Scholar]
Figure 1. Geometry and boundary conditions of the tunnel.
Energies 12 00059 g001
Figure 2. Temperature contour at x = 0: (a) 0°, (b) 2°, (c) 4°, (d) 6°, and (e) 8°.
Energies 12 00059 g002
Figure 3. Velocity vector near the fire source at x = 0: (a) 0°, (b) 2°, (c) 4°, (d) 6°, (e) 8°.
Energies 12 00059 g003
Figure 4. Temperature distributions inside of the shaft.
Energies 12 00059 g004
Figure 5. Velocity vector contour (x = 0): (a) 0°, (b) 2°, (c) 4°, (d) 6°, and (e) 8°.
Energies 12 00059 g005
Figure 6. Velocity distributions inside of the shaft.
Energies 12 00059 g006

