Article

Numerical Study on the Effect of Tunnel Aspect Ratio on Evacuation with Unsteady Heat Release Rate Due to Fire in the Case of Two Vehicles

School of Mechanical Engineering, Chung-Ang University,82, Heukseok-ro, Dongjak-gu, Seoul 06974, Korea
*
Author to whom correspondence should be addressed.
Energies 2019, 12(1), 133; https://doi.org/10.3390/en12010133
Submission received: 30 November 2018 / Revised: 26 December 2018 / Accepted: 26 December 2018 / Published: 1 January 2019
(This article belongs to the Special Issue Engineering Fluid Dynamics 2018)

Abstract

:
In this study, the characteristics of fires in case of two vehicles in a tunnel are analyzed by Computational Fluid Dynamics analysis for varying tunnel aspect ratios. Unsteady heat release rates over time are set as the input conditions of fire sources considering real phenomena. Unsteady heat release rate values are obtained from experiments. As a result, the smoke velocities above the fire source appear faster in the case of tunnels with a large aspect ratio because the higher the height of the tunnel, the faster the smoke velocity caused by buoyancy forces. The smoke velocity in the longitudinal direction increases quickly. However, the temperature distribution in the vicinity of the ceiling is low when the tunnel aspect ratio is large because the height of the tunnel is not directly affected by the flames. Also, the higher the height of the tunnel, the lower the visibility distance due to the heat and smoke coming down along the wall surface. However, in the tunnels represented in this study, it is considered that the visibility of evacuees is sufficiently secured.

1. Introduction

Tunnels have been continuously constructed to overcome topographical barriers in mountainous terrains and urban areas, as well as to reduce waste of time. Generally, fires in tunnels have a complex flow structure because it is a physical phenomenon affected by the tunnel geometry, ventilation system, and fan location, as well as chemical reactions and heat and mass transfer. Therefore, it is one of the most challenging research topics. When there are fires in tunnels, there are often critical casualties because smoke spreads rapidly along the longitudinal direction of the tunnel. According to the National Fire Protection Association (NFPA) fire statistics report, more than 70% of all tunnel fire casualties are caused by suffocation due to smoke and toxic gas inhalation [1]. Therefore, lots of studies regarding fires in tunnels have been undertaken using experimental and numerical approaches.
In the case of experimental studies, real-scale or reduced-scale tunnel experiments with pool fires have normally been conducted to figure out the heat release rate (HRR), temperature, smoke velocity and so forth. Some studies have conducted experiments with real vehicles, not in tunnels but rather in large scale experimental rooms. By changing the initial ignition location of the fire Katsuhiro et al. figured out that the temperature distribution and maximum heat release rate reached 3 MW. They found that as soon as a window breaks, the fire suddenly diffused due to the inflow of exterior air [2]. Most experimental studies were conducted considering single vehicle situations [3,4], but in reality, vehicle accidents normally occur as collisions between two vehicles, however, there are only a few such studies. Many researchers have conducted pool fire experiments and the pool size was calculated using the scaling law [5], and based on the type of vehicles considering maximum Heat Release Rate (HRR). However, lots of reduced-scale experimental studies have been conducted, even if there are different temperature and HRR distributions between vehicles and pool fires due to material properties. Lee et al. [6] conducted small-scale experimental studies to investigate the change of fire characteristics such as ceiling jet flow and critical velocity for varying tunnel aspect ratios. They applied new dimensionless velocity and heat release rates to suggest modified critical velocities.
Numerical methods have been used many studies because the results of experimental studies can be compared with numerical studies and fire phenomena in tunnel fires possibly verified under various conditions [7,8,9]. In particular, the aspect ratio of the tunnel is the one of the most interesting factors in tunnel smoke propagation studies. The heat flow generated in a fire is different for varying tunnel aspect ratios, and this directly affects the evacuation result. In tunnels with the same hydraulic diameter, the critical velocity to prevent the smoke spreading for evacuees is different for various aspect ratios. Therefore, investigating the fire characteristics according to different aspect ratios is an important parameter when designing smoke control systems [10]. In previously studies, model tunnels have been constructed in which one can change the tunnel aspect ratio and determine the effect on mass loss rate, maximum smoke temperature and temperature distribution. It was found that aspect ratio is an important factor that affects the smoke temperature distribution. As can be seen from related papers regarding the effect of aspect ratio with numerical study, aspect ratio is a decisive parameter for designing of smoke control systems. Figure 1 presents a schematic diagram of the basic concepts about varying aspects ratio on tunnels. Therefore, it is very important to investigate the fire characteristics in case of two vehicle fires in real situations. Thus, in this study, we numerically investigated the effect of tunnel aspect ratios on unsteady heat release rates.

2. Numerical Method

The values of heat release rate obtained from a large scale cone calorimeter experimental apparatus are set as the fire input conditions for the numerical analysis. Park et al. have presented detailed information about this experimental study, currently under review for the journal Fire Technology [11]. Figure 2 presents whether the heat release rate shows the same result values when applied under the conditions of a fire source. In addition, unlike the pool fire experiments, in real vehicle experiments, there are some sections where the heat release rate decreases or stabilizes for the various points at which the fire source is propagated. Section 1 indicates that the fire spreads from the passenger seat to the driver’s seat and rear seat. In addition, Section 2 is the time when the fire propagated from the vehicle where the initial fire occurred to the vehicle next to it, and Section 3 represents the time to propagate from indoors to outside vehicle components such as fuel tank, engine room and bumpers. Section 4 was a period for comparing Section 1, Section 2 and Section 3 that represent other trends. This is because, unlike the usual pool fire experiment, the heat release rates does not increase continuously but are steady or decrease. In this study, temperature, smoke velocities and visibility and so forth changes caused by the aspect ratio at the point of reaching the maximum heat release rate in four sections are analyzed using Fire Dynamic Simulator (FDS) numerical analysis program [12].
Figure 3a presents the computational domain of a tunnel with 100 m of longitudinal direction without any ventilation system. Vehicle sizes are 1.8 m (W) × 4.7 m (L) × 1.4 (H) and distance between vehicles is 0.6 m. Figure 3b represents the location of thermocouples and analysis planes. It depends on tunnel aspect ratio, however, the thermocouples are attached 0.2 m below the ceiling and 0.6 m above the vehicles. The interval between each thermocouple is 0.6 m. Figure 3c presents four difference tunnel aspect ratios but the total cross section area is almost constant. The aspect ratio is defined as the height divided by the width. Adiabatic conditions are set on the tunnel wall, and pressure outlet conditions at the tunnel exits. Figure 3d represents the three various flow directions occurring in a tunnel. The smoke velocity above fire source, velocities against the ceiling, and ceiling jet flows are affected by the tunnel’s aspect ratio caused by heat gases and temperatures inside the tunnel. These flows are represented as flow 1, flow 2 and flow 3, respectively. The number of grids was approximately 770,000 and applied to differentiate the number of regions to improve the accuracy and efficiency of analysis. The size of the grid was 0.1, 0.2 and 0.4 m from the above of fire source to the exit of the tunnel, respectively. To distinguish the optimum grid size, the size of the minimum grid required for the flow modeling is determined by the characteristic flame diameter taking into account the heat release rate of the fire source [13]. Also, in order to improve the accuracy and efficiency of the analysis, the grid size is applied differently considering the flow characteristics:
D * = ( Q ˙ ρ C p T g ) 2 / 5
where ρ [kg/m3], Cp [kJ/(kg·K)], T [°C] represent the density, specific heat and temperature for ambient air (20 °C, 1 atm), respectively. For simulations involving buoyant plumes, the flow field is given by non-dimensional expression D*/δx, where D* is the characteristic fire diameter and δx is the nominal size of a mesh cell. The quantity, Q ˙ , is the total heat release rate of the fire. The quantity D*/δx can be thought of as the number of computational cells spanning the characteristic diameter of the fire. Generally, a reasonable numerical results can be obtained at a grid size of 0.05 < Δ ¯ / D * < 0.10 [14] where, Δ ¯ represents the average grid size. In this study, the average grid size is 0.35 m. Therefore, an average grid size of approximately 770,000 is considered when considering characteristic flame diameters.

3. Results and Discussion

3.1. Effect of Aspect Ratio on Tunnel

Figure 4 presents the temperature and smoke velocity contours for varying tunnel aspect ratios at 1500 s where it concerns the maximum heat release rate. When the aspect ratio of the tunnel is small, the temperature distribution above the fire source and temperature distribution in the horizontal direction are high. The lower the height of the tunnel, the more affected by the flame. Conversely, in case of smoke velocity, the higher the tunnel height, the more the momentum forces on the fire source increase, so that the smoke velocity appears faster. Also, the higher the height of the tunnel, the stronger the buoyancy force applied. Figure 5 presents the values on the change of temperature and smoke velocities for varying aspect ratios measured 0.2 m below the ceiling at 1500 s underpinning the effects of tunnel height on smoke velocities. To compensate the severe fluctuations, the value on 1500 s was calculated as an average value before the 10 seconds and after the 10 seconds at the specific time. Because of the different tunnel heights, the results shown are obtained by normalizing the tunnel height.
The value of 0 on the Y axis represents the temperature just above the fire source and the value of 1 represents at a point 0.2 m beneath from the ceiling. When the maximum heat release rate occurs, the temperature above the fire source is from about 120 to 200°C, and the temperature at the ceiling is from about 150 to 450°C. It varied by almost two- and three-fold depending on the location and tunnel aspect ratio. The smoke velocity is the fastest near the center of the tunnel, with a speed difference about 1.4 times higher. Furthermore, the smoke velocity is the fastest and has a tendency to decrease at the middle of the tunnel. This is due to buoyancy forces, which accelerate the smoke velocity over time, but near the tunnel wall, the smoke velocity is lowered due to no-slip conditions, friction and the normalized tunnel height to analyze the tendency of the tunnel aspect ratio.
Figure 6a presents the temperature changes 0.2 m below the tunnel ceiling for varying aspect ratios and distances. In the case of the tunnel with the smallest aspect ratio, the temperature above the fire source is the highest. In addition, the slope of the temperature distribution along the tunnel distances show that the temperature drop rate greatly changes when the aspect ratio is low. This is because when the height of the tunnel is high, the width of the tunnel is relatively small and the heat loss to the tunnel ceiling is reduced. Figure 6b presents the smoke velocities at the same point with various aspect ratios. It appears that the temperature distribution below the ceiling at the point 5 m away from the fire source is faster than the smoke velocity above the fire source, and the smoke velocity declines as the distance increases. This is due to the fact that the smoke velocity above the fire source is suddenly changed by the fluctuation and the smoke spreads along longitudinal direction before reaching 0.2 m from the ceiling. This is underpinned in Figure 7 by a vector in the longitudinal direction.
Also, in the case of the smoke velocity distribution according to distance, when the tunnel is high, buoyancy forces are have a great influence and it seems that the momentum force of the ceiling jet flow spreading in the longitudinal direction acts stronger. Therefore, when the height of the tunnel is high, the exit time to the tunnel exit is also fastest and this is represented in Figure 8. The time for the initial smoke to exit the tunnel was different as 90 s, 86 s, 79 s and 75 s, respectively, for the various aspect ratios. The smaller the aspect ratio, the longer it took for smoke to be emitted. The lower the height of the tunnel, the higher the temperature is because the flame directly reaches the ceiling, and the smoke temperature spreads in the longitudinal and lateral directions. However, the smoke velocity at which the smoke is spreading increased as the height is increased by the buoyancy forces.
The temperature of the upper part of the tunnel increases continuously as time goes by. However, the temperature presents almost constant values because external cold air continuously flows into the lower part of the tunnel. Therefore, in order to secure the evacuation route of the evacuees, a flow is introduced in the opposite direction of the ceiling jet flow when the fire occurs. As the ceiling jet flow changes according to the aspect ratio, Lee et al. [9] suggested the formula considering aspect ratio as follows:
V c = 0.73 A R t u 0.2 g H ¯ ( Q ρ 0 c p .0 T 0 A R t u g H ¯ 5 ) 1 / 3
where, AR represents the tunnel aspect ratio and ρ, Cp, T represent the density, specific heat and temperature for the ambient air (20 °C, 1 atm) and H ¯ is the hydraulic diameter of the tunnel. Based on the formula presented by Lee, the critical velocities for varying aspect ratios are simply 1.74, 1, 0.77 and 0.59, respectively. However, from an energy efficiency point of view, it is essential to calculate the appropriate air flow rate over time. Therefore, the critical velocity considering the heat release over time is shown in Figure 9. The critical velocity should be introduced considering the specific shape of the tunnel.

3.2. Visibility

Figure 10 shows how much visible distance the fire can reach at a person’s average eye level of 1.7 m. It shows the contour at the point of maximum heat release rate based on the FDS setting value having a maximum visible distance of 30 m. A value of 30 means that people can be visually identified up to 30 meters away. As can be seen from A in Figure 10 showing the fire source surface, the visibilities near the tunnel wall are low in a narrow tunnel width. On the other hand, in wide tunnels, the visual distance is relatively clear. This is because as the tunnel width becomes narrower, the smoke spreads in the lateral direction, and the smoke bumping against the wall generates a vortex and descends downward. If the tunnel width is wide, less vortex is generated. Visibility at 5 m and 10 m from the fire source is similar, but visibility is lower for a narrow tunnel width. Furthermore, velocity vectors are represented in Figure 11 to underpin the vortex for varying aspect ratios. As can be seen in Figure 11, the vortex size can be found to be large in high tunnels. It is because heat flow from the ceiling on the wall quickly flows into the bottom of the tunnel and fresh air from the outside quickly flows into the top of the tunnel, resulting in a larger vortex and it results in reduced visibility for evacuees. However, although the visibility varies depending on the aspect ratio of the tunnel, the visibility at a point where the average height of a person is 1.7 m seems to be clear.
Figure 12 presents the temperature distributions over time at the height of 1.7 m to consider an average human average height. It shows the same temperature change irrespective of the aspect ratio. This shows the temperature distribution in the same vicinity as the location of the fire source, so the effect of the tunnel width and length is not shown. Although it is difficult to set the evacuation time considering only the temperature, the evacuation must be within completed 450 s (7 min 30 s) before reaching 60 °C in order to reduce deaths due to fire in a tunnel.
Figure 13 shows the temperature distribution at the specific section for the various aspect ratios in Section 1, Section 2, Section 3 and Section 4, 0.2 m below the tunnel ceiling. Section 1, Section 2 and Section 3 are the sections where the heat release rate is stable or decreases, whereas Section 4 represents the section where the heat release rate increases radically in order to compare with other sections. As presented in Figure 13, the temperature increases and decreases are relatively stable. However, the temperature distribution in the region where the heat release rate increases rapidly differs from that in other regions.

4. Conclusions

The aim of this study was to investigate the fire characteristics of the tunnel vehicle fires for varying the aspect ratio of the tunnel cross-section using FDS. For this purpose, the heat release rates obtained from experimental study in case of two vehicles were measured. The following conclusions were obtained:
1)
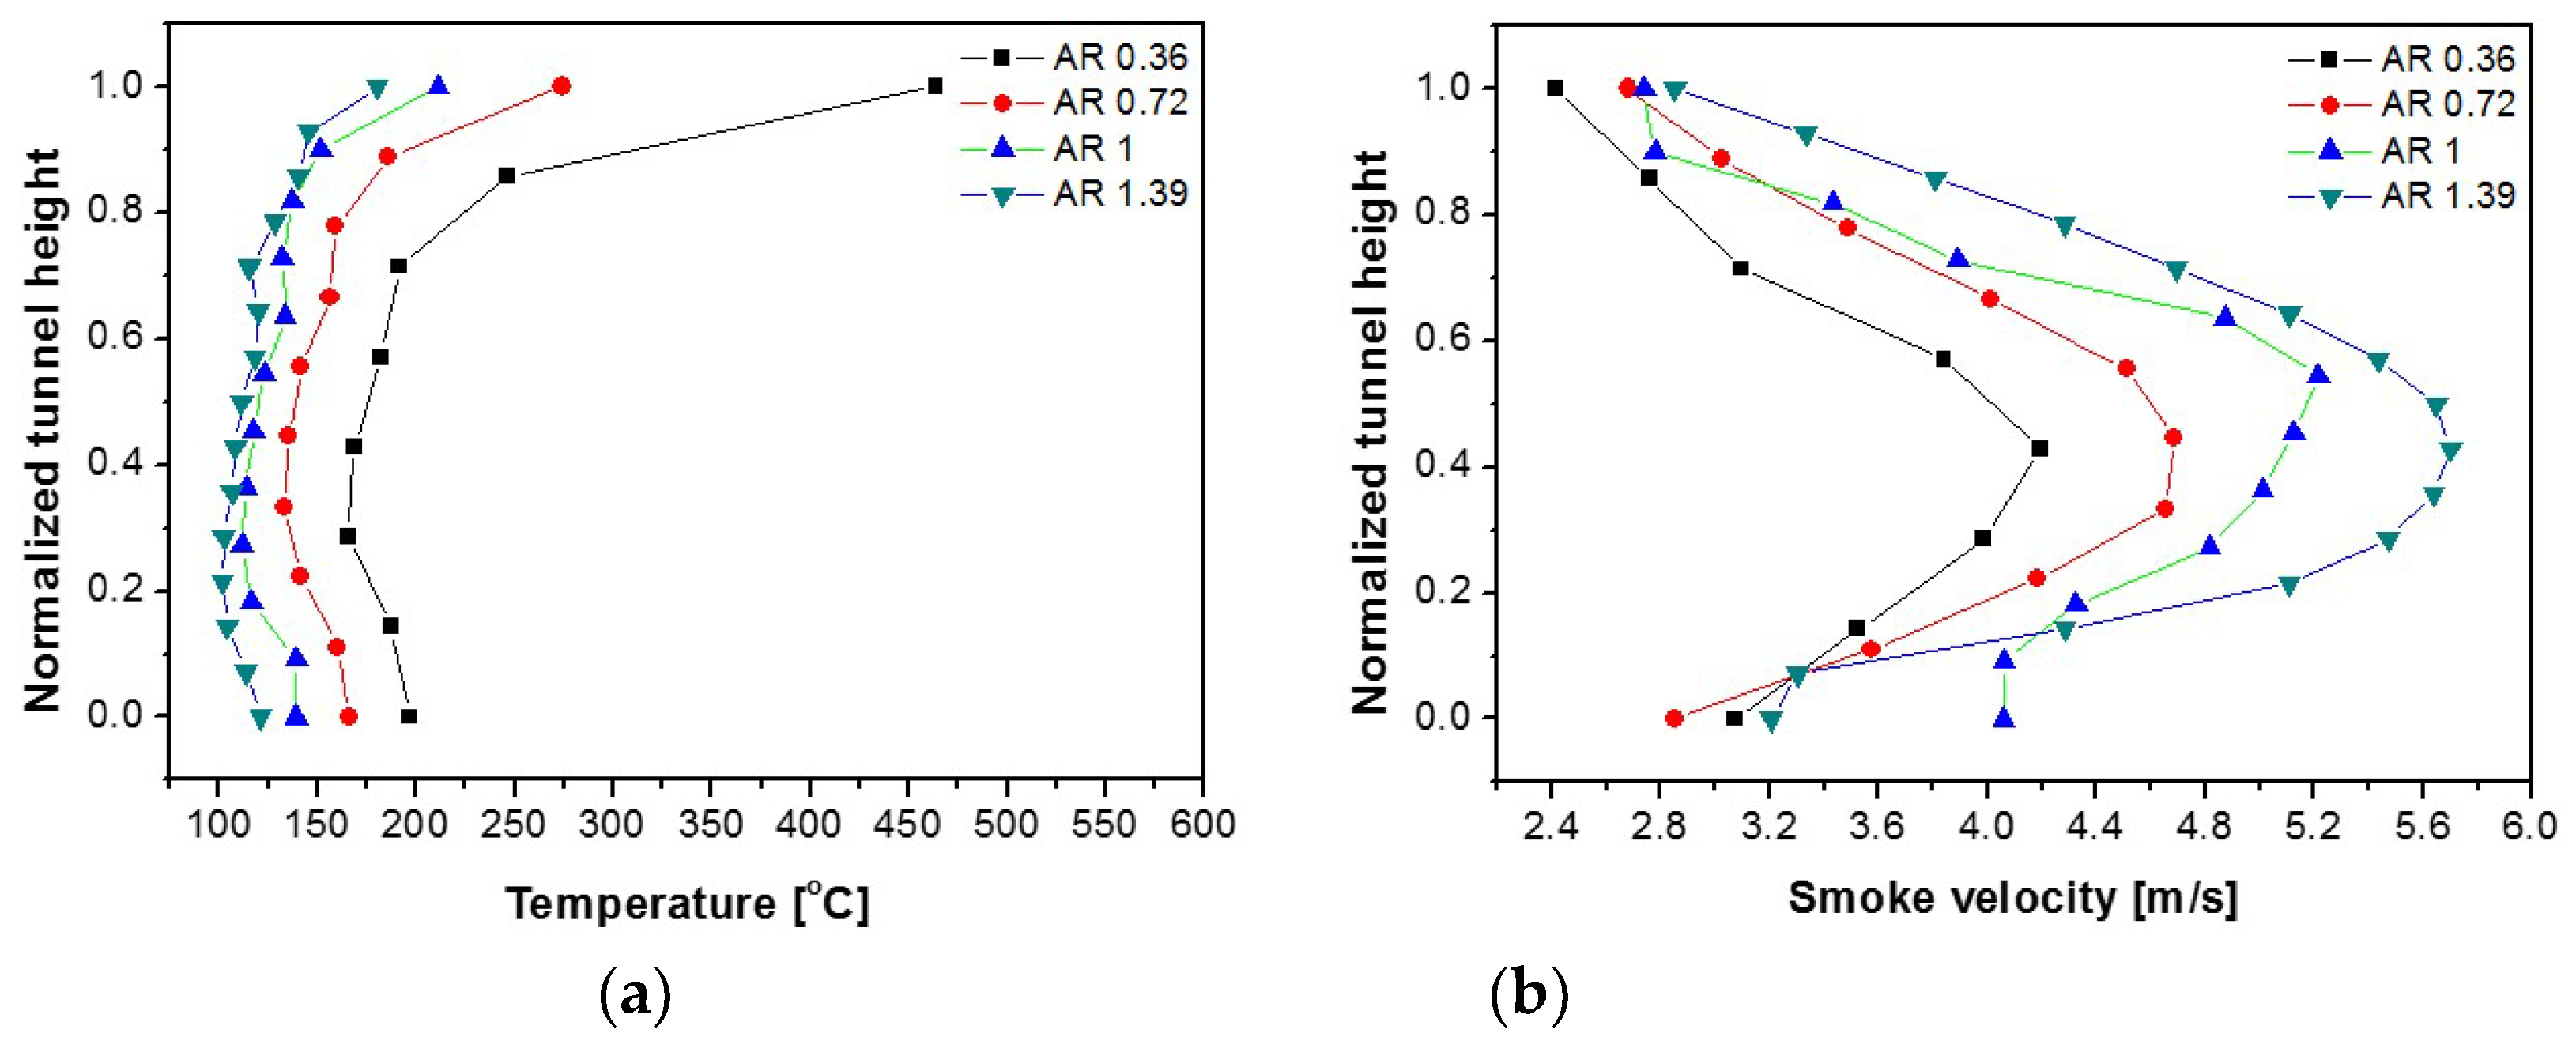
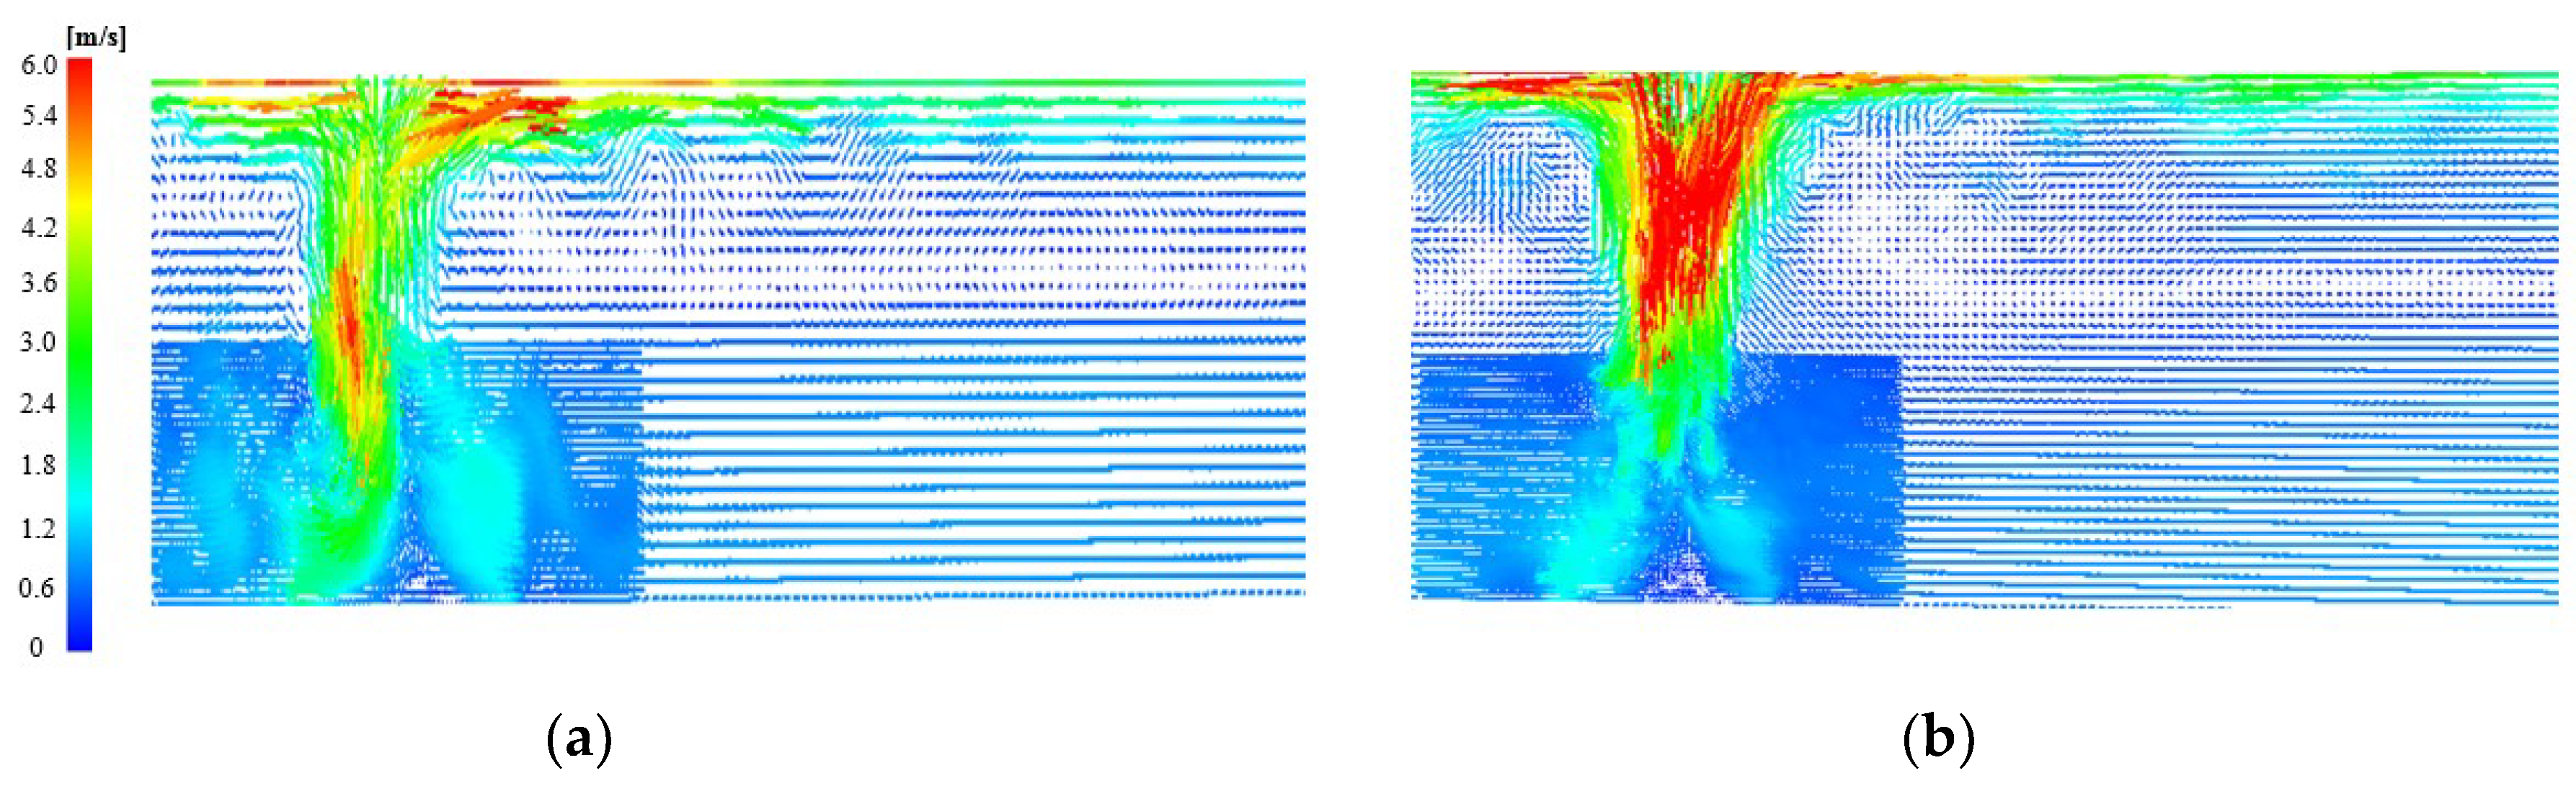
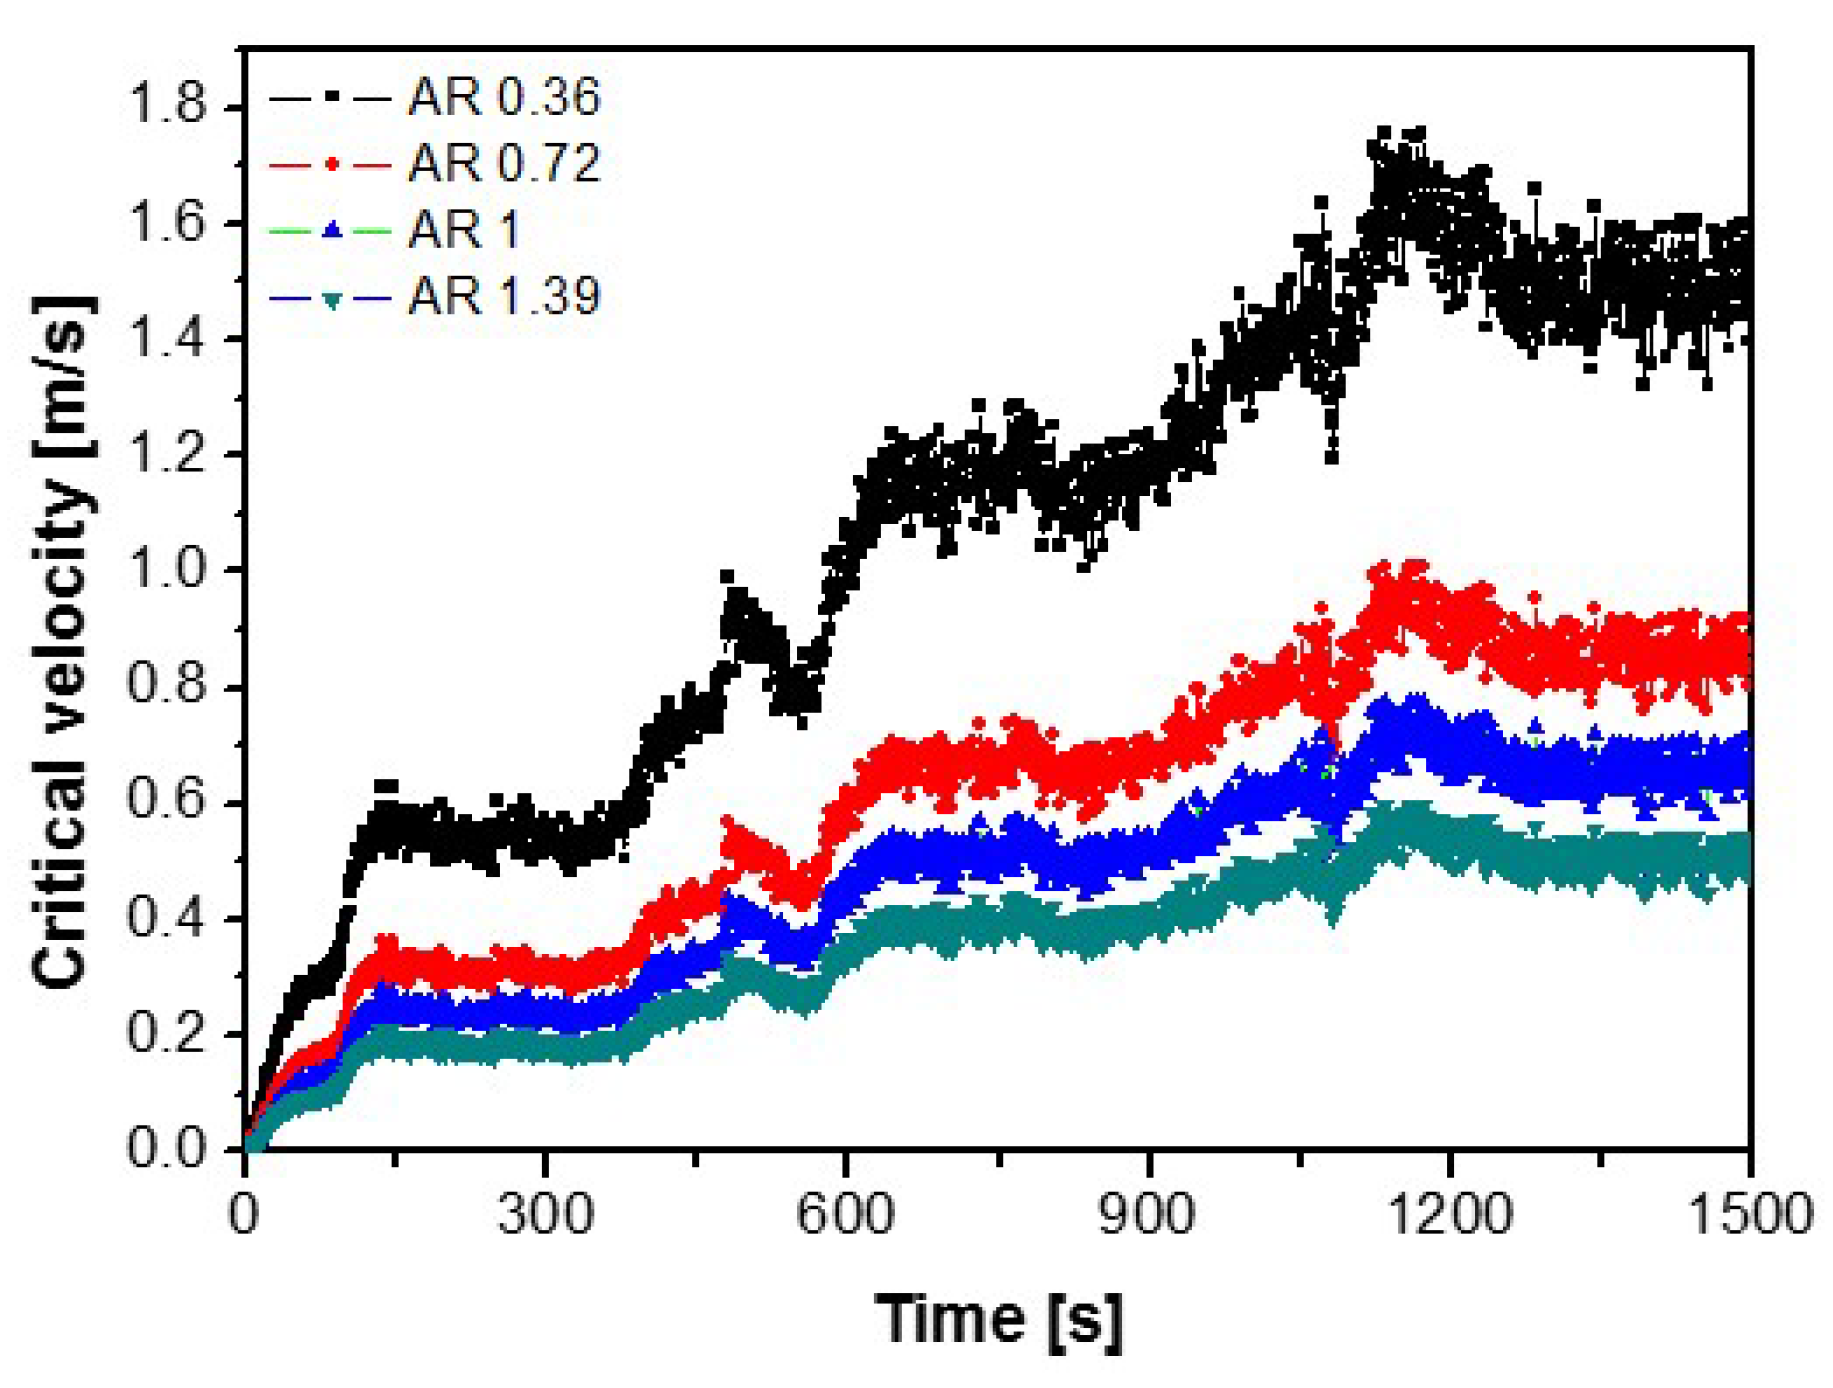
In a tunnel with a large aspect ratio, the smoke velocity above the fire source was generated rapidly. The buoyancy force and momentum force which affected the smoke velocity in the direction of longitudinal is greater in the case of a small aspect ratio tunnel.
2)
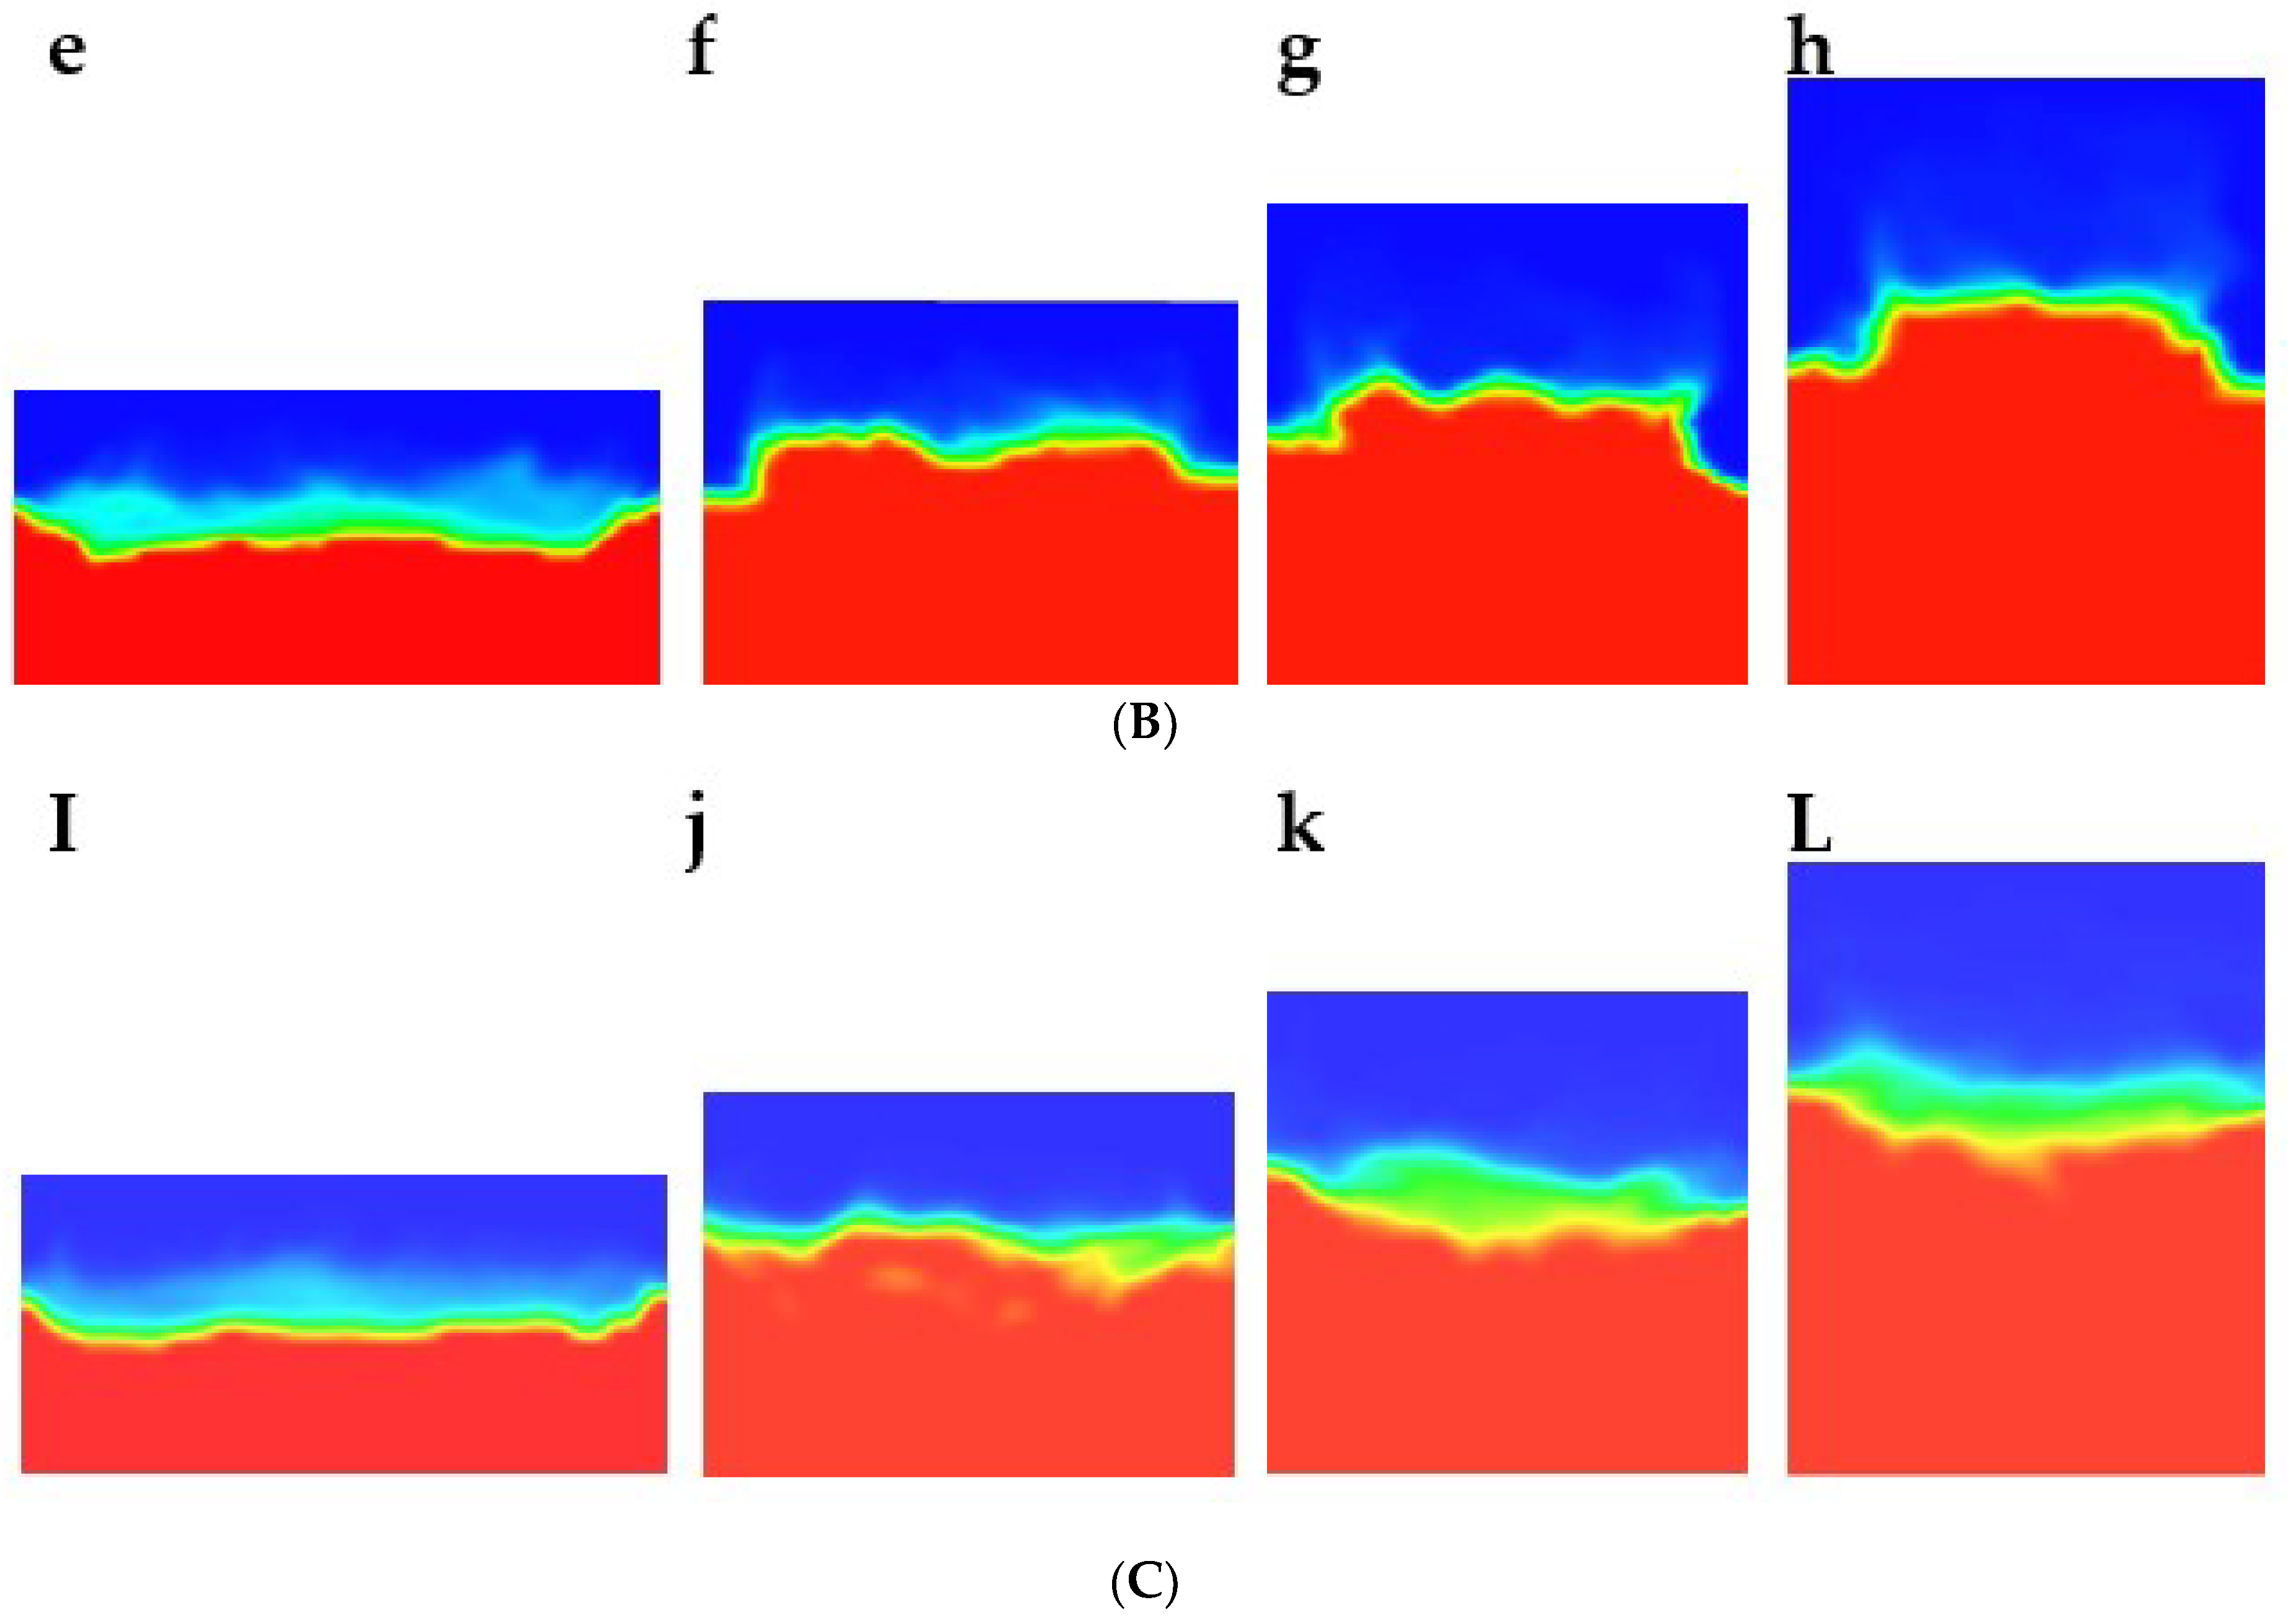
As the aspect ratio becomes smaller, the temperature distribution in the cross-section area of the tunnel was higher because the flame directly affects the below of the ceiling but the flame was relatively small when the tunnel aspect ratio was large.
3)
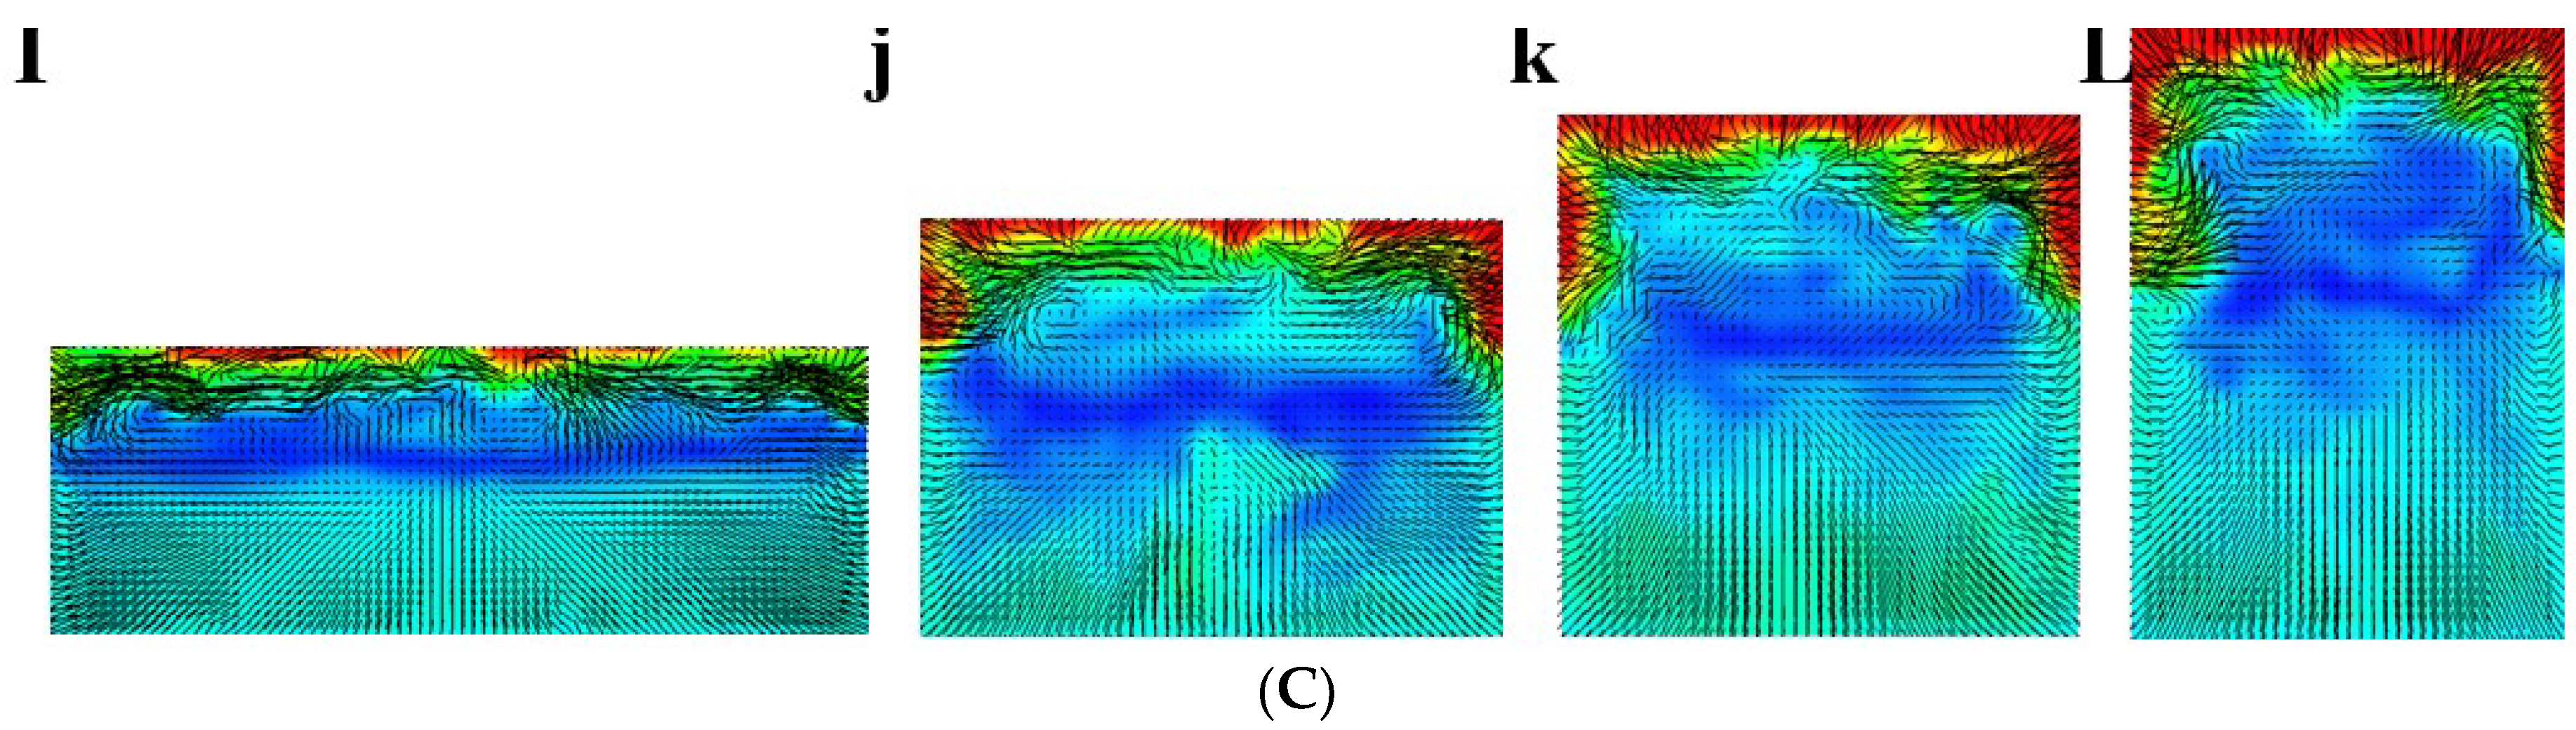
When the tunnel width was narrow, the vortex generated by the wall was generated strongly, and the smoke falls along the wall surface, so it is difficult to secure visibility.
4)
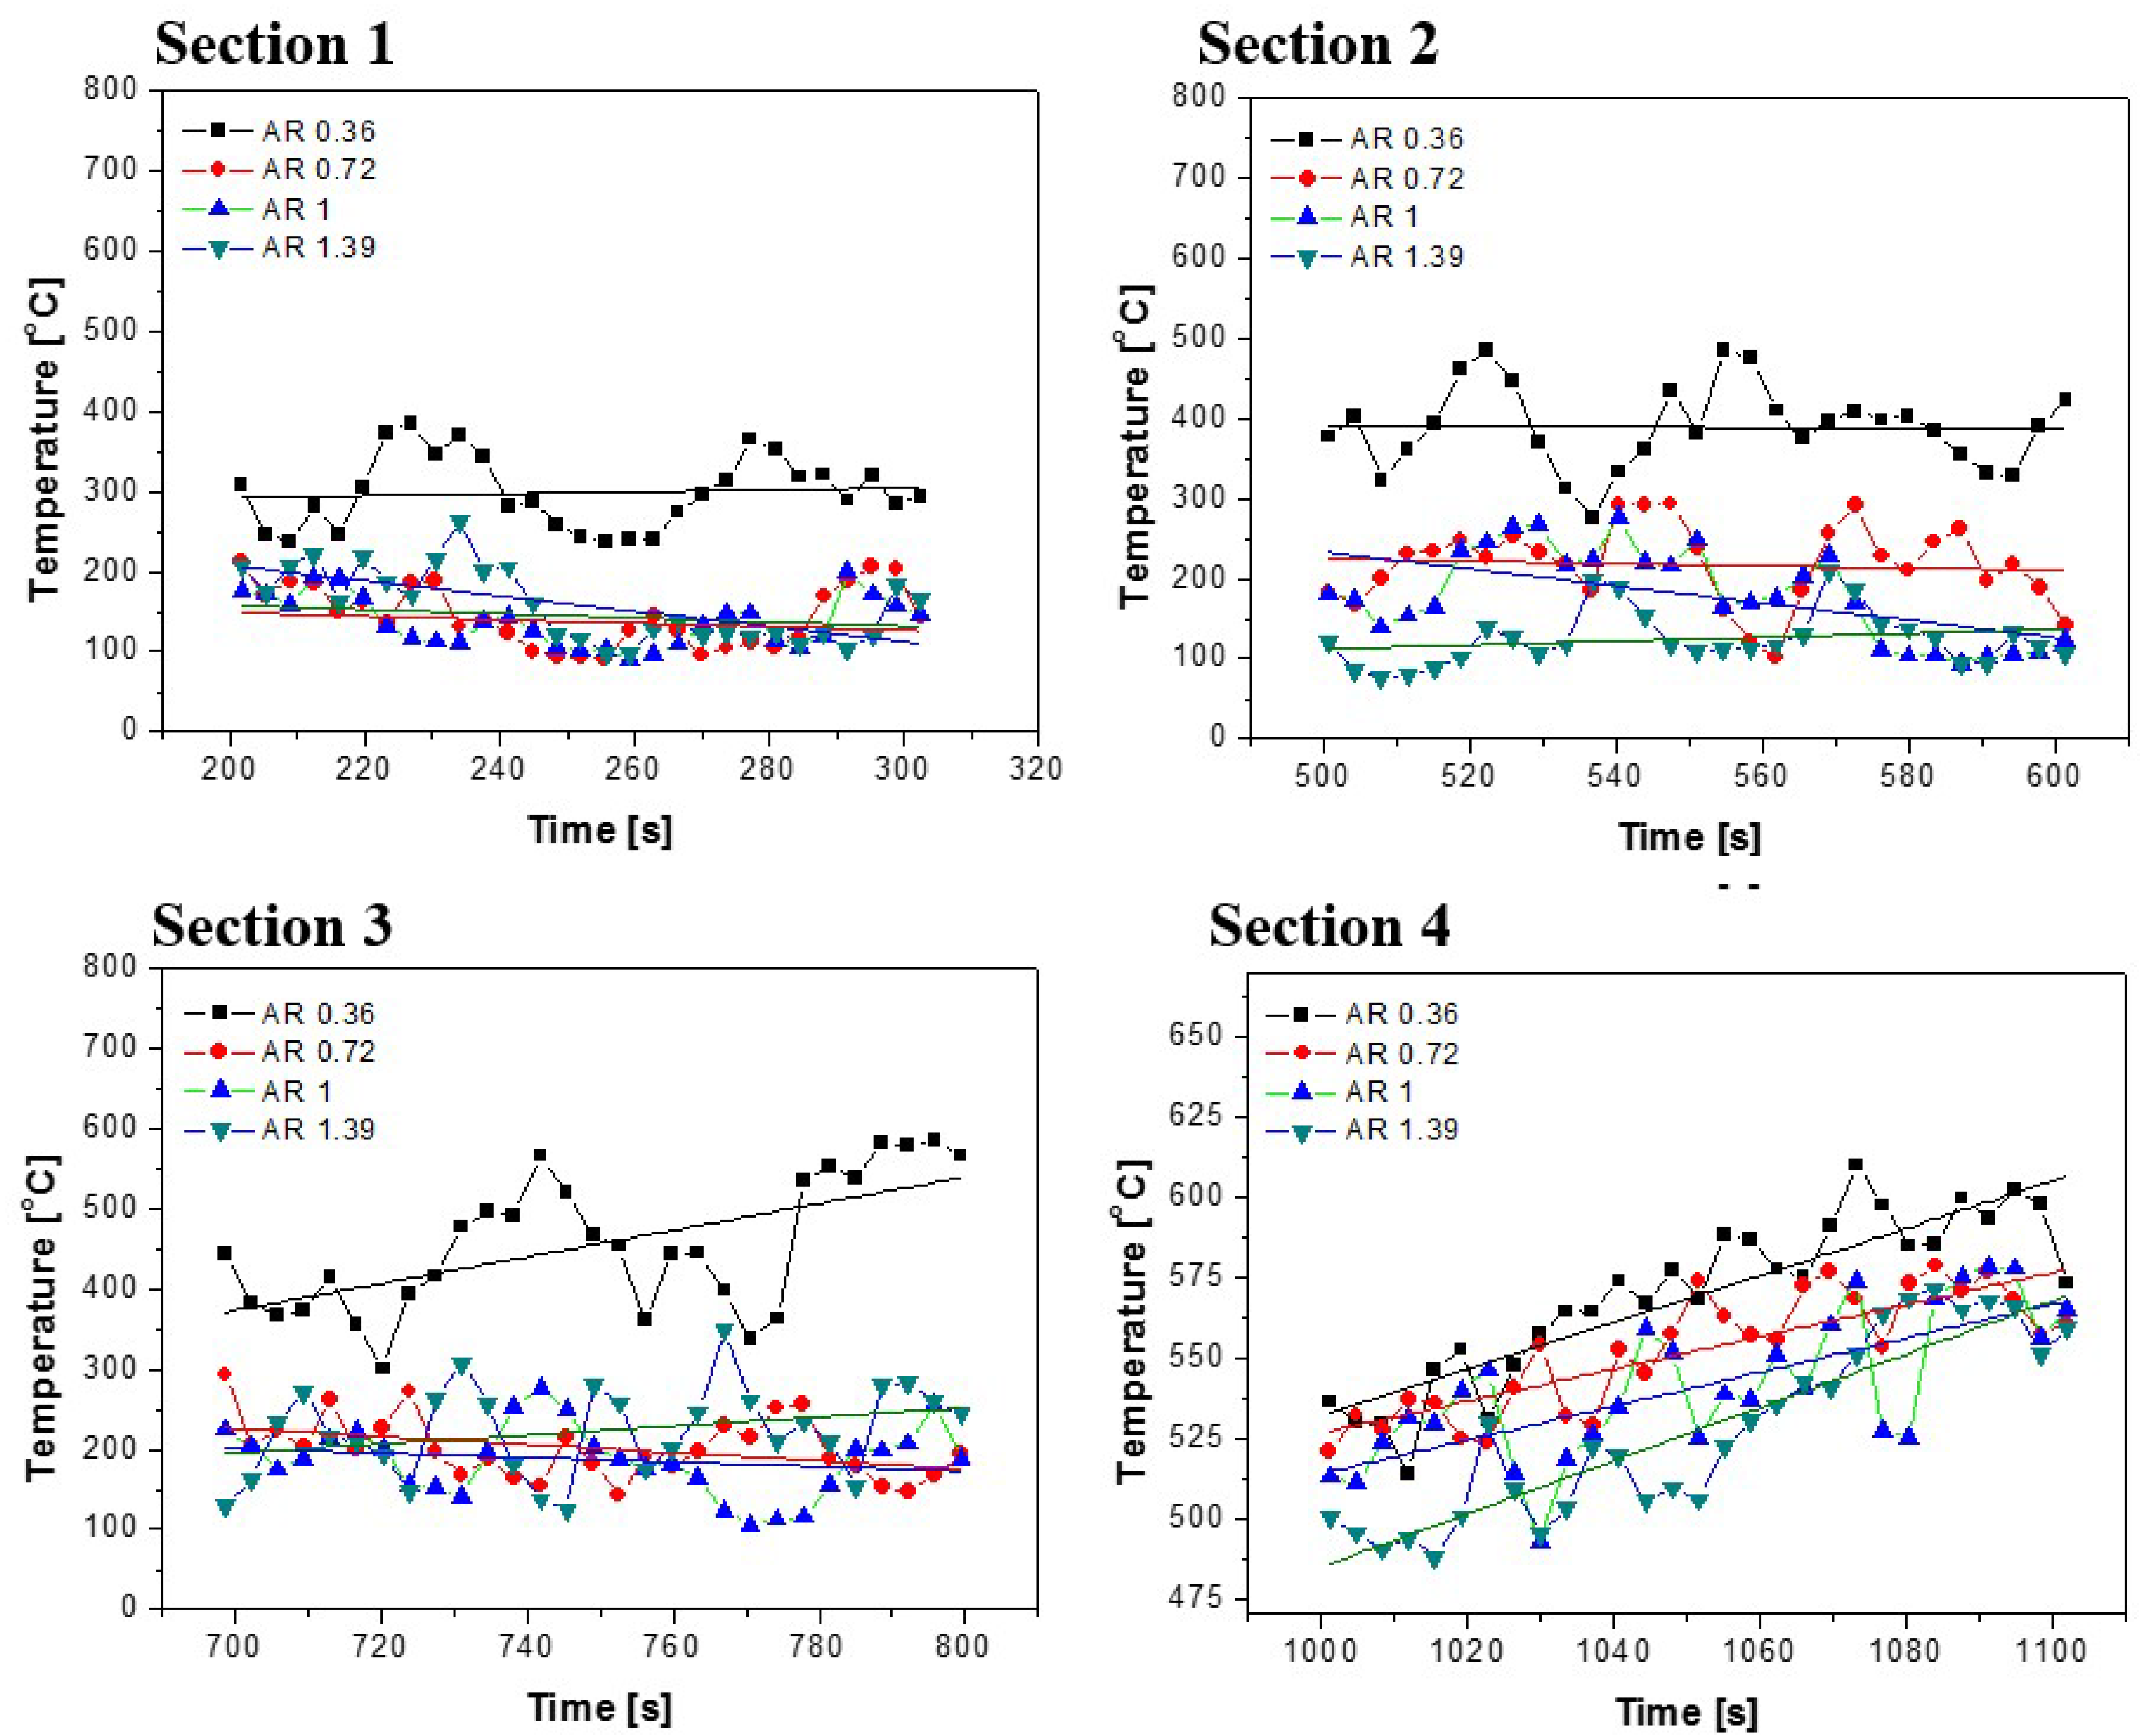
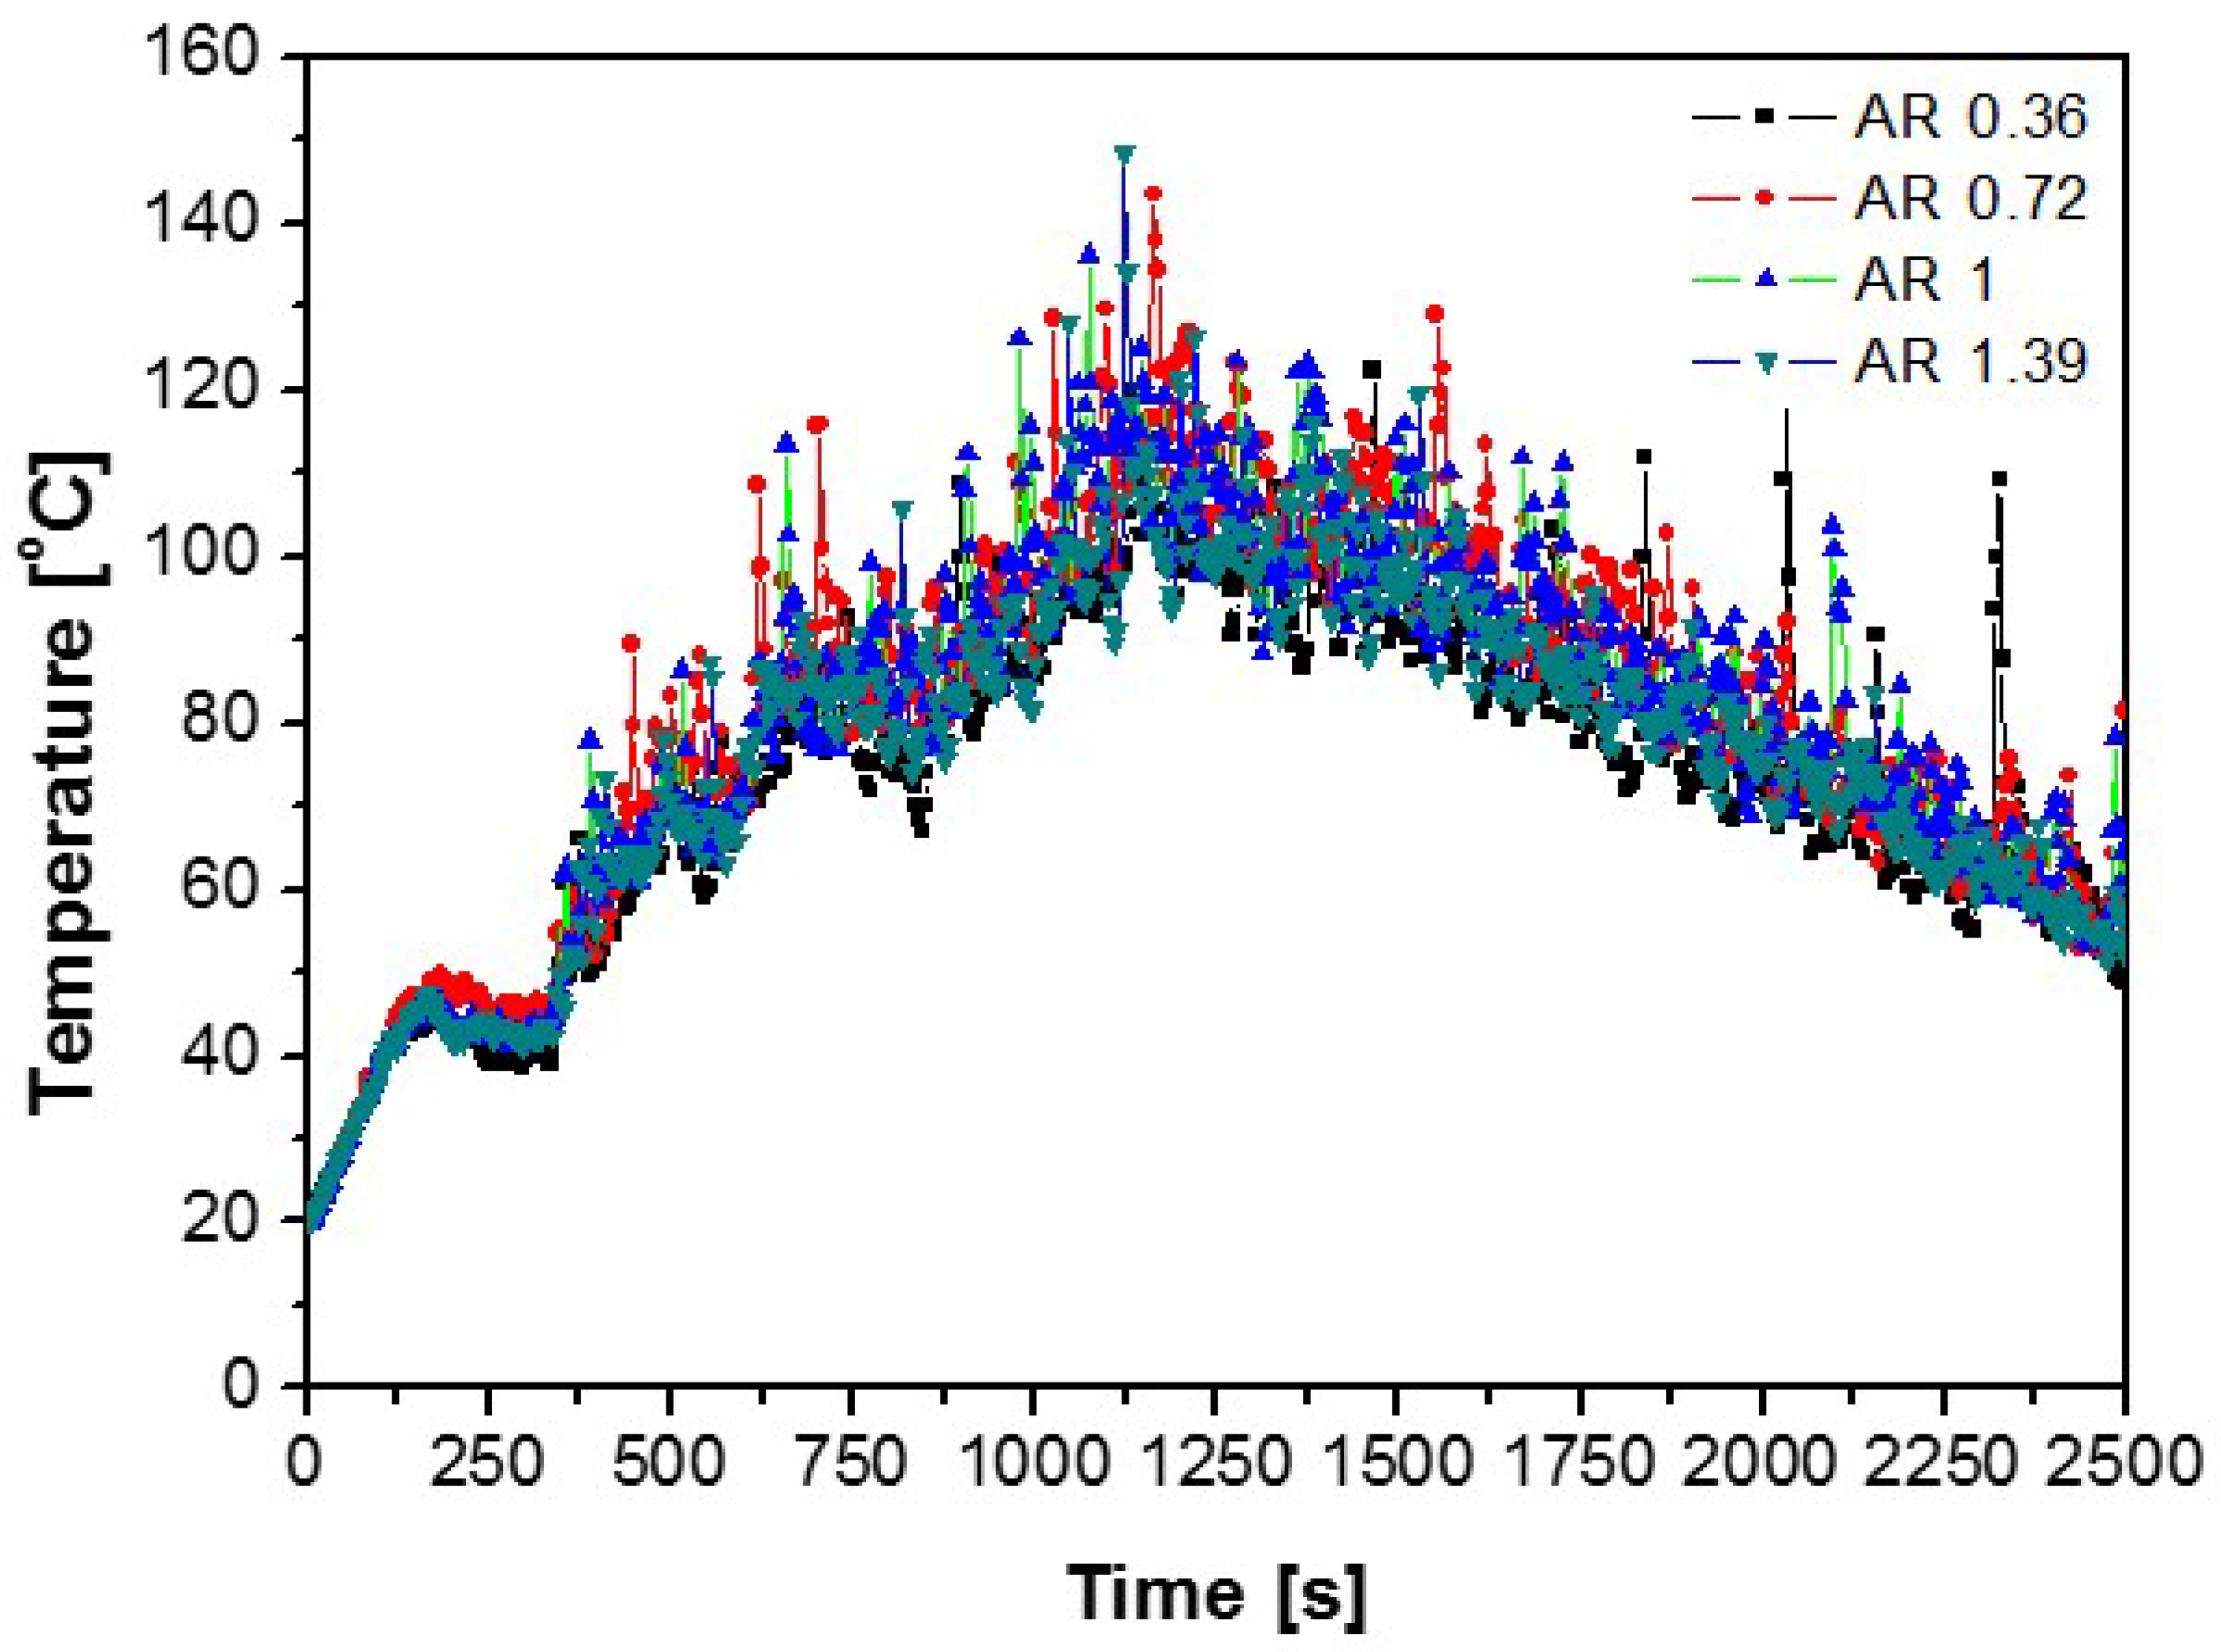
The temperature changes in the section where the heat release rate was constant are insufficient, but the temperature change in the section where the heat release rate increases was apparent.

Author Contributions

Conceptualization, methodology, investigation: Y.P. and H.S.R.; software, validation, writing—original draft preparation: Y.P.; formal analysis, investigation: J.N. and Y.L.; writing—review and editing, supervision, project administration, funding acquisition: H.S.R.

Acknowledgments

This research was supported by the Chung-Ang University research grant in 2018.

Conflicts of Interest

The authors declare no conflict of interest.

References

  1. NFPA 92A: Recommended Practice for Smoke control Systems; Natl Fire Protection Assn: Quincy, MA, USA, 1988.
  2. Katsuhiro, O.; Norimichi, W.; Yasuaki, H.; Yasuaki, H.; Tadaomi, C.; Ryoji, M.; Hitoshi, M.; Satoshi, O.; Hideki, S.; Yohsuke, T.; et al. Burning behavior of sedan passenger cars. Fire Saf. J. 2009, 44, 301–310. [Google Scholar] [CrossRef]
  3. Mangs, J.; Keski-Rahkonen, O. Characterization of the Fire Behaviour of a Burning Passenger Car. Part1: Car Fire Experiments. Fire Saf. J. 1994, 23, 17–35. [Google Scholar] [CrossRef]
  4. Katsuhiro, O.; Takuma, O.; Hiroki, M.; Masakatsu, H.; Norimichi, W. Burning behavior of minivan passenger cars. Fire Saf. J. 2013, 62, 272–280. [Google Scholar] [CrossRef]
  5. Quintiere, J.G. Scaling Applications in Fire Research. Fire Saf. J. 1989, 15, 3–29. [Google Scholar] [CrossRef]
  6. Lee, S.R.; Ryou, H.S. An Experimental Study of the Effect of the Aspect Ratio on the Critical Velocity in Longitudinal Ventilation Tunnel Fires. Fire Sci. J. 2005, 23, 119–138. [Google Scholar] [CrossRef]
  7. Jain, S.; Kumar, S.; Kumar, S.; Sharma, T.P. Numerical simulation of fire in a tunnel: Comparative study of CFAST and CFX predictions. Tunn. Undergr. Space Technol. 2008, 23, 160–170. [Google Scholar] [CrossRef]
  8. Banjac, M.; Nikolic, B. Numerical Study of Smoke Flow Control in Tunnel Fires Using Ventilation Systems. FME Trans J. 2008, 36, 145–150. [Google Scholar]
  9. Lee, S.R.; Ryou, H.S. A numerical study on smoke movement in longitudinal ventilation tunnel fires for different aspect ratio. Build. Environ. J. 2006, 41, 719–725. [Google Scholar] [CrossRef]
  10. Ji, J.; Bi, Y.; Venkatasubbaiah, K.; Li, K. Influence of aspect ratio of tunnel on smoke temperature distribution under ceiling in near field of fire source. Appl. Therm. Eng. 2016, 106, 1094–1102. [Google Scholar] [CrossRef]
  11. Park, Y.; Kim, J.; Ryou, H.S. Experimental Study on the Fire-Spreading Characteristics and Heat Release Rates of Burning Vehicles using a Large-Scale Cone Calorimeter. Fire Technol. J. 2018. submitted. [Google Scholar]
  12. McGrattan, K.; Hostikka, S.; McDermott, R.; Floyd, J.; Weinschenk, C.; Overholt, K. Fire Dynamics Simulator Technical Reference Guide Volume 1: Mathematical Model. NIST Publ. 2017. [Google Scholar] [CrossRef]
  13. Bounagui, A.; Benichou, N.; McCarteny, C.; Kashef, A. Optimizing the grid size used in CFD sumulations to evaluate fire safety in houses. In Proceedings of the 3rd NRC Symposium on Computational Fluid Dynamics, High performance Computing Virtual Reality, Ottawa, ON, Canada, 4 December 2003. [Google Scholar]
  14. McGrattan, K.B.; Jason, F.; Forney, G.P.; Baum, H.R.; Hoskikka, S. Improved radiation and combustion routines for a large eddy simulation fire model. Fire Saf. Sci. 2003, 7, 827–883. [Google Scholar] [CrossRef]
Figure 1. Schematic diagram of the basic concepts about varying aspect ratios of tunnels.
Energies 12 00133 g001
Figure 2. Heat release rate (HRR) results from experiments and numerical studies.
Energies 12 00133 g002
Figure 3. Numerical study: (a) computational domain for tunnel, (b) location of thermocouples and analysis planes, (c) cross-section of tunnel for varying aspect ratio and (d) main flow in case of tunnel fire.
Energies 12 00133 g003
Figure 4. Temperature and smoke velocity contours at 1500 s; (ad) represents the temperature distribution where the tunnel aspect ratio is 0.36, 0.72, 1 and 1.39, respectively, (eh) represents the smoke velocities.
Energies 12 00133 g004
Figure 5. Temperature and smoke velocity distributions where it is located below 0.2 m of ceiling for varying aspect ratio at 1500 s. (a) Temperature distribution, (b) Smoke velocities.
Energies 12 00133 g005
Figure 6. Temperatures and smoke velocities below 0.2 m of the tunnel ceiling for varying aspect ratio and distances from fire source at 1500 s. (a) Temperature distribution, (b) Smoke velocity distribution.
Energies 12 00133 g006
Figure 7. Velocity vector on longitudinal direction at 1500 s, (a,b) represent the tunnel aspect ratio of 0.36 and 1.39, respectively.
Energies 12 00133 g007
Figure 8. Temperature and smoke velocity distributions according to the initial time when the smoke exits the tunnel, (ad) represents the various aspect ratio of 0.36, 0.72, 1 and 1.39, respectively. (eh) represents the smoke velocity for varying aspect ratio of 0.36, 0.72, 1 and 1.39, respectively.
Energies 12 00133 g008
Figure 9. Critical velocity considering the aspect ratio of a tunnel with unsteady heat release rate.
Energies 12 00133 g009
Figure 10. Visibility depending on distances, (A) represents on Fire plane, (B,C) represent the planes of 5 m and 10 m away from the fire sources, respectively. The aspect ratios of a, e, and I are 0.36, b, f, and j are aspect ratios of 0.72, c, g, and k are aspect ratios of 1, and d, b, and L are aspect ratios of 1.39.
Energies 12 00133 g010aEnergies 12 00133 g010b
Figure 11. Velocity vector to figure out vortex depending on distances and aspect ratio, (A) represents on Fire plane, (B,C) represent the planes of 5 m and 10 m away from the fire sources, respectively. The aspect ratios of a, e, and I are 0.36, b, f, and j are aspect ratios of 0.72, c, g, and k are aspect ratios of 1, and d, b, and L are aspect ratios of 1.39.
Energies 12 00133 g011aEnergies 12 00133 g011b
Figure 12. Temperature changes over time at the height of 1.7 m.
Energies 12 00133 g012
Figure 13. Temperature distribution at the specific times for the various aspect ratio at the point of where below 0.2 m of ceiling, (Section 1) represents the temperature values from 200 s to 300 s, (Section 2) represents the temperature values from 500 s to 600 s, (Section 3) represents the temperature values from 700 s to 800 s and (Section 4) represents the temperature values from 1000 s to 1100 s to compared to other sections.
Energies 12 00133 g013

