Abstract
Energy supply is becoming an important issue and electricity system reliability is sometimes difficult to ensure. Energy efficiency in buildings in use is a key element in the search for solutions to current energy problems. Many buildings in use can improve their energy consumption performance by implementing simple energy efficiency measures (EEM) in their facilities. After carrying out such actions, savings may be continued with just minimal maintenance. An additional key phase in classical energy studies is to define EEM to be implemented by the intervention of an external energy expert, since resident staff may not have the time, sufficient knowledge, nor experience in EEM. The energy expert intervention is of short duration (several days), and the total cost of the action may be moderate. In this paper, authors present several real examples implemented in three buildings on the Universitat Politècnica de València (UPV) campus after an external energy expert review. Savings, certified using real measured consumption before and after the action, represent around 10% of the total annual energy consumption in the buildings, and the payback of the EEM is approximately a few months.
1. Introduction
Energy consumption is inherent to present human activity. The use of electrical and thermal energy is unavoidable in every area. However, the increase in energy demand is leading to a global energy problem related to the difficulty of supply, and problems regarding greenhouse gas emissions must be also considered [1].
This energy problem must be solved by implementing actions, such as research on newer, more profitable, and cheaper and clean energy sources [2]. At the same time, generation capacity must be increased, while generation costs must be decreased so as to facilitate energy supply. Energy management must be improved from the perspective of energy generation facilities and from the perspective of end users [3]. That is, energy must be used more efficiently and cleverly. This last point is more focused on the users of facilities and is an important area for improvement. Indeed, the identification and implementation of energy efficiency measures (EEMs) in facilities is crucial in the energy efficiency improvement process [4].
The EEMs are classically classified in the literature into different groups:
- Improvements in the characteristics of the building (insulation, infiltrations, openings, etc.) [5].
- Improvements in the equipment used in different processes or end-uses (EUs) (air conditioning, lighting, hot water, etc.) [6].
- Improvements in the use of the equipment by the staff or users and maintenance carried out [7].
- Optimisation of the cost of the energy used. Contract improvements or changes in the use made in response to the price of energy (demand response) [8].
EEMs may be focused in buildings in use on EUs, such as heat ventilation and air-conditioning (HVAC) systems [9,10], ventilation, or lighting [11]. These are the most intensive energy consumption EUs in buildings in use.
EEMs are actions that enable a reduction in energy consumption or cost. However, EEMs provide non-energy benefits (NEBs) as an additional value and they may be considered. These NEBs at the individual level can be reduction in maintenance costs, improvements in comfort and user satisfaction, and improvements in production processes, etc. [12].
For the identification of these EEMs, it is usual to perform energy audits. These studies are carried out in a generalised way in different types of buildings in many countries, even with public aids [13,14]. However, it must be taken into account that these studies have a considerable cost and need a long period of time (usually from six months to a year) for performing them, which in some cases discourages their realisation. In these situations, and considering that these EEMs may not be easily identified—mainly because the building has long been used in a certain manner or because, depending on the type and size of the building, the resident staff are not energy experts or do not have the time to perform the necessary studies—, the need for an occasional external energy expert review is crucial to discover the points that could be improved in the facilities.
This paper shows some examples of identification and implementation of EEMs by an external energy expert. The results and benefits obtained by the proposed EEMs are not estimated; they are certified by using real energy measures before and after the implementation of the action. The duration of the intervention of the energy expert is reduced (several days), and the cost is moderate too. Additionally, this work highlights the importance of performing these actions because, although the benefits of these energy reviews by experts are known, they are not carried out today in many facilities or buildings. These real cases are interesting when reported in the literature.
One relevant EEM and its economic evaluation is shown in three types of buildings at the Universitat Politècnica de València (UPV) campus in Valencia, Spain. In addition, these proposed actions may be generally applied to other buildings.
This paper is organised as follows. Section 2 describes the methodology followed to propose the EEMs. The following three sections present the implemented EEMs in different types of buildings at UPV. In Section 3, an improvement in the HVAC system of a research building is presented and evaluated. Section 4 shows the intervention in a teaching building. Section 5 is focused in the improvement achieved in a greenhouse facility. The discussion of the results is shown in Section 6. Finally, some conclusions are drawn in Section 7.
2. Materials and Methods
Authors consider that classical methodology in an energy saving study in buildings in use follows different phases, as depicted in Figure 1 [7]. The first phase is a billing revision. The contracts of the different supplies and the tariffs available in the regulation are analysed so that the contracts are adapted as much as possible to the real consumption of the building. In the second phase, a review of the installed equipment is carried out. Any equipment with low efficiency is identified to propose possible improvements. The sizing or load factor of the equipment should also be studied since, if they are used with less power than the nominal one, the performance worsens [6]. In the third phase, an analysis of building insulation characteristics is considered, studying thermal leakages and proper insulation considering the building skin. The last phase consists of an analysis of the usage of the different facilities by the staff or users.
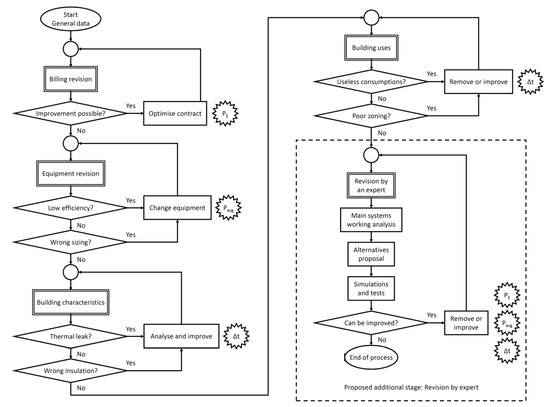
Figure 1.
Diagram of classical methodology in an energy saving study and additional proposed phase.
The authors propose an additional phase, which is an occasional energy revision by an external expert that may identify energy alternative proposals with little or no investment. The methodology followed in this additional phase is depicted in Figure 2. As the analysed facilities have been managed for many years in the same manner by the same staff (who are not experts in energy studies), an external energy expert may perform an energy review, taking into account those EUs where most energy is consumed. The external expert may then identify and conduct the implementation of several EEMs in the facilities. These measures may then be continued with a minimal maintenance programme. The energy expert may identify these EEMs as changes in the operation of equipment or transferring loads from one period to a cheaper period in a time of use (TOU) tariff [15], etc. The expert may also show the staff how to make better use of the facilities.
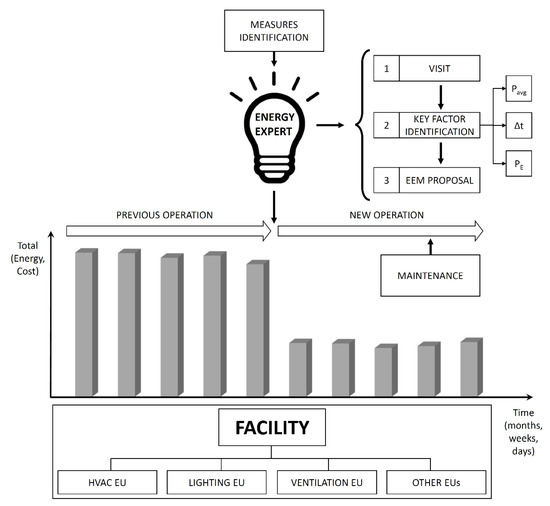
Figure 2.
Diagram of the proposed methodology. HVAC = heat ventilation and air-conditioning; EU = end-uses; EEM = energy efficiency measures.
The key step is to identify the EEMs through which the performance of the facility may be significantly improved, by either reducing the amount of energy consumed in a specific EU (sometimes EEMs may be proposed for different EUs) or obtaining an economic benefit by changing the pattern of consumption.
In a general sense for an EU in a building, the energy cost for a certain time period may be calculated using Equation (1).
where is the total cost of energy consumption in € during the selected time period, is the number of intervals into which the time period is divided, is the average power in kW of each time interval, is the length in h of each time interval, and is the energy price in €/kWh during each time interval.
According to Equation (1), there are three main factors on which EEMs should focus to achieve economic savings:
- (1)
- Power: power reductions may be proposed by controlling connection/disconnection of loads or switching off a percentage of loads.
- (2)
- Time: reducing the TOU of a certain load produces an economic saving, especially in loads with a constant power demand.
- (3)
- Energy price: consuming energy during time periods with a lower price produces an economic benefit. This is especially interesting with electricity tariffs with several periods.
The methodology shown in this paper was implemented in facilities of UPV and shows how significant savings may be obtained. A six-period TOU tariff signed by UPV is used in the evaluation of the energy costs. The term of contracted power, excess of power, and reactive energy are not significantly affected by the measures because UPV has a single contract for the 90 buildings of the campus (with a total contracted power of 16,000 kW). So, the real prices for the energy consumption for the six periods are used.
The following sections present the identification and implementation of an EEM in each analysed building and the benefits obtained. Each example shows an EEM focused on one of the variables referred in Equation (1). The three buildings selected for this study are representative of the different types of buildings on the campus. The energy consumption values presented in this article were measured directly in the different buildings, using an energy management and control system (Derd system) implemented at UPV [15]. Similar measures with similar savings have been implemented in other buildings following the exposed methodology.
3. EM at the Polytechnic City of Innovation Building 8G
The Polytechnic City of Innovation building 8G is a large research building with many laboratories and offices distributed among its 15,304 m2. Some 610 researchers work in the building. The HVAC system is the largest EU consumer and represents 55% of total electrical consumption. The HVAC system is a four-tube centralised system with three chillers and more than 1000 fan coils and 50 air handing units (AHUs). Figure 3 shows a typical load curve for building 8G on working days in different seasons. To avoid instantaneous peaks in the figures, the quarterly mean power is used to represent the consumption.
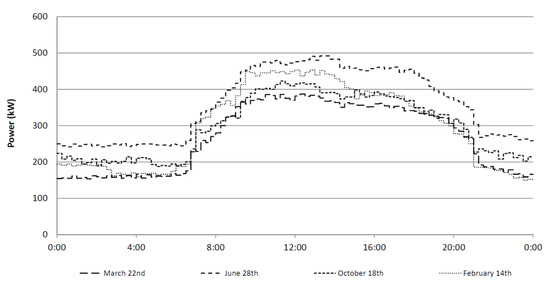
Figure 3.
Building 8G consumption on working days in different seasons before the EEM.
In Table 1, weather conditions for represented days (corresponding to different seasons of the year) in building 8G are indicated.

Table 1.
Weather conditions in Valencia for represented days in building 8G.
Fan coils in 8G were initially programmed to work continuously, that is, the fans did not stop even when the set point temperature was reached, and only the four-way valves opened and closed in function of the room temperature. The external energy expert reviewed the building and proposed an EEM—namely, that the operating mode of the fan’s coils be changed so that the fan stops once the set point temperature is reached and, additionally, that the thermostats are reprogrammed so that users can switch the fan coil on and off. One test was conducted in an area of the building, and it was found that the measure did not affect the comfort. The renewal of air in the different rooms was done with a separate fan, so the proposed measure does not affect the contribution of clean air to the rooms. This EEM produces great savings in non-extreme temperature seasons (spring and autumn). Savings in summer and winter are moderate due to the extreme weather (when the system barely reaches the set temperature in the different areas). It may be considered by the number of installed fan coils that this EEM is focused on in the term in Equation (1), that is, the average power demand of fan coils, to obtain a reduction in the energy cost.
Figure 4 compares the load curve for similar days (Table 1) before and after the proposed EEM for a weekday, and Figure 5 shows results for Saturdays. Significant savings are obtained for both types of days. The proposed EEM has no impact on Sundays as most of the fan coils were initially turned off according to the HVAC system schedule.
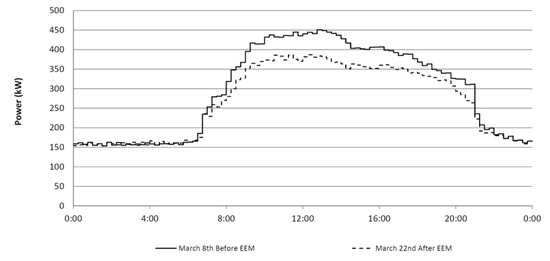
Figure 4.
Building 8G consumption before and after the EEM (working days).
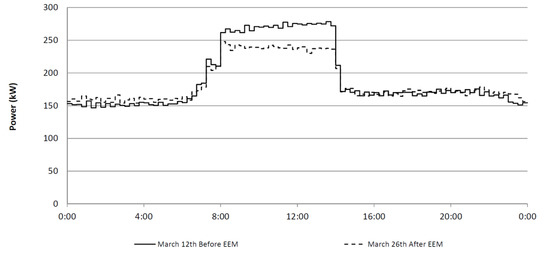
Figure 5.
Building 8G consumption before and after the EEM (Saturdays).
Some 100 kW at certain periods are saved with this EEM, which represents about 14% on weekdays and 5% on Saturdays for days with similar weather conditions. Figure 6 shows the impact of this action on daily energy costs. Saturdays are not represented because they have much lower energy consumption.
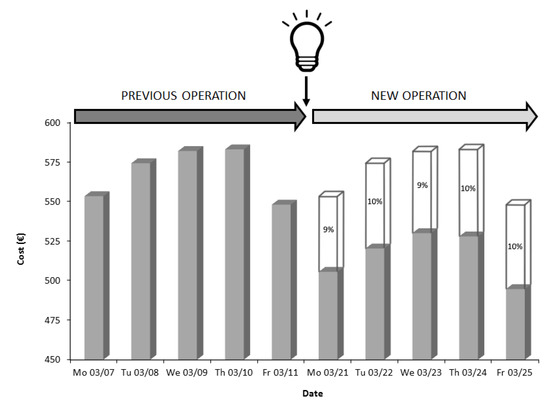
Figure 6.
Building 8G energy costs before and after the EEM.
The annual total energy saved with this EEM is 161,870 kWh, considering the six-period TOU tariff at the UPV with lower prices at night and higher peak prices (in some seasons the price of the electricity in peak periods, from 8 a.m. to 12 p.m., is 2.5 times the price in valley periods), and the total annual saving is €14,178. This EEM will remain over time, at no additional cost, as the program is permanently stored in the equipment, and the reduction in the maintenance of the fan coils may be considered as an NEB.
4. EEM at the School of Telecom Engineering Building 4P
The School of Telecom Engineering building 4P has a two-tube centralised HVAC system supplying a total area of 6353 m2 containing 380 users (teachers and students). The system is composed of two chillers, 24 air AHUs, and 75 fan coils. Initially, the AHU fans were programmed to be on continuously from 7 a.m. to 10 p.m. as the general schedule of the HVAC system.
After the external energy expert review, the EEM proposed to optimise the operation of the HVAC system was to stop the AHU fans when the room temperature reaches the set temperature [8]. This is possible because each individual room is small (around 30 m2) and is conditioned with an independent AHU. The thermostat is programmed so that the fans start again when modifying the set temperature and so that users may directly manage the fan status.
To evaluate the reliability of the proposed EEM, in a first step, only the operation of two AHUs were modified to check the acceptance of the new AHU operation by users and staff. This was done to avoid large investments and with the intention of expanding later to the rest of the AHUs. To calculate the obtained savings, a comparison was made between the operation of the modified AHUs with the original AHUs installed in similar rooms during the same period. The operation of the modified AHU was taken as a base, assuming a consumption of 1 kW, and the results were then applied to total AHU consumption.
The working pattern during some days of April (heating mode) in AHUs with the original operation is shown in Figure 7. A continuous operation of the fan is shown, independently of the temperature (the same happens during cooling mode operation).
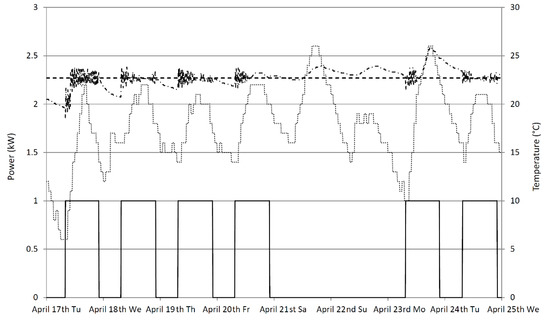
Figure 7.
Air handing units (AHU) ventilation operation without the EEM.
The operating mode was modified as described above in two AHUs so that after the EEM the fans are not permanently working during the day. Figure 8 and Figure 9 show the new operation profile for both AHUs for the same period.
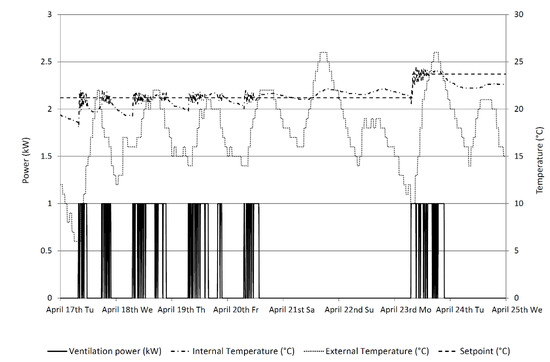
Figure 8.
CL-3-Classroom 1.4 AHU ventilation operation with the EEM.
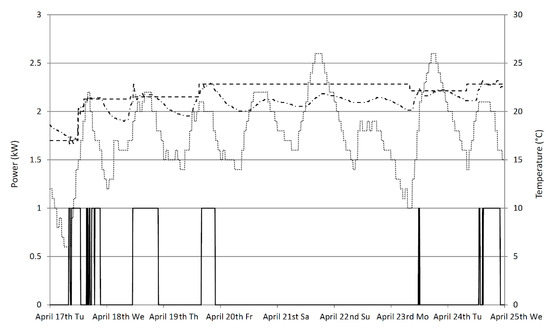
Figure 9.
CL-5-Lab 2.3 AHU ventilation operation with the EEM.
Ventilation TOU is substantially reduced as shown. The reduction depends on the temperature set in the room, use of the room, season, etc. This EEM affects the term in Equation (1), that is, the time during which each AHU fan is operating.
In the modified AHUs, the saved energy represents about 47% of the AHU consumption in March, 70% in April, and 34% in June. To extrapolate energy and cost savings for all the AHUs, a total consumption of 100 kW is considered. The total impact of this action on energy costs is shown in Figure 10.
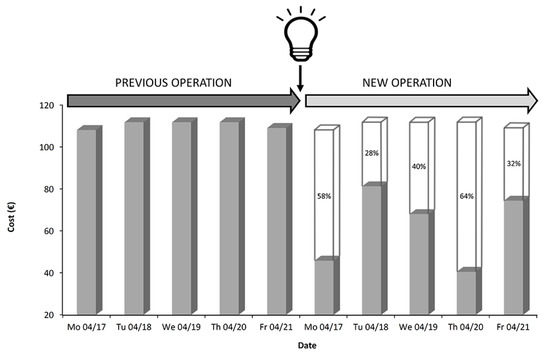
Figure 10.
AHU energy costs for ventilation in building 4P with and without the EEM.
The average annual saving is about 30% of the total energy consumed for ventilation by the AHUs annually. This corresponds to 51,460 kWh/year, which represents an annual savings of €4525. Additionally, the noise reduction in the classrooms and the consequent improvement in users’ comfort may be considered as an NEB.
5. EEM at Greenhouse Building 8I-8J
Building 8I–8J is a series of greenhouses and growth chambers with a total area of 1488 m2 and 30 users. Two basic EUs are considered for building 8I–8J: the 350 kW HVAC system and the 130-kW lighting system. Both EUs are mutually dependent due to the heat emitted by the lights when they are turned on. Total consumption in the building is temperature-dependent and has the same pattern every day of the year. Consumption was analysed by an external energy expert in this building (which had no resident energy engineer) in order to improve the energy efficiency in these facilities and achieve significant savings (as the EEMs may be implemented every day of the year).
Initially, the load curve was always between two power levels. Night-time consumption was about 80 kW from 00:00 a.m. to 7:00 a.m. The load curve varied during daylight between 300 kW and 500 kW, depending on the season (consumption in summer is higher than in winter) because of the external temperature and growth lights (Figure 11).
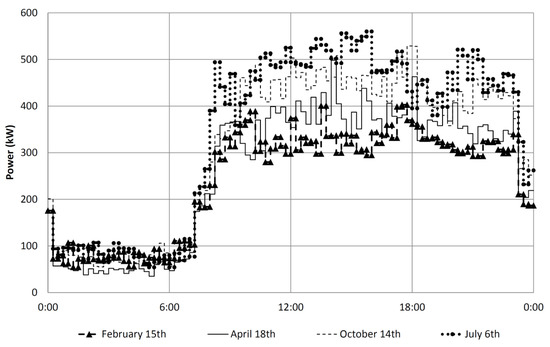
Figure 11.
Greenhouse building 8I—8J consumption before the EEM in different seasons.
In Table 2 weather conditions for represented days (corresponding to different seasons of the year) in building 8I–8J are indicated.
Table 2.
Weather conditions in Valencia for represented days in building 8I–8J.
As mentioned, external light and weather have a strong influence in the HVAC total consumption. Due to this fact, it was proposed, together with the greenhouse agronomist and considering the growth cycle of the plants, to change the timetable for both EUs (lighting and HVAC system). After the energy expert review and considering the six-period TOU tariff at the UPV, a shift of consumption from peak periods to valley periods was proposed to achieve significant savings.
The first EEM proposed was an earlier time for starting greenhouse lighting, turning it on at 6:00 a.m. instead of 7:00 a.m. and turning it off at 10:00 p.m. instead of 11:00 p.m. This moves one h of peak consumption to the valley period.
Secondly, the lighting of the growth chambers was moved two h forward, from 6:00 a.m. to 10:00 p.m. instead of 8:00 a.m. to 12 p.m., thus moving two h from peak to valley periods.
Finally, a change was proposed for the summer period (from July until September). In this season, the greenhouse lighting was initially turned off as unnecessary. The proposed EEM extended the length of this period by 15 days, which the greenhouse agronomist considered an adequate period, starting from the 15th of June. Figure 12 shows the consumption before and after the EEM for similar days (Table 2). The proposed EEM mainly affects the term in Equation (1), that is, the price of energy, by shifting some energy consumption from expensive periods to cheaper ones.
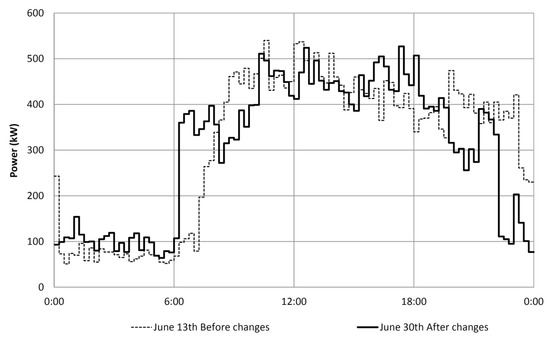
Figure 12.
Greenhouses building 8I–8J consumption before and after the EEM.
The impact of this action on electricity costs is shown in Figure 13.
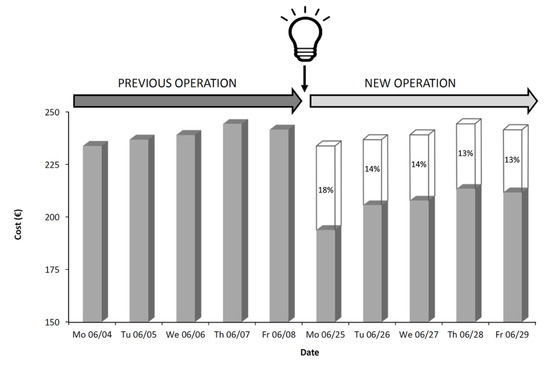
Figure 13.
Greenhouses building 8I–8J energy costs before and after the EEM.
Consumption considering the changes in the proposed scheduling in the EEM was similar (around 7,500 kWh), but the average savings are about €40 per day (5% of costs) due to the TOU tariff. Taking into account that there are no savings on weekends (since every h is a valley period), the total annual savings considering all the changes proposed by the energy expert are 21,164 kWh/year or €2021. Additionally, the improvement in the process in the greenhouse by reducing operation time may be considered as an NEB.
6. Discussion
In this paper, the operation of buildings used in different and specific ways was improved by an external energy expert. The analysed buildings, by their nature, do not have staff dedicated explicitly to analysing consumption. Therefore, the action of an external expert in identifying and proposing EEMs that will endure over time with only a slight maintenance improves energy consumption in the buildings. Different EEMs related to different EUs (ventilation system, lighting, etc.) have been presented. The EEMs consist of reducing or moving the period of use of fans in fan coils, AHUs, and lighting systems. EEMs have been implemented in different types of buildings and produced significant savings in the total energy consumed. To calculate annual savings, available data from months before and after the implementation of the proposed EEMs has been used, as authors mentioned, using the Derd system, which measures quarter hourly energy consumption in analysed buildings [15]. Table 3 shows a summary of the annual results achieved with the described EEMs.
Table 3.
Summary of annual results in the analysed buildings after EEMs.
As shown in Table 3, the payback time in the proposed EEMs is minimal, due to the little investment required to implement the proposed EEMs—the only costs being the energy expert consultancy cost (generally inexpensive given the rapidness of the review) and the cost of reprogramming the equipment.
The use of thermostats that enable the fans to be turned on and off directly by the user, the control of the fans of the AHUs, and the application of the proper schedules in the different air conditioning equipment are EEMs that can be implemented in general in this type of buildings.
Thus, the importance of the role of an occasional external energy expert review is proven. The expert must be able to find these potential improvements and give the right advice to the building staff. It is worth noting that by the nature of the building (size, use, sector, etc.) resident staff are not generally specialised in energy efficient programs.
7. Conclusions
This study has shown that significant savings can be achieved with simple EEM, which will endure for many years with only slight maintenance. These savings can be obtained in several types of buildings in use without major changes in processes.
The occasional participation of an external energy expert is necessary to identify and define these energy saving actions in buildings where an energy audit has never been performed or has not been done for a long time. The duration of the intervention of the energy expert is reduced (several days) and the total cost of the implemented measure may be moderate, too. Staffs in these facilities often do not have the time or experience to be able to define the EEM. Once the actions are defined and implemented, the staff is responsible for maintenance. The role of this external energy expert is crucial, especially in medium or small facilities where finding a resident energy expert is difficult. This presents an advantage over performing an energy audit that requires more time and higher cost, and this benefit is that the revision by an expert may be contracted and an audit may not be.
The results and savings presented by the proposed EEMs in this paper are not estimated; they are certified by using real energy measures before and after the implementation of the action. Additionally, this work highlights the importance of performing these occasional reviews because, although the benefits of these actions are known, they are not carried out in many facilities or buildings today.
This enables achieving an increased energy performance and economic savings. In the examples described in this paper, savings close to 10% of the annual consumption were achieved in different types of buildings at the UPV and the payback of the proposed actions are approximately a few months.
Author Contributions
In this paper G.E.-E. participated in the investigation and the preparation of the paper. C.R.-B. made a valuable contribution in the preparation of the paper and figures. C.R.-P. and X.S.-G. participated in the development of the research.
Funding
This research received no external funding.
Acknowledgments
This research work has been made possible with the support of the Programa de Apoyo a la Investigación y Desarrollo (PAID-06-12) of the Universitat Politècnica de València (Spain) and the GV/2015/068 (support for I+D projects from emerging research groups).
Conflicts of Interest
The authors declare no conflict of interest.
References
- Zhang, Y.; Kang, J.; Jin, H. A Review of Green Building Development in China from the Perspective of Energy Saving. Energies 2018, 11, 334. [Google Scholar] [CrossRef]
- Treado, S.; Chen, Y. Saving Building Energy through Advanced Control Strategies. Energies 2013, 6, 4769–4785. [Google Scholar] [CrossRef]
- Pérez-Navarro, A.; Alfonso, D.; Ariza, H.E.; Cárcel, J.; Correcher, A.; Escrivá-Escrivá, G.; Hurtado, E.; Ibáñez, F.; Peñalvo, E.; Roig, R.; et al. Experimental verification of hybrid renewable systems as feasible energy sources. Renew. Energy 2016, 86, 384–391. [Google Scholar] [CrossRef]
- Roldán-Blay, C.; Escrivá-Escrivá, G.; Roldán-Porta, C.; Álvarez-Bel, C. An optimisation algorithm for distributed energy resources management in micro-scale energy hubs. Energy 2017, 132, 126–135. [Google Scholar] [CrossRef]
- Martinopoulos, G.; Kikidou, V.; Bozis, D. Energy Assessment of Building Physics Principles in Secondary Education Buildings. Energies 2018, 11, 2929. [Google Scholar] [CrossRef]
- Marchia, B.; Zanonia, S.; Mazzoldia, L.; Reboldib, R. Product-service System for Sustainable EAF Transformers: Real Operation Conditions and Maintenance Impacts on the Life-cycle Cost. Procedia CIRP 2016, 47, 72–77. [Google Scholar] [CrossRef]
- Escrivá-Escrivá, G.; Santamaria-Orts, O.; Mugarra-Llopis, F. Continuous assessment of energy efficiency in commercial buildings using energy rating factors. Energy Build. 2012, 49, 78–84. [Google Scholar] [CrossRef]
- Escrivá-Escrivá, G. Basic actions to improve energy efficiency in commercial buildings in operation. Energy Build. 2011, 43, 3106–3111. [Google Scholar] [CrossRef]
- Rinaldi, S.; Flammini, A.; Pasetti, M.; Tagliabue, L.C.; Ciribini, A.C.; Zanoni, S. Metrological issues in the integration of heterogeneous lot devices for energy efficiency in cognitive buildings. In Proceedings of the 2018 IEEE International Instrumentation and Measurement Technology Conference (I2MTC), Houston, TX, USA, 14–17 May 2018. [Google Scholar] [CrossRef]
- ASHRAE. Ventilation for Acceptable Indoor Air Quality, Standard 62-1999. In American Society for Heating, Refrigerating and Air-Conditioning Engineers; ASHRAE: Atlanta, GA, USA, 1999. [Google Scholar]
- United Nations Industrial Development Organization (UNIDO). Training Program on Sustainable Energy Regulation and Policymaking for Africa. Available online: http://www.unido.org/en/what-we-do/environment/energy-access-for-productive-uses/renewable-energy/selected-projects/training-package.html (accessed on 14 March 2019).
- Ryan, L.; Campbell, N. Spreading the Net: The Multiple Benefits of Energy Efficiency Improvements; IEA Energy Papers, No. 2012/08; OECD Publishing: Paris, France, 2012. [Google Scholar] [CrossRef]
- Magrinia, A.; Gobbib, L.; d’Ambrosio, F.R. Energy Audit of Public Buildings: The Energy Consumption of a University with Modern and Historical Buildings. Some Results. Energy Procedia 2016, 101, 169–175. [Google Scholar] [CrossRef]
- Marrone, P.; Gori, P.; Asdrubali, F.; Evangelisti, L.; Calcagnini, L.; Grazieschi, G. Energy Benchmarking in Educational Buildings through Cluster Analysis of Energy Retrofitting. Energies 2018, 11, 649. [Google Scholar] [CrossRef]
- Escrivá-Escrivá, G.; Segura-Heras, I.; Alcázar-Ortega, M. Application of an energy management and control system to assess the potential of different control strategies in HVAC systems. Energy Build. 2010, 42, 2258–2267. [Google Scholar] [CrossRef]


© 2019 by the authors. Licensee MDPI, Basel, Switzerland. This article is an open access article distributed under the terms and conditions of the Creative Commons Attribution (CC BY) license (http://creativecommons.org/licenses/by/4.0/).