Abstract
Climate change mitigation strategies offer significant societal co-benefits such as improvement in public health, air quality, local economy, and even safety. By considering these co-benefits during the transportation planning process, local governments would be able to link their local appreciate mitigation actions into the Sustainable Development Goals (SDGs), where diverse objectives should be achieved simultaneously. This study first clarifies the co-benefits approach to climate change mitigation in the transport system, by introducing an integrated multiple-impact framework known as A-S-I (Avoid-Shift-Improve) to evaluate the co-benefits. Thereafter, it applies the quantitative modeling approach to assess public health and environmental co-benefits of the implementation of the Tehran Transportation Master Plan, “the TTMP” in the city of Tehran, Iran, which includes targeted interventions such as shifting from private vehicles to the urban transport system, improving vehicle technologies and introducing alternative fuels. The results from the application of “the TTMP” reveal a significant reduction of CO2 and other local air pollutant emissions by 12.9 and 1.4 million tons, respectively, prevention of about 10,000 mortality cases, and more than USD 35 million savings by 2030.
1. Introduction
The planning of the transport system in cities is entirely affected by climate change concerns. A fundamental transformation will be needed in the transportation sector, such as decarbonization of the fleet through clean technologies and non-motorized transport, besides clean power generation for electric cars, if governments worldwide, particularly in developing countries, aim to achieve the Paris Agreement targets and the Sustainable Development Goals (SDGs) [1]. On the other hand, urban transport is vital to achieve several of the SDGs, particularly in developing countries, such as good health (goal 3), affordable and clean energy (goal 7), and sustainable cities (goal 11), besides climate change (goal 13). In developed Asian countries, energy services such as lighting, heating, cooling, cooking, and mobility represent the main sources of carbon emissions [2,3]. For example, in cities such as Seoul and Tokyo, commercial, and residential sectors account for two-thirds of the final energy consumption, which is mostly influenced by the spatial organization and urban density [4]. However, in the rapidly growing Asian megacities, such as Shanghai and Beijing in China, the power and industrial sectors are the major contributors to global carbon emissions. Nevertheless, in all these cities, transportation represents a significant part of the emissions [5].
The concerns of policymakers in Asian cities dealing with the transport sector concentrate on the implications of the use of energy, particularly the severe air pollution-related health impacts on their societies. Therefore, the benefits of the implementation of the climate mitigation strategies in the transport sector include the improvement in both public health and air quality and also savings from hospital admissions and premature mortality; all can be addressed as the co-benefits of climate mitigation in this sector [6,7,8].
“The term ‘co-benefits’ expresses the integration between climate change mitigation and socio-economic systems” [9]. For policymakers and local governments seeking to develop an appreciate climate change mitigation plan in the transport sector, the application of the co-benefits approach appears to have significant potential, as suggested in the literature [10,11,12]. However, further conceptual clarification on an operational definition of co-benefits is required among different scholars, governments, and stakeholders [13,14,15,16].
In the transport sector, climate co-benefits can be achieved from a series of demand-side policy interventions and infrastructure such as vehicle fleet renewal programs, better traffic management, environmental standards as well as supply-side resilience practices [17]. The efforts that have been done to address this issue were presented by different scholars who showed that the investment in public transport in the big cities would achieve significant gains in co-benefits due to local emissions reduction [18,19,20,21,22,23,24,25,26,27,28]. For example, in [29] the authors studied the environmental impact of urban transport in Eastern Asia and argued that how the earlier decision prioritizes public transportation, and non-motorized transport investment can bring long term co-benefits in this area. In [30] the authors explored how the appreciate policy such as CNG (Compressed Natural Gas)buses can significantly reduce SO2 and PM10 emissions and increase the mitigation potential of GHG (Greenhouse Gases) emissions in the city of Shenyang in China. The additional public health co-benefits associated with the control air pollution measures deployed by the Chinese State council was estimated by [31]. In [32] the authors estimated the number of prevented deaths resulting from the reduction in particle material emission due to the inspection and maintenance of vehicle fleets in the city of Bangkok, Thailand.
From the analytical perspective, methodologies to evaluate climate co-benefits in the transport sector vary depending on how they represent the interactions between this sector and society. Numerous tools have been designed and developed for the evaluation of co-benefits at the national level; however, just a few have been developed for the sector-based assessment, particularly the transport sector. For example, the MESDC (Ministry of Environment and Sustainable Development of Colombia) has developed a quantitative tool to evaluate the climate co-benefits associated with the national low-carbon development strategies [33]. The UNDP (United Nations Development Program) has introduced the NAMA-SDE (Nationally Appropriate Mitigation Action Sustainable Development Evaluation) tool, which was developed for the Nationally Appropriate Mitigation Action (NAMA) developers and policymakers looking for co-benefits and synergies among different goals [34]. The Government of Japan has introduced a “Manual for the Quantitative Evaluation of the Co-Benefits Approach to Climate Change” classifying three tiers of assessment methodologies, including using real data, measurement data, and specific equations, which allow to quantify the climate co-benefits type projects, including water quality improvement and waste management [35]. All the tools reviewed above are useful in assessing and addressing the co-benefits of climate change mitigation. However, the top-down methodologies used in all of them present an aggregate estimation of co-benefits at the regional level, which reflects a limitation on sectoral analysis.
Following the recent progress in the development and application of the “co-benefits approach” in the transport sector, this study aims at presenting a quantitative assessment framework for assessing the climate co-benefits of a low-carbon urban transport system and addressing policy interventions to improve such benefits during the execution process in transport plans. The study contributes to sustainable transportation literature in several aspects. First, the study provides a framework (A-S-I, Avoid-Shift-Improve, see below) for the consideration of co-benefits in the urban transport sector. Second, based on the framework, it develops a model to quantify co-benefits in the urban transport system, thereby evaluating the impacts of bottom-up actions and plans to tackle climate change and pollution. Third, the study applies the model to a real case in Tehran, Iran’s capital, which is suffering from an inefficient and underdeveloped transport system. This paper is structured as follows. Section 2 provides an overview of the climate co-benefits approach in the urban transport sector, introducing the Avoid-Shift-Improve (A-S-I) approach. Section 3 and Section 4 respectively describe the framework and its application in assessing the expected co-benefits from the implementation of a strategic plan for the public transport sector in Tehran.
2. Methodology
The methodology developed in this study introduces a quantitative analysis modeling framework for the simplified representation of the transport sector with an institutional evaluation to evaluate not just the magnitude of emission reductions from local air pollution and carbon emissions but also to determine benefits from improving the air quality and its impact on public health. It uses the A-S-I (Avoid-Shift-Improve) approach which set the standard for low carbon transport modeling and covers the city-wide transport system, thus impacts of multiple of transport choices can be assessed (see Figure 1). The A-S-I approach is a bottom-up framework which can be used as a scenario planning tool in assessing the co-benefits of climate policies in the transport sector [36,37]. Here, the co-benefits refer to the reduced local air pollution and improved public health, which can result from the GHG emission reductions, simultaneously [38]. The A-S-I helps to determine the right action plans and policy interventions in achieving a sustainable urban transport system [39].
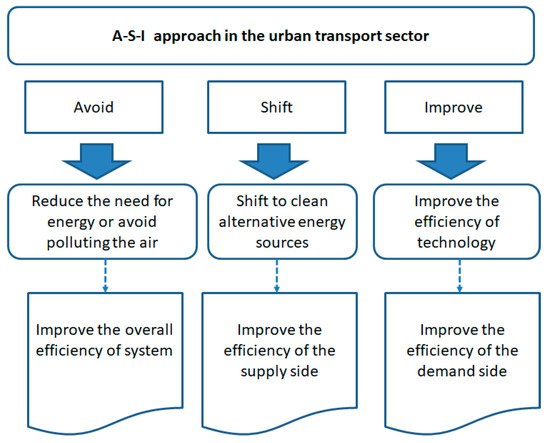
Figure 1.
The Avoid-Shift-Improve (A-S-I) framework [37].
2.1. Overall Estimation of Emissions
The mathematical representation of the A-S-I method is as follows [37]:
where;
: Total annual emissions, including GHG emissions and air pollution (t);
: Total passenger-kilometers traveled (PKM);
: Percent share per each mode (%);
: Energy intensity per each mode (km/liter or km/kWh);
: Emission factor of each pollutant per each fuel type (g/liter or g/kWh);
m, e, and t refer to the transport mode (i.e., urban bus, train, private car, etc.), fuel type (i.e., gasoline, gas oil, CNG, etc.), technology type (i.e., internal combustion engine, hybrid engine, EV (Electric Vehicle), etc.) and specific time period, respectively.
In the above equation, A, S, and I refer to the Avoid-Shift-Improve components. A represents the demand for mobility, which can be avoided through effective transport demand management and land-use planning. S indicates a modal shift from the most energy-intensive transport modes (i.e., private cars, motorcycles, and so on) to the least energy-intensive modes, including public transport modes such as public buses or metro. Finally, I focuses on improving the energy efficiency of the vehicle technology by adopting regular inspection or replacing it with new and efficient technology. Hence, the most suitable mitigation scenario for reducing the emissions of harmful gases and particle materials can be developed by intervening in each component (A, S, and I).
In Equation (1), “A”, the growth in the demand for mobility (per capita passenger-kilometers) over time, represents the logistic function [40]:
is estimated on the basis of the average speed of mobility and time budget and represents the saturation level of demand for mobility in cities. A regression analysis can be performed to estimate the statistical coefficients of and , using the historical mobility demand data.
Finally, the potential reduction by each scenario can be estimated by using the following formula:
where, and represent the total emissions of each pollutant in the base and target scenarios in the time period t, respectively.
2.2. Public Health Co-Benefits
The harmful pollutants calculated by Equation (1) have an adverse impact on public health, which can be estimated by using the following formula [41]:
where:
: Health impact function of each pollutant i.
: Relative risk of each pollutant i at the exposure category j such as respiratory and cardiovascular mortalities.
In general, the values of RR for each exposure category can be estimated by the help of Concentration-Response (CR) function which describes the risk of particular health disease as a function of the pollutant concentration in a certain exposure time [42,43,44,45]. Recommended RR per 10 μg/m3 for particulate matter, ozone, nitrogen dioxide, and on all-cause mortality in the long term and short-term and exposures were given by [46]. The expected number of casualties can be calculated as follows [38]:
where Dj, Pj, and refer to the mortality rate of disease (i.e., deaths/10,000 people), the share of the population in the exposure category, and the concentration of pollutant, respectively. The concentration of each pollutant () can be calculated by using the following formula:
where, can be calculated from Equation (1). , H, and L, refer to the wind speed (m/s), the height (m), and the length (m) of the selected location, respectively. Figure 2 shows the calculation flow used in this model.
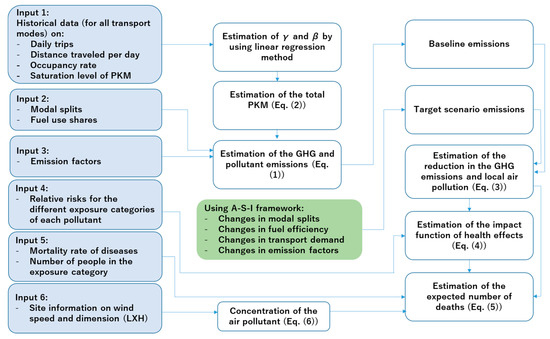
Figure 2.
The calculation steps in the model.
The model shows a linear representation of the transport system in a city, from which the implementation of policies can be evaluated in terms of its carbon and local air pollution emissions and also public health impacts. It can be conceptualized in the flow chart shown in Figure 2. The blue highlighted area refers to the input data needed for the baseline evaluation and the green box to the evaluation through scenario input. It is intended to provide a first-order screening of possible options that can be further investigated using more sophisticated data, which have a better representation of travel demand tailored to the city in question. The main idea is to establish a baseline inventory of vehicles and usage data in the city to assess the status of emissions (Input 1–3). The next step is to explore options to develop goals through evaluating co-benefits of options, using the A-S-I approach to examine co-benefits of different policies, which are highlighted in the green box.
3. Results and Discussion
3.1. The Study Area: Tehran Transport Sector
The population in Tehran has increased sharply from 4 million in 1970 to 8.3 million in 2018, with an outer metropolitan population of 16 million inhabitants (see Figure 3). Mobile sources, including private cars, public and private buses, and motorcycles and motor-vans contributed to 90% of Tehran’s total air pollution due in part to their low efficiency [47,48]. For example, motorcycles produce CO emission rates of up to seven times the limits set for Euro-3 certification [49]. The critical pollutants responsible for most of the unhealthy air quality days in Tehran are shown in Figure 4 [50]. The critical pollutants responsible for most of the unhealthy air quality days in Tehran have been identified: they are carbon monoxide (CO), total hydrocarbons (THC), oxides of nitrogen (NOx), and particulate matter (PM10), with shares from mobile sources estimated at 99%, 71%, 70%, and 69%, respectively. Table 1 shows the share of the different fleets in total mobile source air pollution in Tehran [50]. The contribution of private cars, taxis, and motorcycles to air pollution was estimated at around 50% of the mobile sources.
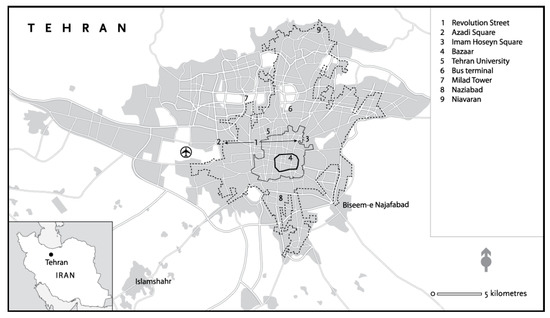
Figure 3.
Tehran metropolitan area (adopted from [51]).
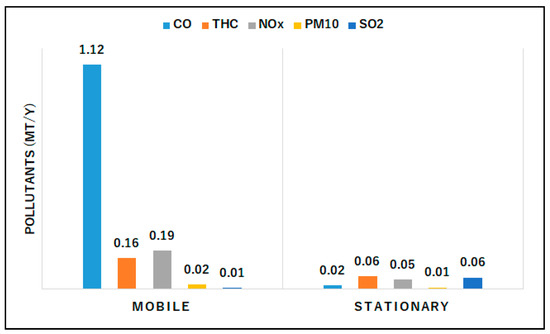
Figure 4.
Tehran’s mobile and stationary sources (i.e., industries, power plants, oil refinery, etc.) of air pollution [50].

Table 1.
Share of vehicle fleets in mobile air pollution source in Tehran (%) [50].
3.2. Baseline Scenario
The baseline scenario was developed to show how the future of Tehran’s transport system might look based on the perpetuation of current policies. Table 2 shows the modal splits, fuel use, and efficiency in the urban transport sector in Tehran. Historical data on daily trips and distance traveled by each mode of transport were collected from the SCI (Statistical Center of Iran) [52], which are given in Table 3.
Table 2.
Modal splits, fuel use and efficiency in the urban transport sector in Tehran [52].
Table 3.
Daily trips and distance traveled by each mode of transport in Tehran [52].
Taking natural logarithms of Equation (2) and using the linear regression method to the historical data of 1980–2015, the estimated values of and at three levels of saturation (high, medium, and low) for each mode of transport are given in Table 4.
Table 4.
Estimated values of and in Equation (2) for the different saturation levels .
The results of the multiple linear regression model indicate that ln and ln are significant at a 5% significance level. The coefficient of determination, R2, is more than 0.992 in all cases. Furthermore, the F-statistic reaches the 1% significance level in all cases. These results show that the model can adequately explain travel demand in Tehran.
Figure 5 represents the projection of the travel demand in Tehran, which is expected to increase steadily to 180 Billion Passenger-Kilometers (BPKM) in 2030.
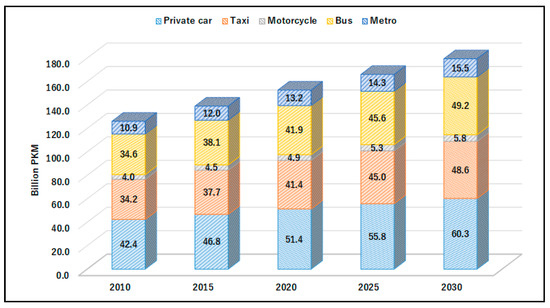
Figure 5.
Baseline projection of travel demand estimated at the maximum sat. levels.
The total GHG emissions increase to 17.4 Mt CO2-eq in 2030, as reported in Table 5. The significant rise in CO emissions can be mainly attributed to the high average age of the fleet, inefficient technologies, and traffic congestion in this city [53]. The emission factors used in the estimation of the CO2 and air pollutant emissions are given in Table 6.
Table 5.
Air pollution and GHG emissions in Tehran’s transport system 2010–2030.
Table 6.
Emission factors for the different vehicle types in Tehran (g/kgfuel).
As a direct result of the incremental growth of private vehicles, the emissions of air pollutants, particularly PM10, CO, and NOx in the transport system in Tehran is predicted to increase by a factor of 1.4 from 2010 to 2030. The associated air pollution problem of private transportation modes have had adverse effects on the health of the general public, with a marked rise in the incidence of respiratory and heart diseases. Therefore, there is a real need for the municipal government of Tehran to have the transport planning framework to make a sustainable decision and prepare the practical mid-term solutions for the transportation issues in the future.
3.3. Tehran Transportation Master Plan
So far, policymakers have developed a series of initiatives to deal with the severe challenges of air pollution in Tehran. For example, 250,000 spark-ignition engine vehicles were decarbonized through engine deposit removal by the Iranian Department of Environment, to reduce the atmospheric pollutant emissions such as HC and CO emissions [54]. More recently, Tehran’s central area has been added to the list of the traffic restricted zones, limiting the entry of private vehicles on weekdays. However, these measures have not been adequate to reduce pollution significantly, and Tehran remains a heavily polluted city. The Municipal Government of Tehran has launched a comprehensive plan, named “Tehran Transportation Master Plan (TTMP)” which outlines an integrated clean transportation system to tackle GHG emissions and air pollution in 2030 [55,56]. In the following section, we will examine the potential co-benefits and impacts of the TTMP, using the A-S-I modeling framework.
The A-S-I actions of the TTMP and their impacts on Tehran’s transport system are shown in Table 7. According to the TTMP, the mass transit system accounts for 70% modal share of total Tehran’s daily trips in 2030. To this aim, the total length of Tehran’s urban rails and Bus Rapid Transit system increase to 514 and 202 km, respectively. Moreover, the share of CNG (Compressed Natural Gas) buses increases from 45% to 100% in the total fleet. Based on this plan, preventing the unauthorized entry to the Restricted Traffic Zone (RTZ), using ANPR (Automatic Number Plate Recognition) systems and introducing the Non-Motorized-Transportation (NMT) such as bike routes will result in reducing about 4.3 BPKM traveled by private vehicles in this city. According to the TTMP, a modal shift from private modes to the public transport systems, including the metro and BRT, can help reduce energy consumption, CO2 emissions, and the pollution load in the city of Tehran. On major streets in this city with relatively high traffic congestion, public transportation modes, like such as buses and trains, are more fuel efficient. Therefore, improving BRT priority lanes in the city of Tehran will increase energy efficiency in transportation by reducing traffic congestion and the travel speed and comfort level of the passengers will also be improved. As a consequence, the implementation of the TTMP will reduce traffic congestion by increasing the average travel speed and passenger mobility on major streets in this city.
Table 7.
The actions and initiatives of the Tehran Transportation Master Plan (TTMP) [56].
Figure 6 shows the comparison of transport mode shares between the baseline scenario and the TTMP in 2030. The amount of fuel-saving in the urban bus fleet was estimated based on an average fuel intensity of 25 L/100 km and an average mileage of 250 km/day [59]. The most fuel saving is expected from reducing about 2.94 billion liters in gasoline consumption by cars and taxies. The expected reductions in CO2 emissions and air pollution from the TTMP in Tehran’s transport system in 2030 is depicted in Figure 7. The expected decline in air pollutant emissions is identified as the co-benefit obtained from the implementation of the TTMP (see Table 8).
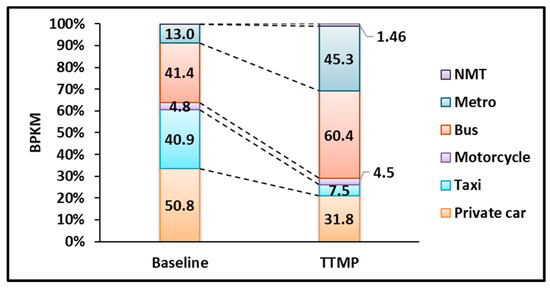
Figure 6.
Comparison of transport mode shares between the baseline scenario and the TTMP in 2030.
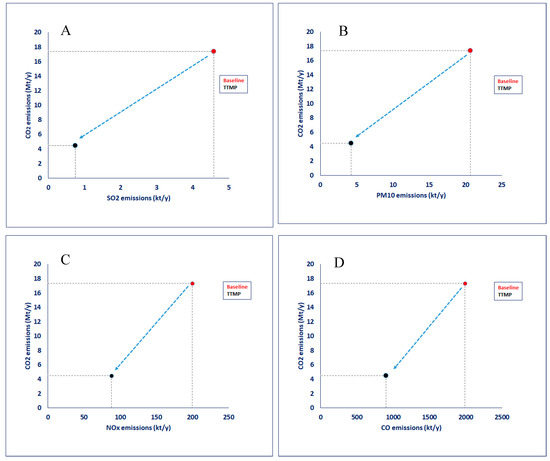
Figure 7.
Expected reduction in CO2 emissions and air pollution from the TTMP in 2030 (A: CO2 Vs. SO2; B: CO2 Vs. PM10; C: CO2 Vs. NOx and D: CO2 Vs. CO).
Table 8.
Expected GHG emissions and pollutants reductions from the TTMP in 2030.
Besides emission reduction, utilization of efficient urban transportation in Tehran is associated with public health benefits. The estimated values of the Relative Risk coefficients used in this study are collected from [60], which are listed in Table 9.
Table 9.
RR values (95% CI) for each 10 μg/m3 increase in the daily mean concentration of each pollutant [60].
In this study, we assumed that the wind speed and the geographical parameters remain unchanged across the period. The expected public health co-benefits (annual death prevented) from the TTMP are given in Figure 8.
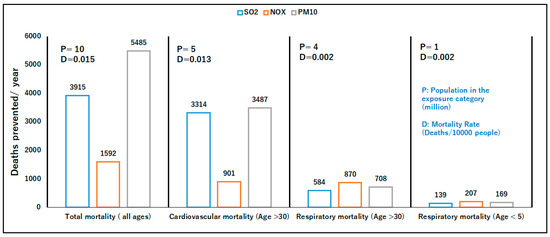
Figure 8.
Expected public health co-benefits from the TTMP in 2030 (1. Data collected from the Ministry of Health and Medical Education for 1990–2013 [61]. 2. The respiratory disease mortality rate for children under five years was collected from [62]).
As can be seen from Figure 7, the annual reduction in total mortality varies from 5485 cases to 1592 cases for the projected 10 million inhabitants in Tehran in 2030. The effect of PM10 on both cardiovascular and respiratory mortalities is significant, which implies that the reduction of the levels of this pollutant plays a vital role in attaining the expected public health co-benefits in Tehran. The cost-saving from the health co-benefits is estimated at USD 35 million per year, using available data on hospital admission and premature mortality costs in Tehran [52]. Table 10 summarizes the expected annual co-benefits from the TTMP in 2030 in the city of Tehran.
Table 10.
Expected co-benefits from the TTMP in 2030.
Figure 9 illustrates the implication of the A-S-I actions which were considered in the TTMP. It can be observed from this figure that the implementation of the shift actions such as developing the Tehran’s rail and BRT systems together with the CNG buses have a significant impact on improving the air quality and public health in this city.
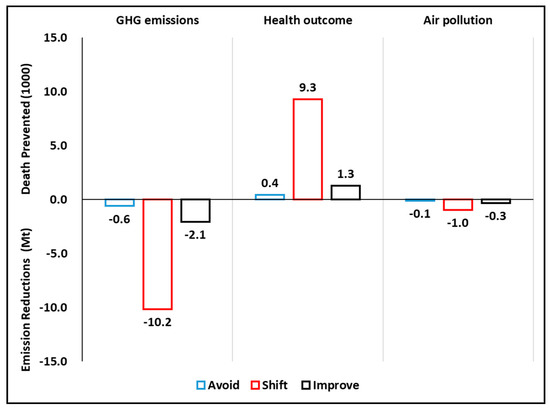
Figure 9.
Expected co-benefits from each action in the TTMP.
To compare the expected co-benefits across different A-S-I actions, the results were normalized on a scale of zero to one, using the min-max calculation method. Figure 10 shows the aggregate scores for each action group in the TTMP. The shift actions perform well in all expected co-benefits in the transport sector, followed by the Improve action, which is linked with upgrading fuel-economy in the passenger car fleet. The expected co-benefits from preventing unauthorized entry of passenger vehicles in the RTZ and developing the NMT (Avoid actions) are expected to be achieved from the reduction in NOx emission in Tehran’s transport sector.
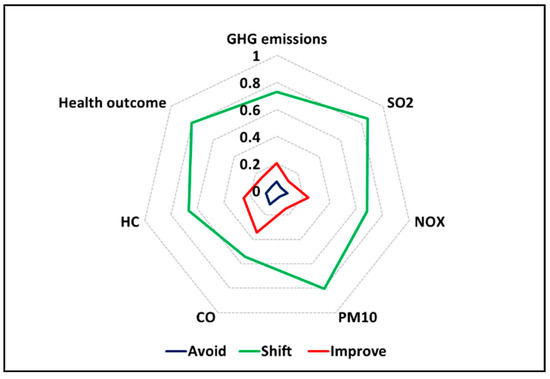
Figure 10.
Impact assessment of the TTMP (Max = Total amount of each expected co-benefits, Min = 0).
4. Conclusions
Sustainable transport, particularly in developing countries, is an important element of climate change policies, which can be integrated into development objectives such as good health and well-being as well as clean energy and sustainable cities. In order to meet both climate protection and other human development goals, it is important to seek perceptible co-benefits to justify interventions. In the transport sector, the climate change mitigation actions are usually linked with the application of clean technologies or behavioral changes by introducing affordable travel options. However, developing a low-carbon transport system can bring additional benefits beyond GHG emissions reduction, such as improved air quality and public health as well as reducing traffic congestions, injuries, and noise. Therefore, analyzing the co-benefits of climate change mitigation in the urban transport and energy sector may be high on the agenda of important policy actors, since there is large potential to introduce the co-benefits approach into ongoing projects and existing climate change mitigation actions, as exemplified by this study in Tehran, which suffers from several social, economic, and environmental problems caused by a poor urban transportation system.
This paper introduced the co-benefits approach to climate mitigation in the urban transport system by developing a quantitative model which is based on the Avoid-Shift-Improve method. The A-S-I modeling framework presented in this research simply follows a well-established method of evaluating mitigation potentials and related benefits, using simple and robust input data. However, the development of the model needs to be accompanied by investments in developing a database for having more precise and updated results, including sectoral data and emission factors for the urban transport system. Testing the model in Tehran’s transportation system has revealed a significant potential of expected environmental and health co-benefits from the implementation of the TTMP in this city. The most important finding of this analysis is that climate actions focused solely on “shift” such as replacing private car trips with public mass transit and increasing the number of CNG buses can cause additional co-benefits. By providing policy makers with a comprehensive overall view of the extent of the co-benefits associated with the TTMP, they can make precise adjustments to the mitigation interventions to achieve the desired the ancillary benefits of the actions. It also helps with envisioning several low-emission development strategies with multiple benefits to facilitate the achievement of the SDGs in the city of Tehran. Moreover, the initial scope of co-benefits, such as those provided in this investigation, help Tehran’s decision-makers to determine if intensive analyses are needed in the future.
Author Contributions
Conceptualization: H.F. and J.A.P.d.O.; methodology, investigation, formal analysis, H.F., writing—review and editing, H.F. and J.A.P.d.O., B.M. and H.O.
Funding
The research for this paper was supported by the Asia-Pacific Network for Global Change Research (Ref. CRRP2017-07SY-Farzaneh) and the Kurata grant of the Hitachi Global Foundation. The author wishes to thank those organizations for their supporting of this.
Conflicts of Interest
The authors declare no conflict of interest.
References
- WEC, World Energy Council. Climate Change: Implications for the Energy Sector, Key Findings from the Intergovernmental Panel on Climate Change Fifth Assessment Report; University of Cambridge: Cambridge, UK, 2014; Available online: https://www.worldenergy.org/wp-content/uploads/2014/06/Climate-Change-Implications-for-the-Energy-Sector-Summary-from-IPCC-AR5-2014-Full-report.pdf (accessed on 1 January 2019).
- Boemi, S.N.; Irulegi, O.; Santamouris, M. Energy Performance of Buildings: Energy Efficiency and Built Environment in Temperate Climates; Springer International Publishing: Switzerland, 2016; ISBN 978-3-319-20830-5. [Google Scholar]
- OECD, Organisation for Economic Co-operation and Development. Cities and Climate Change. 2010. Available online: https://www.oecd.org/berlin/46560225.pdf (accessed on 1 January 2019).
- Polydoros, A.; Cartalis, C. Use of Earth Observation based indices for the monitoring of built-up area features and dynamics in support of urban energy studies. Energy Build. 2015, 98, 92–99. [Google Scholar] [CrossRef]
- UN-HABIT. State of the World’s Cities 2008/2009—Harmonious Cities; UN-HABITAT: London, UK; Sterling, VA, USA, 2008; ISBN1 978-92-1-132010-7. Available online: http://mirror.unhabitat.org/pmss/listItemDetails.aspx?publicationID=2562 (accessed on 1 December 2018)ISBN2 978-92-1-132010-7.
- Cao, J.; Ho, M.S.; Jorgenson, D.W. Co-benefits of Greenhouse Gas Mitigation Policies in China. Environment for Development, Discussion Paper Series, EfD DP 08-10, China. 2008. Available online: https://pdfs.semanticscholar.org/d2b1/e5c6ec1c962145d62abdba747b08f36cf495.pdf (accessed on 1 December 2018).
- Puppim de Oliveira, J.A.; Doll, C.N.H.; Siri, J.; Dreyfus, M.; Farzaneh, H.; Capon, A. Urban governance and the systems approaches to health-environment co-benefits in cities. Cad. Saúde Pública 2015, 31, 25–38. [Google Scholar] [CrossRef] [PubMed]
- Woodcock, J.; Edwards, P.; Tonne, C.; Armstrong, B.G.; Ashiru, O.; Banister, D.; Beevers, S.; Chalabi, Z.; Chowdhury, Z.; Cohen, A.; et al. Public health benefits of strategies to reduce greenhouse-gas emissions: Urban land transport. Lancet 2009, 374, 1930–1943. [Google Scholar] [CrossRef]
- Hyslop, A. Co-benefits of Municipal Climate Change Mitigation Strategies, Hamilton; University of Waterloo: Waterloo, ON, Canada, 2006; Available online: http://citeseerx.ist.psu.edu/viewdoc/download?doi=10.1.1.488.268&rep=rep1&type=pdf (accessed on 1 December 2018).
- Hallegatte, S.; Corfee-Morlot, J. Understanding climate change impacts, vulnerability and adaptation at city scale: An introduction. Clim. Chang. 2011, 104, 1–12. [Google Scholar] [CrossRef]
- Puppim de Oliveira, J.A. Learning how to align climate, environmental and development objectives in cities: Lessons from the implementation of climate co-benefits initiatives in urban Asia. J. Clean. Prod. 2013, 58, 7–14. [Google Scholar] [CrossRef]
- Doll, C.N.; Puppim de Oliveira, J.A. (Eds.) Urbanization and Climate Co-Benefits: Implementation of Win-Win Interventions in Cities; Routledge: Abingdon, UK, 2017. [Google Scholar]
- Mayrhofer, J.P.; Gupta, J. The science and politics of co-benefits in climate policy. Environ. Sci. Policy 2016, 57, 22–30. [Google Scholar] [CrossRef]
- Betsill, M.M.; Bulkeley, H. Cities and Climate Change: Urban Sustainability and Global Environmental Governance; Routledge: New York, NY, USA, 2003. [Google Scholar]
- Puppim de Oliveira, J.A.; Doll, C.N.; Kurniawan, T.A.; Geng, Y.; Kapshe, M.; Huisingh, D. Promoting win–win situations in climate change mitigation, local environmental quality and development in Asian cities through co-benefits. J. Clean. Prod. 2013, 58, 1–6. [Google Scholar] [CrossRef]
- Lee, T.; Van de Meene, S. Comparative studies of urban climate co-benefits in Asian cities: An analysis of relationships between CO2 emissions and environmental indicators. J. Clean. Prod. 2013, 58, 15–24. [Google Scholar] [CrossRef]
- Fischedick, M.; Roy, A.J.; Abdel-Aziz, A.; Acquaye, J.M.; Allwood, J.-P.; Ceron, Y.; Geng, H.; Kheshgi, A.; Lanza, D.; Perczyk, L.; et al. 2014: Industry. In Climate Change 2014: Mitigation of Climate Change; Contribution of Working Group III to the Fifth Assessment Report of the Intergovernmental Panel on Climate Change; Edenhofer, O., Pichs-Madruga, R., Sokona, Y., Farahani, E., Kadner, S., Seyboth, K., Adler, A., Baum, I., Brunner, S., Eickemeier, P., et al., Eds.; Cambridge University Press: Cambridge, UK; New York, NY, USA, 2014. [Google Scholar]
- Perston, B.; Suppiah, R.; Macadam, I.; Bathols, J. Climate Change in the Asia-Pacific region, A Consultancy Report Prepared for the Climate Change and Development Roundtable. CSIRO Marine and Atmospheric Research: Australia. Available online: http://www.cmar.csiro.au/e-print/open/prestonbl_2006b.pdf (accessed on 1 December 2018).
- Lee, Z.H.; Sethupathi, S.; Lee, K.T.; Bhatia, S.; Mohamed, A.R. An overview on global warming in Southeast Asia: CO2 emission status, efforts done, and barriers. Renew. Sustain. Energy Rev. 2013, 28, 71–81. [Google Scholar] [CrossRef]
- Timilsina, G.R.; Shrestha, A. Transport sector CO2 emissions growth in Asia: Underlying factors and policy options. Energy Policy 2009, 37, 4523–4539. [Google Scholar] [CrossRef]
- Ong, H.C.; Mahlia, T.M.I.; Masjuki, H.H. A review on energy pattern and policy for transportation sector in Malaysia. Renew. Sustain. Energy Rev. 2012, 16, 532–542. [Google Scholar] [CrossRef]
- Doll, C.N.H.; Balaban, O. A methodology for evaluating environmental co-benefits in the transport sector: Application to the Delhi metro. J. Clean. Prod. 2013, 58, 61–73. [Google Scholar] [CrossRef]
- Caia, B.; Bo, X.; Zhangc, L.; Boyced, J.K.; Zhange, Y.; Leif, Y. Gearing carbon trading towards environmental co-benefits in China: Measurement model and policy implications. Glob. Environ. Chang. 2016, 39, 275–284. [Google Scholar] [CrossRef]
- Farzaneh, H. Multiple benefits assessment of the clean energy development in Asian Cities. Energy Procedia 2017, 136, 8–14. [Google Scholar] [CrossRef]
- Farzaneh, H. Development of a Bottom-up Technology Assessment Model for Assessing the Low Carbon Energy Scenarios in the Urban System. Energy Procedia 2017, 107, 321–326. [Google Scholar] [CrossRef]
- Keshavarzian, M.; Anaraki, S.K.; Zamani, M.; Erfanifard, A. Projections of oil demand in road transportation sector on the basis of vehicle ownership projections, worldwide: 1972–2020. Econ. Model. 2012, 29, 1979–1985. [Google Scholar] [CrossRef]
- Mittal, S.; Dai, H.; Shukla, P.R. Low carbon urban transport scenarios for China and India: A comparative assessment. Transp. Res. Part D Transp. Environ. 2016, 44, 266–276. [Google Scholar] [CrossRef]
- Pathak, M.; Shukla, P.R. Co-benefits of low carbon passenger transport actions in Indian cities: Case study of Ahmedabad. Transp. Res. Part D 2016, 44, 303–316. [Google Scholar] [CrossRef]
- LIU, W.W.; DONG, J.; Qian, W. Research on Environmental sustainability in Eastern Asia Region Based On Transport Policies. Procedia Soc. Behav. Sci. 2013, 96, 894–899. [Google Scholar] [CrossRef][Green Version]
- Geng, Y.; Ma, Z.; Xue, B.; Ren, W.; Liu, Z.; Fujita, T. Co-benefit evaluation for urban public transportation sector—A case of Shenyang, China. J. Clean. Prod. 2013, 58, 82–91. [Google Scholar] [CrossRef]
- Ling-Yun, H.E.; Lu-Yi, Q.I.U. Transport demand, harmful emissions, environment and health co benefits in China. Energy Policy 2016, 97, 267–275. [Google Scholar]
- Li, Y.; Crawford-Brown, D.J. Assessing the co-benefits of greenhouse gas reduction: Health benefits of particulate matter related inspection and maintenance programs in Bangkok, Thailand. Sci. Total Environ. 2011, 409, 1774–1785. [Google Scholar] [CrossRef] [PubMed]
- MESDC, Ministry of Environment and Sustainable Development of Colombia. 2017. Available online: https://www.minambiente.gov.co/index.php/component/content/article?id=469:plantilla-cambio-climatico- 25#documentos (accessed on 1 December 2018).
- UNEP, The United Nations Environment Programme. Good Practice Guide; District Energy, Energy, Climate, and Technology Branch, Division of Technology, Industry and Economics: Paris, France, 2016; Available online: http://californiaseec.org/wp-content/uploads/2016/03/C40-Good-Practice-Guide_District-Energy.pdf (accessed on 1 December 2018).
- Government of Japan. Manual for the Quantitative Evaluation of the Co-benefits Approach to Climate Change Project, Version 1.0; Ministry of Environment, June 2009. Available online: https://www.env.go.jp/en/earth/cc/manual_qecba.pdf (accessed on 1 December 2018).
- GIZ, Internationale Zusammenarbiet (GIZ) Gmb. Available online: http://www.sutp.org/files/contents/documents/resources/E_Fact-Sheets-and-Policy-Briefs/SUTP_GIZ_FS_Avoid-Shift-Improve_EN.pdf (accessed on 1 December 2018).
- Farzaneh, H. Energy Systems Modeling-Principles and Applications; Springer: Singapore, 2019. [Google Scholar] [CrossRef]
- Schipper, L.; Marie-Liliu, M. Flexing the Link between Transport Greenhouse Gas Emissions: A Path for the World Bank; International Energy Agency: Paris, France, 1999; Available online: http://documents.worldbank.org/curated/en/826921468766156728/pdf/multi-page.pdf (accessed on 1 December 2018).
- Farzaneh, H.; Suwa, A.; Doll, C.N.H.; Puppim de Oliveira, J.A. Developing a Tool to Analyze Climate Co-benefits of the Urban Energy System. Procedia Environ. Sci. 2014, 20, 97–105. [Google Scholar] [CrossRef]
- Farzaneh, H.; Doll, C.N.H.; Puppim de Oliveira, J.A. An integrated supply-demand model for the optimization of energy flow in the urban energy system. J. Clean. Prod. 2016, 114, 269–285. [Google Scholar] [CrossRef]
- Ostro, B. Outdoor Air Pollution, Assessing the Environmental Burden of Disease at National and Local Levels; World Health Organization Protection of the Human Environment: Geneva, Switzerland, 2004; ISBN 9241591263. [Google Scholar]
- Maizlish, N.; Woodcock, J.; Co, S.; Ostro, B.; Fanai, A.; Fairley, D. Health co-benefits and transportation-related reductions in greenhouse gas emissions in the San Francisco Bay Area. Am. J. Public Health 2013, 103, 703–709. [Google Scholar] [CrossRef] [PubMed]
- Xia, T.; Nitschke, M.; Zhang, Y.; Shah, P.; Crabb, S.; Hansen, A. Traffic-related air pollution and health co-benefits of alternative transport in Adelaide, South Australia. Environ. Int. 2015, 74, 281–290. [Google Scholar] [CrossRef]
- Macmillan, A.; Connor, J.; Witten, K.; Kearns, R.; Rees, D.; Woodward, A. The societal costs and benefits of commuter bicycling: Simulating the effects of specific policies using system dynamics modeling. Environ. Health Perspect. 2014, 122, 335–344. [Google Scholar] [CrossRef] [PubMed]
- Rojas-Rueda, D.; de Nazelle, A.; Teixido, O.; Nieuwenhuijsen, M.J. Replacing car trips by increasing bike and public transport in the greater Barcelona metropolitan area: A health impact assessment study. Environ. Int. 2012, 49, 100–109. [Google Scholar] [CrossRef]
- WHO, World Health Organization. Health Risks of air Pollution in Europe –HRAPIE Project, Recommendations for Concentration–Response Functions for Cost–Benefit Analysis of Particulate Matter, Ozone and Nitrogen Dioxide; WHO Regional Office for Europe: København, Denmark, 2013. [Google Scholar]
- Shahbazi, H.; Reyhanian, M.; Hosseini, V.; Afshin, H. The Relative Contributions of Mobile Sources to Air Pollutant Emissions in Tehran, Iran: An Emission Inventory Approach, Emiss. Control Sci. Technol. 2016, 2, 44–56. [Google Scholar] [CrossRef]
- Shahbazi, H.; Ganjiazad, R.; Hosseini, V.; Hamedi, M. Investigating the influence of traffic emission reduction plans on Tehran air quality using WRF/CAMx modeling tools. Transp. Res. Part D Transport. Environ. 2017, 57, 484–495. [Google Scholar] [CrossRef]
- Hassani, A.; Hosseini, V. An assessment of gasoline motorcycle emissions performance and understanding their contribution to Tehran air pollution. Transp. Res. Part D Transport. Environ. 2016, 47, 1–12. [Google Scholar] [CrossRef]
- TAQCC. Tehran Air Quality Control Center. Annual Report of Air Quality in Tehran; Shahr Publication: Tehran, Iran, 2013; Available online: http://air.tehran.ir/portals/0/ReportFiles/AirPollution/New/39.pdf (accessed on 1 December 2018). (In Persian)
- Bayat, A. Tehran: Padox City, Metropolitan Disorders—7, New Left Review 66. Available online: https://newleftreview.org/issues/II66/articles/asef-bayat-tehran-paradox-city.pdf (accessed on 1 December 2018).
- SCI, Statistical Center of Iran. Iran Statistical Yearbook 2015–2016, Presidency Wise for Strategic Planning and Supervision, Tehran, Iran. 2013. Available online: https://www.amar.org.ir/english/Iran-Statistical-Yearbook/Statistical-Yearbook-2015-2016 (accessed on 1 December 2018).
- Saboohi, Y.; Farzaneh, H. Model for developing eco-driving strategy of a passenger vehicle. Appl. Energy 2009, 86, 1925–1932. [Google Scholar] [CrossRef]
- Zand, A.D.; Mikaeili, A.; Pezeshk, H. The influence of deposit control additives on exhaust CO and HC emissions from gasoline engines (case study: Tehran). Transp. Res. Part D Transport. Environ. 2007, 12, 189–194. [Google Scholar] [CrossRef]
- Heather, A. An integrated Approach to Public Transport, Tehran Islamic Republic of Iran, Case study for Global Report on Human Settelements 2013. Available online: http://www.unhabitat.org/grhs/2013 (accessed on 1 December 2018).
- TTTOD, Tehran Traffic Transportation Organization and Deputy, Deputy of planning and studies. An Overview of Tehran Transportation Master Plan (Revised in 2013), Tehran, Iran. Available online: http://www.iran.uitp.org/sites/default/files/documents/MasterPlanEnglishBook-old_Compressed.pdf (accessed on 1 December 2018).
- TUSRO, Tehran Urban & Suburban Railway Operation Co. 2016. Available online: http://metro.tehran.ir/Default.aspx?tabid=156 (accessed on 1 April 2017).
- Kakouei, A.; Vatani, A.; Kamal Bin Idris, A. An estimation of traffic related CO2 emissions from motor vehicles in the capital city of Iran. Iran. J. Environ. Health Sci. Eng. 2012, 9, 13. [Google Scholar] [CrossRef] [PubMed]
- Moshiri, S.; Atabi, F.; Panjehshahi, M.H.; Lechtenböhmer, S. Long run energy demand in Iran: A scenario analysis. Int. J. Energy Sect. Manag. 2012, 6, 120–144. [Google Scholar] [CrossRef]
- Naddafi, K.; Hassanvand, M.S.; Yunesian, M.; Momeniha, F.; Nabizadeh, R.; Faridi, S.; Gholampour, A. Health impact assessment of air pollution in megacity of Tehran, Iran. Iran. J. Environ. Health Sci. Eng. 2012, 9, 28. [Google Scholar] [CrossRef] [PubMed]
- NOFCR, National Organization for Civil Registration. Data on Mortality Based on Iranian Death Registration Systems (1990–2013) [Farsi]. 2016. Available online: http://www.sabteahval.ir/Default.aspx?tabid=4766 (accessed on 1 December 2018).
- Nojomi, M.; Naserbakhat, M.; Ramezany, M.; Anbary, K. Under-5 Year Mortality: Result of In-Hospital Study, Tehran, Iran. Acta Med. Iran. 2008, 47, 319–324. [Google Scholar]


© 2019 by the authors. Licensee MDPI, Basel, Switzerland. This article is an open access article distributed under the terms and conditions of the Creative Commons Attribution (CC BY) license (http://creativecommons.org/licenses/by/4.0/).