Abstract
With increasing energy shortages and global warming, clean and renewable energy sources, such as wind and wave energy, have gained widespread attention. In this study, the third-generation wave model WAVEWATCH-III (WW3) is used to simulate wave height in the North Indian Ocean (NIO), from 2008 to 2017, using the wind data from the European Centre for Medium-Range Weather Forecasts Renalysis datasets. The simulated results show good correlation with data obtained from altimetry. Analysis of wind and wave energy resources in the NIO is carried out considering energy density, the exploitable energy, the energy density stability, and monthly and seasonal variability indices. The results show that most areas of the NIO have abundant wind energy and at the Somali Waters are rich in wave energy resources, with wind energy densities above 200 W/m2 and wave energy densities above 15 KW/m. The most energy-rich areas are the Somali Waters, the Arabian Sea, and the southern part of the NIO (wind energy density 350–650 W/m2, wave energy density 9–24 KW/m), followed by the Laccadive sea (wind energy density 150–350 W/m2, wave energy density 6–9 KW/m), while the central part of the NIO is relatively poor (wind energy density less than 150 W/m2, wave energy density below 6 KW/m).
1. Introduction
Energy is an indispensable resource for human survival and sustainable development [1], which is vital to the development of human society and the progress of world civilization. The global energy demand has been predicted to rise by 30% by 2040, which is the equivalent to adding another China and India into the present worldwide demand [2]. At the same time, the pressure from climate change and fossil fuel consumption has also reignited interest and excitement in marine renewable resources around the world [3,4], as the ocean has always been considered one of the main sources of renewable energy on our planet [5,6,7]. For example, Cape Verde Islands have been relying on oil imports for the past few decades, leading to high power costs and greenhouse gas emissions. Nowadays, the Cape Verde Islands, being surrounded by the ocean, rich in wind energy and wave energy, have already begun to consider the use of wind and wave energy as energy sources to alleviate economic and environmental pressures [8]. At present, wind and wave energy are favored by many countries, due to their wide distribution and tremendous worldwide potential for electricity generation. For the International Energy Agency 2DS scenario, global wind power production is expected to have a share of 11.6% in 2030 and up to 14.8% in 2050 [9]. Furthermore, wind power ranks at the top of alternative energy sources as a solution to global warming [10]. The demand for wind energy is obvious to the world, and its development is sustainable because it combines important economic, environmental, and social factors. An important feature of sea waves is their high energy density, which is the highest and has the most potential among renewable energy sources [11,12,13]. In Europe over last few decades, intensive research and development studies of wave energy conversion aimed at developing industrially exploitable wave power conversion technologies in the medium- and long-terms have been presented. These devices have been constantly improved, and the consequent improved performance of wave power techniques has led to modern wave energy techniques being closer to commercial exploitation than ever before [14]. In addition, the development of wind energy conversion device technology has also matured, providing technical support for the sustainable use and vital information for the future deployment of ocean renewable energy installations.
The Indian Ocean is one of the world’s maritime shipping centers [15], with rich marine resources and many marine energy channels [16]. It is an important place for the Maritime Silk Road [17], and some parts of it are important maritime military sites [18]. Therefore, the development and utilization of wind and wave energy in the NIO cannot be delayed. However, the complex marine environment greatly increases the difficulty of ocean development. Only by “marine development and evaluation first” can efficient development and utilization be realized under the premise of safety and reliability [19,20]. The forerunner studies have greatly promoted the development and utilization of wave energy resources. Wave hindcast, based on numerical models, has become a common tool to obtain wave heights [21] and is currently the only available tool that provides high-resolution (spatial and temporal) long-term wave information for big areas with few or no measurements [22]. The WW3 model has been used to study the global wave energy resources during the decade from 1997–2006, which describes the temporal and spatial changes of global wave energy resources. The results were also verified by comparison with buoy data and previously estimated energy data [23]. The wind and wave energy density of the China Sea was calculated by the WW3 model and cross-calibrated multi-platform (CCMP) wind data. The results showed that the China Sea is rich in wind and wave energy. The rich areas were located in the northern South China Sea and the poor areas were located in the Yellow Sea and Bohai Sea [24]. High-resolution wave hindcast was performed for Ireland (including both the Atlantic and Irish Sea coasts), using the WW3 model and 34-year (from 1979 to 2012) ERA-interim winds. Spatial and seasonal variability was found for significant wave heights (SWH) and the wave energy flux, particularly on the north and west coasts [25]. Based on the ERA-Interim wind, the variation of wave height in the waters around the Indian continent have been studied. Studies have shown that, during the summer monsoon, higher wave heights were observed in all areas except the southern part of the continental shelf around India. The annual average significant wave height in the southern region is up to 1.6 m [26]. The influence of the Indian Ocean Dipole (IOD) on the eastern Arabian Sea (AS) wave climate has been studied and the re-analyzed storm data was calculated. The results showed that IOD plays a major role in the climate change of the study area, and the wind field changes caused by IOD affect the generation or dissipation of the wave field [27]. The WW3 model and the forced Climate Forecast System Re-analysis (CFSR) wind data were used to simulate wave conditions of the nearshore and offshore waters of the Red Sea from 1979–2010. Analysis of monthly, seasonal, and interannual variations in wave power indicates the potential for wave energy in some coastal areas of the Red Sea, including the coasts of Saudi Arabia, Yemen, Egypt, Sudan, and Eritrea [28]. For the ERA-interim wind field in this research, compared with other re-analysis wind fields, the differences in observation quantity, space–time distribution, and observation method may produce some differences in the process of data assimilation [29,30]. Therefore, it is necessary to compare and analyze the differences in accuracy of simulated ocean wave data when different re-analysis wind fields are used as the driving field, in order to improve the accuracy of wave energy evaluation in the future.
The predecessors have made great contributions to the study of wave energy, but the data is scarce in the NIO and there is a lack of assessment of wind energy; thus, this data needs to be updated. The purpose of this study is to assess the wind and wave energy in the NIO from 2008 to 2017 using the WW3 model and the ERA-interim wind field. It contributes to current research about the energy in the NIO and finds abundant resources of wind and wave energy in the NIO, providing guidance in terms of wind and wave energy conversion.
2. Methodology and Data
2.1. Model Description and Configuration
WW3 is a third-generation ocean wave model based on full-spectrum space, developed by MMAB (Marine Modeling and Analysis Branch), which is affiliated with NOAA/NCEP. Its latest version is v5.16 [31], which was released in 2016.
The general source terms used in WW3 are defined as follows:
where Sin is an atmosphere-wave interaction term, which is usually a positive energy input but can also be negative in the case of swell; Snl is a non-linear wave–wave interactions term; Sds is a wave-ocean interaction term, which generally contains the dissipation; Sln is a linear input term; and Sbot is the wave-bottom interactions term [32,33].
In deep water, the net source term S is generally considered to consist of three parts: Sin, Snl, and Sds. In order to provide a more realistic initial wave growth, the linear input term Sln is added to the mode initialization. In shallow water, Sbot must be added in WW3.
The above source terms are defined for the energy spectrum. In the model, however, most source terms are directly calculated for the action spectrum. The equations for WW3 are:
In Equations (2)–(5), N is the wave action density spectrum, S is the input source term, t represents time, represents the horizontal Laplacian, is the wavenumber, θ is the wave direction, is the intrinsic (radian) frequency, U is the (depth-and time-averaged over the scales of individual waves) current velocity, is the mean water depth, k is the wavenumber vector, S is in the same direction as , and is perpendicular to S.
The range selected for model calculation is 15°S–30°N, 30°E–100°E, with 24 × 25 wave spectrum grids (24 wave directions and 25 frequency bands) which range from 0.0418–0.4056 Hz. The spatial resolution is 0.25° 0.25° and the time step is 900 s, with outputs logged every 3 h. Model time is from 00:00 on 1 January 2008 to 18:00 on 31 December 2017.
2.2. Wind Field and Bathymetry Data
In order to analyze the wave energy distribution and stability in the NIO, ERA-interim wind data from European Centre for Medium-Range Weather Forecasting (ECMWF), including 10 m u wind speed (WS) and v WS was employed in the study. The advantage of the ERA-Interim is the latest global atmospheric re-analysis of the ECMWF [34], which has been updated in real time since 1979. Coverage is global and spatial resolution options are varied. Referring to Kumar et al., wave height and wave period estimation depend on the accuracy of the wind field used to force the model [19].
Earlier studies have shown that bathymetry is also an important factor [35]. Hence, ETOPO5 was used in the research, with range 15°S–30°N, 30°E–100°E, as shown in Figure 1. ETOPO5 is generated from a digital data base of land and sea-floor elevations on a 5-min latitude/longitude grid, and its values are in whole meters [36].
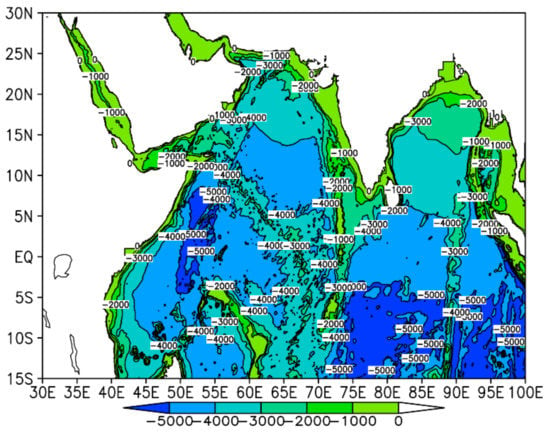
Figure 1.
Bathymetry map in the Northern Indian Ocean (unit: m).
2.3. Observation Wave Data
Observation wave data can be obtained from satellite altimeter and buoys. Buoy data, which are long-term and large-scale, are difficult to obtain; thus, satellite altimeter data are generally used as verification data. We note that the satellite data has been provided by NASA (National Aeronautics and Space Administration) [37]. Its spatial resolution is 1° × 1°, from 1 January 2017 to 31 December 2017 and covering 15°S–30°N, 30°E–100°E.
2.4. Data Validation Method
Due to the incompleteness of measured wave’s parameters over a wide area, satellite observations and wave hindcast models play a key role in wave parameter estimation [35,38,39]. In this study, the observed data—satellite altimeter data—is used as verification for the WW3 data model simulation values. Model results are statistically compared with observed data using the root-mean-square error (RMSE), bias, correlation coefficient (CC) and scatter index (SI). The calculation method is as follows:
In Equations (6)–(9), represents the observed data, represents the simulated data, and are average values of observed data and simulated data, respectively, and n is the total number of samples.
In order to verify the accuracy of the numerical model simulation results, a complete validation is shown in Figure 2, considering the CC, RMSE, bias, and SI between the numerical model simulation values and the satellite altimeter observations of the whole year at each integer latitude and longitude point. This method shows the verification results of all points in the study area, from which we can visually see the accuracy of each sea area in the study area. From Figure 2a, the CC was basically above 0.8, and it is around 0.9 in the Arabian Sea, the Somali Waters, and the sea area around Madagascar. In Figure 2b, the RMSE of the western waters, which is the key sea area in the NIO, was around 0.15, and the RMSE of the Southeastern parts in the study area were slightly higher, around 0.2. In Figure 2c, the bias is distributed between −1.4 and 0.2, indicating that the simulated values in the Somali Waters were a little higher than the observed values, but the observed values in other seas were slightly higher than the simulated values. The SI is shown in Figure 2d, which was below 0.12; furthermore, the key area had RMSE of around 0.09, indicating a good agreement between the simulated and the observed value. Overall, the simulation wave data in this study had high precision.
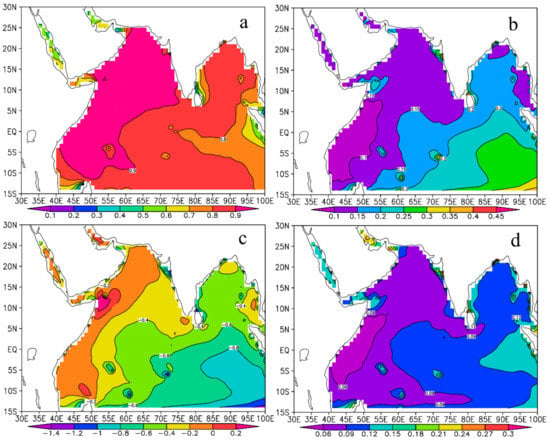
Figure 2.
Comparison coefficients for the significant wave heights (SWH) from the WAVEWATCH-III (WW3) wave model in 2017 and the SWH from the altimeter: (a) CC, (b) RMSE, (c) bias, and (d) SI.
3. WS And SWH Assessment
3.1. Distribution of WS and SWH
The distribution of WS (wind speed) and SWH (significant wave height) as an important segment is a cornerstone of the assessment of wind and wave energy. The WS in the NIO varies roughly from 2.5–8.0 m/s, as shown in Figure 3a, with obvious geographical differences. Areas with WS values greater than 7 m/s are mainly concentrated in Somali Waters, Kenya, and the northern and eastern parts of Madagascar. The WS in the Red Sea, the Gulf of Aden, and the Bay of Bengal are relatively low, between 5.5–6 m/s, and the values in the waters around Victoria and the Maldives are also not high, around 4.5 m/s.
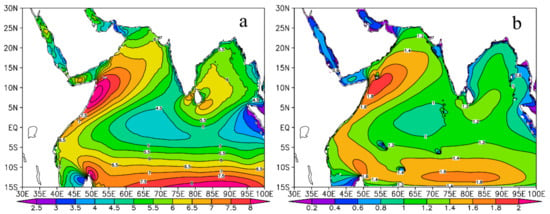
Figure 3.
The distribution of 10-year average wind speed (WS) (unit: m/s) (a) and significant wave height (SWH) (unit: m) (b).
We can see that the WS and the SWH are closely related. If the value of WS in a region is large, that of SWH is also large. The areas with the biggest values of SWH were located in Somali Waters and Arabian Sea, where the range of values is spread between 1.4–1.8 m. The values in the northern part of Madagascar and the southern part of the Northern Indian Ocean were around 1.6 m. On the contrary, the Red Sea, the Gulf of Aden, and Persian Gulf were a little low, between 0.6–0.8 m.
3.2. Exploitable WS and Exploitable SWH
According to previous studies, exploitable WS in exploiting wind energy has been defined as 3–25 m/s [24,38,40]. The exploitable SWH in exploiting wave energy has been defined as 1.3–4.0 m [41]. Thus, this study of exploitable WS and exploitable SWH adopts the above definitions, and is shown in Figure 4. In the past ten years (from 2008–2017), the occurrence of exploitable WS was about 80% in most parts of the NIO, and was even more than 90% in some places, such as Matai, Banbhore, and Manda, meaning that at least 90% of the year is useful for wind energy resource development in these waters.
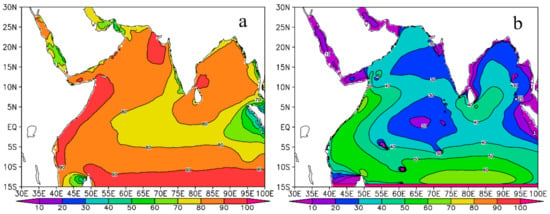
Figure 4.
Occurrence of 10-year average exploitable WS (unit: %) (a)and exploitable SWH (unit: %) (b).
The exploitable SWH in the NIO is generally over 40%, and the exploitable SWH is about 50–60% in some places, such as the Somali Waters, the waters around Kenya, the northern waters of Madagascar, and the south NIO. The values of exploitable SWH in the central NIO, Andaman, and Lakshadweep were around 30%; its values in the Red Sea, the Gulf of Aden, and the Persian Gulf were lower, around 10%.
4. Wind Energy and Wave Energy Assessment
4.1. Calculate Method of Energy Assessment
The wind and wave energy are calculated using the WS (every 6 h) and SWH (every 3 h) from 00:00 on 1 January 2008 to 18:00 on 31 December 2017. The wind energy densities in the NIO are calculated by the following equation.
where W is the wind power density (W/m2), V is the wind speed (m/s), and is the air density (kg/m3); taken here as 1.292 kg/m3 as the sea surface air density in the NIO.
As for wave energy density, according to Roger’s method [42], the wave energy density from 2008–2017 in the NIO was calculated using simulation wave data (every 3 h) from January 2008 to December 2017:
where Pw is the wave energy density (KW/m), H1/3 is the significant wave height (m), and T is the wave period (s).
It can be seen, from Equation (11), that the wave energy density is related to the SWH and wave period. In the study of wave density, most articles have only focused on SWH, while the wave period is often neglected [43,44,45,46]. Some studies [47,48] have found that there is a positive effect of wave period on wave energy density. In this regard, this paper briefly analyzes the wave period and the distribution of 10-year average wave period, as shown in Figure 5. It can be seen that the values of the wave period is about 6.0 s in most of the study area. Therefore, compared with the SWH, the wave period has little effect on the wave energy density in this study area, and the wave energy density is mainly determined by the SWH.
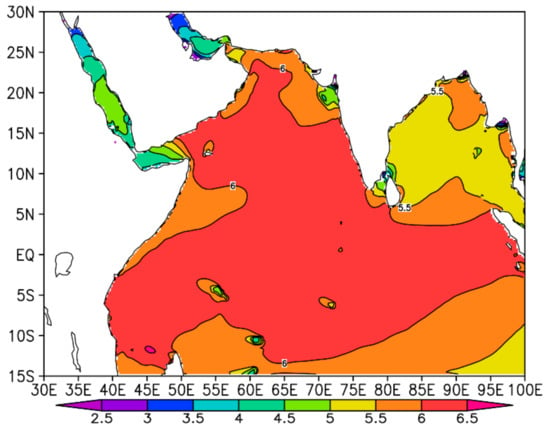
Figure 5.
The distribution of 10-year average wave period (unit: s).
4.2. Characteristics of Wind and Wave Energy Density
The distribution of wind energy and wave energy is the most intuitive indicator of resource richness in the region, providing a basis for the construction of energy conversion equipment. The wind energy from 2008–2017 was more than 100 W/m2, with obvious geographical differences. The wind energy in the Somali Waters reached 550 W/m2 or more, and was around 250 W/m2 in the Laccadive Sea. The values of wind energy in the northern part of Madagascar were around 350 W/m2, and those in the central seas of the study area were above 100 W/m2.
From Figure 6b, we can clearly see that the wave energy in the Somali Waters, the Gulf of Aden, and the Arabian Sea was very high (of 15 KW/m or more), with the highest value reached in the Arabian Sea (21 KW/m). Thus, the Arabian Sea, which is a necessary place for several major routes, is a good area to build a wave energy resource base. In addition, wave energies in the northern and western parts of Madagascar reached 9 KW/m, with values of around 6 KW/m in the other areas. On the whole, wave energy density has shown to be relatively plentiful.
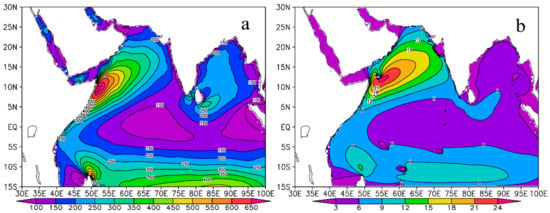
Figure 6.
Characteristics of annual average wind energy density (unit: W/m2) (a) and wave energy density (unit: KW/m) (b).
4.3. Occurrences of Exploitable Wind and Wave Energy
Measuring energy richness at different energy levels is an important criterion for assessing resources. In this study, different energy levels are also used to assess wind and wave energy in the NIO. According to former research, regions with wind energy densities greater than 50 W/m2 are considered to be available areas [49], and those with wind energy densities greater than 200 W/m2 are considered to be rich areas [24]. For wave energy, regions where the wave energy density is greater than 2 KW/m is considered to be an available area [24,50,51]; whereas areas with values of wave energy density larger than 20 KW/m are considered to be rich areas. There is no certain standard of lowest available wave energy density for wave energy conversion equipment [48,52]. Therefore, for the assessment of wind energy distribution, 2KW/m was selected as the minimum standard for assessing the available wave energy density in the wind energy distribution.
From 2008–2017, high occurrence areas of wind energy density larger than 50 W/m2 were found in the Somali Waters, Kenya, and Tanzania water areas; at above 80%, as shown in Figure 7a. The occurrence in the eastern part of Madagascar was about 90%, and about 70% in the sea area around the Laccadive Sea. The occurrence in entire study area was more than 60%, showing that at least 60% of the year is available for wind energy collection in the NIO. The areas with wind energy density greater than 200 W/m2 in Figure 7b are concentrated in the Somali Waters and the northern and eastern parts of Madagascar, where the values reached about 60–70%. The occurrence in some other areas reached 50%.
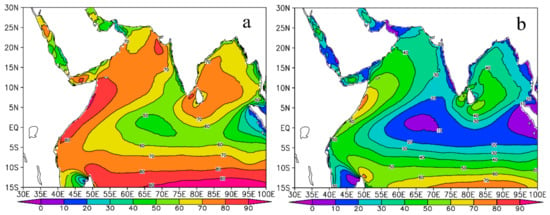
Figure 7.
Occurrence of annual average wind energy density larger than 50 W/m2 (unit: %) (a) and larger than 200 W/m2 (unit: %) (b).
The occurrence in the Somali Waters, Kenya, Tanzania, and the southern part of the Northern Indian Ocean were found to be high-occurrence values, with wave energy densities greater than 2 KW/m (of 70–80%), where the occurrence in the other areas was around 50–60%, as shown in Figure 8a. High-occurrence areas, with wave energy densities greater than 20 KW/m, were found around Somali Waters and the Arabian Sea; ranging from 21% to 33% in Figure 8b. In addition, wave energy densities greater than 20 KW/m in the northern part of Madagascar also existed, where the values were about 15–18%. We can see that the wave energy level of the NIO is obvious, with regional features.
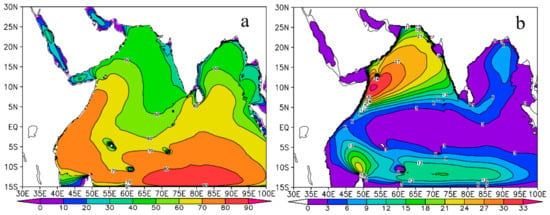
Figure 8.
Occurrence of annual average wave energy density larger than 2 KW/m (unit: %) (a) and wave energy density larger than 20 KW/m (unit: %) (b).
4.3.1. Coefficient of Variation
In order to explain the stability of wind and wave energy, this section uses the coefficient of variation, the monthly variability index, and seasonal variability index to demonstrate their stability.
As shown by Cornett, it is necessary to consider the disperse nature of data in the assessment of power plant locations [53]. The stable energy density is important to energy collection and conversion [54]. The stabilities of wind and wave energy are calculated by the equation of coefficient of variation (abbreviated as Cv) in different seasons. Calculation method is as follows:
where Cv is coefficient of variation, represents the mean value, and S is the standard deviation.
The stability of wind energy density in winter, spring, summer, and autumn was calculated (Figure 9) using the 6 h wind energy density from 00:00 on 1 January 2008 to 18:00 on 31 December 2017. The stability of wave energy density in winter, spring, summer, and autumn was calculated (Figure 10) using the 3 h wave energy density from 00:00 on 1 January 2008 to 18:00 on 31 December 2017.
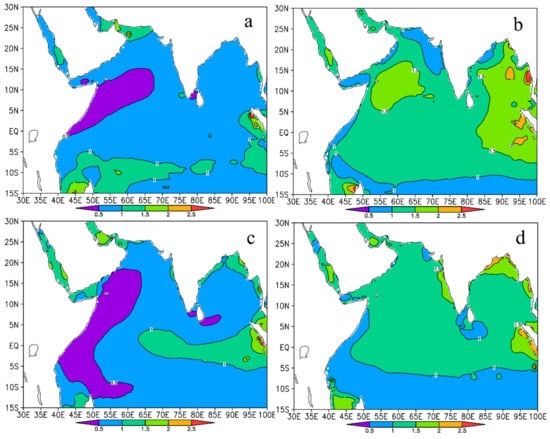
Figure 9.
Coefficient of variation of wind energy density in (a) winter, (b) spring, (c) summer, and (d) autumn in the NIO.
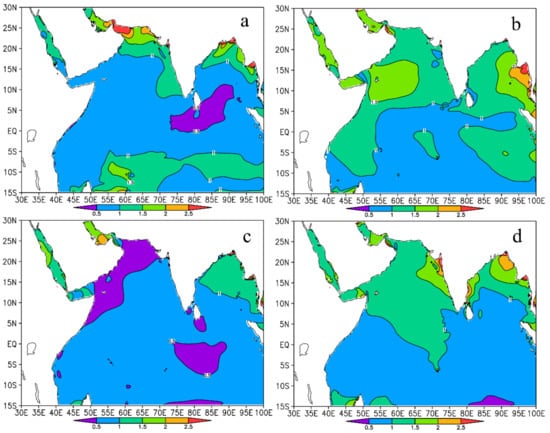
Figure 10.
Coefficient of variation of wave energy density in (a) winter, (b) spring, (c) summer, and (d) autumn in the NIO.
Stable energy density not only facilitates the collection and conversion of wind and wave energy, but also extends the life of power generation equipment [53]. The Cv value assesses the complex wind and wave energy stability, playing a basic role on the planning, deployment, and operation of wind and wave energy devices. As is shown in Figure 9 and Figure 10, wind energy density and wave energy density Cv values show obvious regional and seasonal differences. We can see that the wind energy density Cv in spring and autumn is bigger than that in winter and summer, meaning that winter and summer were more stable than spring and autumn. The greatest value of Cv in the NIO was in the Somali Waters, where seasonally reversing current [55,56,57] trends dominate. For most areas, the wind energy density Cv values were low; whereas the values were 1.5 in some small parts of the study area, indicating that wind energy density stability in the NIO is acceptable. Among these areas, wind energy density Cv in the Arabian Sea and the Somali Waters was below 1.5 in spring, autumn, and winter.
Wave energy density Cv in spring and autumn was smaller than that in winter and summer, meaning that winter and summer are more stable than spring and autumn, as seen in Figure 10. However, on the whole, the wave energy density Cv is small, with values around 1.0, indicating that the wave energy in the NIO is very stable and suitable to develop and utilize.
4.3.2. Monthly Variability Index
This section presents the monthly variability index Mv of wind and wave energy density. The smaller the Mv, the more stable the energy. The Mv is calculated as follows:
where PM1 represents the most abundant month of energy density, PM12 represents the poorest month of energy density, and Pyear represents the annual average energy density [58].
Mv is the average value of Mv for ten years, PMI is the maximum value of the monthly average for each year, and PM12 is the minimum value of the monthly average for each year.
Wind and wave energy density Mv are calculated and shown in Figure 11 during 2008–2017. The monthly variations of wind energy density were bigger than the wave energy density. Most of the Ocean’s wind energy Mv was below 5.0, and the distribution is obvious, with large regional differences. Large-valued areas of wind energy Mv are usually found at the outermost point of the NIO. The lowest value of Mv was about 1.0, in the Somali Waters, and that in other regions are higher than 1.0, meaning that the Somali Waters are a good choice for the location of wind energy conversion equipment.
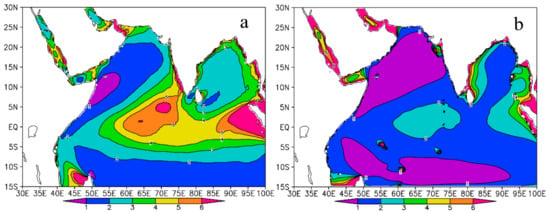
Figure 11.
Monthly Variability Index of wind energy density (a) and wave energy density (b).
Wave energy Mv shown in Figure 11b was above 2.0 in most waters of the NIO, and Mv values in the different areas of the NIO varied from 1–3. Large value areas of wave energy Mv were mostly found in the small areas, meaning that the monthly variations were very little in most regions. The Mv values in the Red Sea, the Gulf of Aden, and the Persian Gulf were slightly higher, around 4.0. The Arabian Sea, the Somali Waters, the northern waters of Madagascar, and the southern part of the NIO are considered to be low-change areas, where the values are about 1.0. The southern and northwestern regions of the study area are suitable for exploiting wave energy resources, not only as these regions have low Mv values, but as they are also the gateway to many important routes, such as the Cape Point–Guangzhou route, Port Louis to Singapore, and Aden to Mumbai.
4.3.3. Seasonal Variability Index
Another factor for determining the stability of wind and wave energy density is the Seasonal Variability Index (Sv). The equation of Sv is calculated as follows:
where PS1 represents the most abundant season in energy density, PS4 represents the poorest season in energy density, and Pyear represents annual average energy density.
The wind energy in the NIO shows bigger seasonal changes than the wave energy. Wind energy Sv in most waters of the NIO was below 6.0, with obvious regional differences in Figure 12. Large Sv value areas were mainly found in the middle of the study area. The waters around Kenya and the Somali Waters, the northern waters of Madagascar, the southern waters of the Northern Indian Ocean, and the Laccadive Sea had the lowest value of wind energy Sv, with values from 1.0–2.0. The values in the Red Sea, the Gulf of Aden, and the Persian Gulf were slightly higher, from 2.0–4.0. Regarding the wave energy Sv, the values of Sv were above 3.0 in a small part of the study area, and the values in most areas were between 1.0 and 2.0, meaning that the wave energy was stable in most regions. The Arabian Sea, the Somali Waters, the northern waters of Madagascar, and the southern part of the NIO had the lowest values—around 1.0—and the values in the central of the Northern Indian Ocean were about 2.0. In contrast, the values in the Red Sea, the Gulf of Aden, and the Persian Gulf were between 4.0–6.0.
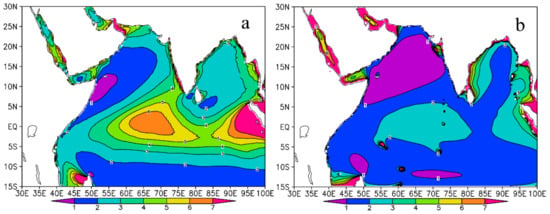
Figure 12.
Seasonal Variability Index of wind energy density (a) and wave energy density (b).
5. Conclusions
In general, the highest WSs (above 7.5 m/s) appear in the Somali Waters, the northern waters of Madagascar, and the southern part of the NIO. The WS values are around 6 m/s in the Laccadive Sea. While, the WS in the central waters of the NIO are low (about 4.5–5.5 m/s). Correspondingly, the exploitable WS in the areas with the highest WS is also the largest (of 90%), and the values in the central sea areas are 80%. For SWH, the values of SWH are between 0.2–2.0 m, and the regions with the highest SWH value are the Somali Waters, the northern part of Madagascar, and the southern part of the Northern Indian Ocean; whereas the SWH in the central waters of the NIO is low. As for exploitable SWH, the sea areas with high exploitable SWH, again, correspond to SWH. The value of the highest sea area is about 60%; whereas, in the central area of the northern Indian Ocean, it is around 30%.
Regions of high wind energy density are found in Somali Waters (550 W/m2) and the southern waters of the Northern Indian Ocean (400 W/m2). The northern waters of Madagascar (350 W/m2) follow. In contrast, the wind energy density in the central waters of the NIO is poor (below 200 W/m2). Regions of high wave energy density are found in Somali Waters and Arabian sea (15–24 KW/m). In contrast, the wave energy densities in the other waters are low (6–9 KW/m).
High occurrence areas of wind energy density (larger than 50 W/m2) are found in the Somali Waters and the central NIO, over the past ten years. The Somali Waters, Madagascan waters, and the central waters of the NIO have wind energy densities larger than 200 W/m2. High occurrence areas of wave energy density (greater than 2 KW/m) are found in most waters of the NIO (of 60–80%). High-occurrence areas of wave energy density (larger than 20 KW/m) are found in the Somali Waters and Laccadive Sea, where the values are between 24–33%.
The stability of wind and wave energy is mainly evaluated by the Cv, Mv, and Sv indices. For Cv, the values of the wind and wave energy are basically below 1.5; but can be a little high in the spring. The wind energy Mv and Sv are higher than the wave energy; thus, the wave energy is more stable. The stabilities of wind energy density and wave energy density in Somali Waters, the Arabian Sea, the north waters of Madagascar, and the southern part of the Northern Indian Ocean are overall better than that in other areas.
Author Contributions
Conceptualization, S.Y. and S.D.; methodology, C.Z.; software, S.Y. and C.Z.; validation, S.Y., S.D., and H.L.; formal analysis, S.Y.; investigation, Q.W.; resources, X.L.; data curation, L.F. and M.F.; writing—original draft preparation, S.D.; writing—review and editing, S.Y., J.X. and S.D.; visualization, S.D.; supervision, C.Z.; project administration, C.Z.; funding acquisition, C.Z.
Funding
This research was funded by the Open Research Fund of State Key Laboratory of Estuarine and Coastal Research (Grant number SKLEC-KF201707), the Opening Fund of Shandong Provincial Key Laboratory of Ocean Engineering.
Acknowledgments
This research was funded by the Open Research Fund of State Key Laboratory of Estuarine and Coastal Research (Grant number SKLEC-KF201707), the Opening Fund of Shandong Provincial Key Laboratory of Ocean Engineering. The authors gratefully thank the financial supports by the Wenhai Project of the Pilot National Laboratory for Marine Science and Technology (Qingdao) (Grant no. ZR2016WH01), and the State Key Laboratory of Precision Measuring Technology and Instruments of Tianjin University, Scientific research fund for young teachers (Grant no. Pilq1702) and “the Innovation and Entrepreneurship Project of Ocean Engineering Institute of Tianjin University, grant number 20190201-5”. Finally, we sincerely appreciate the anonymous reviewers for their comments and suggestions on the article.
Conflicts of Interest
The authors declare no conflict of interest.
References
- Amrutha, M.M.; Kumar, V.S.; Bhaskaran, H.; Naseef, M. Consistency of wave power at a location in the coastal waters of central eastern Arabian Sea. Ocean Dyn. 2019, 69, 543–560. [Google Scholar] [CrossRef]
- Peters, B.; Bui, H.H.; Sidney, J.; Weng, Z.; Loffredo, J.T.; Watkins, D.I.; Mothé, B.R.; Sette, A. A computational resource for the prediction of peptide binding to Indian rhesus macaque MHC class I molecules. Vaccine 2005, 23, 5212–5224. [Google Scholar] [CrossRef] [PubMed]
- Amrutha, M.M.; Sanil Kumar, V. Spatial and temporal variations of wave energy in the nearshore waters of the central west coast of India. Ann. Geophys. 2016, 34, 1197–1208. [Google Scholar] [CrossRef]
- Kumar, V.S.; Joseph, J.; Amrutha, M.M.; Jena, B.K.; Sivakholundu, K.M.; Dubhashi, K.K. Seasonal and interannual changes of significant wave height in shelf seas around India during 1998–2012 based on wave hindcast. Ocean Eng. 2018, 151, 127–140. [Google Scholar] [CrossRef]
- Arinaga, R.A.; Cheung, K.F. Atlas of global wave energy from 10 years of reanalysis and hindcast data. Renew. Energy 2012, 39, 49–64. [Google Scholar] [CrossRef]
- García, C.; Canals, M. Wave energy resource assessment and recoverable wave energy in Puerto Rico and the US Virgin Islands. In Proceedings of the OCEANS 2015, Genoa, Italy, 18–21 May 2015. [Google Scholar] [CrossRef]
- Sugita, M.R.I.P.; Wijaya, F.D. Design and Analysis of Tri Core Permanent Magnet Linear Generator for Wave Energy Conversion in South Coast of Java Island. In Proceedings of the 2016 6th International Annual Engineering Seminar (InAES), Yogyakarta, Indonesia, 1–3 August 2016. [Google Scholar] [CrossRef]
- Dee, D.P.; Uppala, S.M.; Simmons, A.J.; Berrisford, P.; Poli, P.; Kobayashi, S.; Andrae, U.; Balmaseda, M.A.; Balsamo, G.; Bauer, P.; et al. The ERA-Interim reanalysis: Configuration and performance of the data assimilation system. Q. J. R. Meteorol. Soc. 2011, 137, 553–597. [Google Scholar] [CrossRef]
- Dhanju, A.; Whitaker, P.; Kempton, W. Assessing offshore wind resources: An accessible methodology. Renew. Energy 2008, 33, 55–64. [Google Scholar] [CrossRef]
- Jacobson, M.Z. Review of solutions to global warming, air pollution, and energy security. Energy Environ. Sci. 2009, 2, 148–173. [Google Scholar] [CrossRef]
- Ringwood, J.V.; Bacelli, G.; Fusco, F. Control, forecasting and optimization for wave energy conversion. IFAC Proc. Vol. (IFAC-Pap.) 2014, 9, 7678–7689. [Google Scholar] [CrossRef]
- Jiang, B.; Wei, Y.; Jiang, X.; Wang, H.; Wang, X.; Ding, J.; Zhang, R.; Shi, Y.; Cai, X.; Wu, Y. Assessment of wave energy resource of the Bohai Sea, Yellow Sea and East China Sea based on 10-year numerical hindcast data. In Proceedings of the OCEANS 2016, Shanghai, China, 10–13 April 2016. [Google Scholar]
- Kumar, V.S.; Anoop, T.R. Wave energy resource assessment for the Indian shelf seas. Renew. Energy 2015, 76, 212–219. [Google Scholar] [CrossRef]
- Goettsche-Wanli, G. Sustainable Production of Offshore Renewable Energy: A Global Perspective. In Sustainable Ocean Resource Governance; Brill Nijhoff: Leiden, The Netherlands, 2018; pp. 8–75. [Google Scholar] [CrossRef]
- Vivekanandan, E.; Srinath, M.; Pillai, V.N.; Immanuel, S.; Kurup, K.N. Marine fisheries along the southwest coast of India. Gen. Inf. 2003, 1705, 757–792. [Google Scholar]
- Hamza, F.R.; Priotti, J.P. Maritime trade and piracy in the Gulf of Aden and the Indian Ocean (1994–2017). J. Transp. Secur. 2018, 1–18. [Google Scholar] [CrossRef]
- Anderson, J.A. China’s Southwestern Silk Road in World History; University of North Carolina at Greensboro: Greensboro, NC, USA, 2009; pp. 1–3. [Google Scholar]
- Upadhyaya, S. Expansion of Chinese maritime power in the Indian Ocean: implications for India. Def. Stud. 2017, 17, 63–83. [Google Scholar] [CrossRef]
- Amrutha, M.M.; Kumar, V.S.; Sandhya, K.G.; Nair, T.B.; Rathod, J.L. Wave hindcast studies using SWAN nested in WAVEWATCH III-comparison with measured nearshore buoy data off Karwar, eastern Arabian Sea. Ocean Eng. 2016, 119, 114–124. [Google Scholar] [CrossRef]
- Du, S.; Xiang, R.; Chen, M.; Liu, J.; Zhang, L.; Luo, C.; Su, X.; Zhang, Q. Progress of applied research of tephra in the Indian Ocean sediments. J. Trop. Oceanogr. 2017, 36, 12–18. [Google Scholar]
- Gurney, G.G.; Cinner, J.; Ban, N.C.; Pressey, R.L.; Pollnac, R.; Campbell, S.J.; Tasidjawa, S.; Setiawan, F. Poverty and protected areas: an evaluation of a marine integrated conservation and development project in Indonesia. Glob. Environ. Chang. 2014, 26, 98–107. [Google Scholar] [CrossRef]
- Ardhuin, F.; Bertotti, L.; Bidlot, J.R.; Cavaleri, L.; Filipetto, V.; Lefevre, J.M.; Wittmann, P. Comparison of wind and wave measurements and models in the Western Mediterranean Sea. Ocean Eng. 2007, 34, 526–541. [Google Scholar] [CrossRef]
- Cornett, A.M. A global wave energy resource assessment. In Proceedings of the ISOPE 18th International Conference on Offshore and Polar Engineering, Vancouver, BC, Canada, 6–11 July 2008. [Google Scholar]
- Zheng, C.; Pan, J.; Li, J. Assessing the China Sea wind energy and wave energy resources from 1988 to 2009. Ocean Eng. 2013, 65, 39–48. [Google Scholar] [CrossRef]
- Gallagher, S.; Tiron, R.; Dias, F. A long-term nearshore wave hindcast for Ireland: Atlantic and Irish Sea coasts (1979–2012). Ocean Dyn. 2014, 64, 1163–1180. [Google Scholar] [CrossRef]
- Kumar, V.S.; Anoop, T.R. Spatial and temporal variations of wave height in shelf seas around India. Nat. Hazards 2015, 78, 1693–1706. [Google Scholar] [CrossRef]
- Anoop, T.R.; SanilKumar, V.; Shanas, P.R.; Glejin, J.; Amrutha, M.M. Indian Ocean Dipole modulated wave climate of eastern Arabian Sea. Ocean Sci. 2016, 12, 369–378. [Google Scholar] [CrossRef]
- Aboobacker, V.M.; Shanas, P.R.; Alsaafani, M.A.; Albarakati, A.M. Wave energy resource assessment for Red Sea. Renew. Energy 2017, 114, 46–58. [Google Scholar] [CrossRef]
- Bitner-Gregersen, E.M.; Ewans, K.C.; Johnson, M.C. Some uncertainties associated with wind and wave description and their importance for engineering applications. Ocean Eng. 2014, 86, 11–25. [Google Scholar] [CrossRef]
- Bitner-Gregersen, E.M.; Soares, C.G. Uncertainty of average wave steepness prediction from global wave databases. In Advancements in Marine Structures; Guedes Soares & Das, Ed.; Taylor & Francis Group: London, UK, 2007; ISBN 978-0-415-43725-7. [Google Scholar]
- Sheng, Y.; Shao, W.; Li, S.; Zhang, Y.; Yang, H.; Zuo, J. Evaluation of Typhoon Waves Simulated by Wave Watch-III Model in Shallow Waters Around Zhoushan Islands. J. Ocean Univ. China 2019, 18, 365–375. [Google Scholar] [CrossRef]
- Zieger, S.; Babanin, A.V.; Rogers, W.E.; Young, I.R. Observation-based source terms in the third-generation wave model WAVEWATCH. Ocean Model. 2015, 96, 2–25. [Google Scholar] [CrossRef]
- Polnikov, V.G.; Innocentini, V. Comparative Study of Performance of Wind Wave Model: Wavewatch—Modified by New Source Function. Eng. Appl. Comput. Fluid Mech. 2008, 2, 466–481. [Google Scholar] [CrossRef][Green Version]
- Weedon, G.P.; Balsamo, G.; Bellouin, N.; Gomes, S.; Best, M.J.; Viterbo, P. The WFDEI meteorological forcing data set: WATCH Forcing Data methodology applied to ERA-Interim reanalysis data. Water Resour. Res. 2014, 50, 7505–7514. [Google Scholar] [CrossRef]
- Appendini, C.M.; Torres-Freyermuth, A.; Salles, P.; López-González, J.; Mendoza, E.T. Wave climate and trends for the Gulf of Mexico: A 30-yr wave hindcast. J. Clim. 2014, 27, 1619–1632. [Google Scholar] [CrossRef]
- Arabelos, D. Validation of ETOPO5U in the Hellenic area. Bull. Géodésique 1994, 68, 88–99. [Google Scholar] [CrossRef]
- Beyá, J.; Álvarez, M.; Gallardo, A.; Hidalgo, H.; Winckler, P. Generation and validation of the Chilean Wave Atlas database. Ocean Model. 2017, 116, 16–32. [Google Scholar] [CrossRef]
- Zhou, L.; Li, J.; Zheng, C.W.; Chen, X.B. Wave energy research in global oceans with ERA40 wave data for recent 45 years. In Proceedings of the 2011 International Conference on Remote Sensing, Environment and Transportation Engineering, Nanjing, China, 24–26 June 2011; pp. 3760–3763. [Google Scholar] [CrossRef]
- Wang, C.; Yang, L.; Wang, Y.; Meng, Z.; Li, W.; Han, F. Circuit Configuration and Control of a Grid-Tie Small-Scale Wind Generation System for Expanded Wind Speed Range. IEEE Trans. Power Electron. 2016, 32, 5227–5247. [Google Scholar] [CrossRef]
- Yazdani, M.G.; Salam, M.A. Investigation on available wind energy at Tungku beach. Front. Energy 2012, 6, 275–279. [Google Scholar] [CrossRef]
- Wan, Y.; Zhang, J.; Meng, J.; Wang, J. Exploitable wave energy assessment based on ERA-Interim reanalysis data—A case study in the East China Sea and the South China Sea. Acta Oceanol. Sin. 2015, 34, 143–155. [Google Scholar] [CrossRef]
- Zheng, C.; Pan, J. Wind Energy Resources Assessment in Global Ocean. J. Nat. Resour. 2012, 27, 1–8. [Google Scholar] [CrossRef]
- Zheng, C.W.; Wang, Q.; Li, C.Y. An overview of medium- to long-term predictions of global wave energy resources. Renew. Sustain. Energy Rev. 2017, 79, 1492–1502. [Google Scholar] [CrossRef]
- Haces-Fernandez, F.; Hua, L.; Ramirez, D. Wave Energy Characterization and Assessment in the U.S. Gulf of Mexico, East and West Coasts with Energy Event Concept. Renew. Energy 2018, 123, 312–322. [Google Scholar] [CrossRef]
- Wang, Z.; Duan, C.; Sheng, D. Long-term wind and wave energy resource assessment in the South China sea based on 30-year hindcast data. Ocean Eng. 2018, 163, 58–75. [Google Scholar] [CrossRef]
- Giorgi, G.; Ringwood, J.V. A Compact 6-DoF Nonlinear Wave Energy Device Model for Power Assessment. IEEE Trans. Sustain. Energy 2018, 10, 119–126. [Google Scholar] [CrossRef]
- Ulazia, A.; Penalba, M.; Ibarra-Berastegui, G.; Ringwood, J.; Saénz, J. Wave energy trends over the Bay of Biscay and the consequences for wave energy converters. Energy 2017, 141, 624–634. [Google Scholar] [CrossRef]
- Penalba, M.; Ulazia, A.; Ibarra-Berastegui, G.; Ringwood, J.; Sáenz, J. Wave energy resource variation off the west coast of Ireland and its impact on realistic wave energy converters’ power absorption. Appl. Energy 2018, 224, 205–219. [Google Scholar] [CrossRef]
- Eskinazi, S.; Goethals, R. Multiple Pump Stage Loading of a Variable-rpin Wind Turbine. J. Energy 2015, 3, 114–119. [Google Scholar] [CrossRef]
- Zheng, C.; Zhou, L. Wave climate and wave energy analysis of the south China sea in recent 10 years. Acta Energ. Sol. Sin. 2012, 33, 1349–1356. [Google Scholar]
- Kamranzad, B.; Etemad-Shahidi, A.; Chegini, V. Developing an optimum hotspot identifier for wave energy extracting in the northern Persian Gulf. Renew. Energy 2017, 114, 59–71. [Google Scholar] [CrossRef]
- Antonio, F.D.O. Wave energy utilization: A review of the technologies. Renew. Sustain. Energy Rev. 2010, 14, 899–918. [Google Scholar]
- Zheng, C.; Zhuang, H.; Li, X.; Li, X. Wind energy and wave energy resources assessment in the East China Sea and South China Sea. Sci. China Technol. Sci. 2012, 55, 163–173. [Google Scholar] [CrossRef]
- Van Zwieten, J.; Driscoll, F.R.; Leonessa, A.; Deane, G. Design of a prototype ocean current turbine—Part I: mathematical modeling and dynamics simulation. Ocean Eng. 2006, 33, 1485–1521. [Google Scholar] [CrossRef]
- Shankar, D.; Vinayachandran, P.N.; Unnikrishnan, A.S. The monsoon currents in the north Indian Ocean. Prog. Oceanogr. 2002, 52, 63–120. [Google Scholar] [CrossRef]
- Anoop, T.R.; Kumar, V.S.; Shanas, P.R.; Johnson, G. Surface Wave Climatology and Its Variability in the North Indian Ocean Based on ERA-Interim Reanalysis. J. Atmos. Ocean. Technol. 2015, 32, 1372–1385. [Google Scholar] [CrossRef]
- Sanil, K.V.; Muhammed, N.T. Performance of ERA-Interim Wave Data in the Nearshore Waters around India. J. Atmos. Ocean. Technol. 2015, 32, 1257–1269. [Google Scholar] [CrossRef]
- Silva, D.; Martinho, P.; Soares, C.G. Wave energy Distribution along the Portuguese continental coast based on a thirty three years hindcast. Renew. Energy 2018, 127, 1064–1075. [Google Scholar] [CrossRef]
© 2019 by the authors. Licensee MDPI, Basel, Switzerland. This article is an open access article distributed under the terms and conditions of the Creative Commons Attribution (CC BY) license (http://creativecommons.org/licenses/by/4.0/).