Performance Optimization of a Diesel Engine with a Two-Stage Turbocharging System and Dual-Loop EGR Using Multi-Objective Pareto Optimization Based on Diesel Cycle Simulation

Abstract
:1. Introduction
2. Methodology
2.1. 1D Engine Modeling and System Modifications
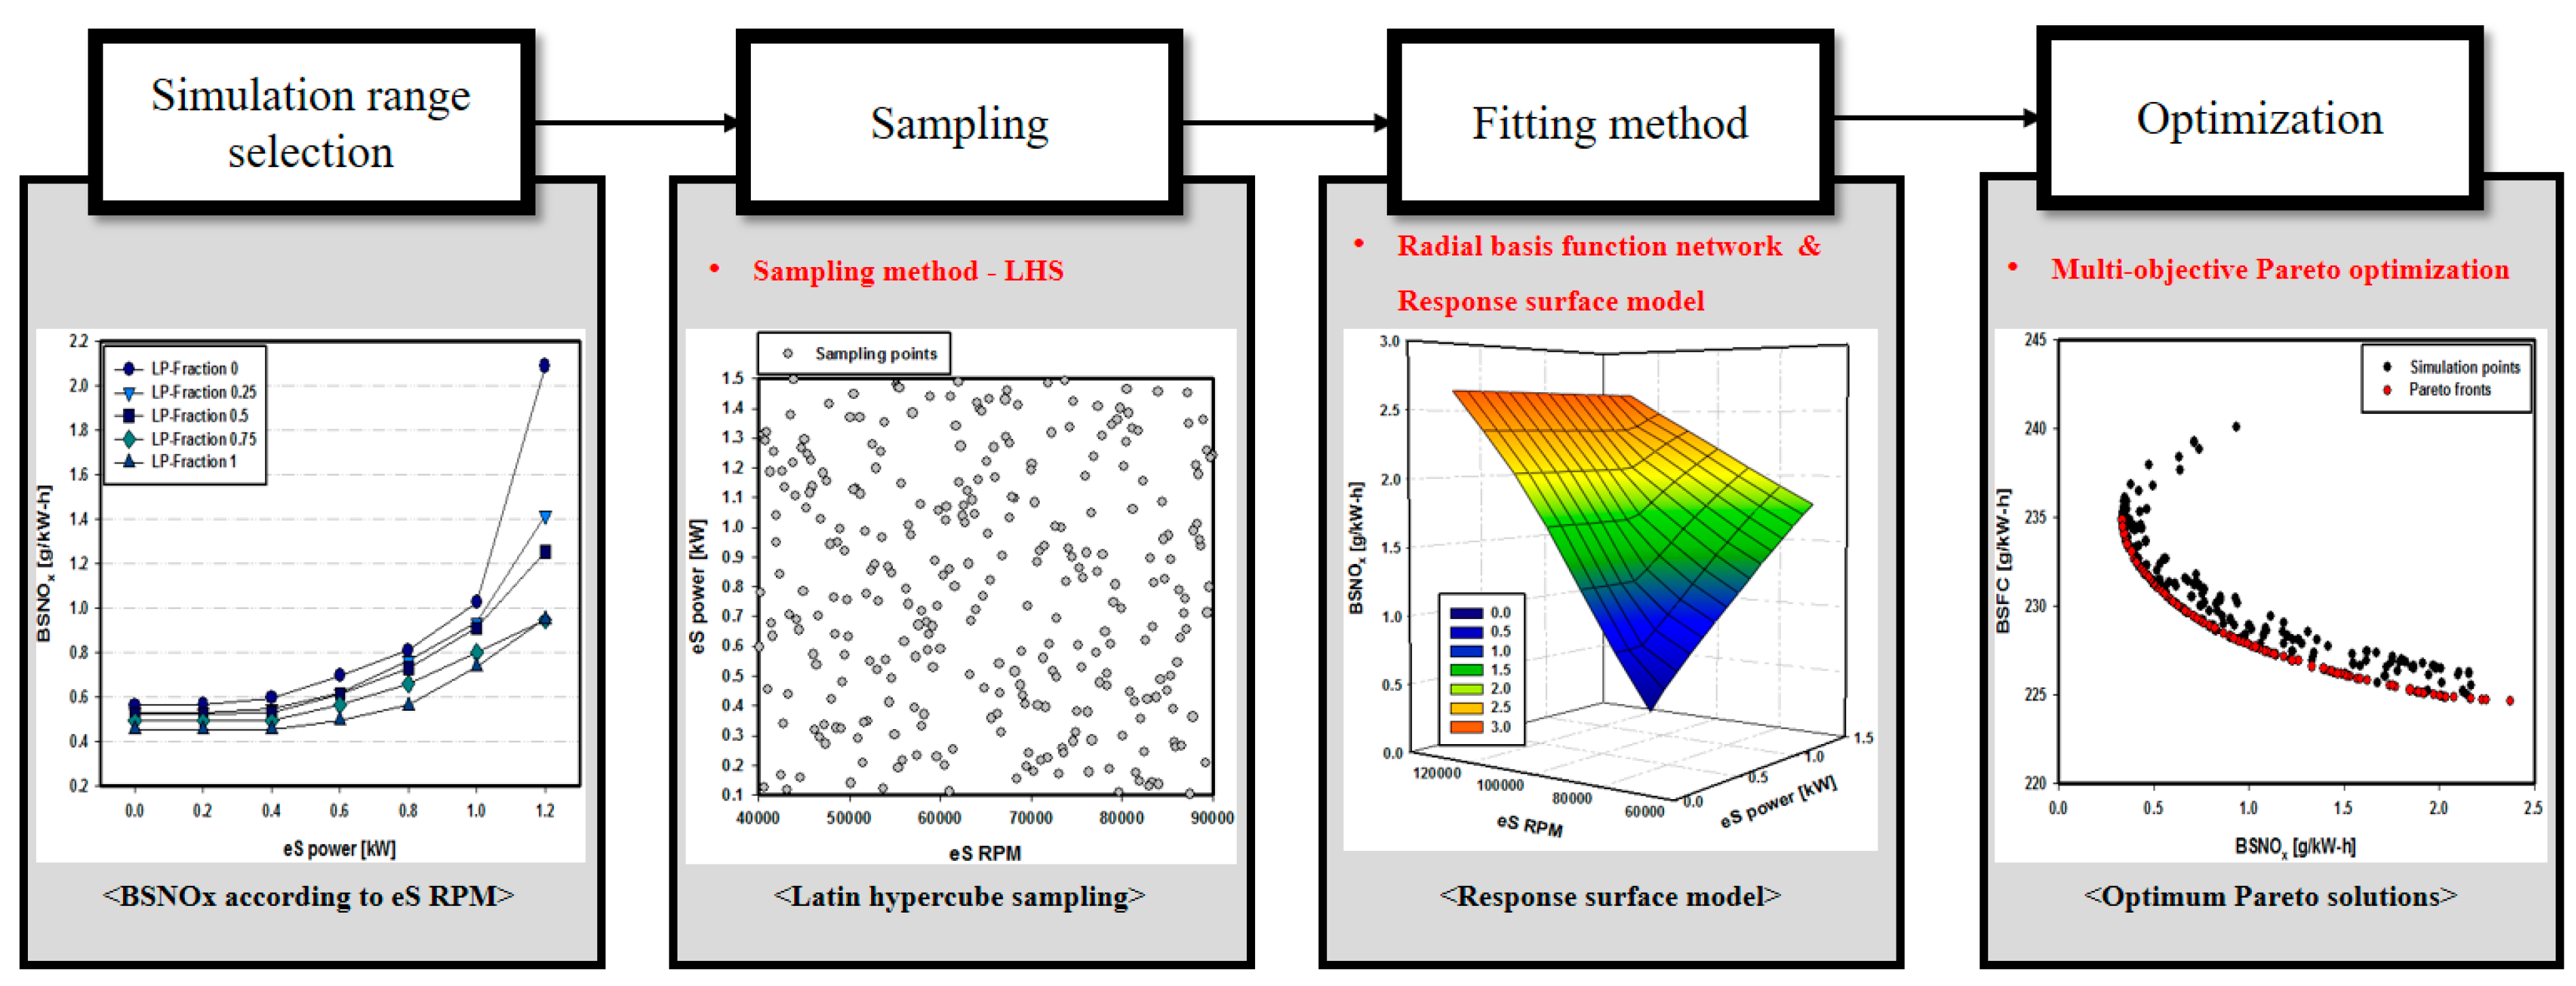
2.2. DoE with Latin Hypercube Sampling (LHS) and Multi-Objective Pareto Optimization
3. Results and Discussion
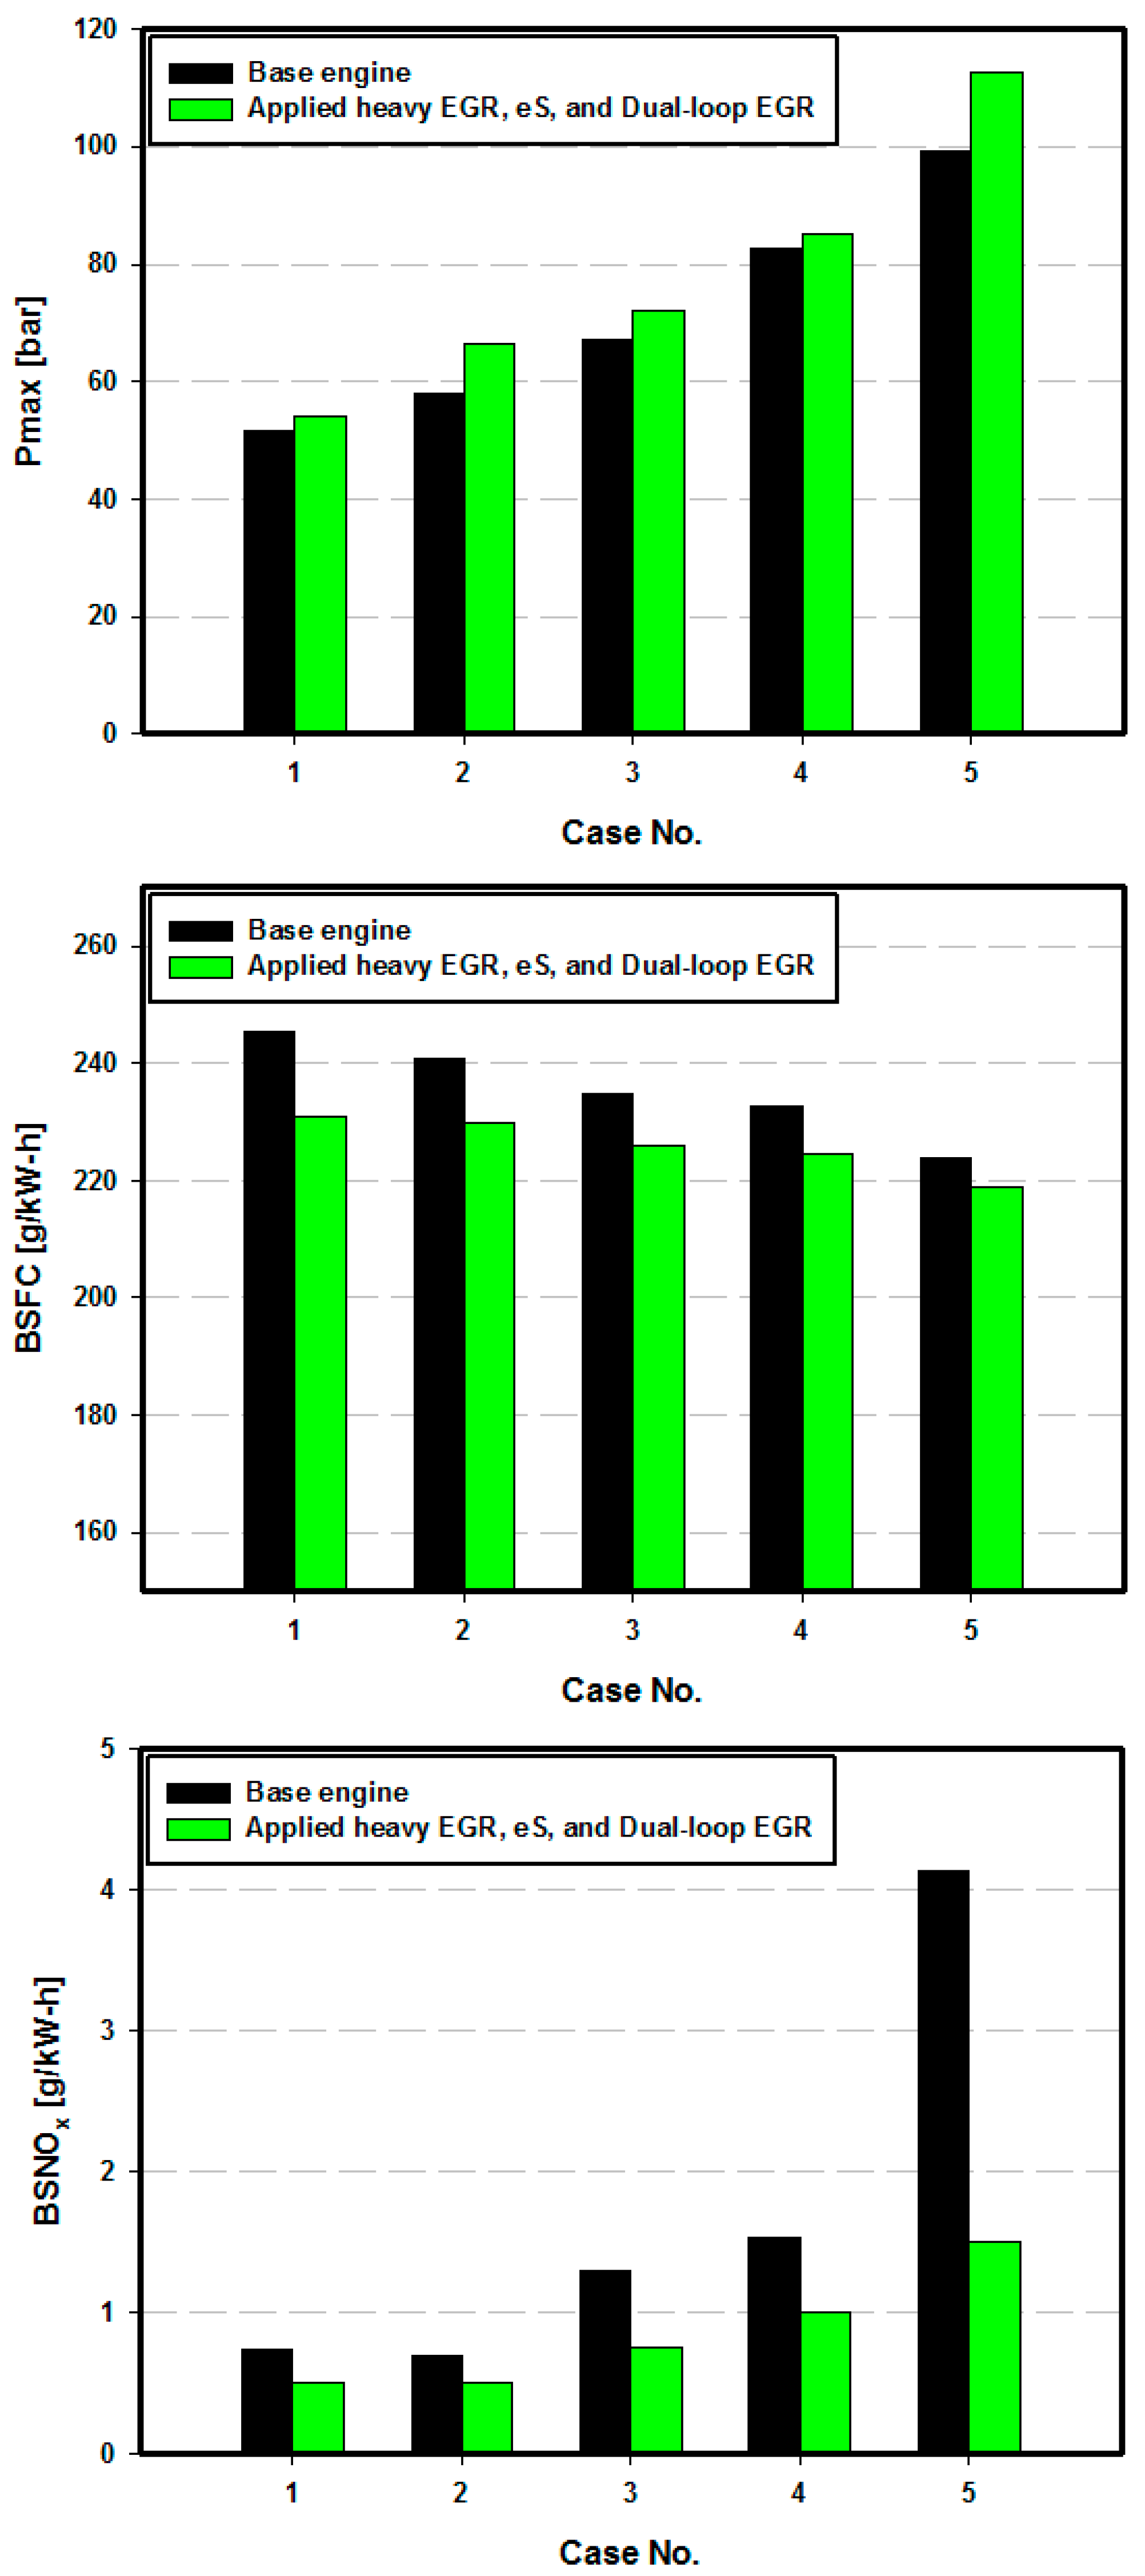
3.1. Validation and Heavy EGR Application
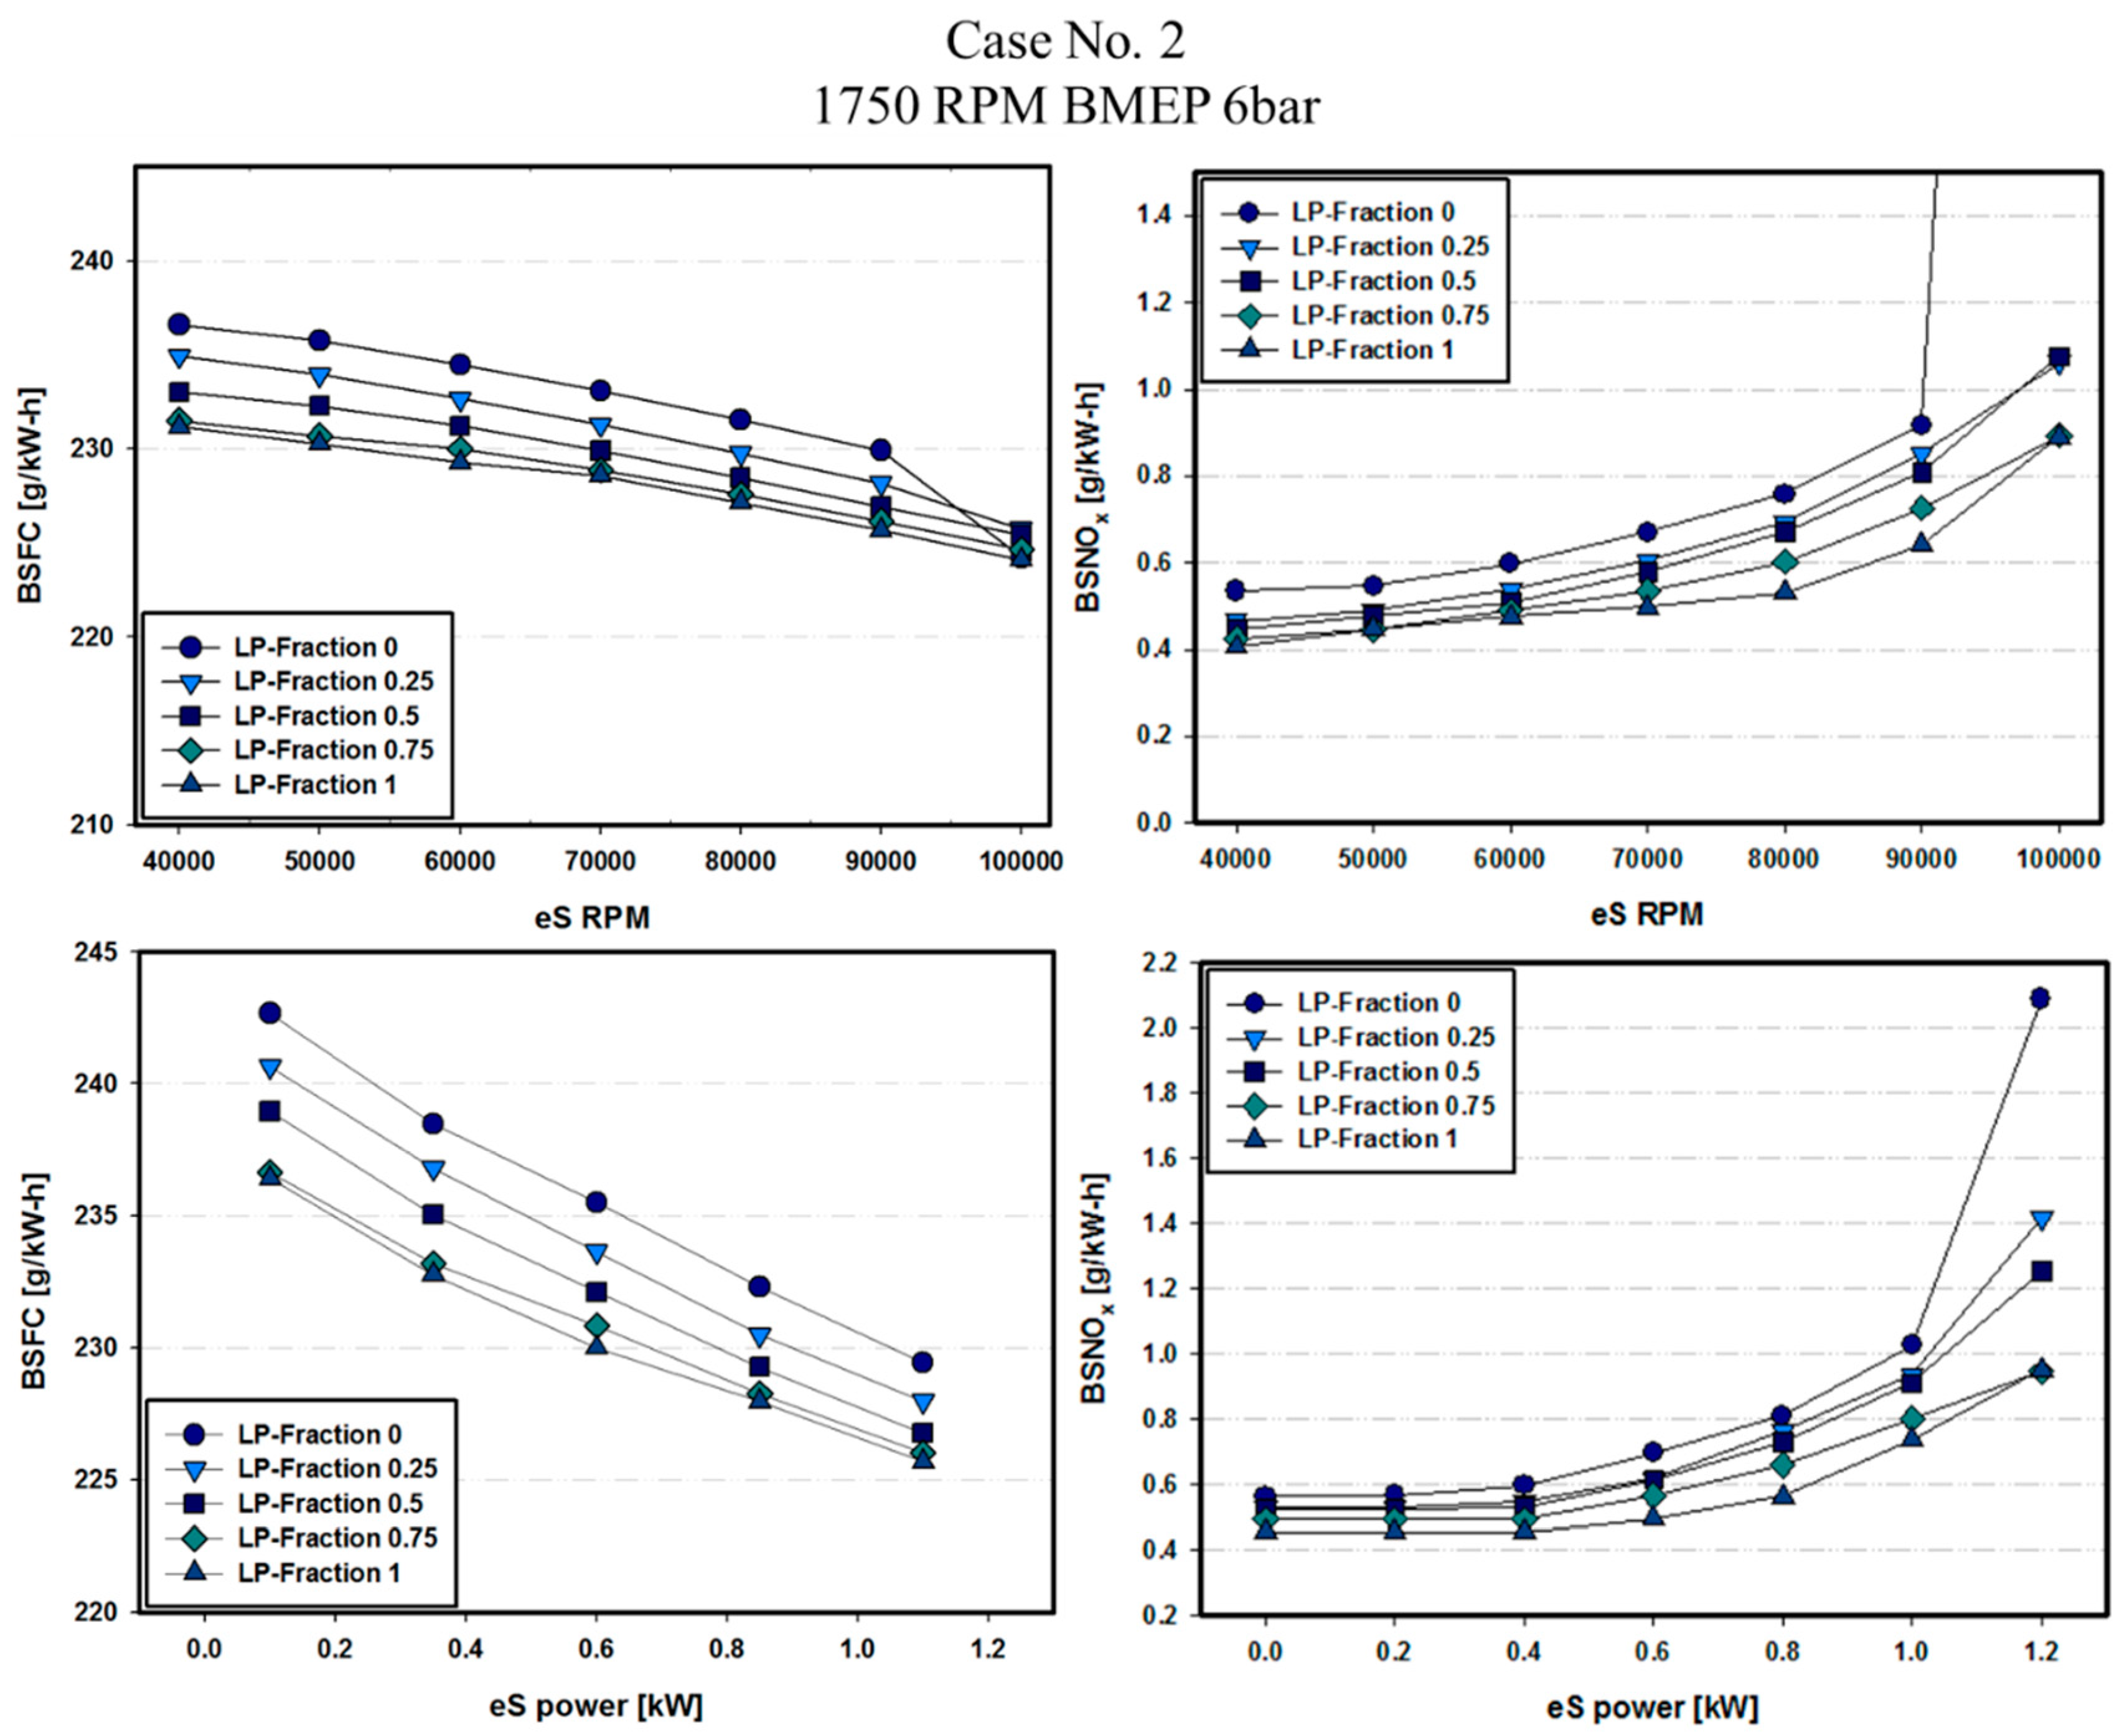
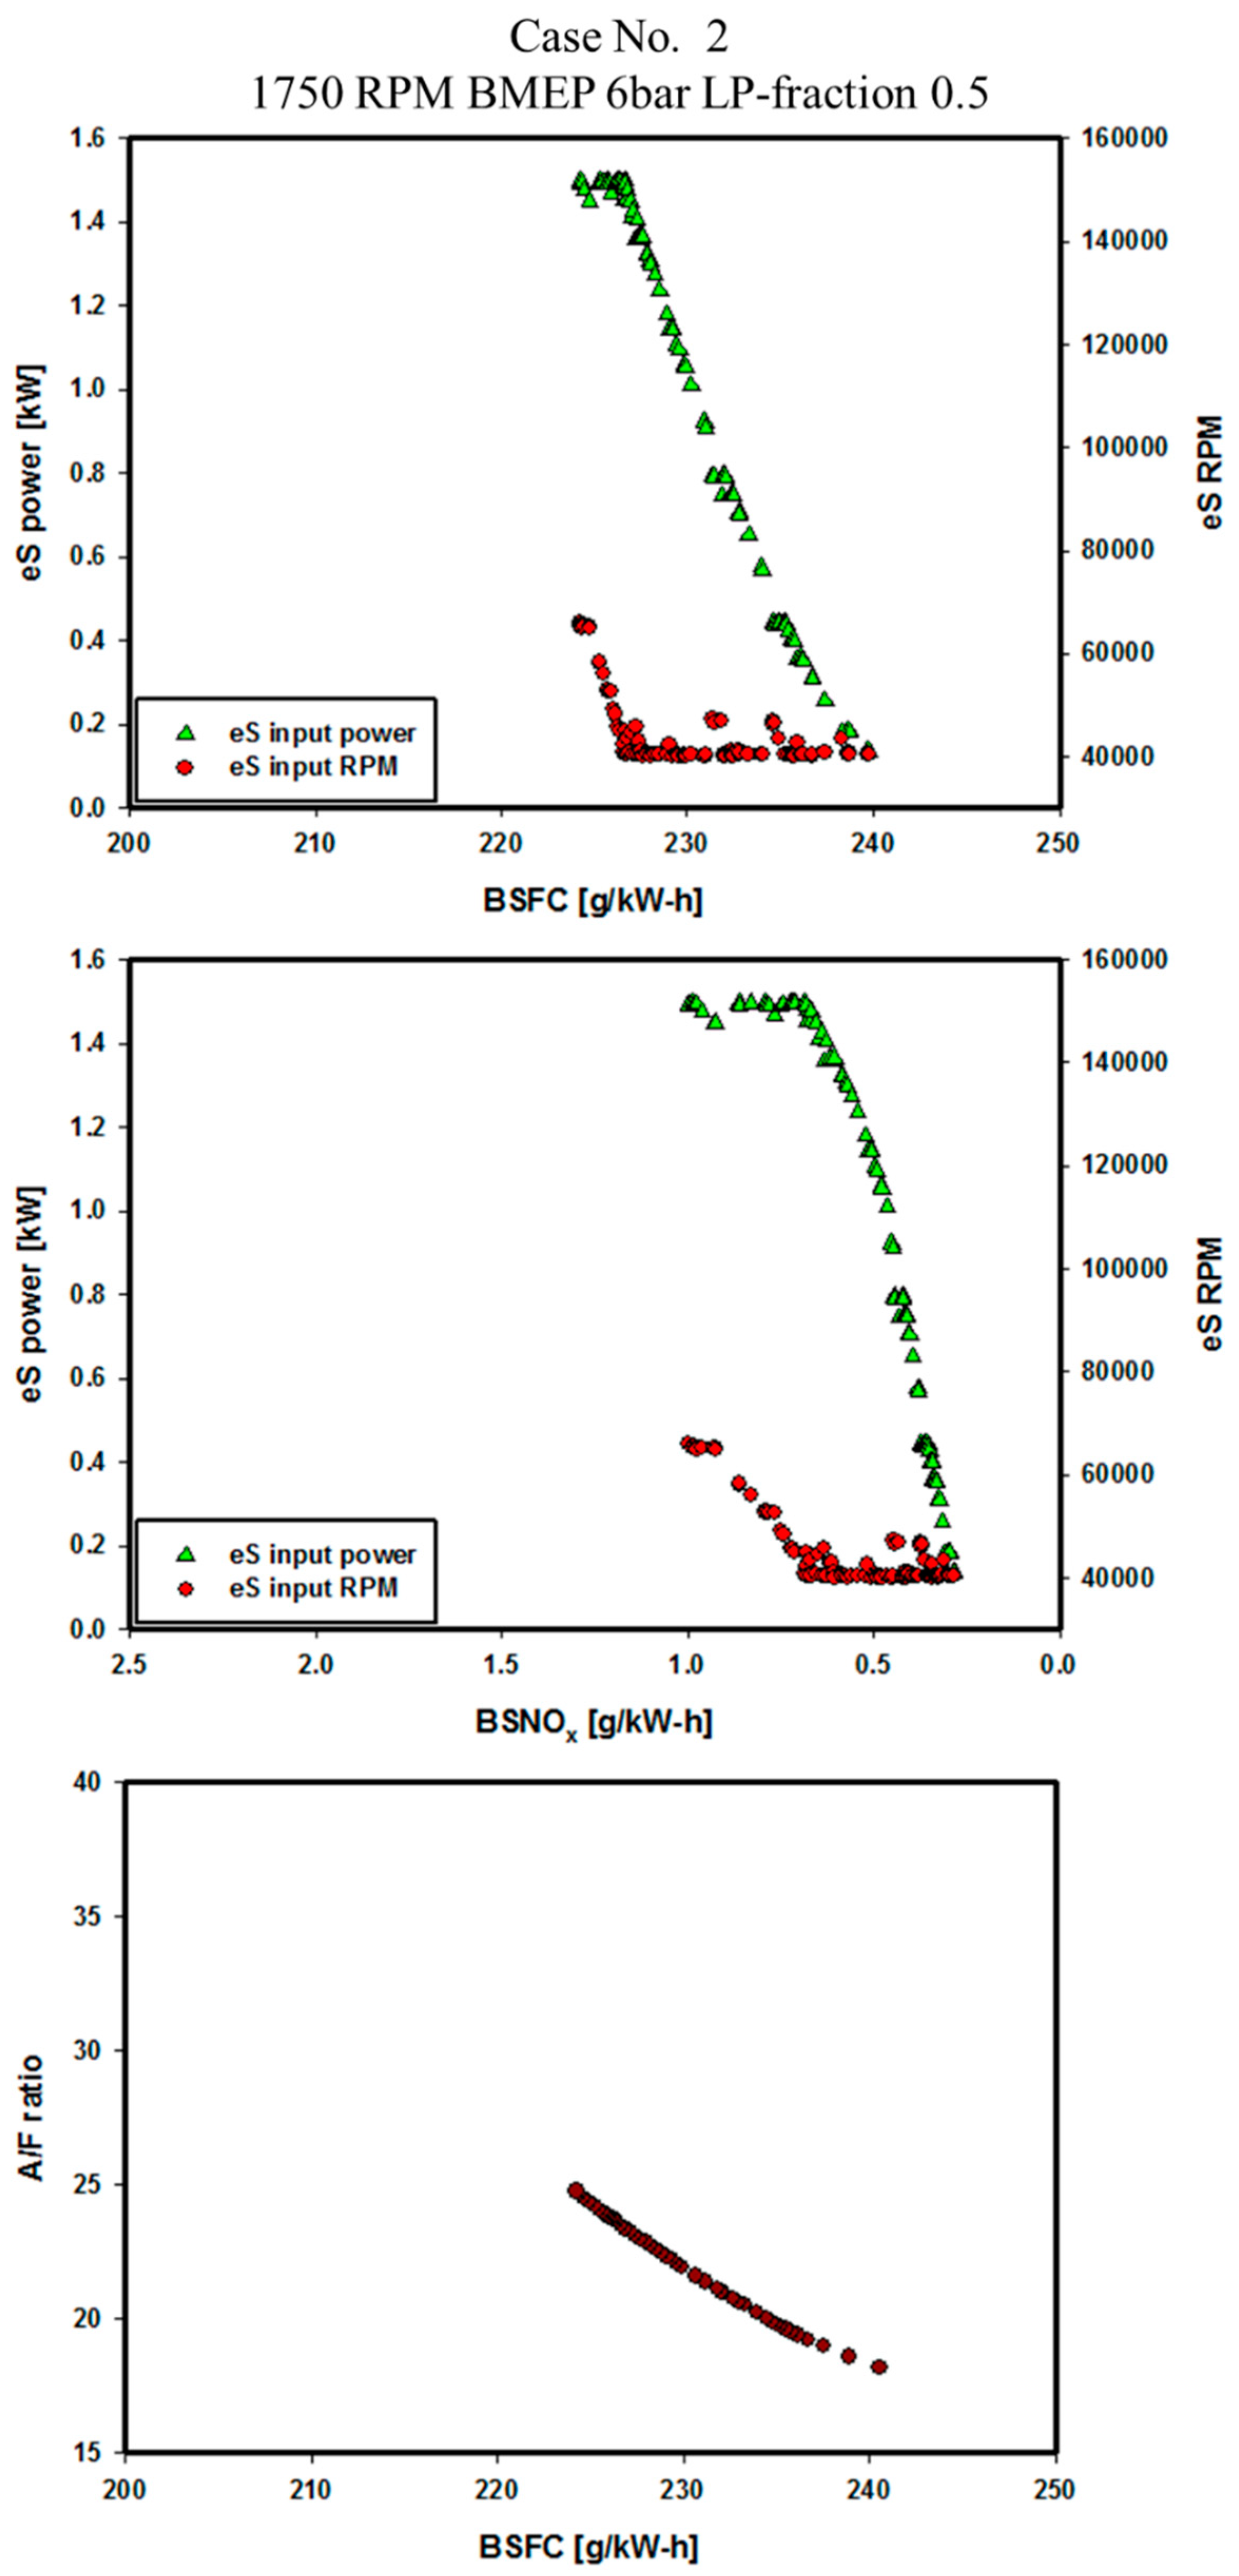
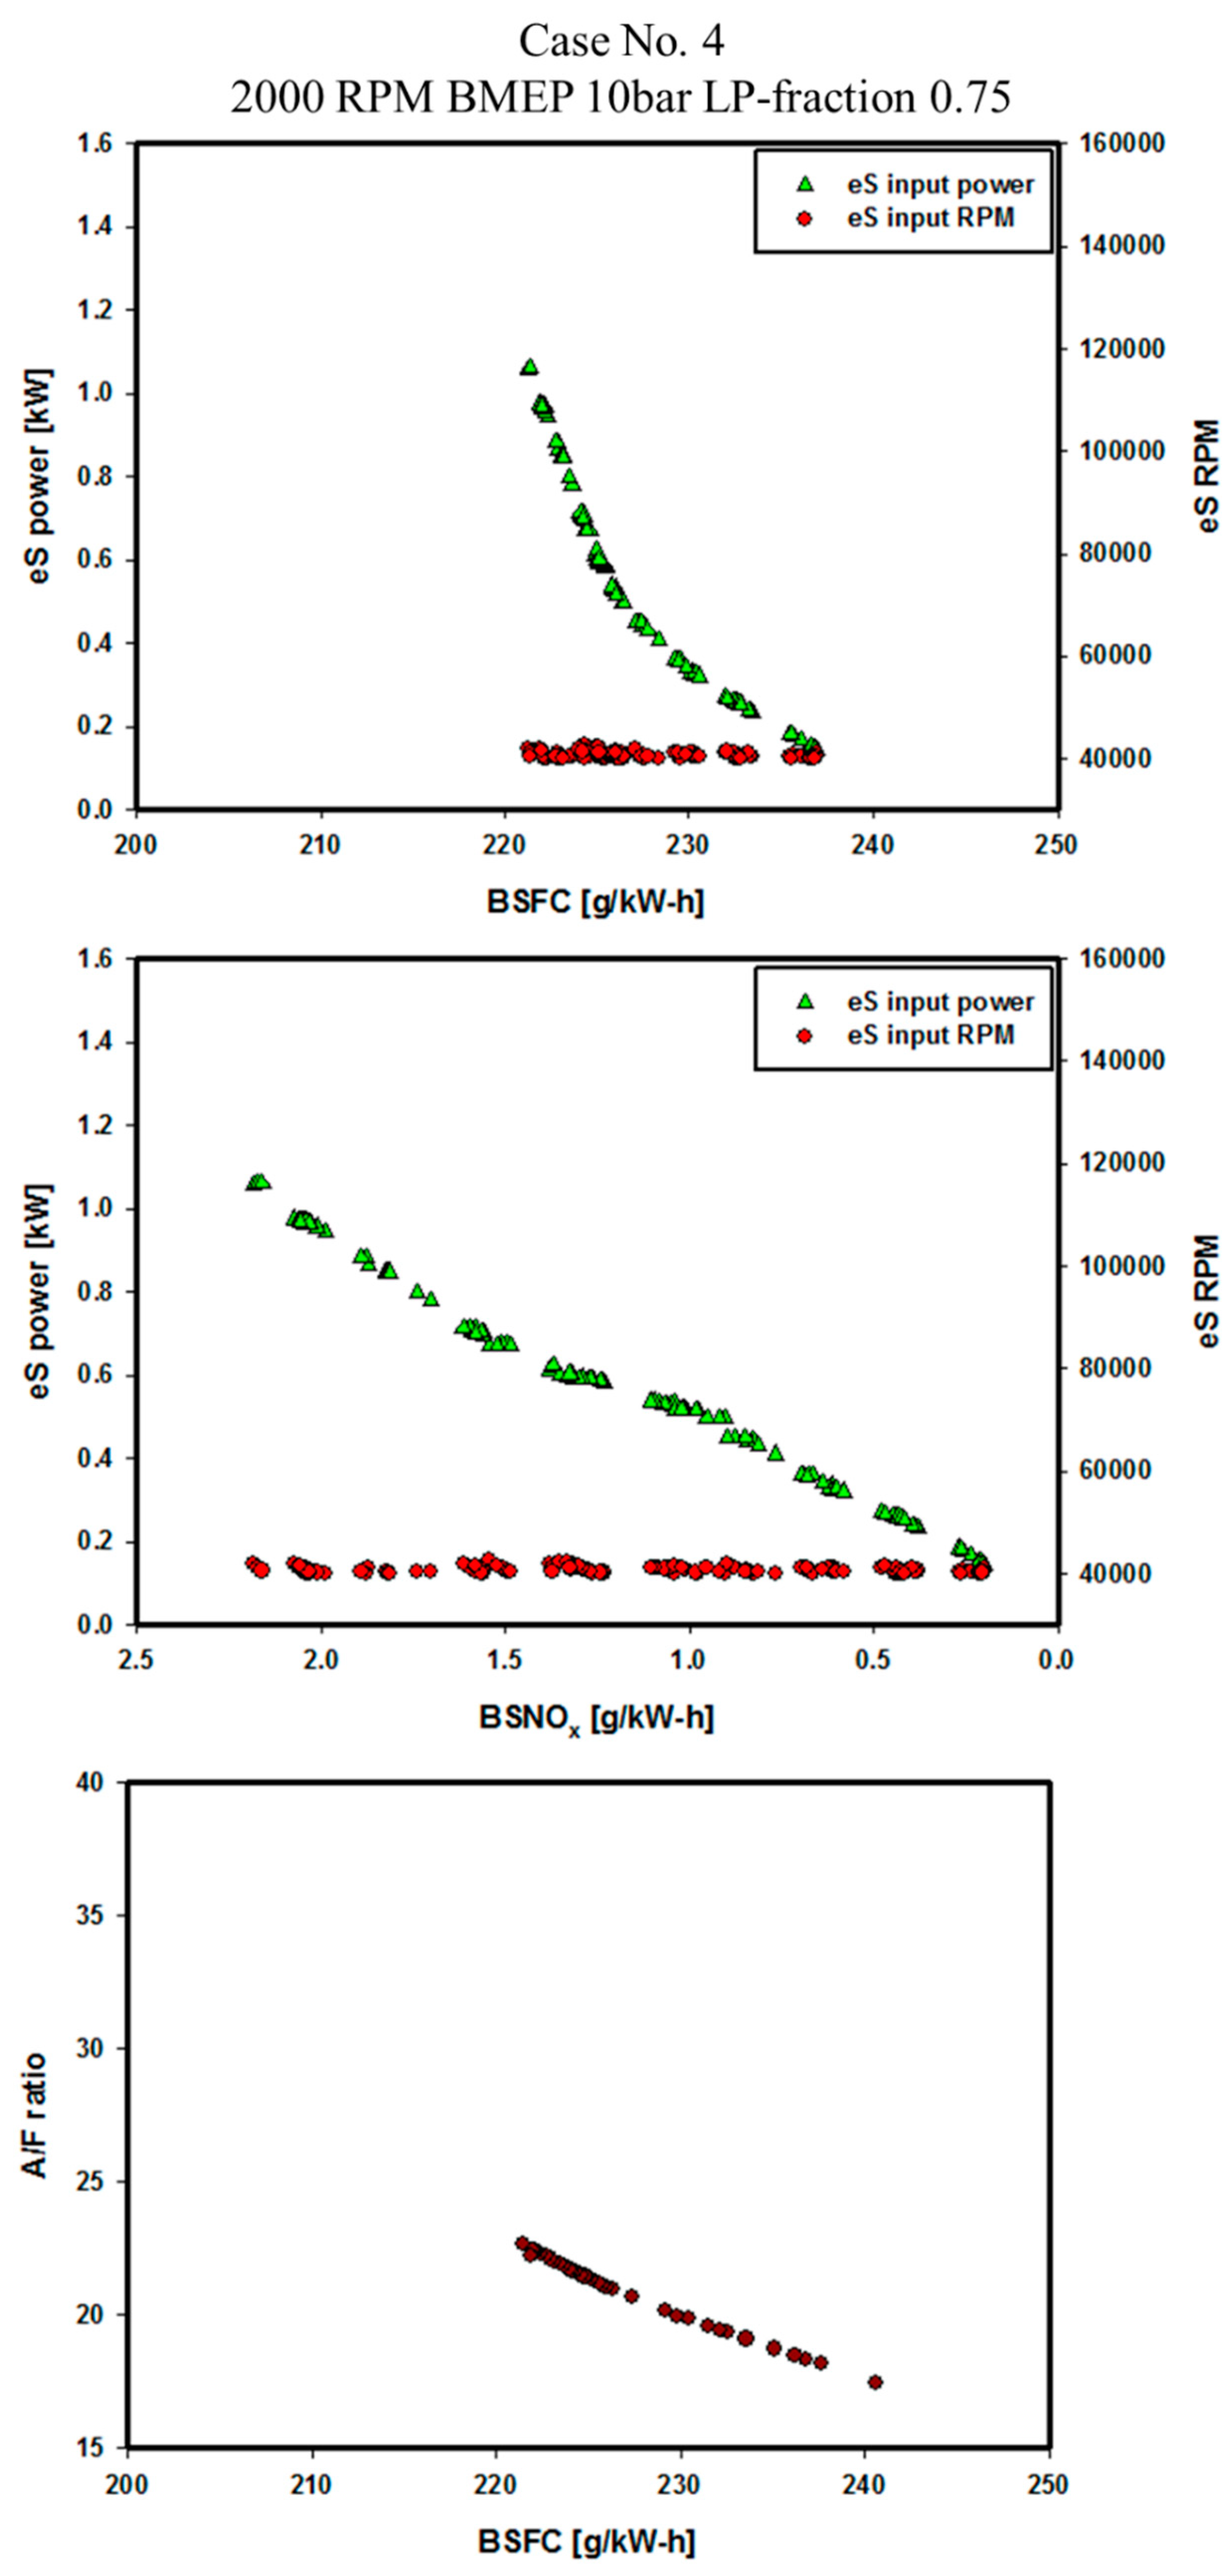
3.2. Effects of the LP Fraction and eS rpm and Power on Fuel Efficiency
3.3. Effects of LP Fraction, eS rpm, and Power on NOx Emissions
3.4. DoE and Multi-Objective Pareto Optimization
3.5. Design Parameter Recommendations
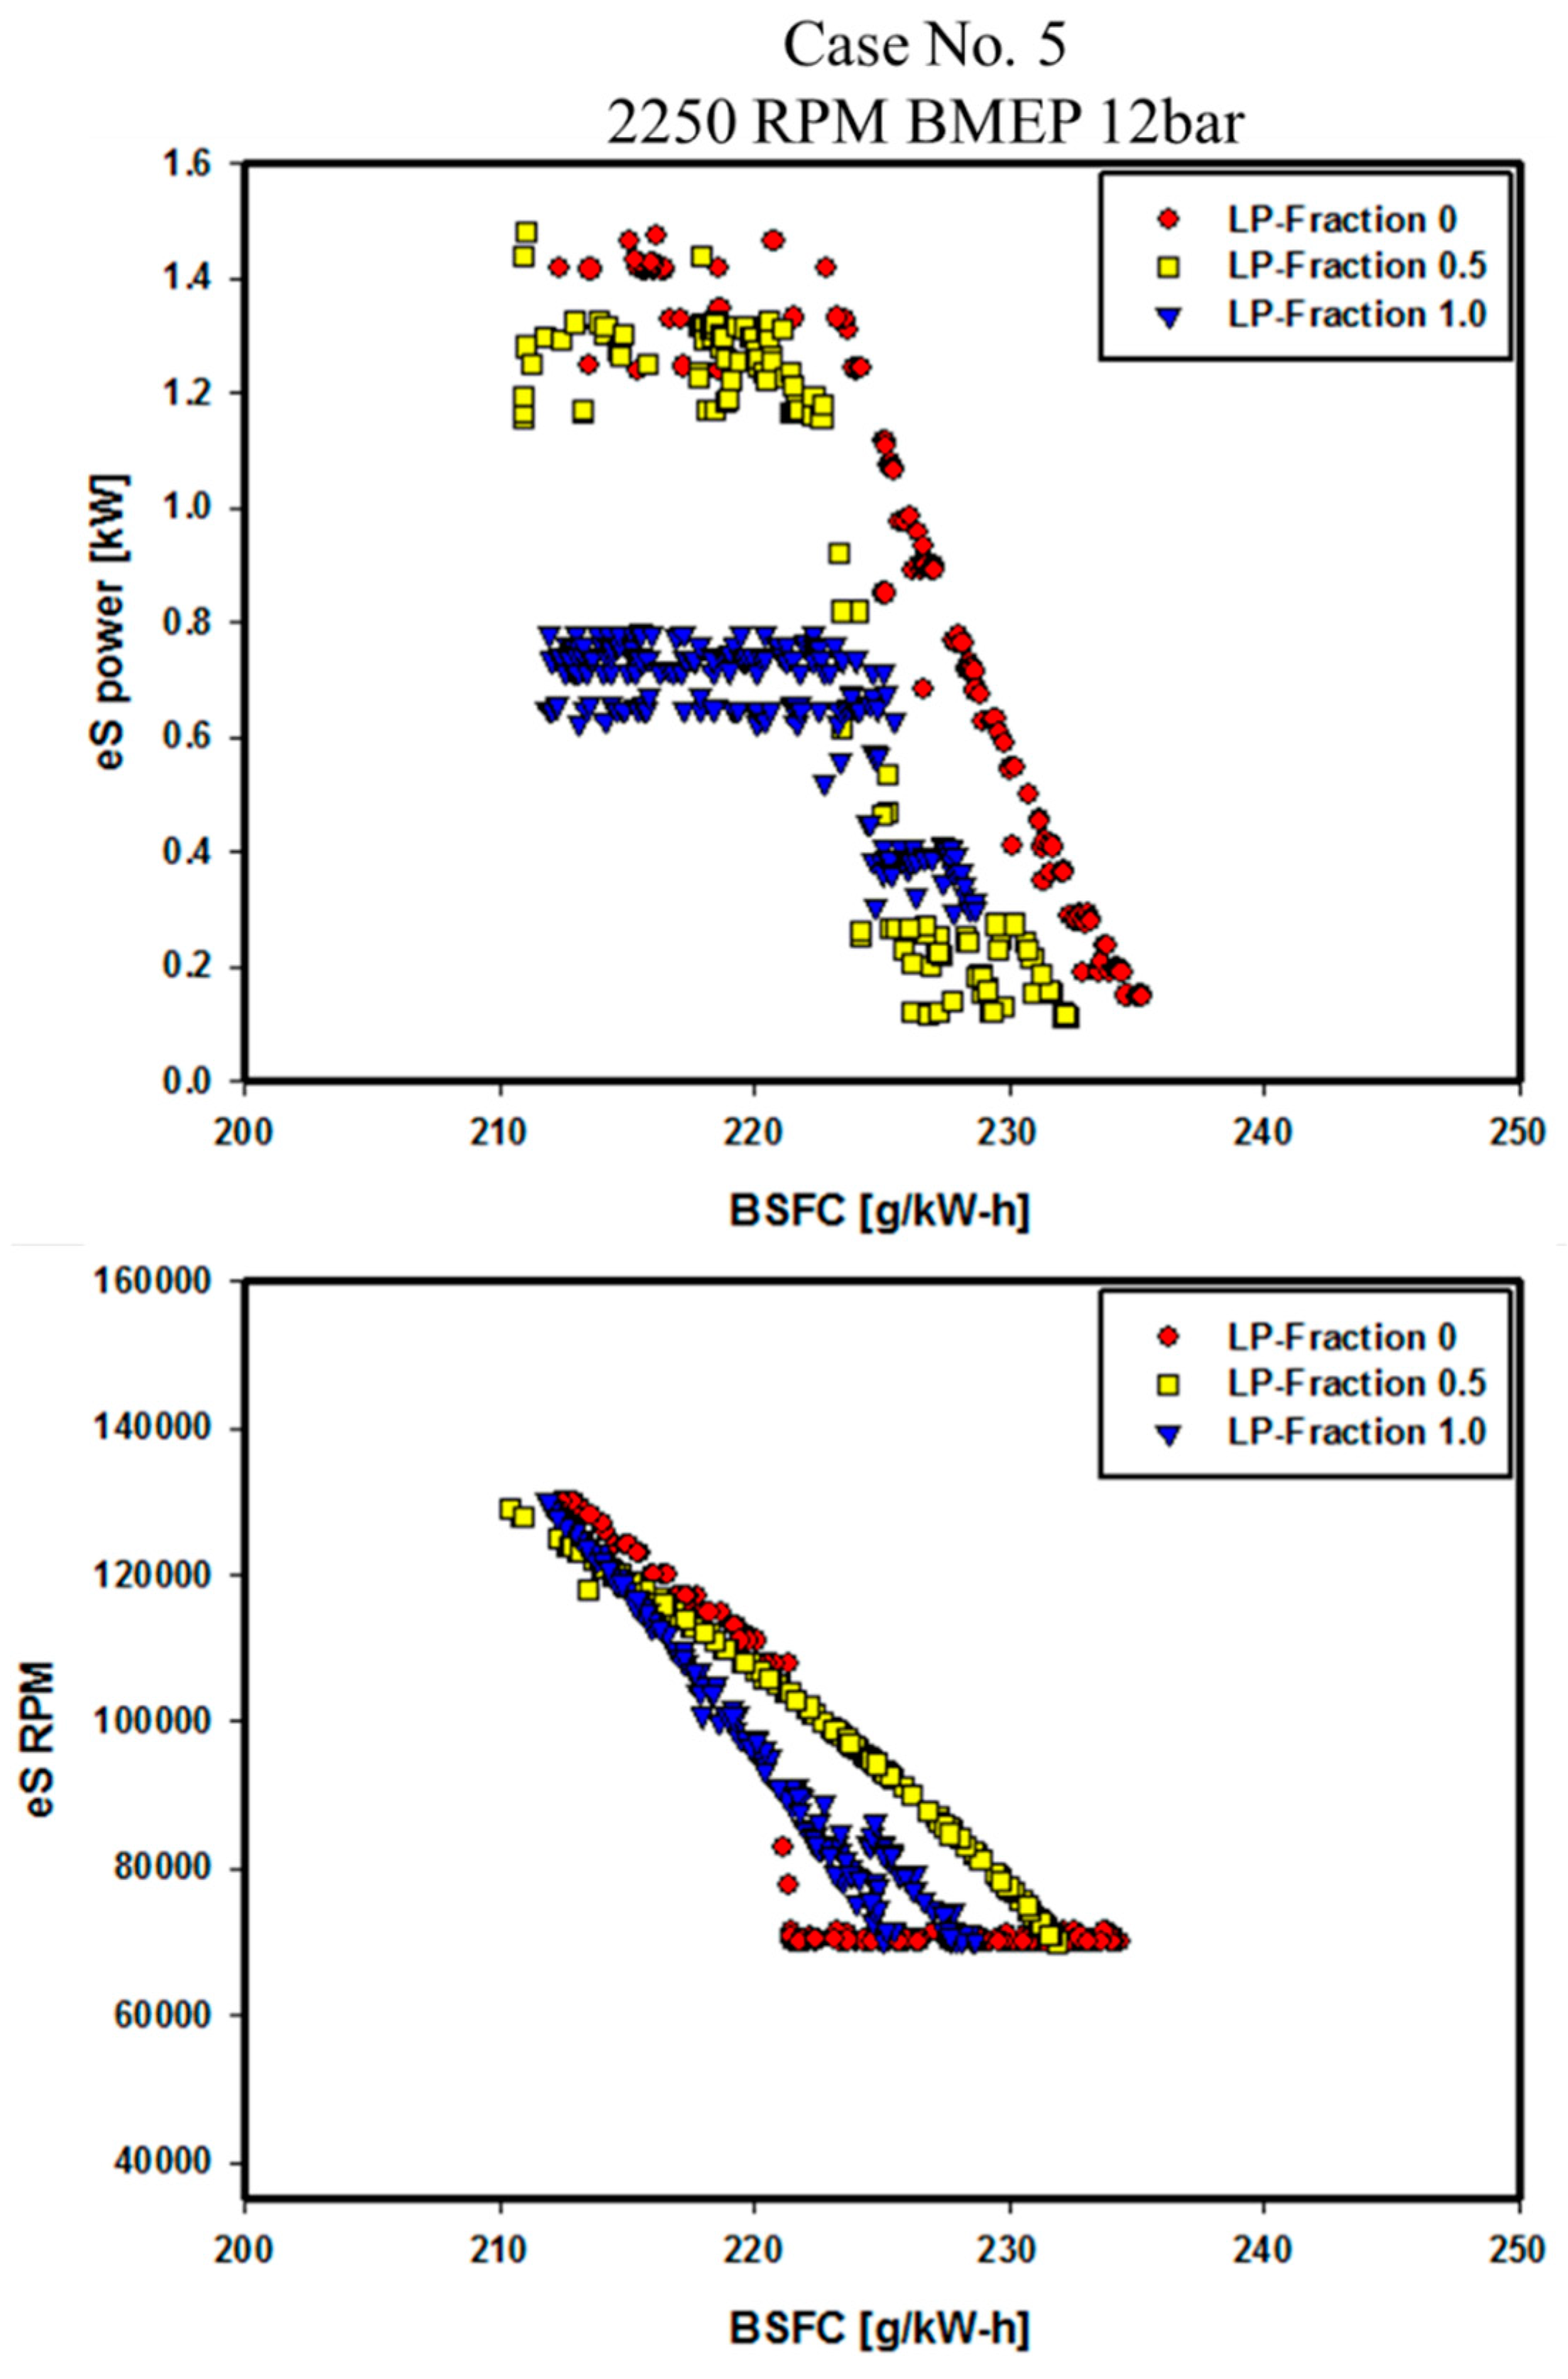
3.6. LP Fraction Effects on eS Power and rpm
3.7. Optimization Results
4. Conclusions
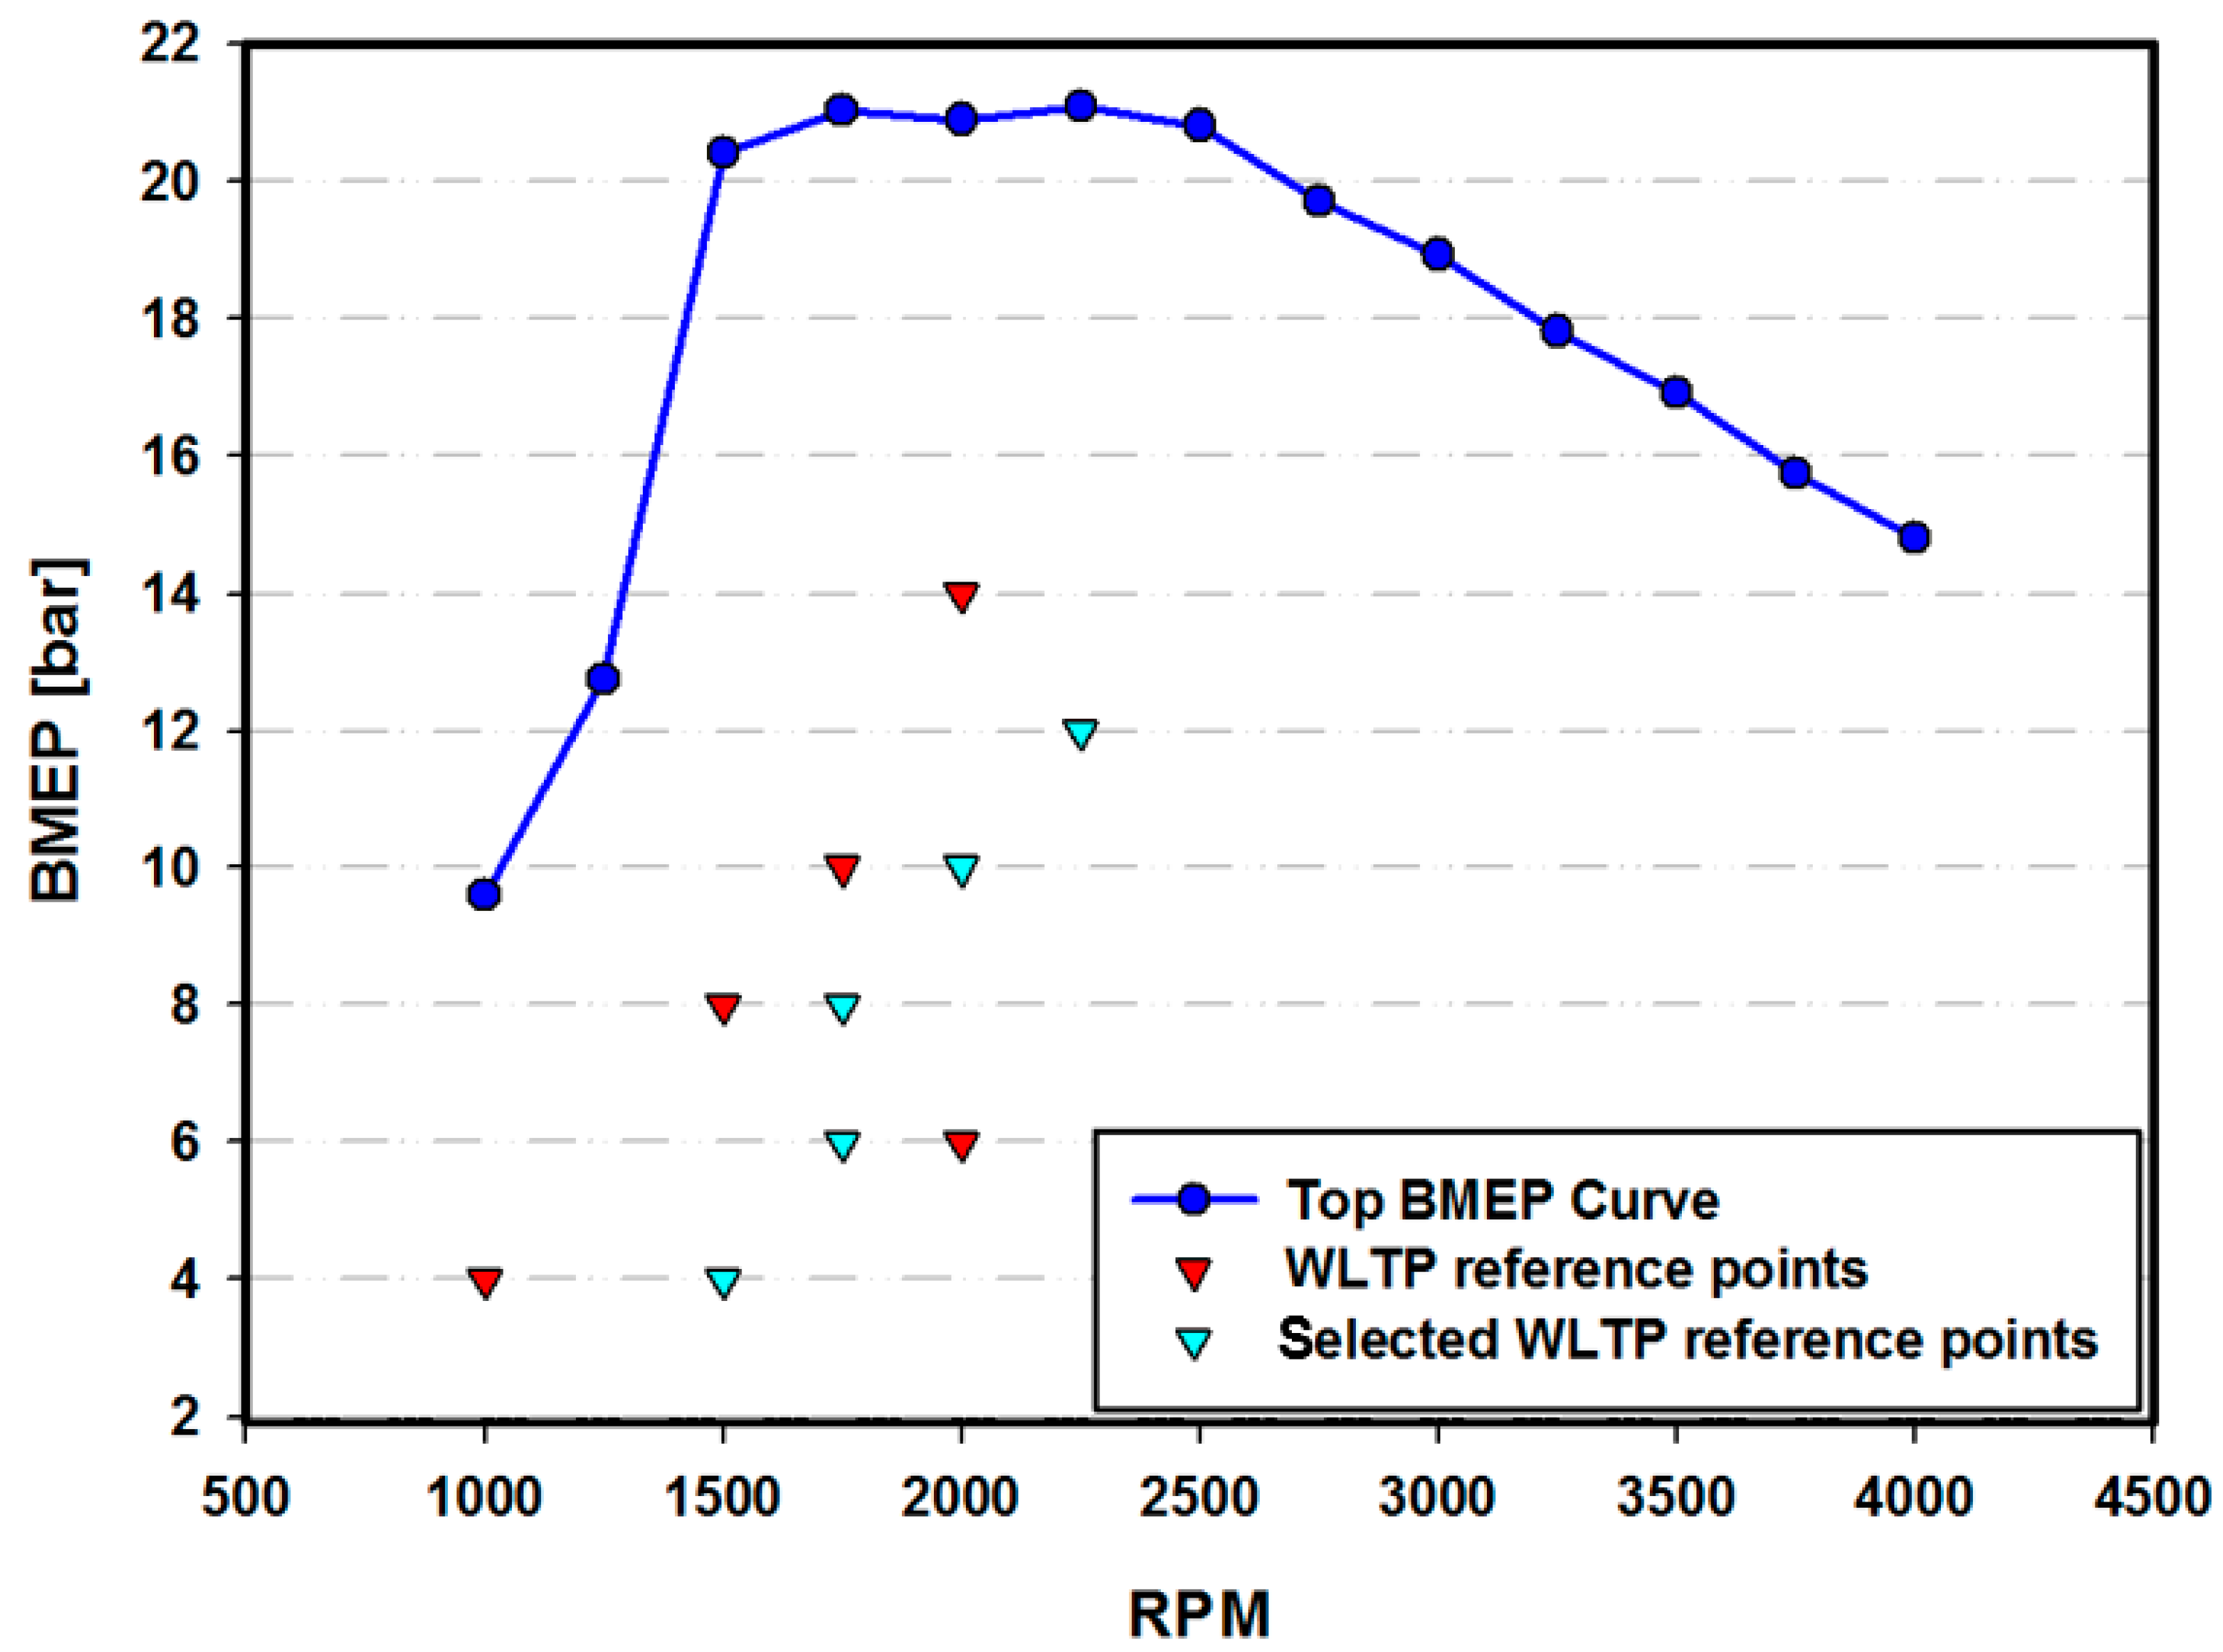
- The engine model was validated with experimental data in five WLTP reference states, using the DI-pulse combustion model. A constant BMEP controller, an eS, and a dual-loop EGR system were added to investigate their effects on the diesel engine.
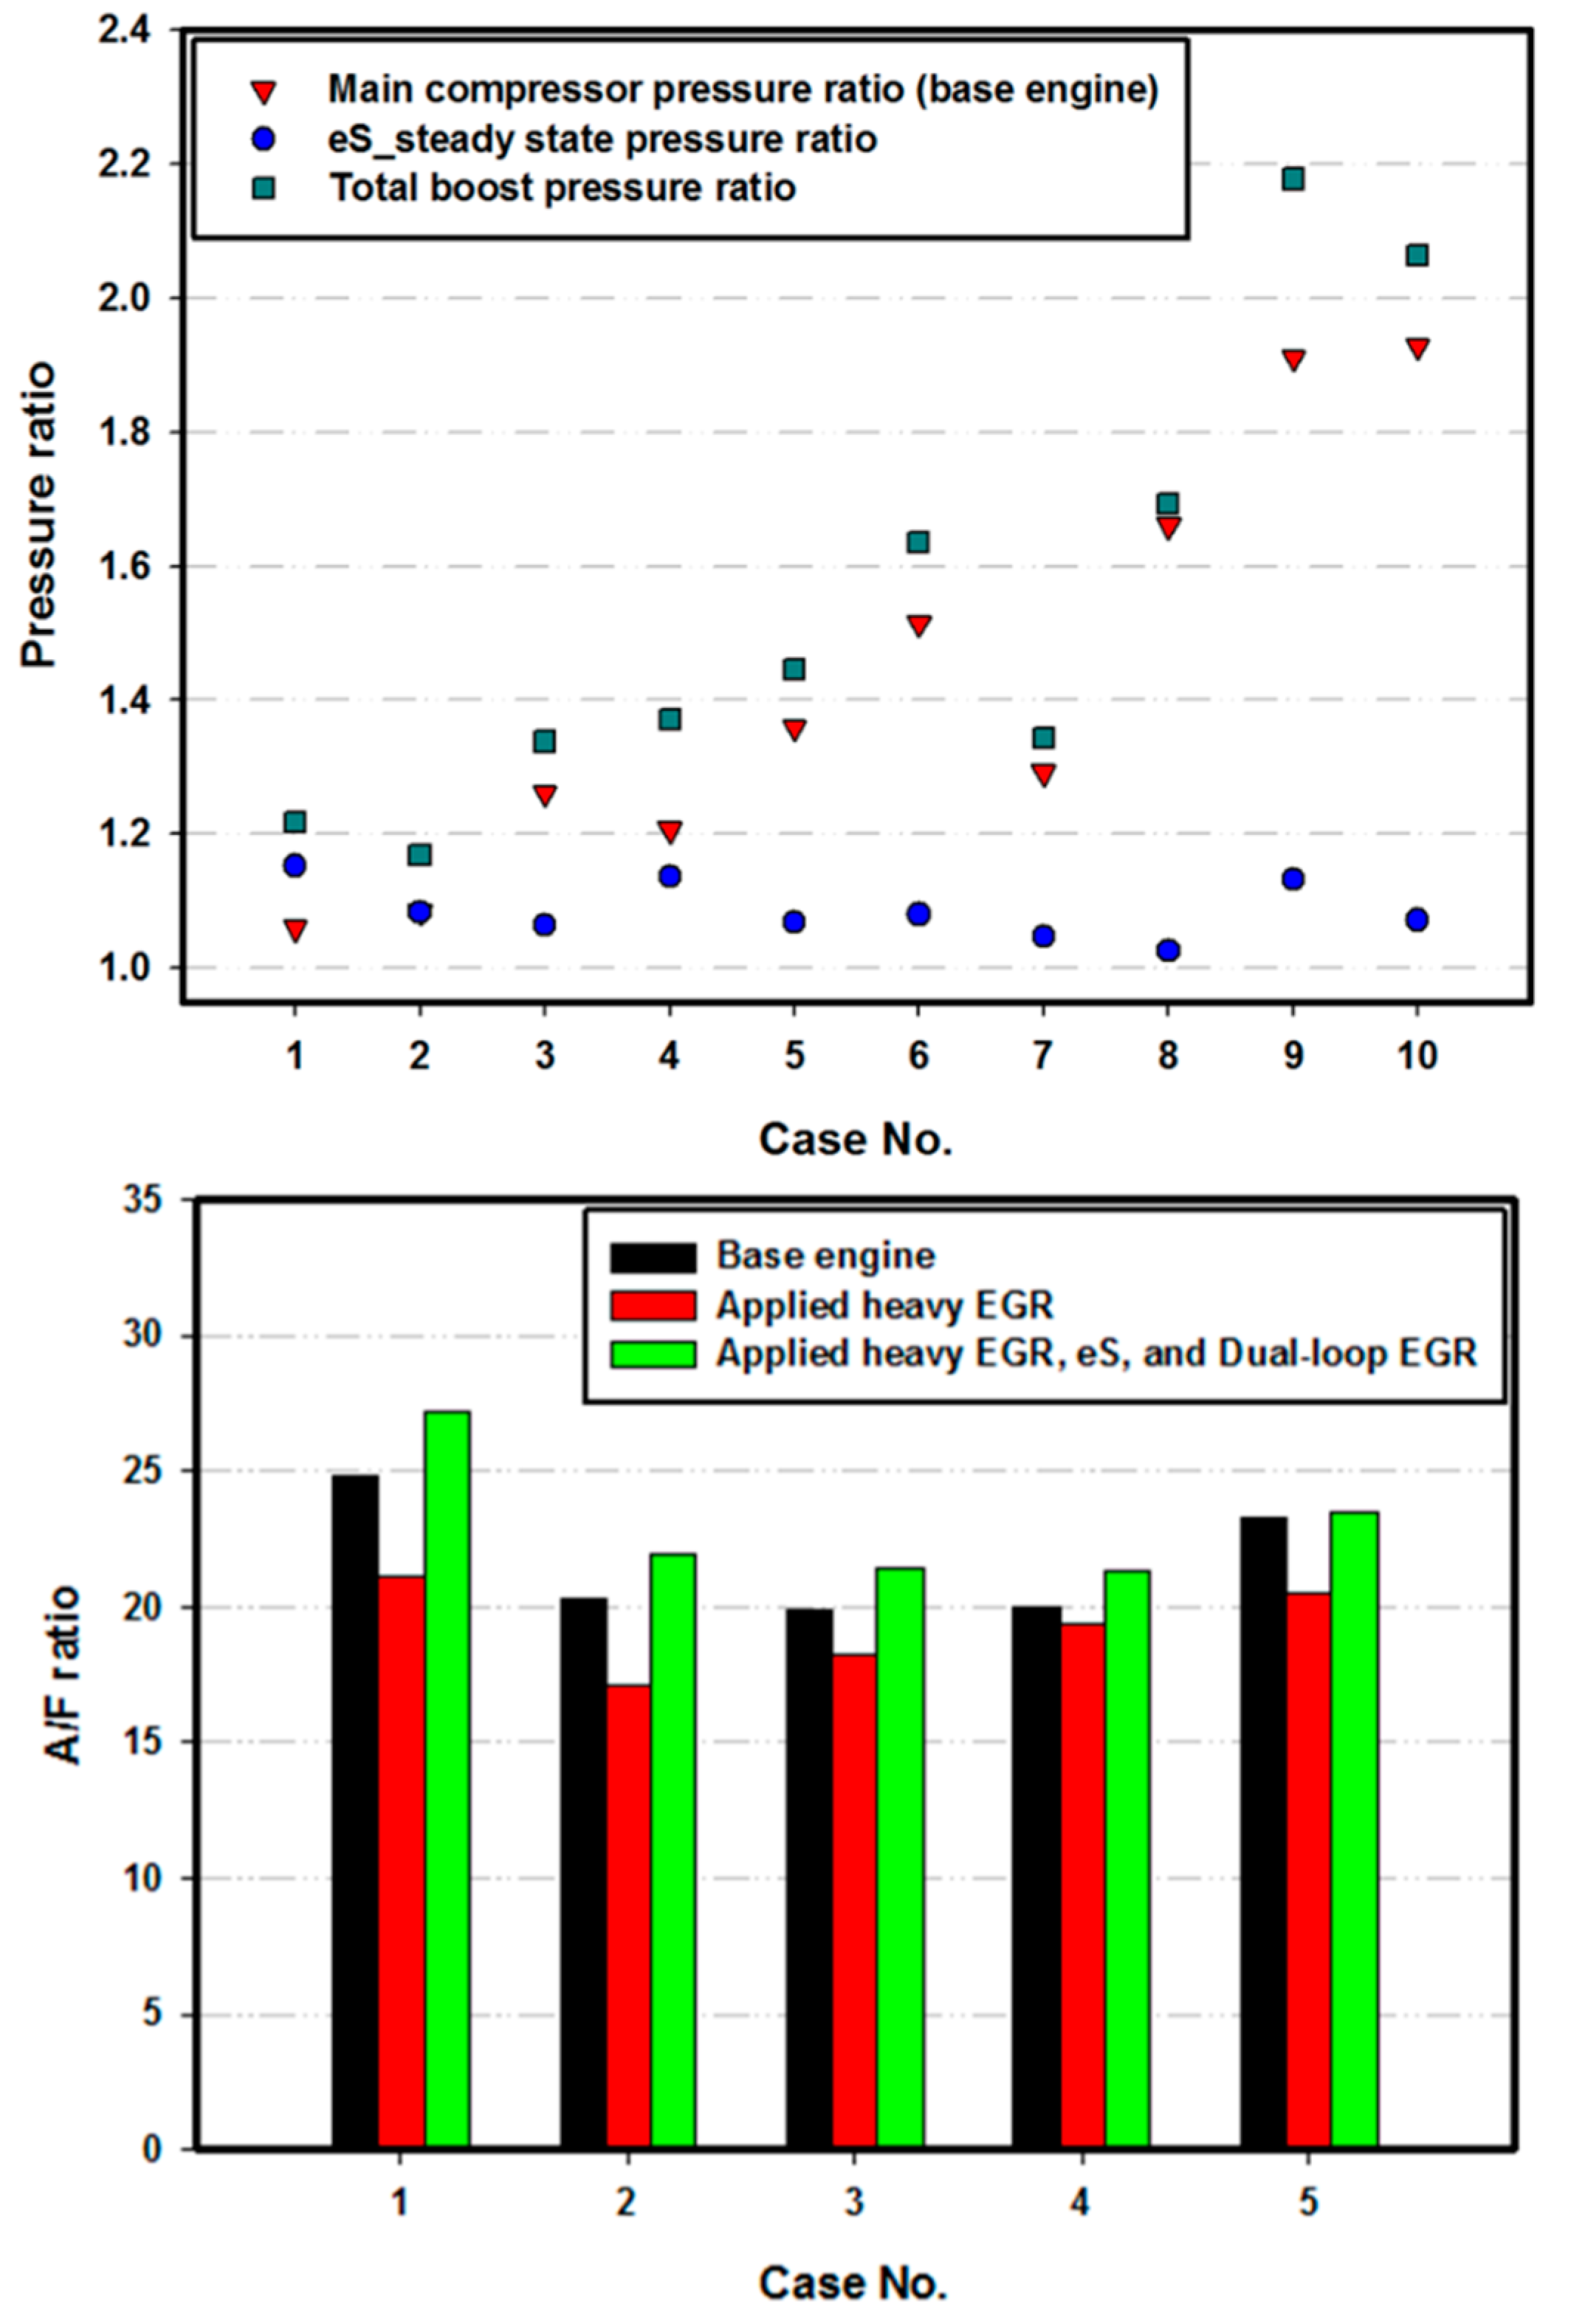
- Heavy EGR was applied in each case. By applying heavy EGR, NOx emissions were decreased by a maximum of 84%, whereas BSFC deteriorated by a maximum of 4%.
- The effects of eS power, eS rpm, and LP fraction were investigated under constant BMEP conditions. As eS power and rpm increased, the BSFC of the engine decreased. This was because the thermal efficiency also increased due to an increase in intake pressure. However, the increase in BSNOx was due to an increase in thermal NOx emissions. Moreover, as the LP-fraction increased, BSFC and BSNOx both decreased due to the increased efficiency of the turbocharger and the cooled EGR.
- Using DoE and RBFN methods, response surface plots of BSFC and BSNOx were obtained according to eS power and rpm under all LP fraction conditions. A multi-objective Pareto optimization was conducted using response surface plots and optimal Pareto fronts were obtained.
- By tracking the A/F ratio through the Pareto front lines, it was seen that, although as the A/F ratio increased the fuel efficiency of the engine increased, NOx emissions also increased simultaneously. The A/F ratio was controlled primarily by eS power. As the LP fraction increased, the power needed to obtain the same BSFC decreased. This was because eS efficiency increased in response to an increase in the air flow rate. However, in case 5, as the LP fraction increased, eS rpm became the major controller of the A/F ratio and little extra power was needed to achieve the same BSFC.
- By applying and optimizing heavy EGR, eS, and dual-loop EGR, NOx emissions were decreased by 63.73% in case 5. Moreover, the efficiency was improved by a maximum of 5.86% in case 1, in which the NOx emissions were decreased by 32.87%.
Author Contributions
Funding
Conflicts of Interest
Abbreviations
| CI | Compression ignition |
| NOx | Nitrogen oxides |
| PM | Particulate matters |
| WLTP | Worldwide harmonized light-duty vehicles test procedures |
| EGR | Exhaust gas recirculation |
| DPF | Diesel particulate filter |
| LNT | Lean NOx trap |
| SCR | Selective catalytic reduction |
| eS | Electric supercharger |
| LTC | Low-temperature combustion |
| HP-EGR | High-pressure EGR |
| LP-EGR | Low-pressure EGR |
| HECC | High-efficiency clean combustion |
| BSNOx | Brake-specific NOx |
| ESI | EGR split index |
| NEDC | New European Driving Cycle |
| BSFC | Brake-specific fuel consumption |
| DoE | Design of experiment |
| BMEP | Brake mean effective pressure |
| A/F ratio | Air fuel ratio |
| TDC | Top dead center |
| PID | Proportional integral derivative |
| DI-pulse | Diesel multi-pulse |
| IVC | Intake valve closing |
| LHS | Latin hypercube sampling |
| RBFN | Radial basis function network |
| rpm | revolution per minute |
| LSM | Least-squares method |
| ANN | Artificial neural network |
References
- Heywood, J.B. Internal Combustion Engine Fundamentals; Mcgraw-Hill: New York, NY, USA, 1988. [Google Scholar]
- Aoyagi, Y.; Kunishima, E.; Asaumi, Y.; Aihara, Y.; Odaka, M.; Goto, Y. Diesel Combustion and Emission Study by Using of High Boost and High Injection Pressure in Single Cylinder Engine: The effects of boost pressure and timing retardation on thermal efficiency and exhaust emissions (Diesel Engines, Performance and Emissions, Thermal Efficiency). In Proceedings of the International Symposium on Diagnostics and Modeling of Combustion in Internal Combustion Engines, Yokohama, Japan, 02 August 2004; pp. 119–126. [Google Scholar]
- Aoyagi, Y.; Osada, H.; Misawa, M.; Hirosawa, T.; Odaka, M.; Goto, Y. Diesel emission reduction using high boost and high EGR rate in a single cylinder engine. Rev. Automot. Eng. 2005, 26, 391. [Google Scholar]
- Wakisaka, Y.; Hotta, Y.; Inayoshi, M.; Nakakita, K.; Sakata, I.; Takano, T. Emissions reduction potential of extremely high boost and high EGR rate for an HSDI diesel engine and the reduction mechanisms of exhaust emissions. SAE Int. J. Fuels Lubr. 2008, 1, 611–623. [Google Scholar] [CrossRef]
- Maiboom, A.; Tauzia, X.; Hétet, J.F. Experimental study of various effects of exhaust gas recirculation (EGR) on combustion and emissions of an automotive direct injection diesel engine. Energy 2008, 33, 22–34. [Google Scholar] [CrossRef]
- NOx reduction in High Boost, Wide Range and High EGR Rate in a Heavy Duty Diesel Engine. Available online: https://www.researchgate.net/publication/280294531_Effective_NOx_Reduction_in_High_Boost_Wide_Range_and_High_EGR_Rate_in_a_Heavy_Duty_Diesel_Engine (accessed on 15 October 2019).
- Effective BSFC and NOx Reduction on Super Clean Diesel of Heavy Duty Diesel Engine by High Boosting and High EGR Rate. Available online: https://www.researchgate.net/publication/278304516_Effective_BSFC_and_NOx_Reduction_on_Super_Clean_Diesel_of_Heavy_Duty_Diesel_Engine_by_High_Boosting_and_High_EGR_Rate (accessed on 15 October 2019).
- Emission Reduction Potential by Means of High Boost and Injection Pressure at Low-and Mid-Load for a Common Rail Diesel Engine under High EGR Rates. Available online: https://www.researchgate.net/publication/287183801_Emission_Reduction_Potential_by_Means_of_High_Boost_and_Injection_Pressure_at_Low-_and_Mid-Load_for_a_Common_Rail_Diesel_Engine_under_High_EGR_Rates (accessed on 15 October 2019).
- Lee, Y.; Huh, K.Y. Analysis of different modes of low temperature combustion by ultra-high EGR and modulated kinetics in a heavy duty diesel engine. Appl. Therm. Eng. 2014, 70, 776–787. [Google Scholar] [CrossRef]
- Abu-Hamdeh, N.H. Effect of cooling the recirculated exhaust gases on diesel engine emissions. Energy Convers. Manag. 2003, 44, 3113–3124. [Google Scholar] [CrossRef]
- Zheng, M.; Reader, G.T.; Hawley, J.G. Diesel engine exhaust gas recirculation––a review on advanced and novel concepts. Energy Convers. Manag. 2004, 45, 883–900. [Google Scholar] [CrossRef]
- Millo, F.; Giacominetto, P.F.; Bernardi, M.G. Analysis of different exhaust gas recirculation architectures for passenger car diesel engines. Appl. Energy 2012, 98, 79–91. [Google Scholar] [CrossRef]
- Cho, K.; Han, M.; Wagner, R.M.; Sluder, C.S. Mixed-source EGR for enabling high efficiency clean combustion modes in a light-duty diesel engine. SAE Int. J. Engines 2008, 1, 457–465. [Google Scholar] [CrossRef]
- Park, J.; Song, S.; Lee, K.S. Numerical investigation of a dual-loop EGR split strategy using a split index and multi-objective Pareto optimization. Appl. Energy 2015, 142, 21–32. [Google Scholar] [CrossRef]
- Comparison among Different 2-Stage Supercharging Systems for Hsdi Diesel Engines. Available online: https://www.researchgate.net/publication/293815169_Comparison_among_different_2-Stage_Supercharging_systems_for_HSDI_Diesel_engines (accessed on 15 October 2019).
- Tang, Q.; Fu, J.; Liu, J.; Boulet, B.; Tan, L.; Zhao, Z. Comparison and analysis of the effects of various improved turbocharging approaches on gasoline engine transient performances. Appl. Therm. Eng. 2016, 93, 797–812. [Google Scholar] [CrossRef]
- Developing a Performance Specification for an Electric Supercharger to Satisfy a Range of Downsized Gasoline Engine Applications. Available online: https://www.researchgate.net/publication/301242971_Developing_a_Performance_Specification_for_an_Electric_Supercharger_to_Satisfy_a_Range_of_Downsized_Gasoline_Engine_Applications (accessed on 15 October 2019).
- Salehi, R.; Martz, J.; Stefanopoulou, A.; Hansen, T.; Haughton, A. Comparison of High-and Low-Pressure Electric Supercharging of a HDD Engine: Steady State and Dynamic Air-Path Considerations; SAE Technical Paper No. 2016-01-1035; SAE: Troy, MI, USA, 2016. [Google Scholar]
- GT-Suite Version 7.3; Manual; Gamma Technologies Inc.: Westmont, IL, USA, 2012.
- Park, J.; Lee, K.S.; Kim, M.S.; Jung, D. Numerical analysis of a dual-fueled CI (compression ignition) engine using Latin hypercube sampling and multi-objective Pareto optimization. Energy 2014, 70, 278–287. [Google Scholar] [CrossRef]
- Jung, C.; Park, J.; Song, S. Performance and NOx emissions of a biogas-fueled turbocharged internal combustion engine. Energy 2015, 86, 186–195. [Google Scholar] [CrossRef]
- Multi-Objective Optimization of Diesel Engine Emissions and Fuel Economy Using Genetic Algorithms and Phenomenological Model. Available online: https://www.researchgate.net/publication/265870790_Multi-Objective_Optimization_of_Diesel_Engine_Emissions_and_Fuel_Economy_using_Genetic_Algorithms_and_Phenomenological_Model (accessed on 15 October 2019).
- Reduction of Heavy Duty Diesel Engine Emission and Fuel Economy with Multi-Objective Genetic Algorithm and Phenomenological Model. Available online: https://www.researchgate.net/publication/267954576_Reduction_of_Heavy_Duty_Diesel_Engine_Emission_and_Fuel_Economy_with_Multi-Objective_Genetic_Algorithm_and_Phenomenological_Model (accessed on 15 October 2019).
- Atashkari, K.; Nariman-Zadeh, N.; Gölcü, M.; Khalkhali, A.; Jamali, A. Modelling and multi-objective optimization of a variable valve-timing spark-ignition engine using polynomial neural networks and evolutionary algorithms. Energy Convers. Manag. 2007, 48, 1029–1041. [Google Scholar] [CrossRef]
- Wei, L.; Yuying, Y. Multi-objective optimization of sheet metal forming process using Pareto-based genetic algorithm. J. Mater. Process. Technol. 2008, 208, 499–506. [Google Scholar] [CrossRef]
- Deb, M.; Banerjee, R.; Majumder, A.; Sastry, G. Multi objective optimization of performance parameters of a single cylinder diesel engine with hydrogen as a dual fuel using pareto-based genetic algorithm. Int. J. Hydroen Energy 2014, 39, 8063–8077. [Google Scholar] [CrossRef]
- Maiboom, A.; Tauzia, X.; Shah, S.R.; Hétet, J.F. Experimental Study of an LP EGR System on an Automotive Diesel Engine, compared to HP EGR with respect to PM and NOx Emissions and Specific Fuel Consumption. SAE Int. J. Engines 2009, 2, 597–610. [Google Scholar] [CrossRef]
- Appliance of High EGR Rates with a Short and Long Route EGR System on a Heavy Duty Diesel Engine. Available online: https://www.researchgate.net/publication/228487814_Appliance_of_High_EGR_Rates_With_a_Short_and_Long_Route_EGR_System_on_a_Heavy_Duty_Diesel_Engine (accessed on 15 October 2019).
- Development of a 2-Stage Supercharging System for a HSDI Diesel Engine. Available online: https://www.researchgate.net/publication/293816611_Development_of_a_2-Stage_Supercharging_System_for_a_HSDI_Diesel_Engine (accessed on 15 October 2019).
- Keidel, S.; Wetzel, P.; Biller, B.; Bevan, K.; Birckett, A. Diesel engine fuel economy improvement enabled by supercharging and downspeeding. SAE Int. J. Commer. Veh. 2012, 5, 483–493. [Google Scholar] [CrossRef]
- Newman, P.; Luard, N.; Jarvis, S.; Richardson, S.; Smith, T.; Jackson, R. Electrical supercharging for future diesel powertrain applications. In Proceedings of the 11th International Conference on Turbochargers and Turbocharging, London, UK, 13–14 May 2014; pp. 207–216. [Google Scholar]
- Effects of Dual Loop EGR on Performance and Emissions of a Diesel Engine. Available online: https://www.sae.org/publications/technical-papers/content/2015-01-0873/ (accessed on 15 October 2019).
- Benjey, R.P.; Biller, B.; Tsourapas, V. Cost effective hybrid boosting solution with application to light duty vocational vehicles. Int. J. Powertrains 2015, 4, 302–314. [Google Scholar] [CrossRef]
- Qi, X.; Yuan, Z.; Han, X. Diagnosis of misalignment faults by tacholess order tracking analysis and RBF networks. Neurocomputing 2015, 169, 439–448. [Google Scholar] [CrossRef]


| Type | Advantages | Shortcomings |
|---|---|---|
| HP-EGR |
|
|
| LP-EGR |
|
|
| Item | Specification |
|---|---|
| Engine type | In-line four cylinders |
| Displacement (cc) | 1396 |
| Bore (mm) | 75 |
| Stroke (mm) | 79 |
| Connecting rod (mm) | 140 |
| Compression ratio | 17:1 |
| Maximum power | 67 kW @4000 rpm |
| Maximum torque | 22.4 kgm @1500~2750 rpm |
| Injection type | Common rail direct injection |
| EGR system | High pressure EGR |
| Firing order | 1-3-4-2 |
| Case No. | 1 | 2 | 3 | 4 | 5 |
|---|---|---|---|---|---|
| Engine speed (rpm) | 1500 | 1750 | 1750 | 2000 | 2250 |
| BMEP (bar) | 4 | 6 | 8 | 10 | 12 |
| Boost pressure (bar) | 1.09 | 1.22 | 1.37 | 1.67 | 1.93 |
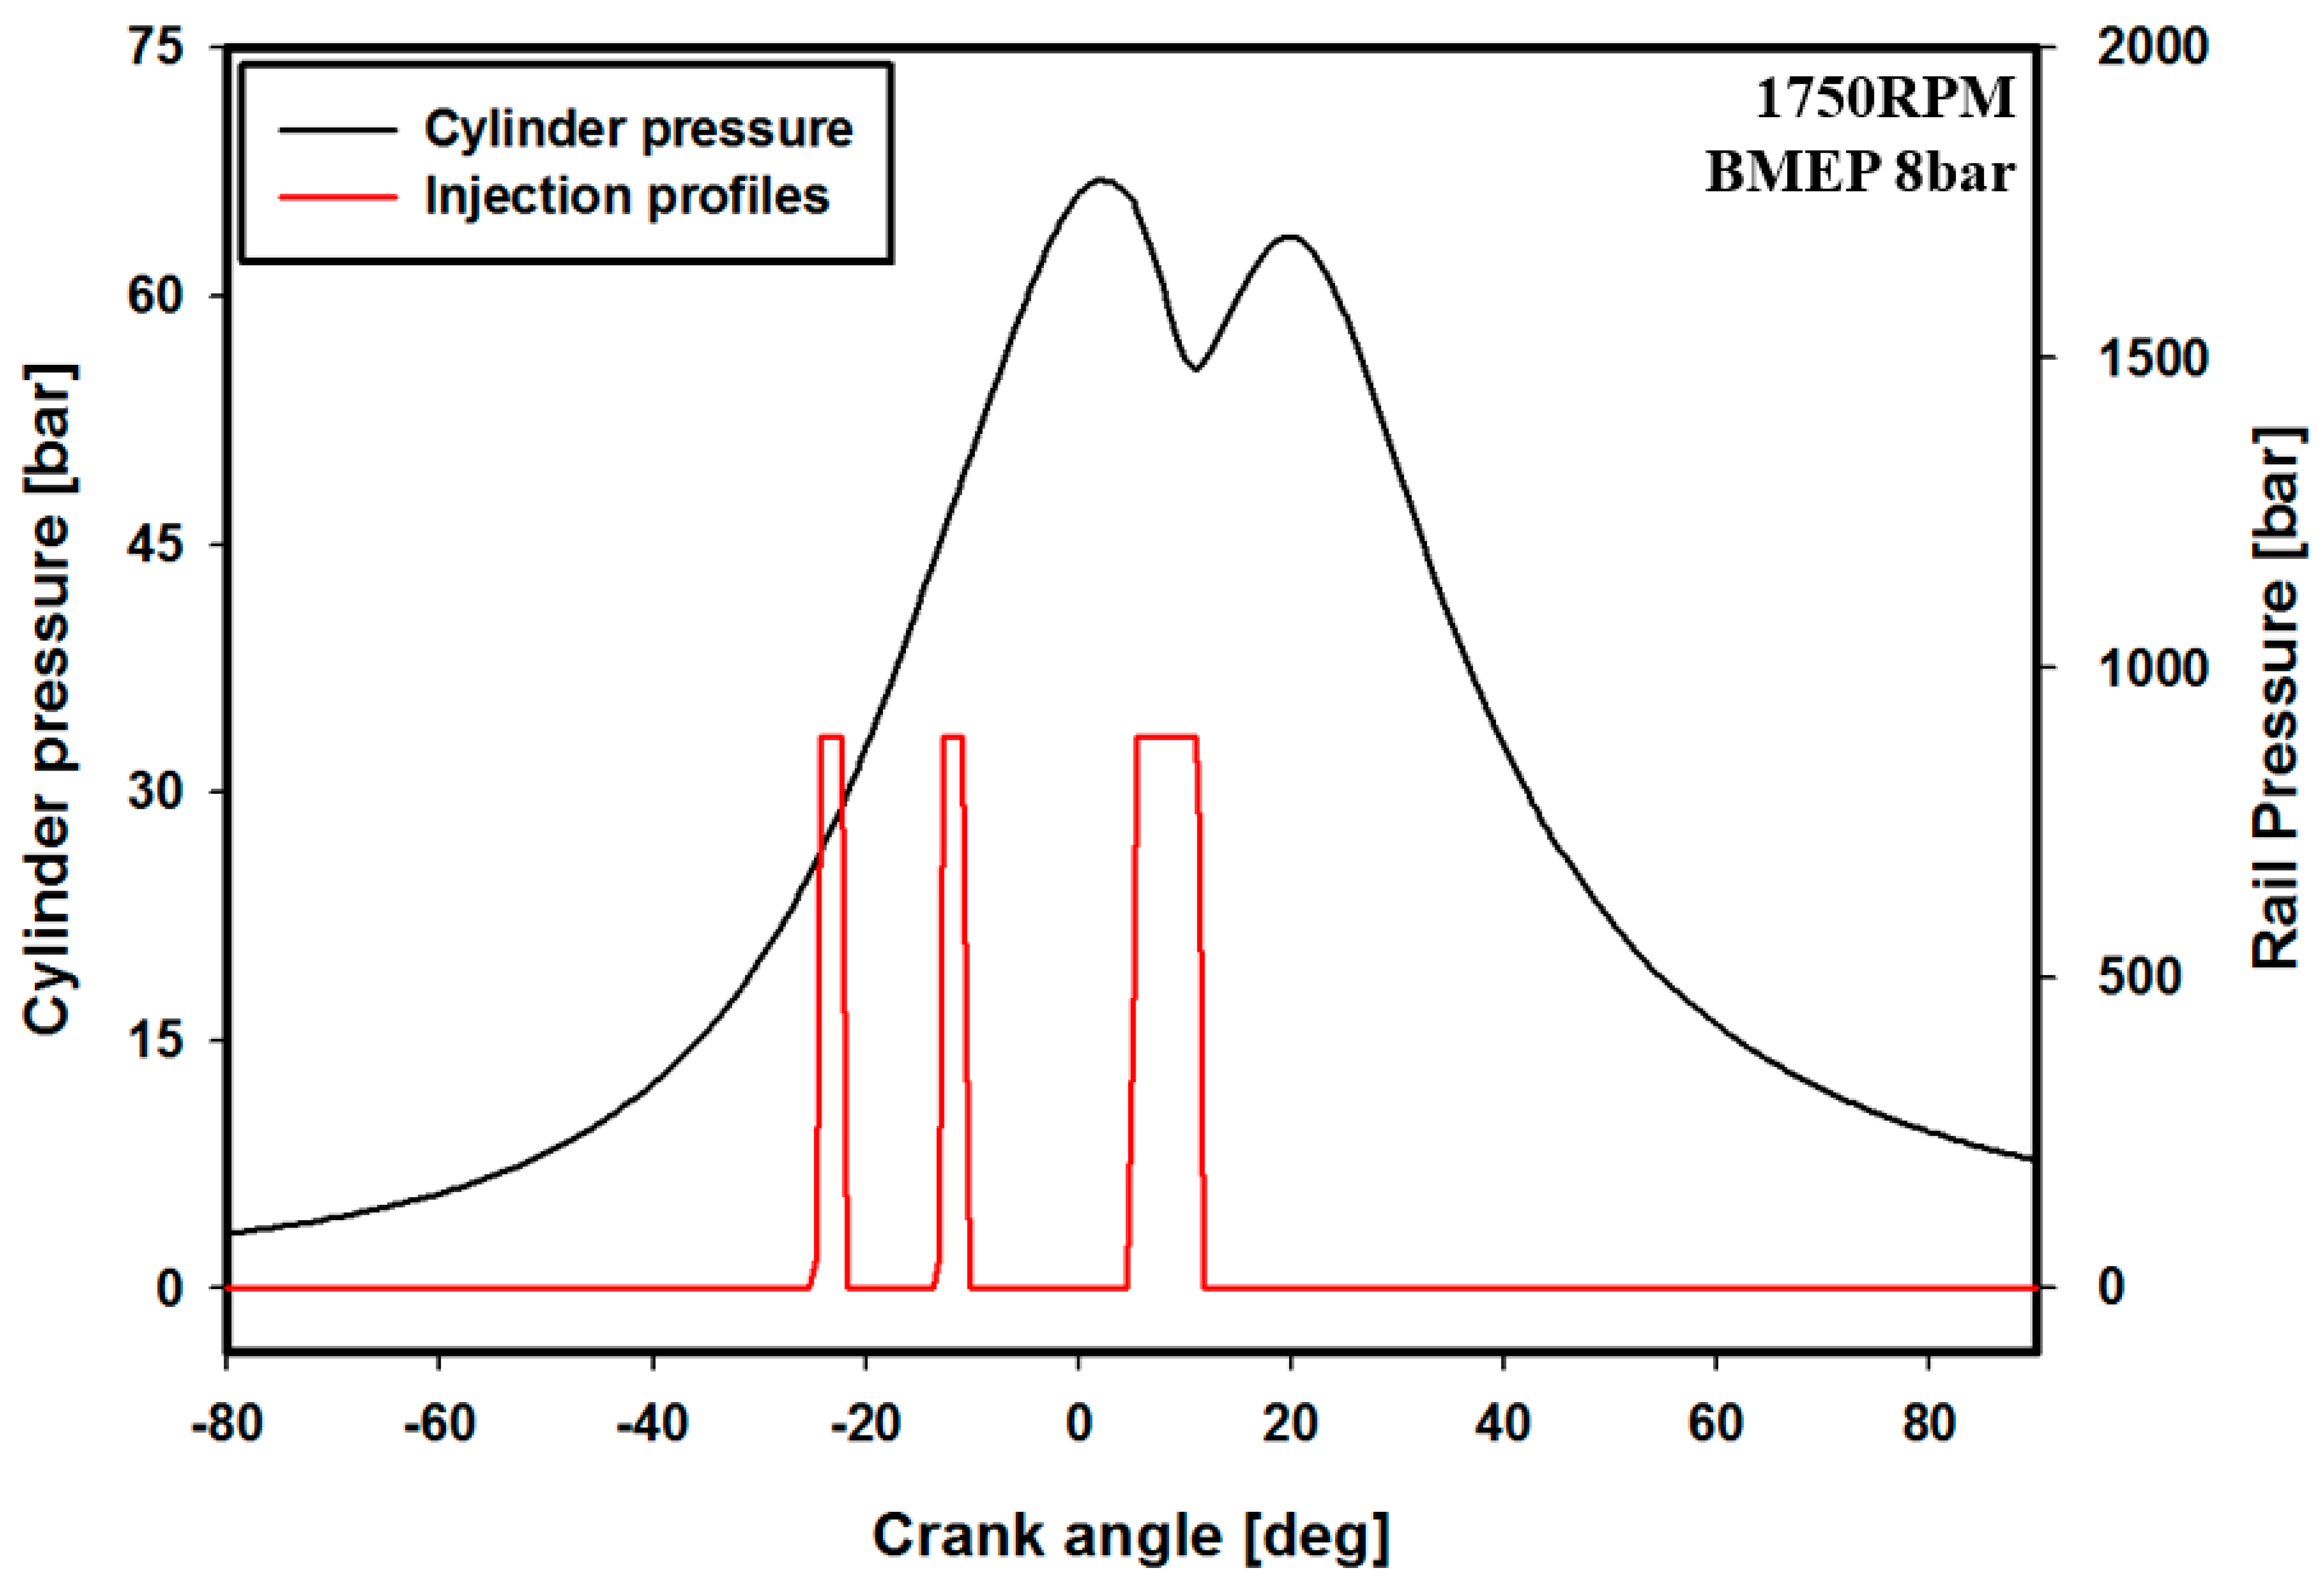
| Rail pressure (bar) | 538 | 795 | 889 | 1084 | 1243 |
| Injected mass (mg/stroke) | 9.43 | 13.93 | 17.89 | 21.97 | 25.59 |
| Pilot1 injection timing (CA BTDC) | 23.28 | 25.9 | 25.34 | 25.08 | 27.28 |
| Pilot2 injection timing (CA BTDC) | 12.41 | 13.9 | 13.4 | 15.22 | 16.27 |
| Main injection timing (CA BTDC) | −5.66 | −5.4 | −5.07 | −4.6 | −3.89 |
| EGR rate (%) | 31.4 | 26.4 | 17.4 | 16.3 | 6.1 |
| Case No. | 1 | 2 | 3 | 4 | 5 |
|---|---|---|---|---|---|
| Engine speed (rpm) | 1500 | 1750 | 1750 | 2000 | 2250 |
| BMEP (bar) | 4 | 6 | 8 | 10 | 12 |
| LP-fraction (4, 5cases) | 0–0.75 | 0–1 | 0–1 | 0–1 | 0–1 |
| eS rpm | 40,000–90,000 | 40,000–90,000 | 40,000–120,000 | 40,000–120,000 | 40,000–160,000 |
| eS power (kW) | 0.1–1.5 | 0.1–1.5 | 0.1–1.5 | 0.1–1.5 | 0.1–1.5 |
| Number of sampling points | 400 points for each case | ||||
| Case No. | Base EGR (%) | Heavy EGR (%) |
|---|---|---|
| 1 | 31.4 | 37 |
| 2 | 26.4 | 35 |
| 3 | 17.4 | 22 |
| 4 | 16.3 | 18 |
| 5 | 6.1 | 15 |
© 2019 by the authors. Licensee MDPI, Basel, Switzerland. This article is an open access article distributed under the terms and conditions of the Creative Commons Attribution (CC BY) license (http://creativecommons.org/licenses/by/4.0/).
Share and Cite
Yoo, H.; Park, B.Y.; Cho, H.; Park, J. Performance Optimization of a Diesel Engine with a Two-Stage Turbocharging System and Dual-Loop EGR Using Multi-Objective Pareto Optimization Based on Diesel Cycle Simulation. Energies 2019, 12, 4223. https://doi.org/10.3390/en12224223
Yoo H, Park BY, Cho H, Park J. Performance Optimization of a Diesel Engine with a Two-Stage Turbocharging System and Dual-Loop EGR Using Multi-Objective Pareto Optimization Based on Diesel Cycle Simulation. Energies. 2019; 12(22):4223. https://doi.org/10.3390/en12224223
Chicago/Turabian StyleYoo, Heecheong, Bum Youl Park, Honghyun Cho, and Jungsoo Park. 2019. "Performance Optimization of a Diesel Engine with a Two-Stage Turbocharging System and Dual-Loop EGR Using Multi-Objective Pareto Optimization Based on Diesel Cycle Simulation" Energies 12, no. 22: 4223. https://doi.org/10.3390/en12224223
APA StyleYoo, H., Park, B. Y., Cho, H., & Park, J. (2019). Performance Optimization of a Diesel Engine with a Two-Stage Turbocharging System and Dual-Loop EGR Using Multi-Objective Pareto Optimization Based on Diesel Cycle Simulation. Energies, 12(22), 4223. https://doi.org/10.3390/en12224223