1. Introduction
As regulations for passenger cars are being strengthened nowadays, conventional passenger cars with gasoline and diesel engines should be improved to provide better fuel efficiency and reduced emissions. Diesel engines have the advantage of better fuel efficiency to meet such CO
2 emission regulations; however, given their compression ignition (CI) combustion characteristics, emissions of dangerous materials, such as nitrogen oxide (NO
x) and particulate matter (PM), are inevitable. Thus, regulations for passenger cars are being strengthened to meet ‘worldwide harmonized light-duty vehicles test procedures’ (WLTP) or ‘real driving emission cycle’ (RDE), which can describe real driving conditions during the test mode [
1].
However, as these regulations are becoming increasingly harsh, further advanced technologies, such as heavy exhaust gas recirculation (EGR), dual-loop EGR, and two-stage turbocharging with an electric supercharger (eS), need to be investigated to satisfy them. One issue here is that as boost pressure increases, fuel efficiency improves, but increased emissions are also inevitible [
1].
To reduce the major emissions of CI engines, such as NOx and PM, many after-treatment systems have been applied to passenger car diesel engines. Such after-treatment systems are expensive, so reducing emissions by other mechanisms, such as with low-temperature combustion (LTC), should be investigated. A well-controlled LTC engine can improve fuel efficiency and reduce NOx and PM emissions without an after-treatment system.
Commensurate with the increased need for LTC, the importance of EGR is emerging. Heavy EGR should be applied to reduce the combustion temperature. However, as the EGR induction rate increases, several problems, such as EGR induction and boost pressure shortages—due to reduced mass flow rate to the turbocharger—have emerged [
2,
3,
4,
5,
6,
7,
8,
9]. To address these problems, dual-loop EGR systems and two-stage turbochargers need to be investigated.
Conventional EGR systems use only high-pressure EGR (HP-EGR) or low-pressure EGR (LP-EGR) systems.
Table 1 shows the advantages and shortcomings of each system. HP-EGR responds rapidly to lower speed or low loads, but EGR induction is limited when the turbine inlet pressure is sufficiently higher than the intake manifold pressure. When these two systems are applied together to an engine EGR system, it is called a dual-loop EGR system. Dual-loop EGR systems have the advantage of being able to optimize the EGR rate under many driving conditons [
10,
11,
12]. Experimental studies with dual-loop EGR systems were reported by Cho et al. [
13]. They studied a high-efficiency clean-combustion (HECC) engine and compared the performance of HP and LP dual-loop EGR systems under five operating conditions. Adachi et al. [
6] and Kobayashi et al. [
7] investigated the combination of both high boost pressure from a turbocharger and a high rate of EGR with respect to reducing the brake-specific NO
x (BSNO
x) and PM. Park et al. [
14] studied the effects of an EGR split index (ESI) of a dual-loop EGR system numerically. Using an LP-rich dual-loop EGR, a high EGR rate could be applied for low, medium, and high speeds, increasing the applicable load ranges versus the base conditions.
A conventional turbocharger system with a single-stage turbocharger is a widely used method for improving fuel efficiency. However, it is hard to avoid turbo lag, due to turbine inertia, and to improve the boost pressure in the case of heavy EGR operation, due to the decrease in the turbine inlet flow rate. To overcome these weaknesses, a two-stage turbocharger system with eS should be investigated. By applying eS, it is easy to improve transient responses and to improve boost pressure under heavy EGR conditions.
Mattarelli [
15] investigated various two-stage turbocharging systems and compared them in terms of the steady state at the New European Driving Cycle (NEDC) test reference operation points. Tang et al. [
16,
17] investigated the effects of various turbocharging approaches on gasoline engine transient conditions. They found that applying an electric turbo charging system improved transient responses and fuel efficiency. Salehi et al. [
18] investigated the effects of high and low pressure eSs on a heavy duty diesel engine, for both steady state and transient operations, and found that LP eS was more efficient with respect to transient responses, although the high engine speed response was improved with an HP eS.
The aim of this paper was to optimize the thermal performance and emissions of diesel engine considering dual-loop EGR and eletric supercharger under steady-state rpm-load conditions, representing the frequently selected operating conditions from the WLTP for the test of real engines. To achieve the research goal, multi objective Pareto optimization was applied based on thermodynamic cycle simulation results, including the detailed multi-zone combustion model for a compression ignition direct injection (CIDI) engine, the heat transfer model for each component, such as EGR and EGR cooler, and the thermal performance of the electric supercharger. Starting from the validation of the base engine model, which describes engine operation based on the OEM(Original Equipment Manufacturer)’s test results for WLTP, performance, in terms of fuel efficiency and emission characteristics, was investigated through brake-specific fuel consumption (BSFC) and BSNOx under various WLTP reference load conditions. Heavy EGR was applied to reduce NOx emissions. To improve fuel efficiency and NOx emissions simultaneously, both the dual-loop EGR system and eS effects on the engine were investigated with a design of experiment (DoE) and multi-objective Pareto optimization method. The main goal of this study was to lower BSNOx and BSFC, via a trade-off curve by means of LTC (Low Temperture Combustion), and to suggest design parameters for various engine operating conditons using a multi-objective Pareto optimization method.
2. Methodology
A one-dimensional (1D) engine cycle simulation tool, called GT-Power (Gamma Technologies) [
19], was used to investigate engine performance outcomes numerically, in terms of the BSFC, BSNO
x, brake mean effective pressure (BMEP), and air fuel (A/F) ratio. The base engine model was validated by comparison with expermental data. The base passenger car diesel engine specifications are shown in
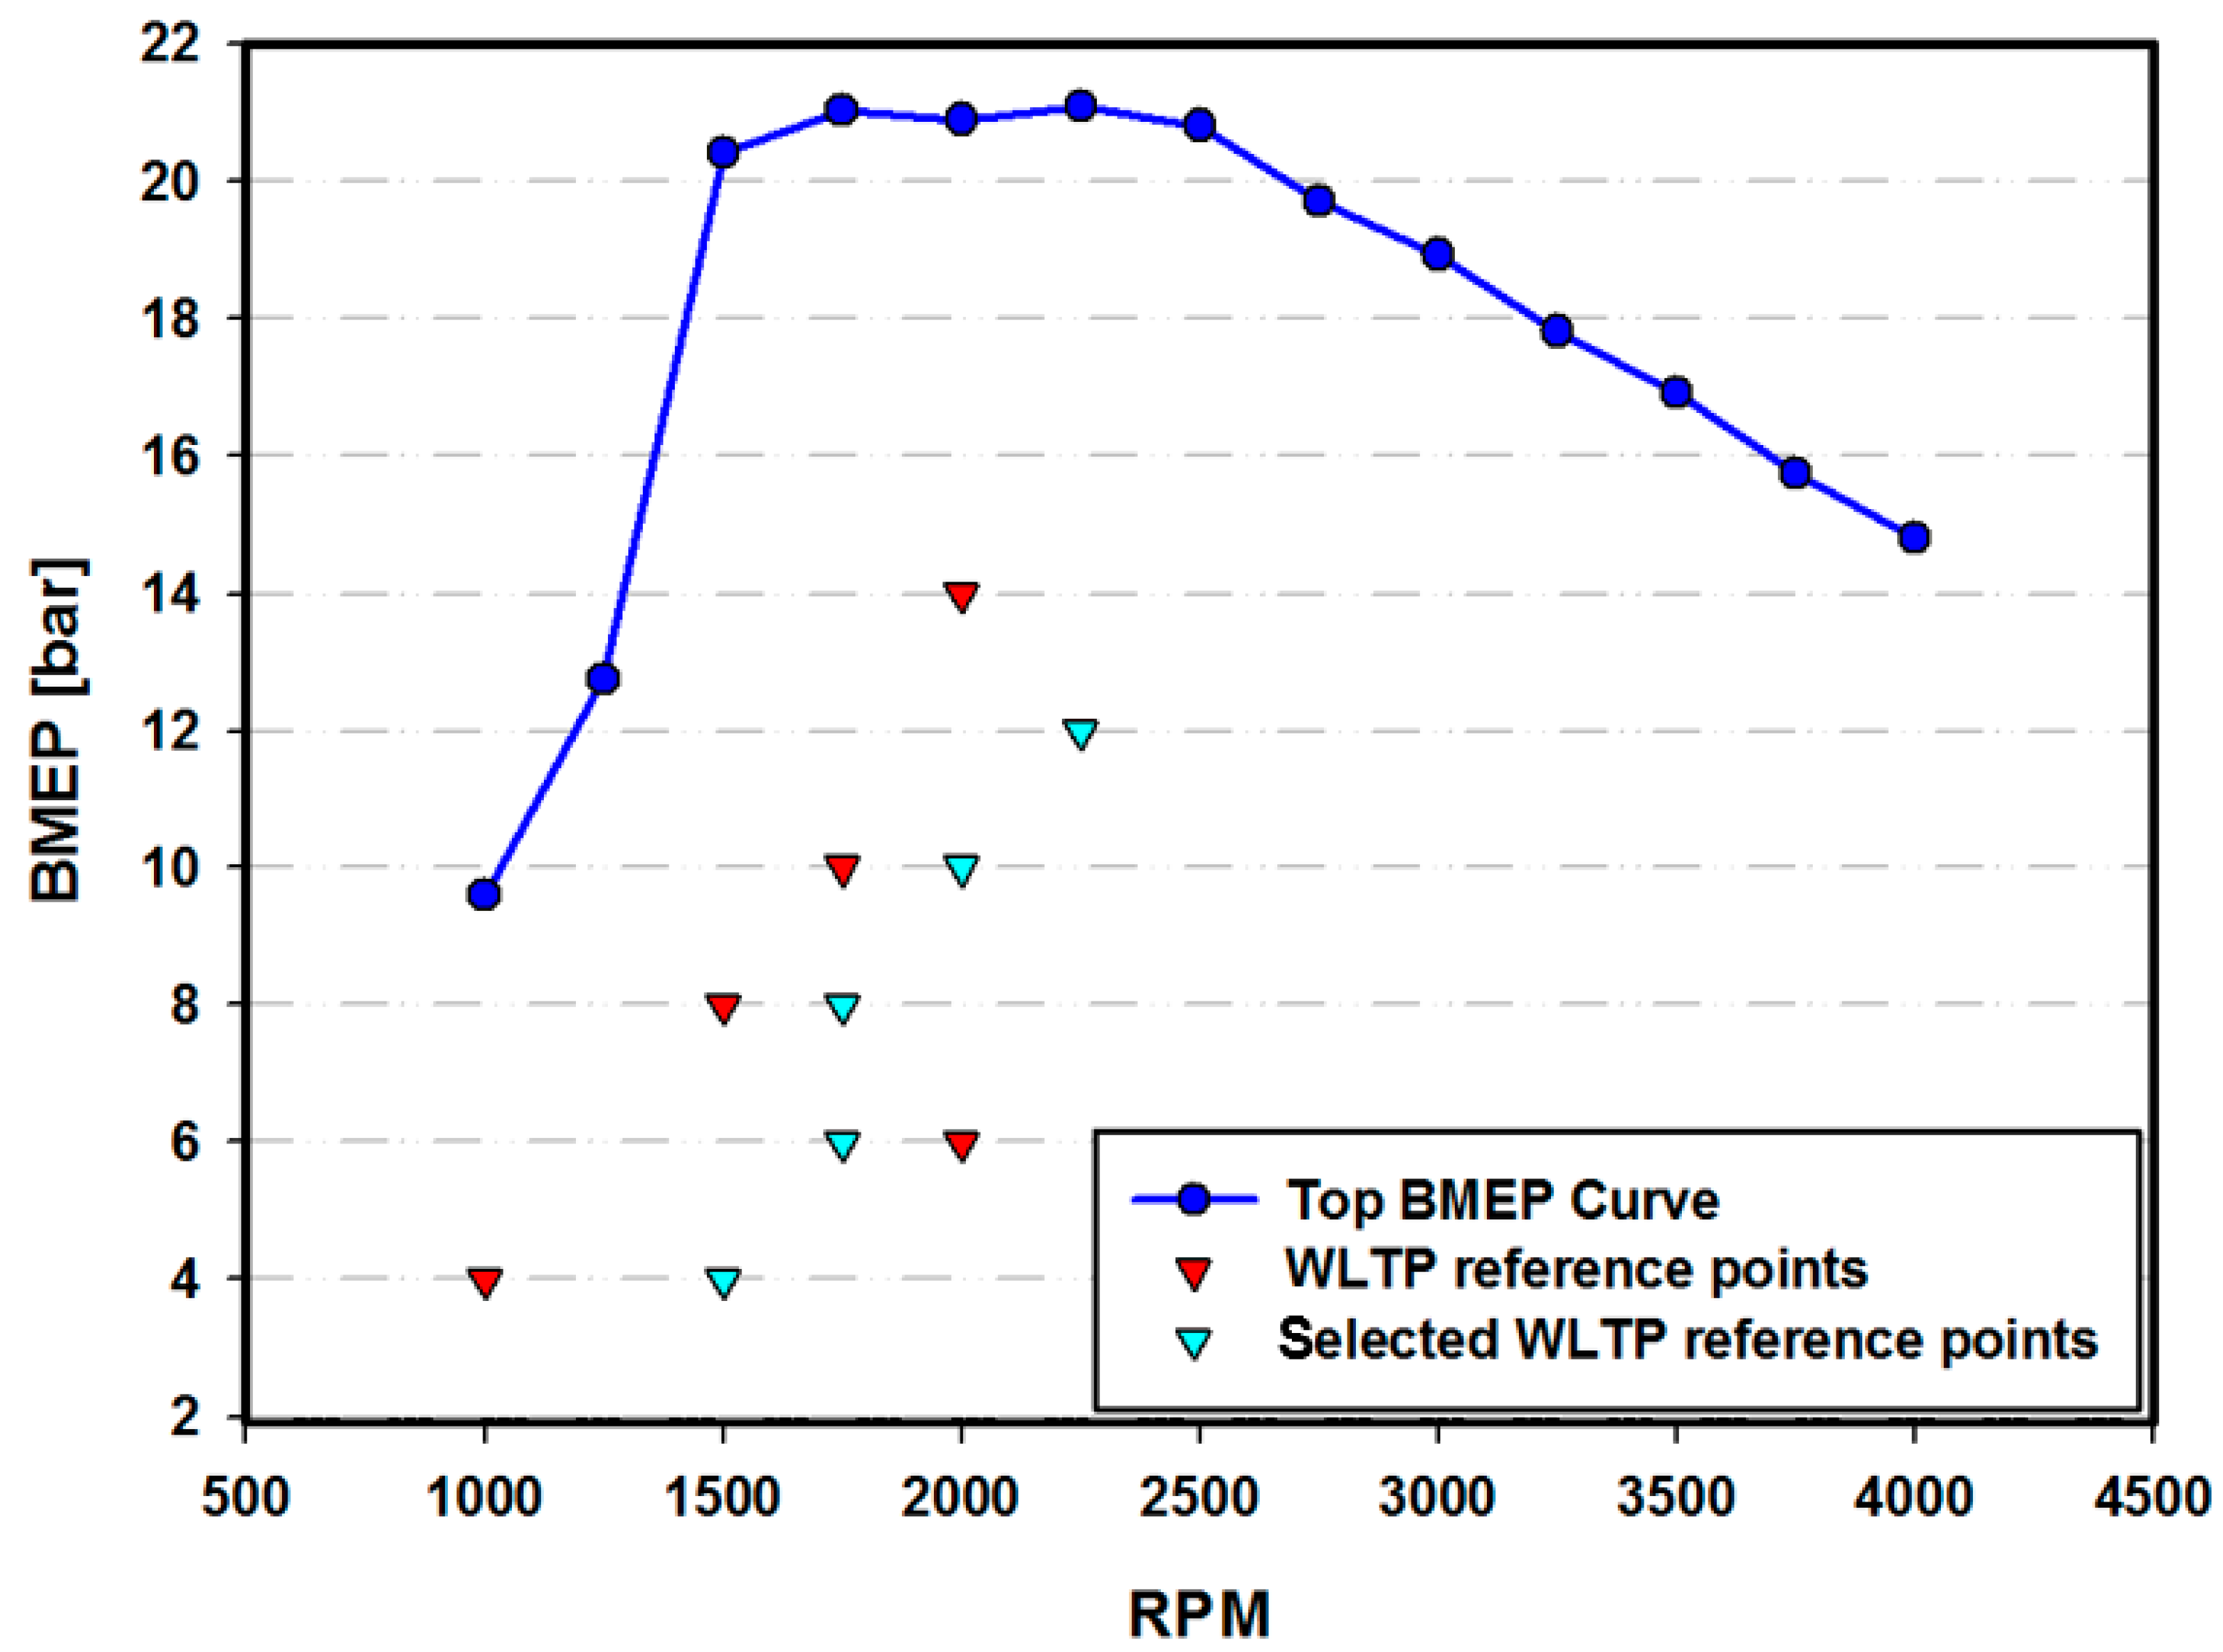
Table 2. The reference operating and selected WLTP points are shown in
Figure 1. The operating conditions of the base engine were 4 bar of BMEP at 1500 rpm, 6 and 8 bar of BMEP at 1750 rpm, 10 bar of BMEP at 2000 rpm, and 12 bar of BMEP at 2250 rpm. To achieve more validated points (marked with green triangles in
Figure 1), additional rpm-load conditions were peaked to predict and to optimize the target engine. As a result, there were five validation points (red triangles in
Figure 1) to get modeling accuracy and five prediction points (green triangles in
Figure 1) that were not covered by the real engine test. Detailed operating conditions are shown in
Table 3. The overall research plan is shown in
Figure 2.
2.1. 1D Engine Modeling and System Modifications
First, an engine model was prepared based on hardware specifications (bore, stroke, connecting-rod length, top dead center (TDC) clearance height, and compression ratio), intake/exhaust valve profiles, a performance map-based waste gate-type single-stage turbocharger system and intercooler, diesel fuel injection profiles, and EGR systems with an EGR valve and EGR cooler. To meet the required properties, proportional integral derivative (PID) controllers for the EGR fraction and target boost pressure controllers were attached to the engine.
A NO
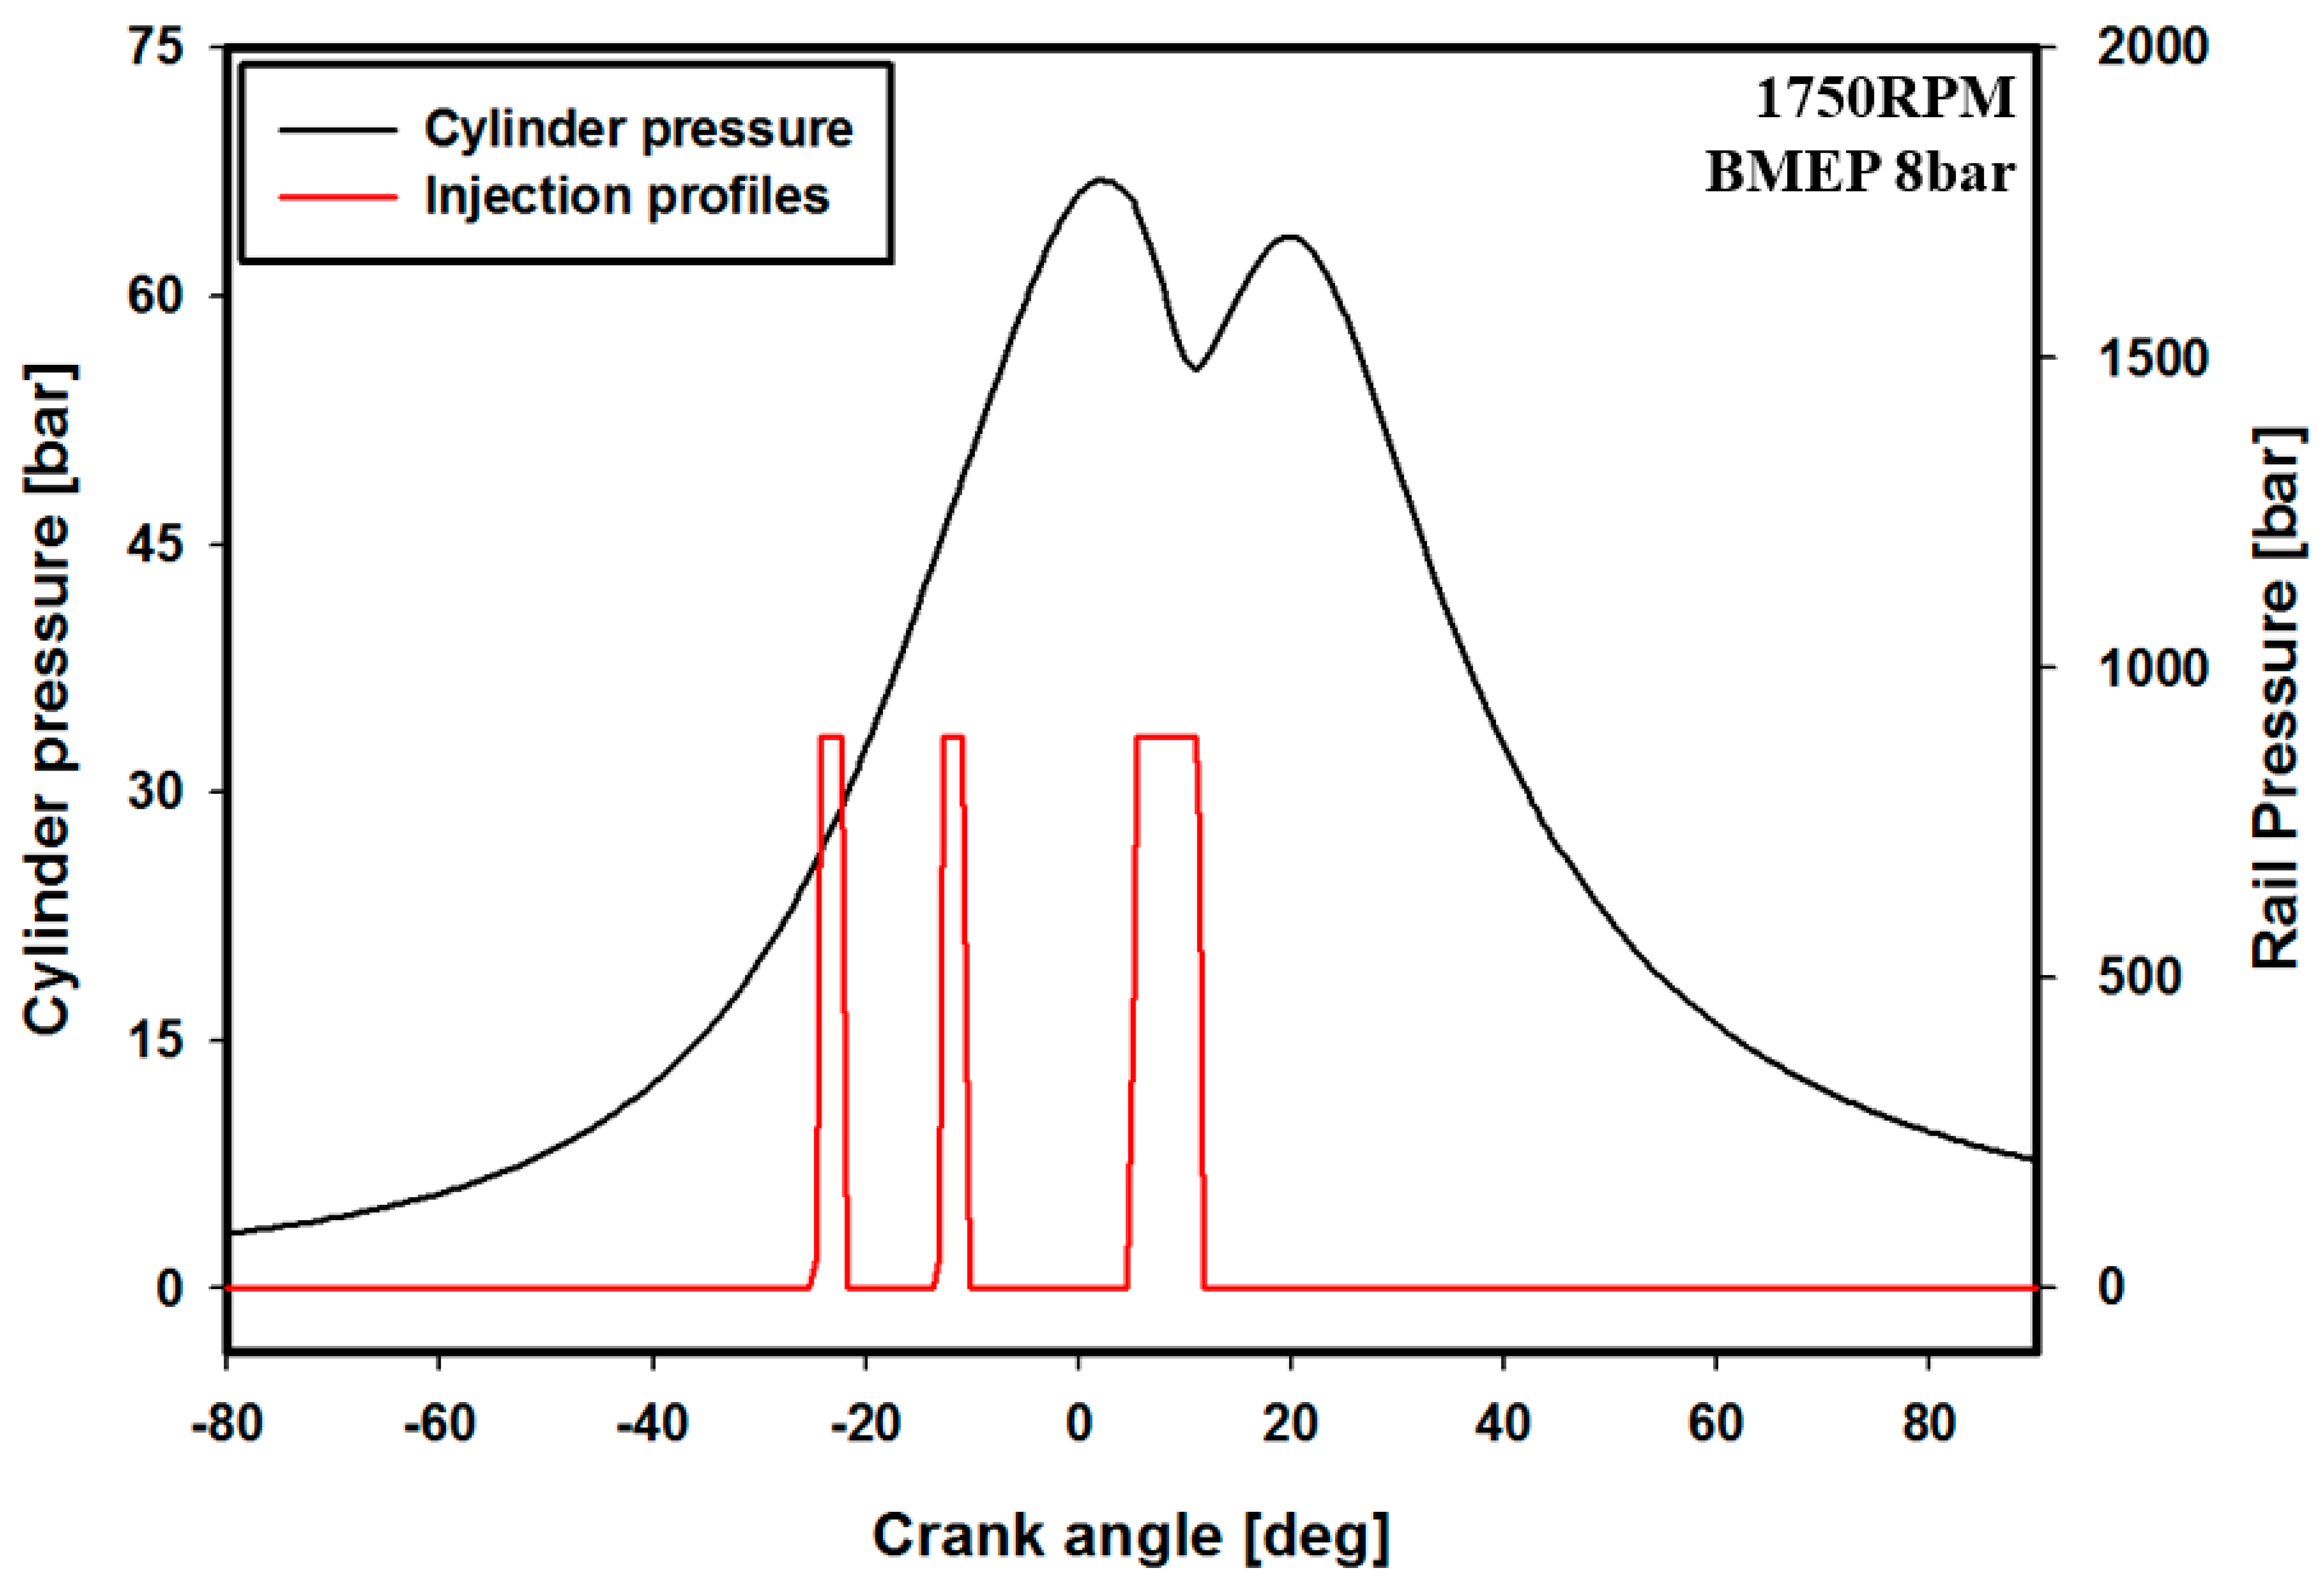
x predictive combustion model, the direct-injection diesel multi-pulse (DI-pulse), was used to calibrate the diesel combustion. In the DI-pulse model, injected fuel is tracked during its injection, evaporation, mixing with surrounding gases, and burning through three thermodynamic zones, which have their own temperatures and compositions. The three zones consist of the main unburned zone, the spray unburned zone, and the spray burned zone. The main unburned zone contains all of the cylinder substances at the intake valve closing (IVC). The spray unburned zone contains injected fuel and entrained gases. The spray burned zone contains the combustion products. In the DI-pulse model, fuel is injected in pulses, which are tracked separately. Injected fuel is added to the spray unburned zone and, immediately, the injected fuel penetrates and slows down, mixing with the surrounding unburned and burned gases. The mixing process occurs through entrainment and the mixed gas is referred to as the entrained gas. The entrainment rate is determined by applying the conservation of momentum to an empirical spray penetration law. The fuel is heated by the surrounding gases, causing evaporation, and the entrained gas is mixed in a turbulence-driven process. The mixture for each pulse ignites with its own ignition delay, modeled by the Arrhenius expression. When pulse ignition starts, a premixed combustion occurs first, but this is assumed to be limited kinetically. After ignition, the remaining unmixed fuel and entrained gas in each pulse start mixing and burning in a diffusion-limited phase. Through this combustion process, NO
x formation is calculated using the extended Zeldovich mechanism [
19]. A diagram of the calibrated in-cylinder pressure with fuel injection using the DI-pulse model is shown in
Figure 3.
After the validation against experimental data, several systems were made and attached to the base engine model. The LP-EGR PID controller was attached to the model and made into a dual-loop EGR control system. The main control factor, i.e., the LP-fraction, was calculated with Equation (1):
Then, the turbocharger compressor and an eS control system were attached, controlled by power and rpm. The system control scheme is shown in
Figure 4. To maintain constant BMEP under each condition (which differ in EGR rate, LP-fraction, and eS characteristics), a constant BMEP PID controller was attached. After sensing the average BMEP of the engine, to keep the BMEP constant, more fuel was injected into the cylinder to increase the BMEP, or the fuel flow rate was lowered to decrease it. The overall control scheme of the constant BMEP controller is shown in
Figure 5.
2.2. DoE with Latin Hypercube Sampling (LHS) and Multi-Objective Pareto Optimization
There are several engine design parameters that are related to each other. To overcome the cost and hardware difficulties associated with experimental testing, DoE and numerical analyses should be sufficiently powerful to model optimal engine operation conditions despite the use of multiple, complex parameters. Usually, a sampling method is used, such as a full-factorial approach or LHS. After the sampling operation, response surface plots are created using various fitting methods, such as the radial basis function network (RBFN), a least-squares method (LSM), or an artificial neural network (ANN). In this investigation, 400 random cases were made using LHS and, after the simulation, RBFN was used to generate the response surface plot, which is a feed-forward neural network consisting of artificial neurons and a dynamically varying structure, to achieve precise predictions [
20,
21]. In
Table 4, several of the sampling ranges used for the DoE are shown.
In this investigation, for eS, as the power and rpm increased, the fuel efficiency of the engine was improved, but increasing NOx emissions were inevitable due to increased thermal efficiency. To minimize NOx emissions and fuel consumption simultaneously, a multi-objective Pareto optimization method was used. By applying the optimization, both BSFC and BSNOx will be improved, by optimizing multiple input parameters that improve or worsen engine fuel efficiency and emission characteristics simultaneously.
Multi-objective Pareto optimization is a method to determine Pareto-optimal points from a set of possible solutions satisfying multiple evalutation criteria (i.e., multiple objective functions) that conflict with each other. The optimization process with
n variables and
m objectives can be defined as in Equation (2) [
14,
20,
22,
23,
24,
25,
26]. Detailed explations of RBFN, LHS, and Pareto optimization methods can be found in Park etl al.’s previous paper [
20]
with three vectors, defined as
of an
n-dimentional decision variable vector,
of an
m-dimensional objective funtion vector, and
of a 1D constraint condition vector. When there are no solutions satisfying
:
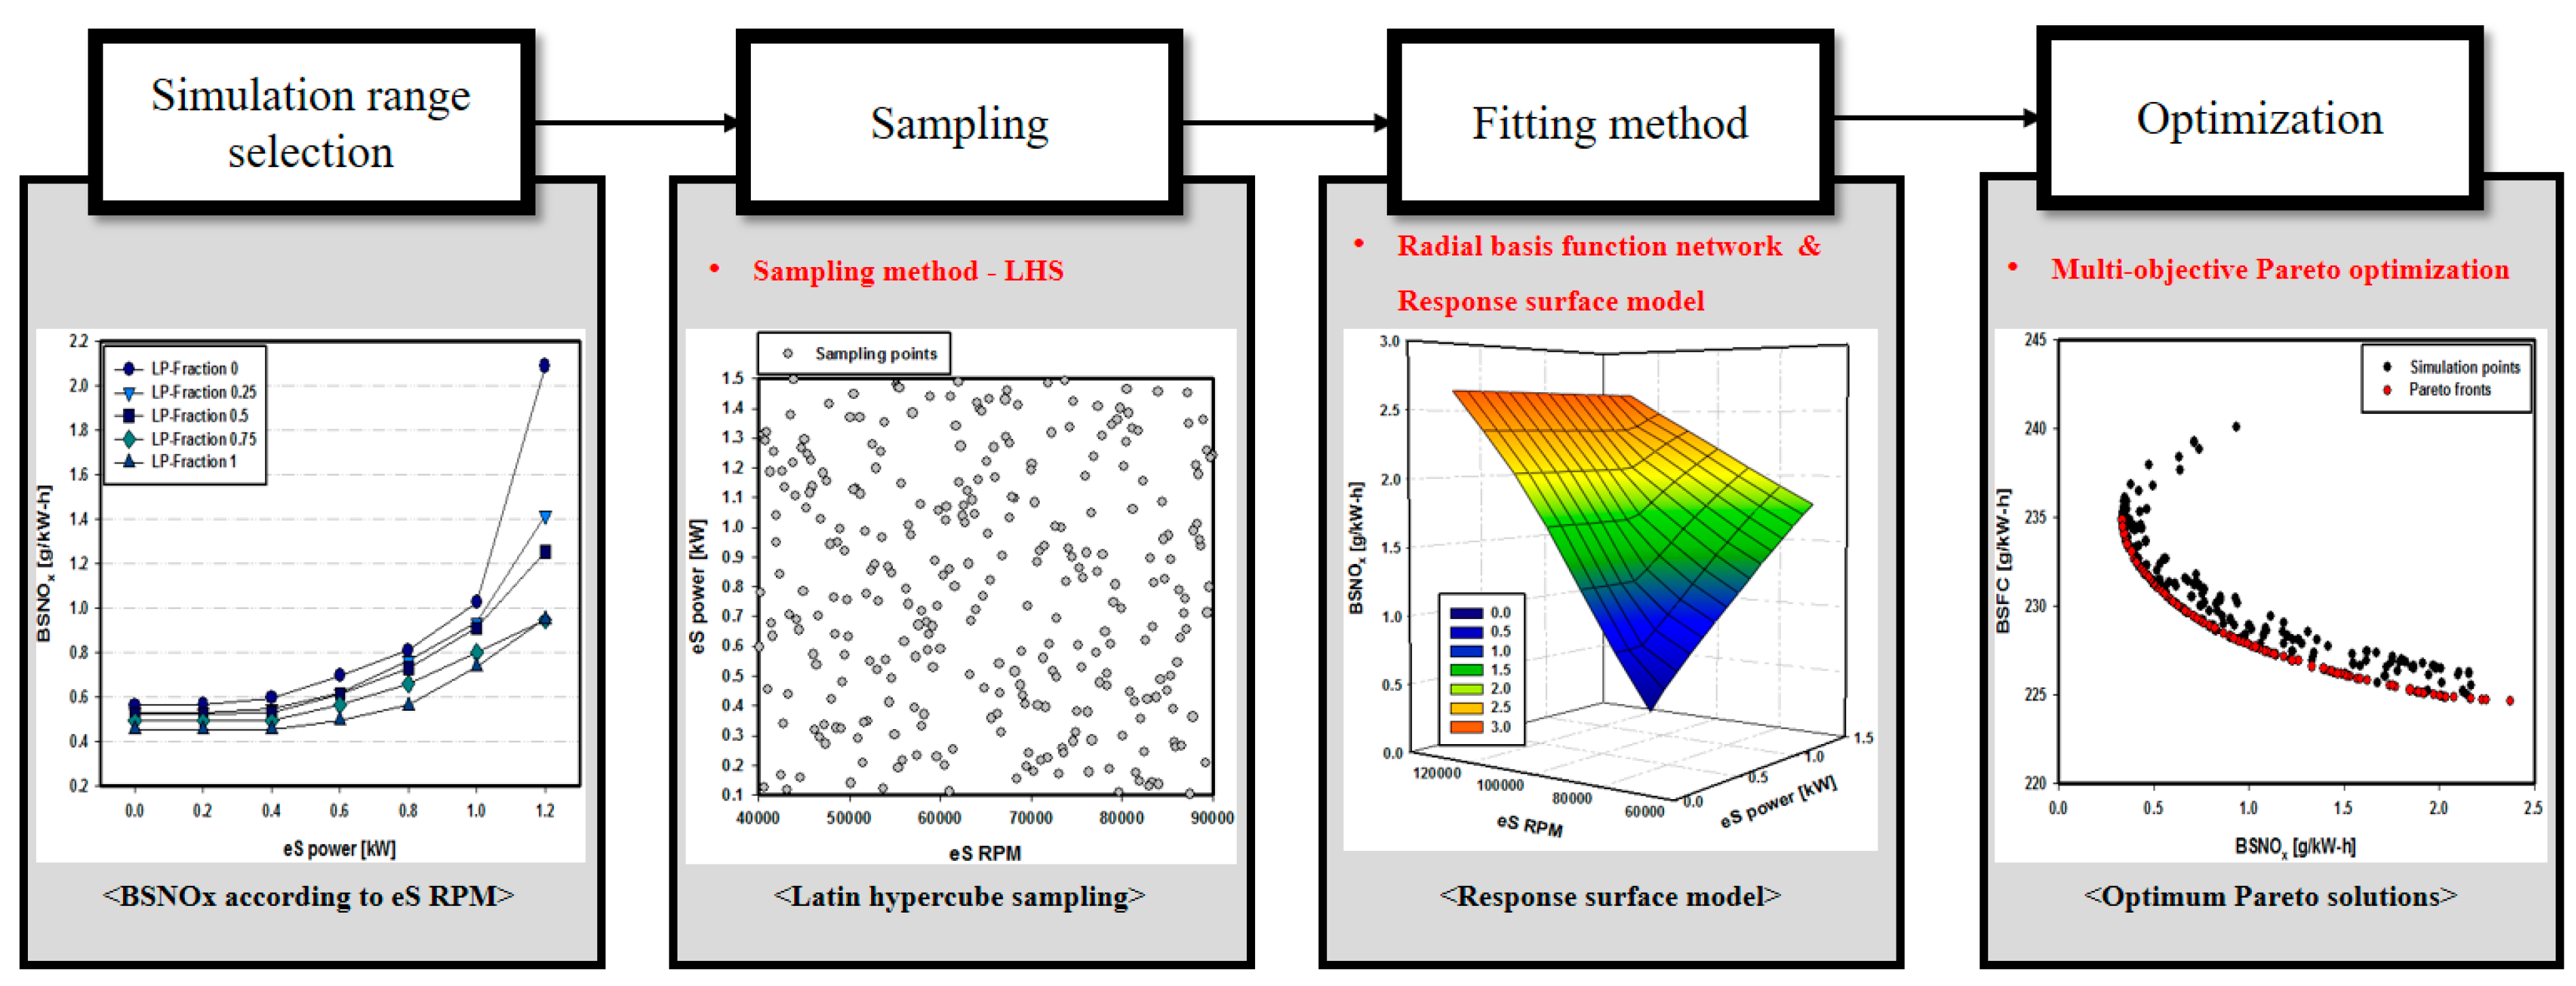
is referred to as a Pareto-optimal solution. The overall process flow of the multi-objective Pareto optimization is shown in
Figure 6. In this investigation, a simulation range selection was made first; LHS was performed for each case, the RBFN fitting method was applied, and finally the multi-objective Pareto optimization was performed and Pareto fronts were obtained through the objective function spaces of
and
, for BSNO
x and BSFC, respectively.
3. Results and Discussion
3.1. Validation and Heavy EGR Application
Before applying the control systems (eS, dual-loop EGR, and constant BMEP controller), in each case several numerical results were validated against experimental data using the operational characteristics listed in
Table 3. Through this validation, we confirmed that the engine model was accurate for investigations. In
Figure 7, comparisons between experimental and numerical results are illustrated in terms of base engine results and major control factors. Boost pressure, EGR rate, maximum in-cylinder pressure (Pmax), BSFC, BMEP, and BSNO
x were compared against experimental results. The maximum error was <3%, confirming that the results were reliable.
Before applying eS and the dual-loop EGR system, a constant BEMP controller was attached to the engine model and heavy EGR was applied (
Figure 8). Heavy EGR was applied to induce as much EGR as the engine could take. The heavy EGR rates that were applied and the base EGR rates are shown in
Table 5. As shown in
Figure 8, when the EGR fraction increased compared with the base engine operating conditions in
Table 3, due to a dilution effect, Pmax and maximum temperature were reduced, causing NO
x emissions to also be reduced. As the EGR rate was increased—but with total boost pressure and rpm conditions being constrained—the total air flow rate decreased, resulting in a decreasing A/F ratio. As a result, the BSFC results deteriorated, by a maximum of 4%, but NO
x emissions were reduced by a maximum of 84%. These results represent the basic effects of LTC on a diesel engine and are similar to those obtained in previous investigations [
6,
7,
8,
15,
27]. However, for a passenger car diesel engine, fuel efficiency is as important as emissions for operations and sales. Thus, there is a need to apply and optimize eS and a dual-loop EGR system to reduce emissions and increase fuel efficiency.
3.2. Effects of the LP Fraction and eS rpm and Power on Fuel Efficiency
Before applying the dual-loop EGR and eS, the effects of LP-fraction, eS power, and rpm were investigated by a full-factorial DoE method. When investigating the effects of eS rpm, it was found to increase from 40,000 to 160,000, in 5000 intervals, with power held at 0.5 kW. When investigating the effects of eS power, it was found to increase from 0.1 to 1.5 kW, in 0.1 intervals, with rpm held at 70,000 rpm. In each case, the LP fraction was divided into five cases, ranging from 0 to 1 (0, 0.25, 0.5, 0.75, and 1.0). In case 1, with the LP fraction being equal to 1, the LP-EGR pressure was lower than that of the intake air and the EGR induction rate was not satisfied. Thus, comparison and optimization of an LP fraction of 1 in case 1 would be meaningless.
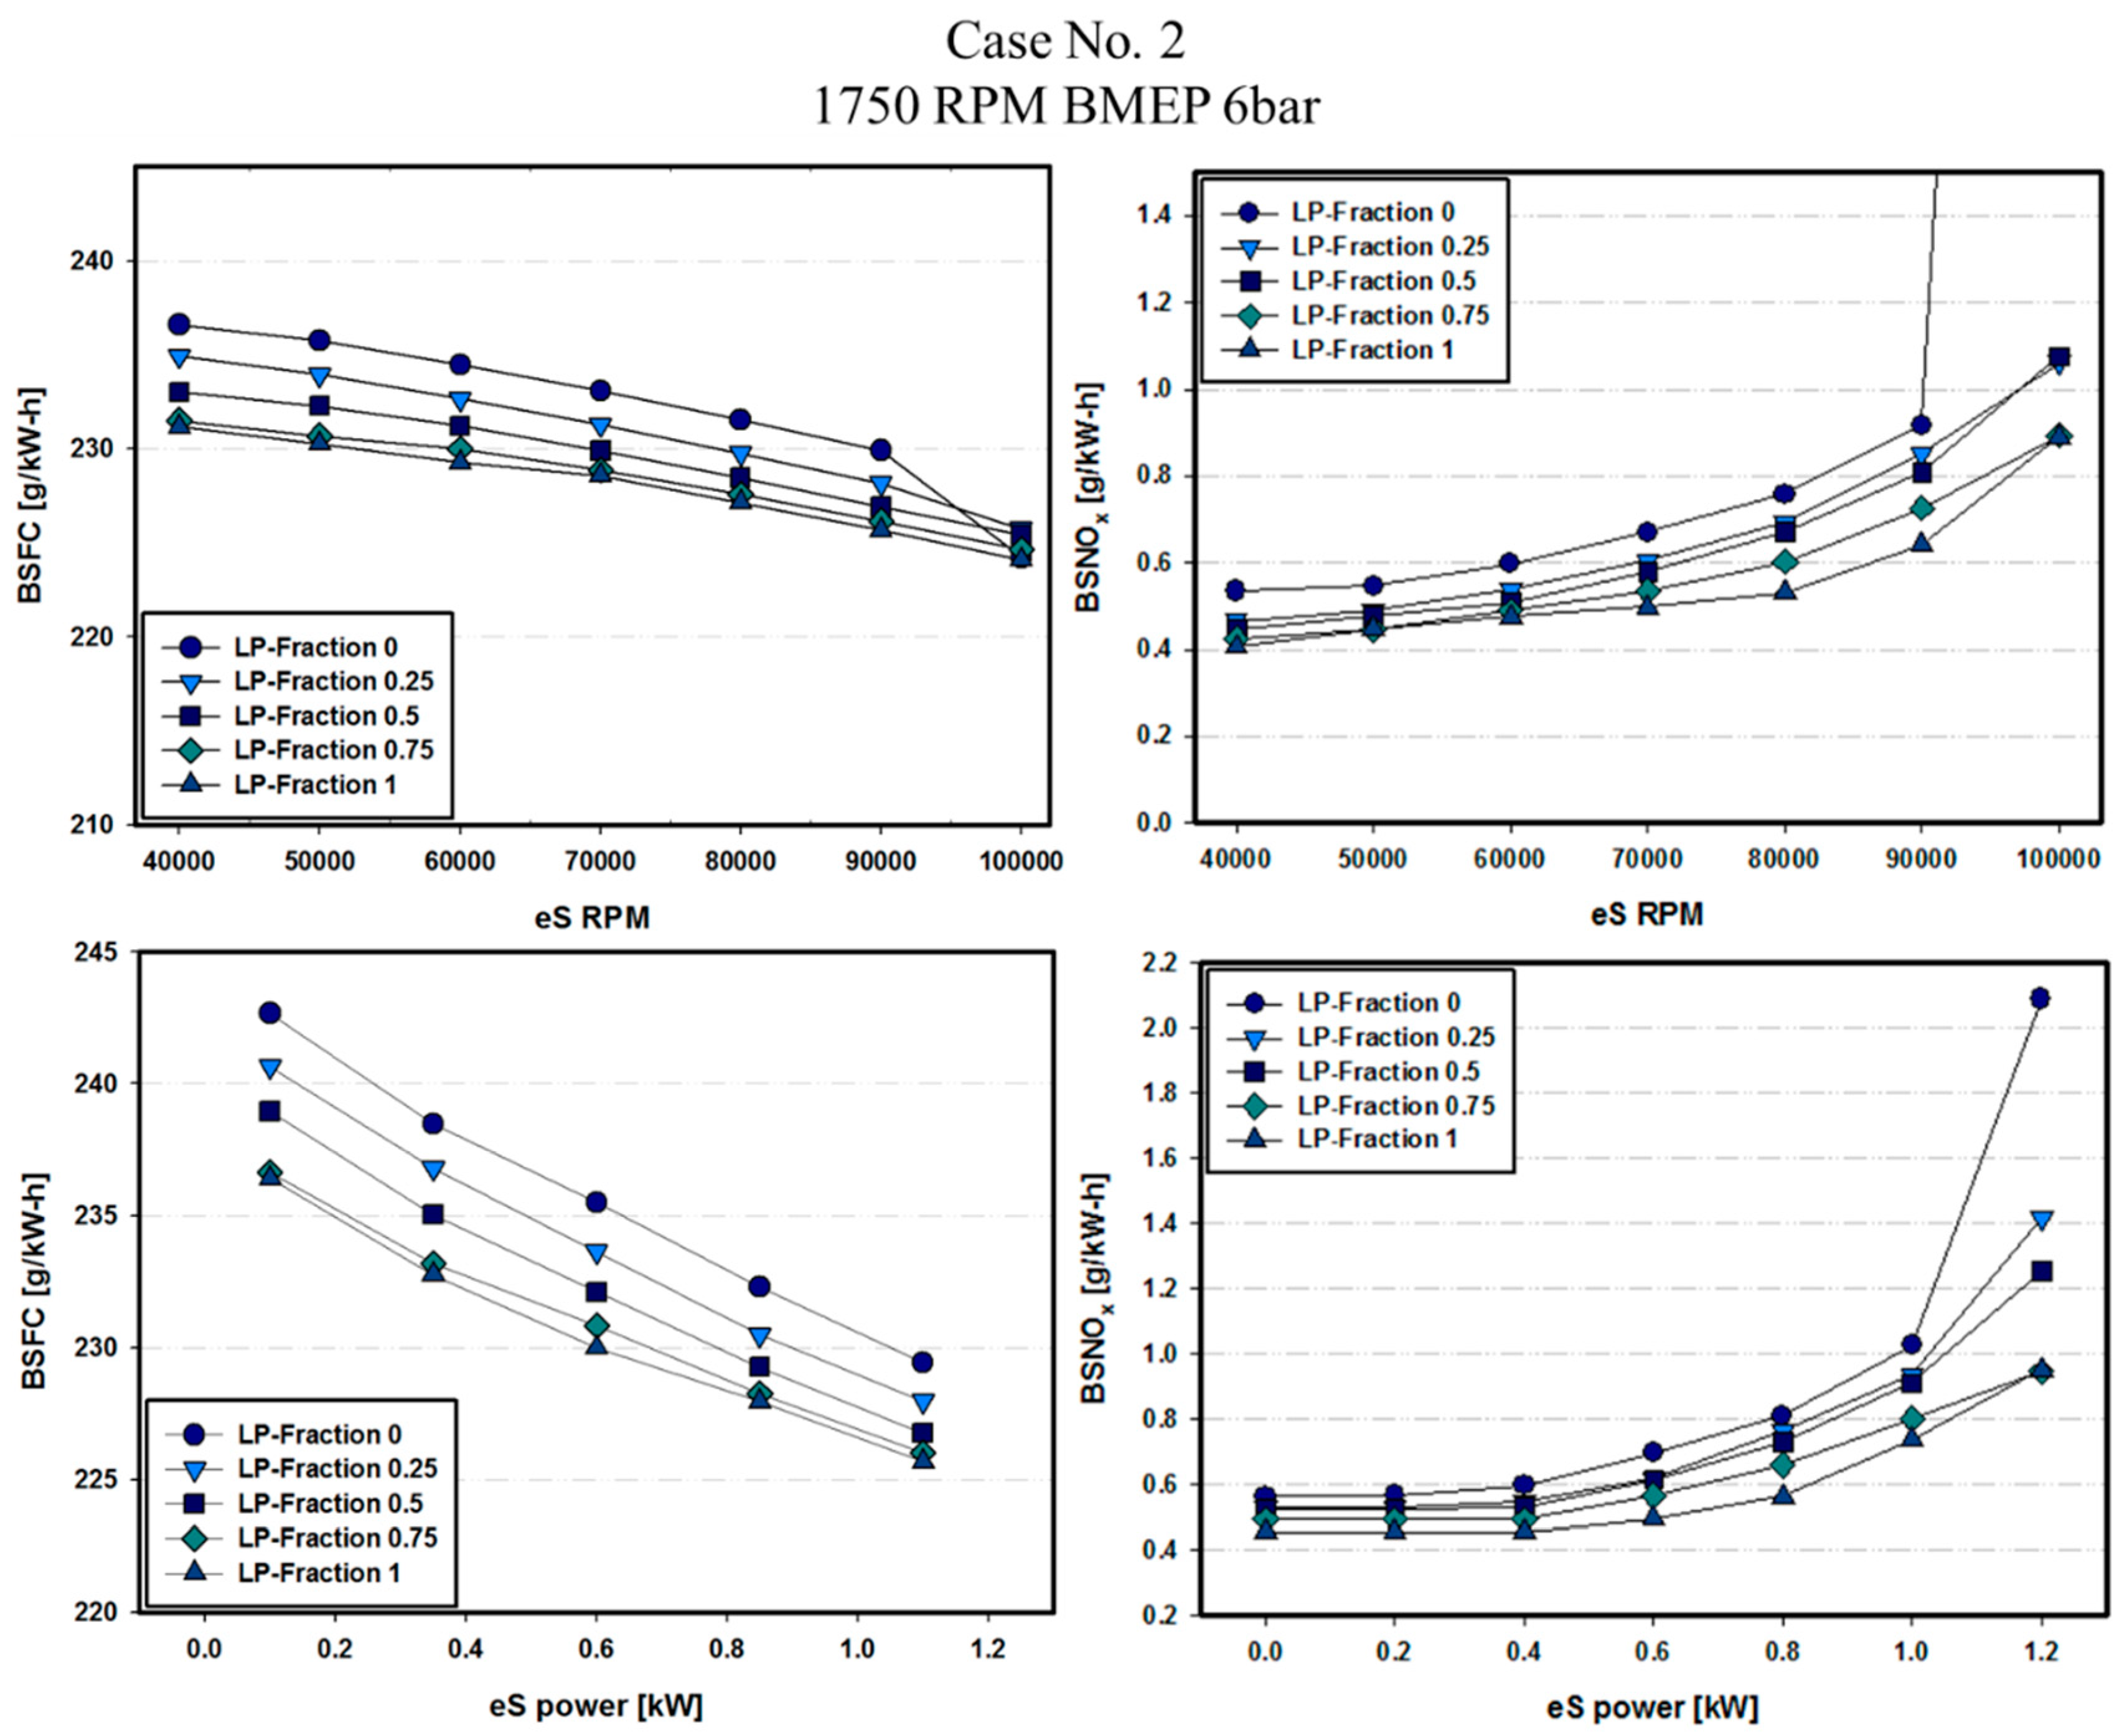
The effects of LP-fraction, eS rpm, and power on fuel efficiency in case 2 are shown on the left side of
Figure 9. In this study, fuel efficiency was determined by BSFC. With increasing eS, rpm, and eS power, the engine intake pressure was increased. Thus, the thermal efficiency of the engine was increased by the enhanced intake pressure. Moreover, as the LP fraction in each case increased, the fuel efficiency was enhanced. This was influenced by the compressor and eS efficiency increasing because the air flow rate was increased by the LP-EGR induction rate being increased in all cases. Results in other cases were similar to those of case 2.
In
Figure 9, the BSFC was decreased by 4.5%, at 10,000 versus at 9000 rpm. This was because the EGR induction rate was not fully satisfied due to the intake pressure increasing. This will be discussed in the next chapter. These results were similar to previous reports [
15,
27,
28,
29,
30,
31,
32,
33].
3.3. Effects of LP Fraction, eS rpm, and Power on NOx Emissions
In this study, the NO
x emission was determined by BSNO
x. The effects of LP fraction, eS rpm, and power on NO
x emissions are shown on the right side of
Figure 9. As the eS rpm and power increased, the fuel efficiency improved as a result of better thermal efficiency. However, as the thermal efficiency improved, the in-cylinder pressure and temperature increased. As a result, thermal NO
x increased due to the higher eS power and rpm. As the LP fraction in each case increased, the NO
x emission was reduced due to the cooled EGR (because the intake air increased). The cooled EGR has better dilution characteristics than the HP-EGR. In case 2 (
Figure 9) the BSNO
x increased rapidly when eS rpm was 10,000 rpm in LP fraction 0 cases, because as the eS power and rpm increased, the intake air pressure became higher than the EGR pressure of the HP-EGR, thereby decreasing the EGR induction rate. Thus, the NO
x emissions increased due to a lack of EGR. Results for the other cases were similar to those of case 2. Moreover, these results were similar to those of previous research [
15,
27,
28,
29,
30,
31,
32,
33].
From the previous chapter and this one, it can be seen that, as the eS rpm or power increased, the fuel efficiency improved, but NOx emissions also increased due to the higher in-cylinder pressure and temperature. Thus, to improve fuel efficiency and NOx emissions simultaneously under heavy EGR, dual-loop EGR, and eS conditions, a DoE and multi-objective Pareto optimization method should be applied.
3.4. DoE and Multi-Objective Pareto Optimization
The results showed that BSFC decreased as brake thermal efficiency increased. Moreover, as efficiency increased, NO
x emissions increased simultaneously. These characteristics were influenced by the heavy EGR, eS power, rpm, and LP fraction. Thus, to improve thermal efficiency and NO
x emissions simultaneously, the DoE and multi-objective Pareto optimization procedures were used because the trade-off between related parameters can be optimized (here, between BSFC and BSNO
x). The detailed DoE parameters and ranges in each case are shown in
Table 4. For each constant BMEP condition, the LP fraction ranged from 0–1, except for case 1. The eS rpm range was controlled according to the results given in
Section 3.2 and
Section 3.3. In total, 400 cases were investigated in all LP fractions. After the sampling, response surface plots were prepared using the sampling simulation data and the RBFN fitting method. The RBFN fitting method has several advantages and it is used widely in DoE methods [
34]. In
Figure 10, the response surface plots given by the RBFN are shown. In case 1, for each LP fraction, BSFC and BSNO
x are plotted as functions of the variables eS rpm and eS power. BSFC and BSNO
x functions were determined by these response surface plots in all cases and all LP fractions.
After RBFN fitting, multi-objective Pareto optimization was performed to minimize both BSFC and BSNO
x; the feasible points to minimize both results are optimal Pareto fronts. These optimal Pareto fronts and the base engine data are shown in
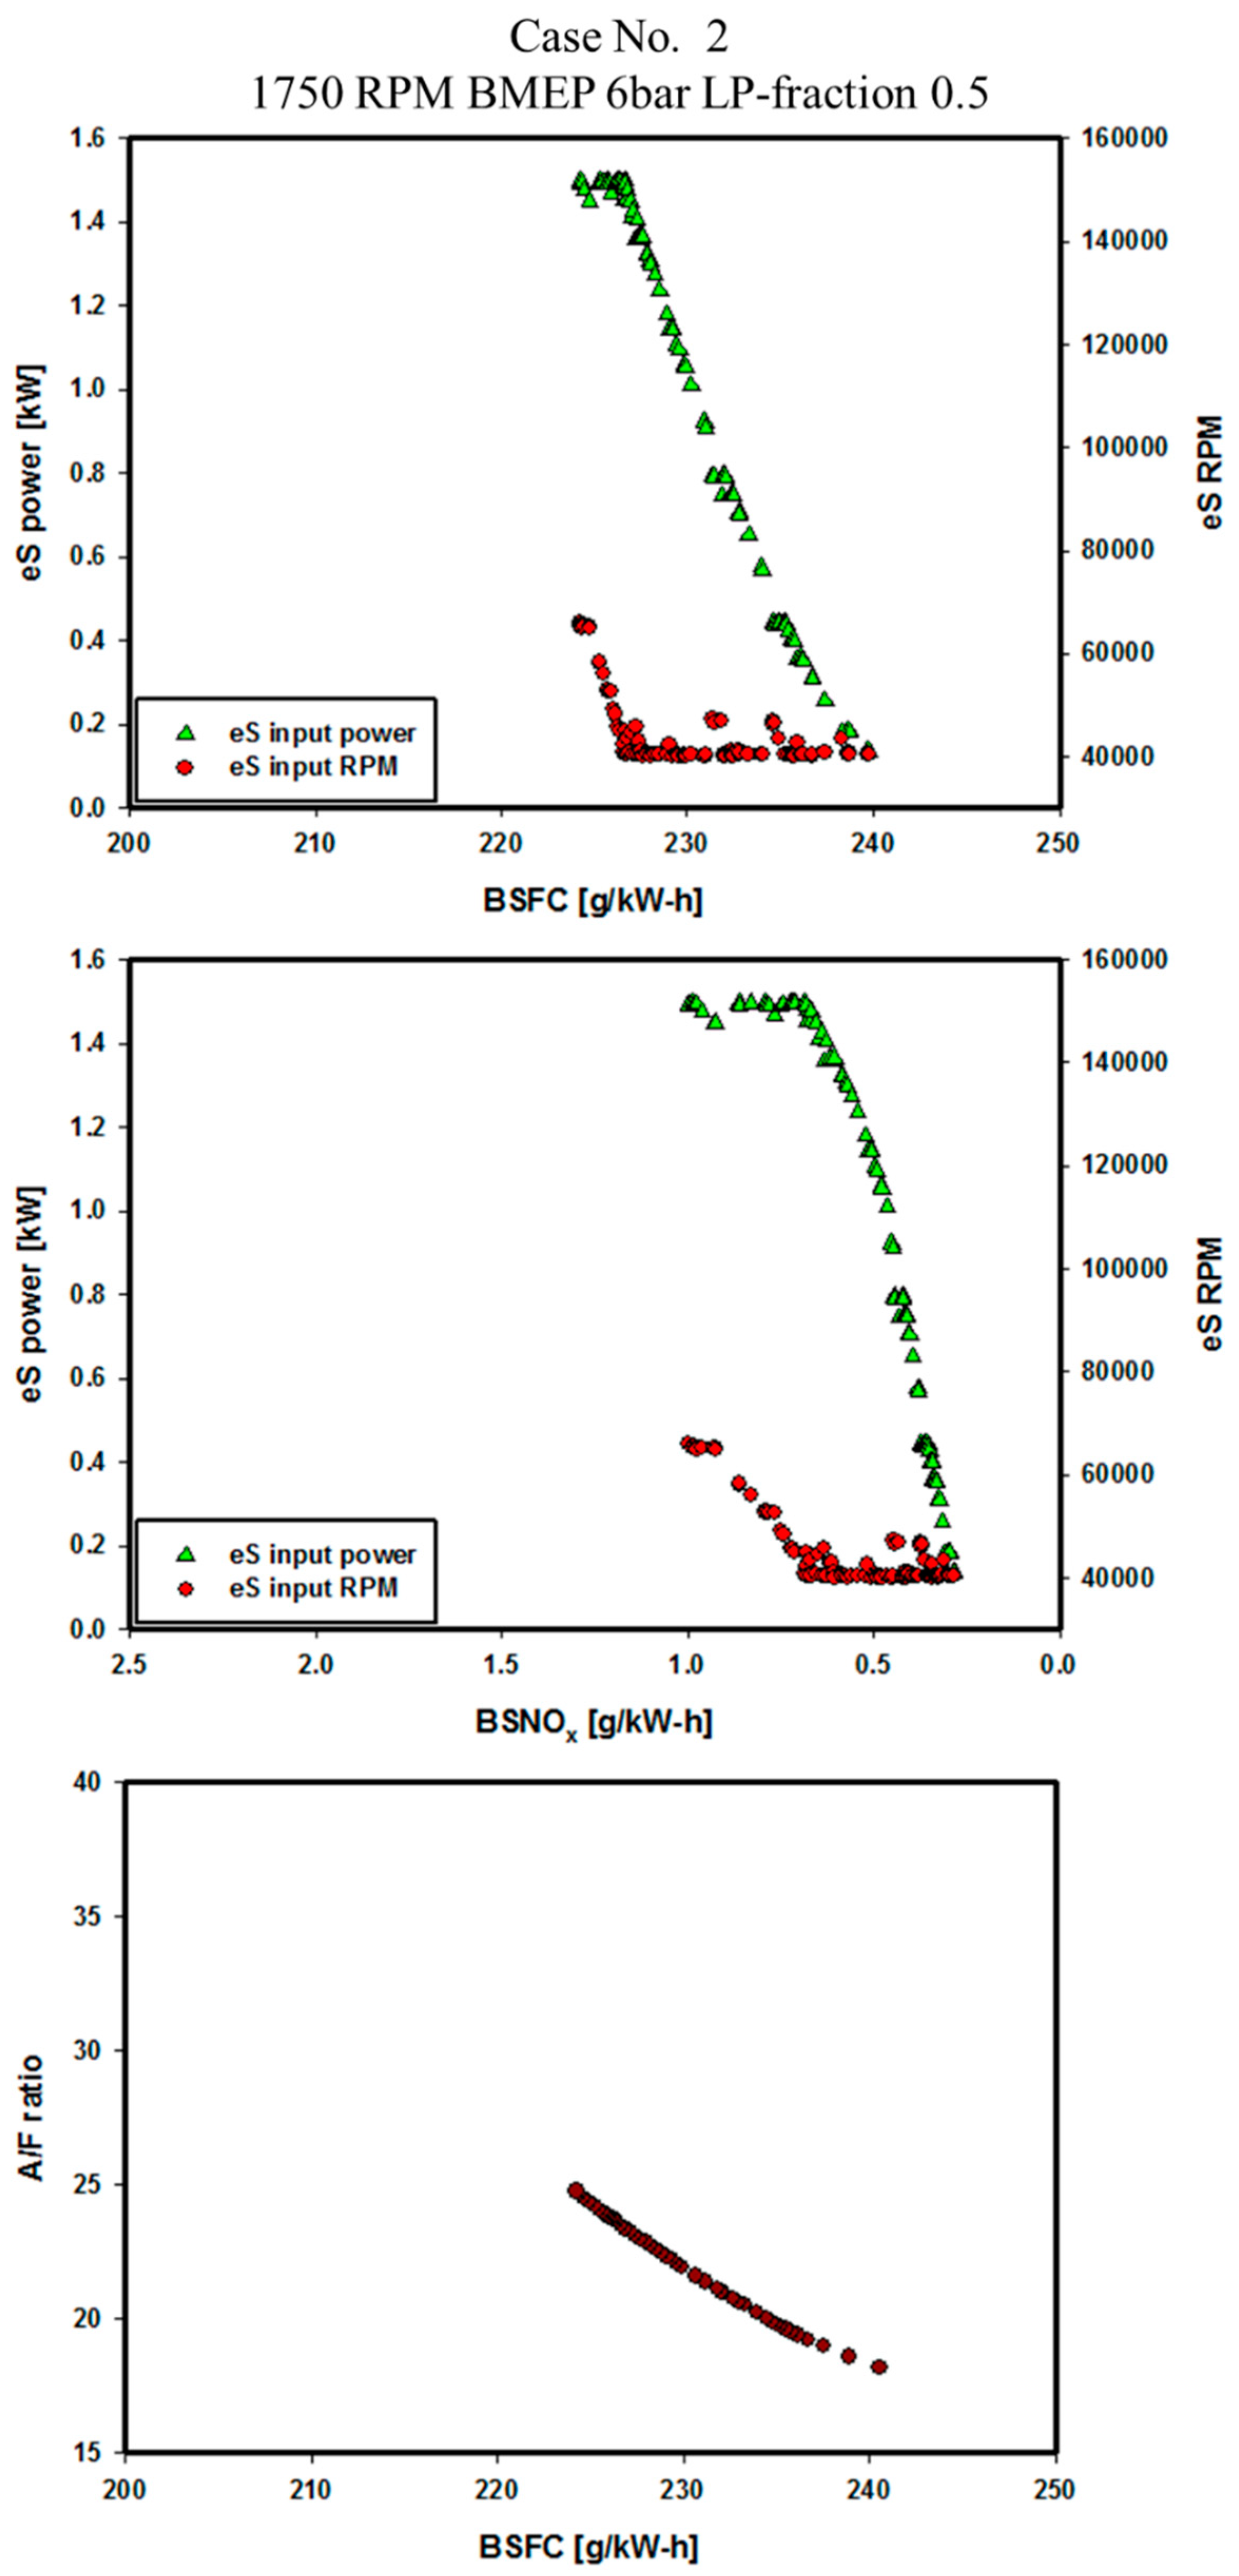
Figure 11. By applying and optimizing heavy EGR and eS with dual-loop EGR, engine efficiency and emission characteristics were improved simultaneously. In case 1 (
Figure 11), four LP fractions were investigated with a lack of EGR induction rate in LP fraction 1. In each feasible Pareto-optimal front, the conditions of eS power and rpm were fixed. Thus, by controlling eS power and rpm through these feasible fronts, the engine could be controlled to meet the target BSFC or BSNO
x, while minimizing the other trade-off results. In each case, BSFC and BSNO
x decreased with increasing LP fraction. Through the Pareto front lines, as the A/F ratio of the engine increased, the BSNO
x increased with decreased BSFC. In cases 1–4, eS power was dominant in controlling the A/F ratio, but in case 5, the A/F ratio was controlled predominantly by eS rpm.
Figure 12,
Figure 13,
Figure 14,
Figure 15 and
Figure 16 show the A/F variation through Pareto front lines and dominant A/F controlling factors: eS power versus rpm. The controlling parameters are discussed in detail in the next section.
3.5. Design Parameter Recommendations
In
Figure 12,
Figure 13,
Figure 14,
Figure 15 and
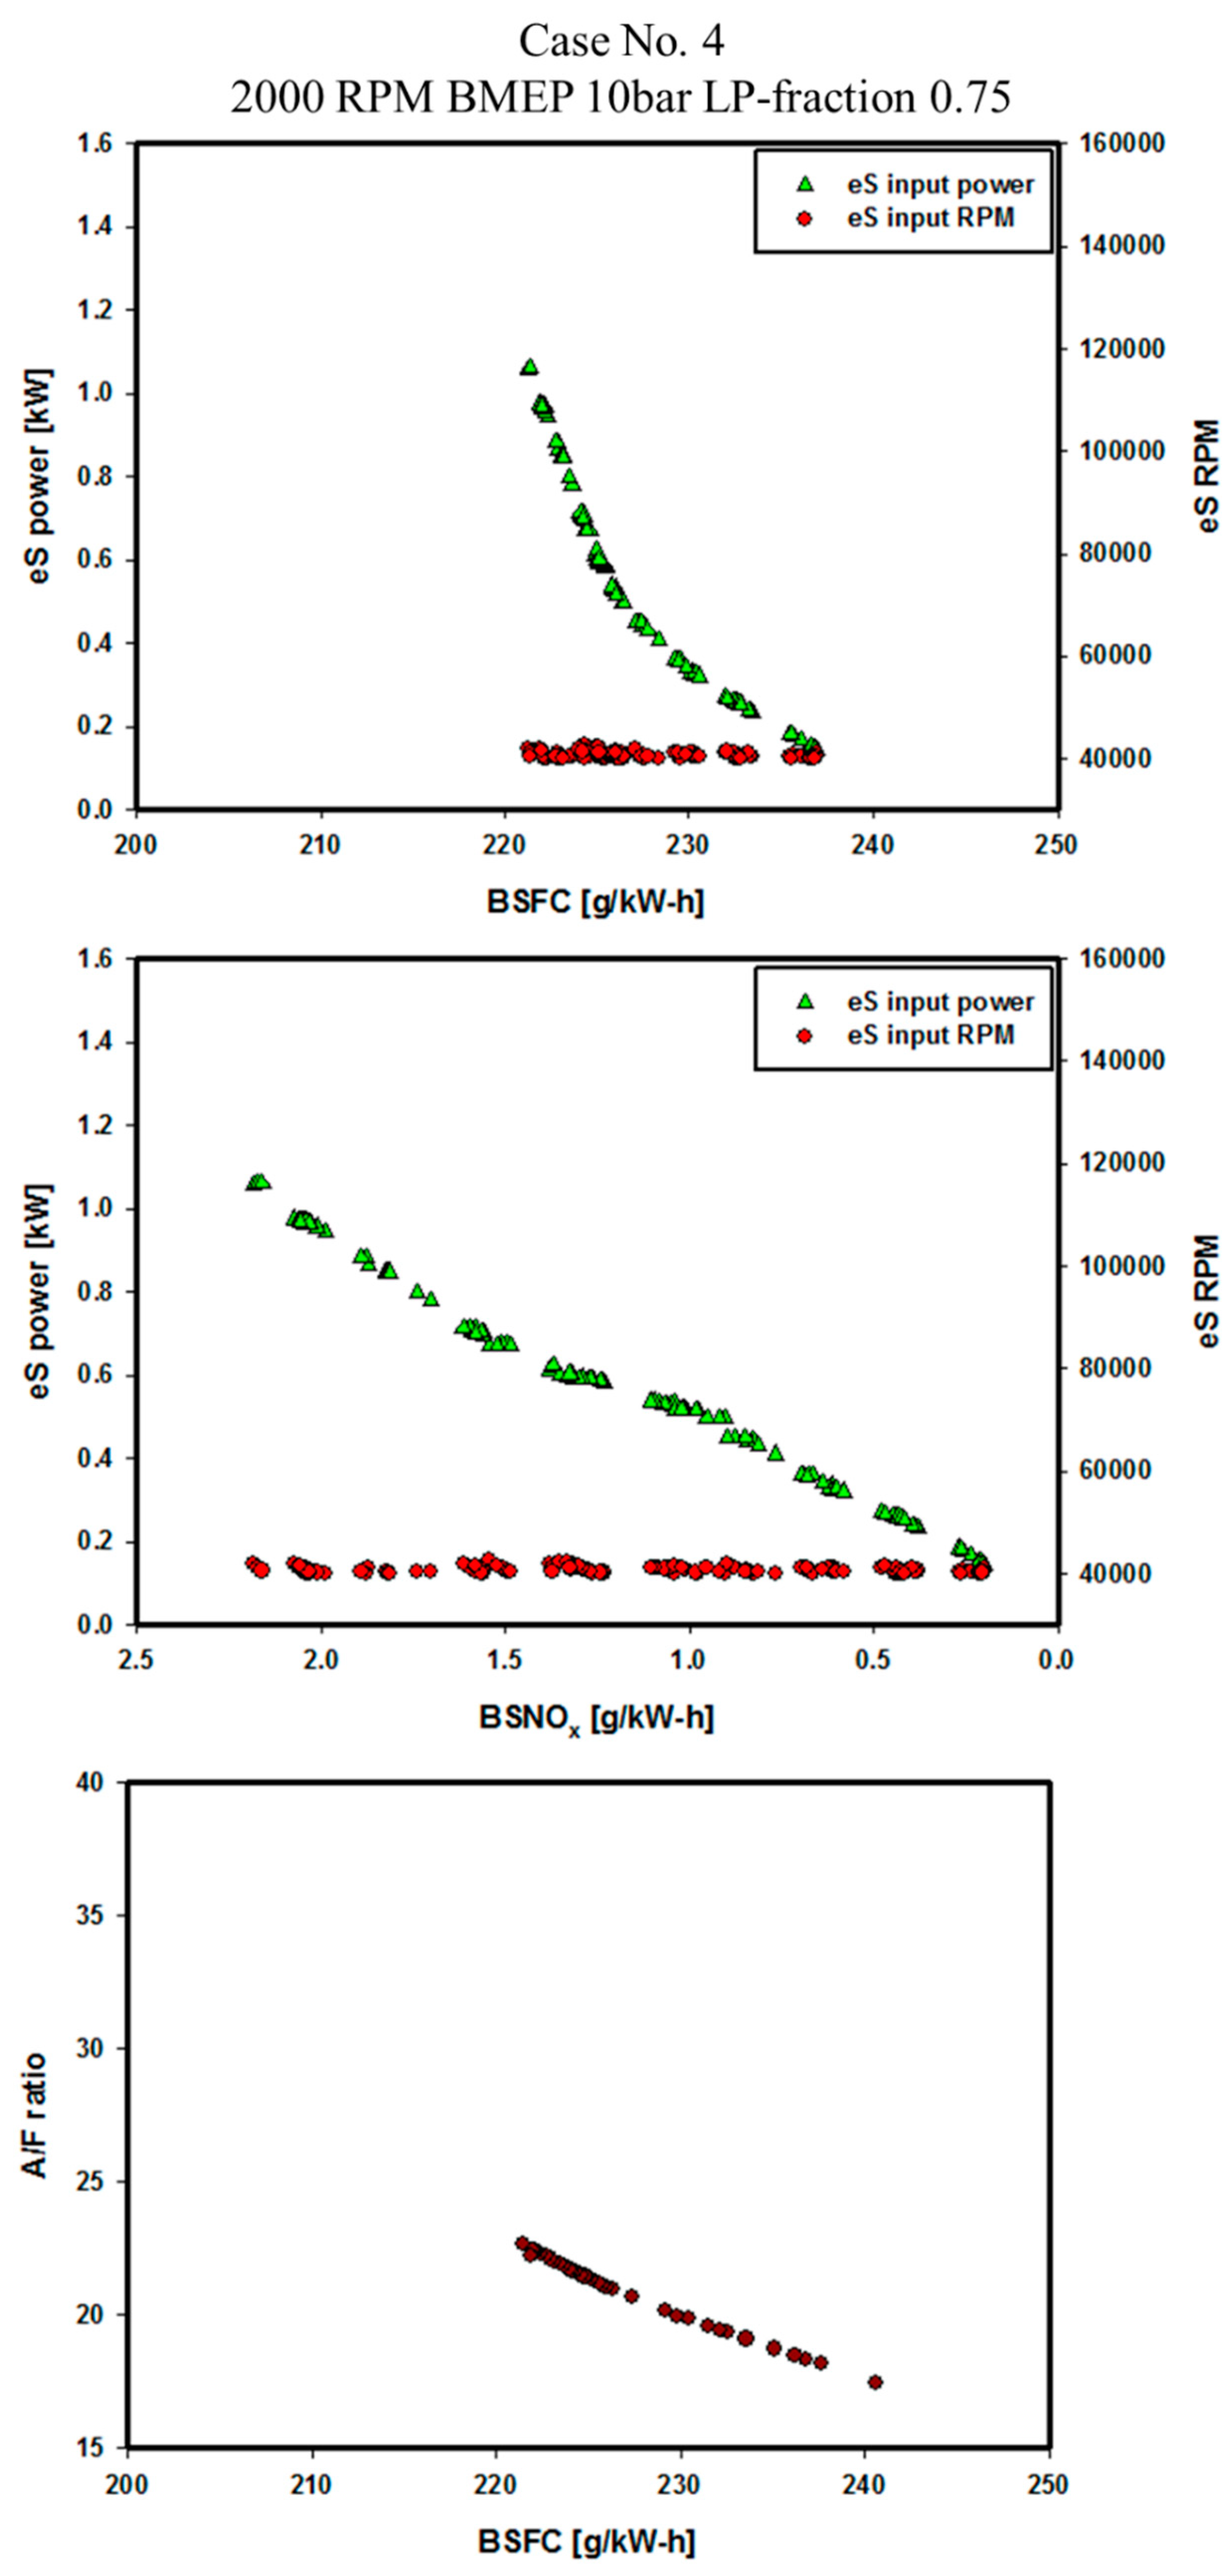
Figure 16, the eS power, eS rpm, and A/F ratio variations are plotted through Pareto fronts on typical LP fractions in each case (LP fractions: case 1, 0.25; cases 2 and 3, 0.5; case 4, 0.75; case 5, 1.0). In each case, BSFC decreased and BSNO
x increased as the A/F ratio increased through Pareto-optimal lines. In cases 1–4, the A/F ratio was controlled predominantly by eS power. Case 1 was a low-load operation condition where the air flow rate was low. Thus, as eS power increased, the A/F ratio increased dramatically. In cases 2 and 3, the A/F ratio was controlled primarily by eS power. However, as it reached the maximum power of eS = 1.5 kW, the A/F ratio was controlled by increasing eS rpm. This means that more air can be introduced into the engine by increasing eS rpm when the maximum power is already applied. In case 4, the A/F ratio was controlled only by eS power. This was because the base boost pressure in case 4 was 1.68 bar, which is high enough, and the EGR rate difference between the base and heavy EGR condition was quite low (~10.42%) versus the other conditions. In case 5, the A/F ratio was controlled predominantly by eS rpm. This will be discussed in the next chapter.
3.6. LP Fraction Effects on eS Power and rpm
In
Section 3.3, the effects of LP fraction on fuel efficiency and NO
x emissions were investigated. The fuel efficiency increased and NO
x emissions decreased. In
Figure 17,
Figure 18 and
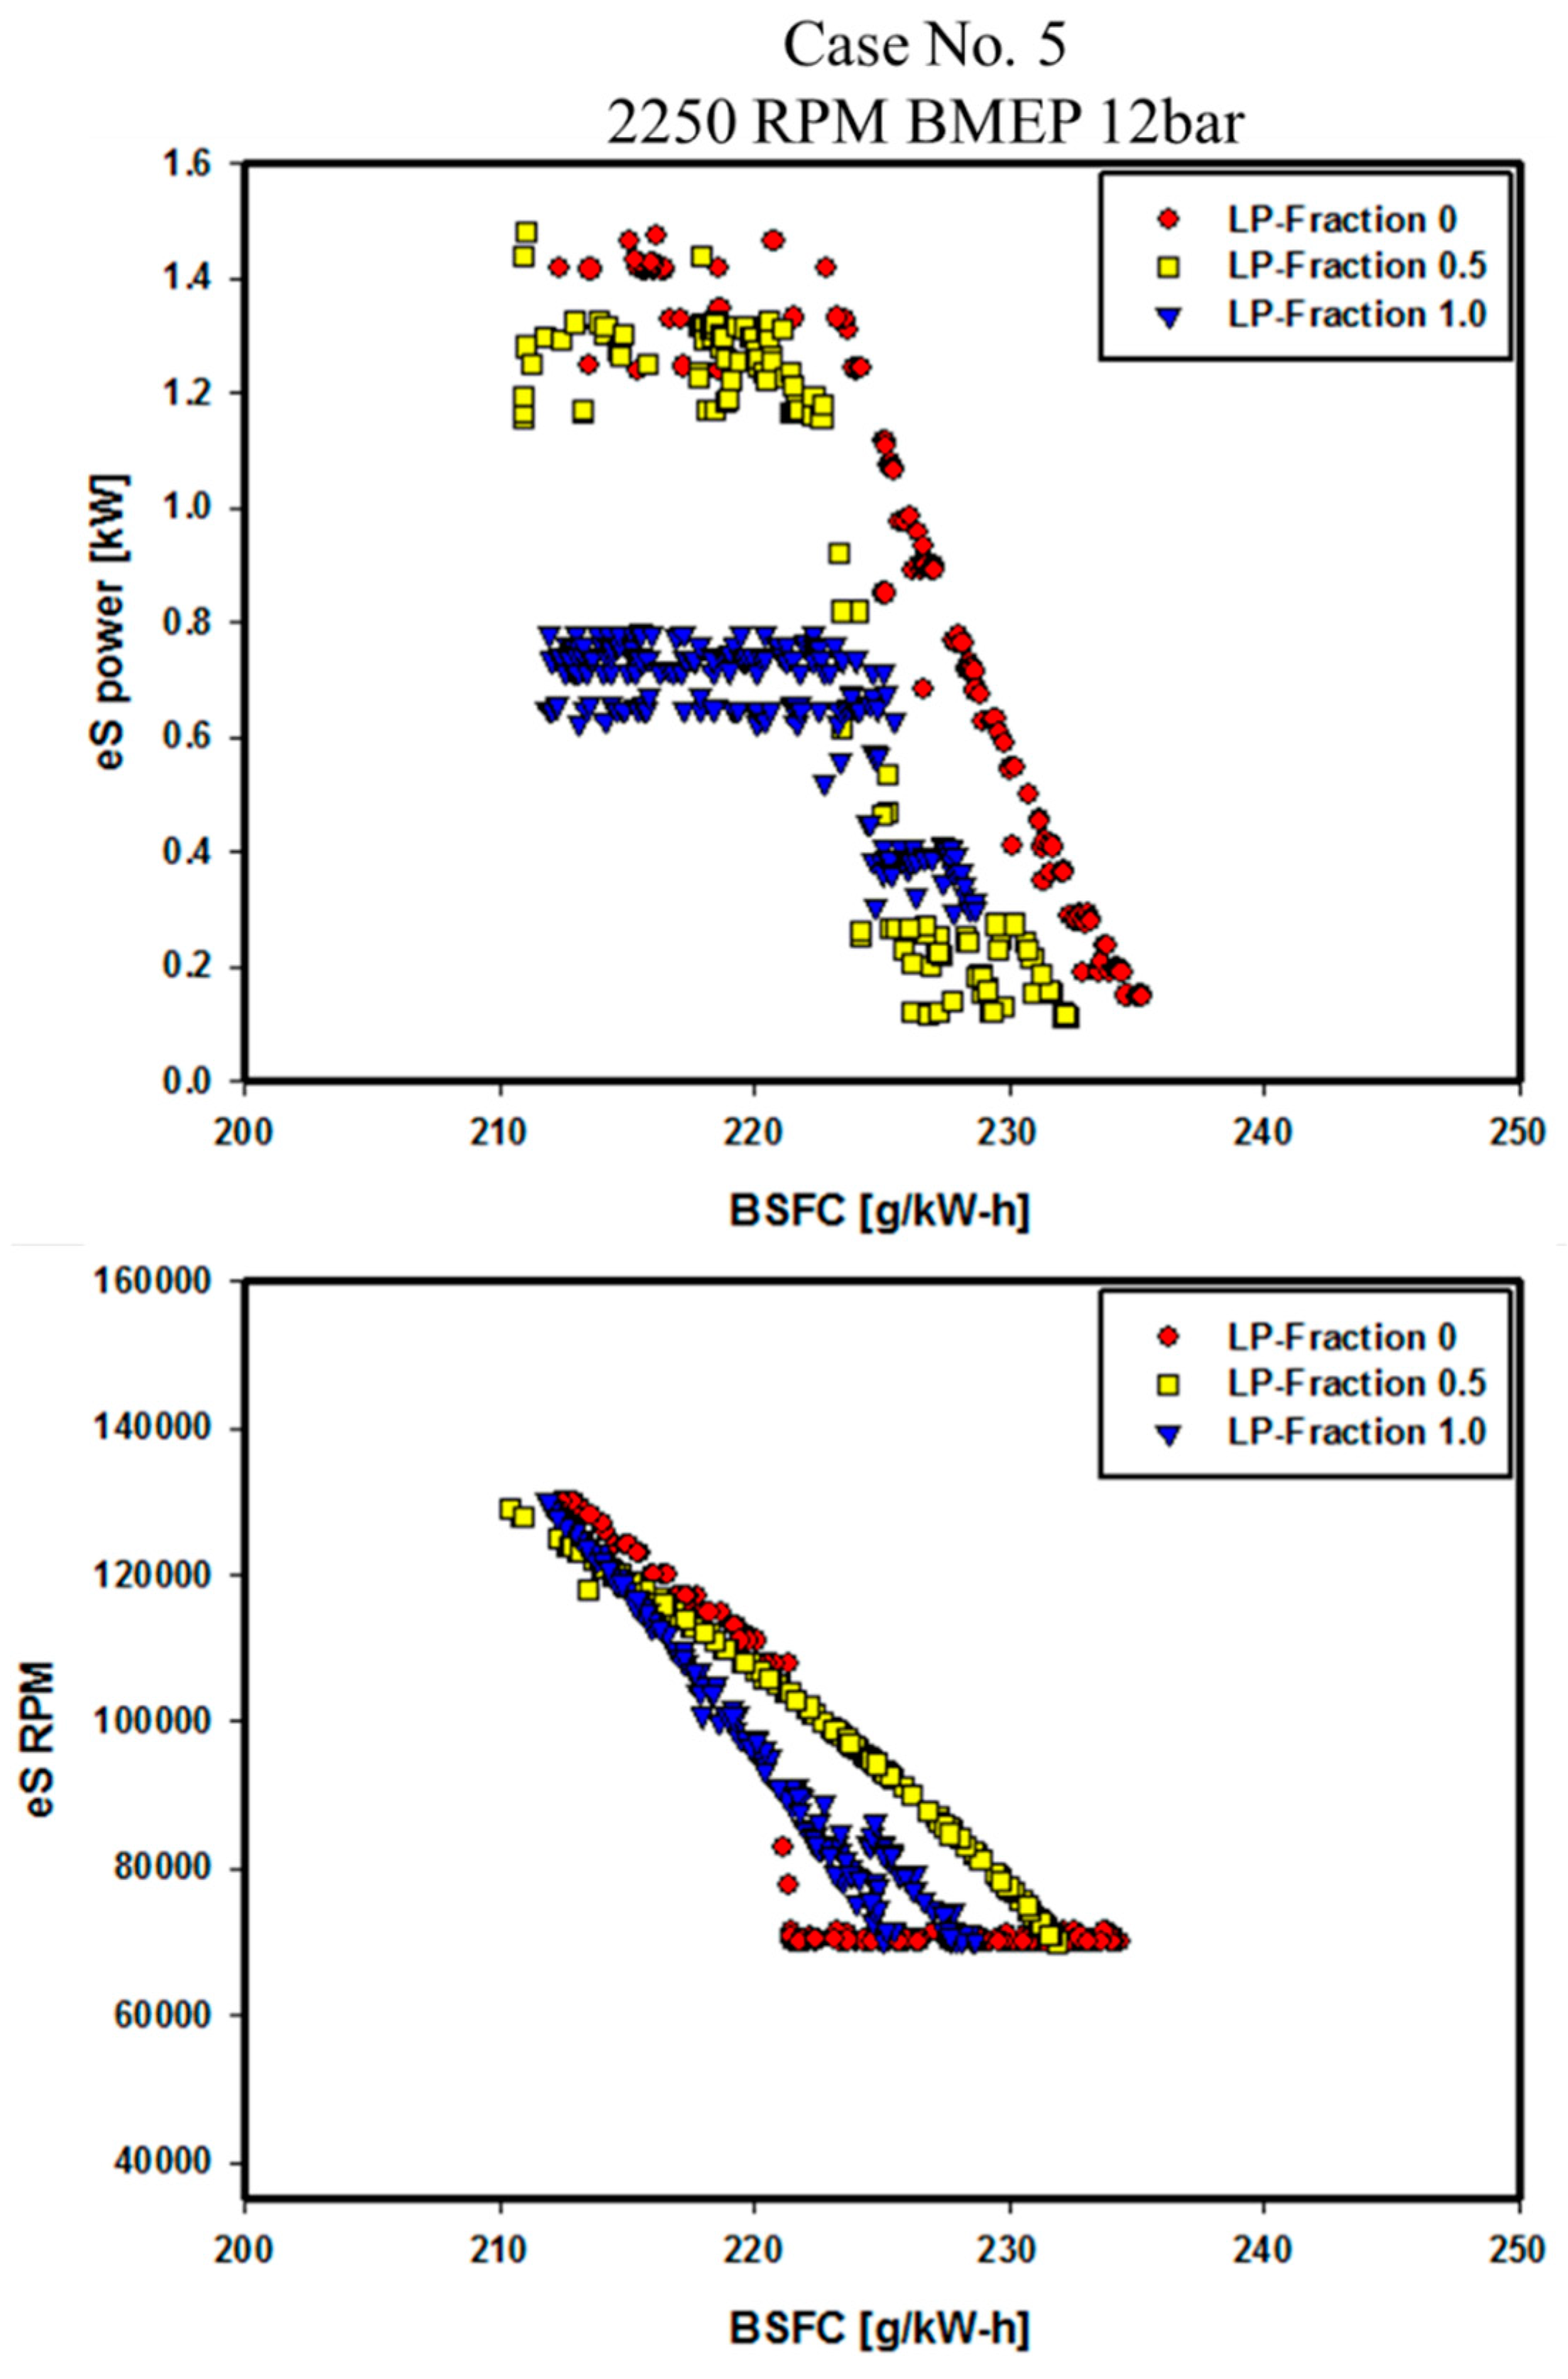
Figure 19, the effects of LP fraction on eS power and rpm are shown. In cases 3 and 4, eS power was the major variable controlling the A/F ratio. As the LP fraction increased, the eS power decreased at the same BSFC level. This is because, at the same pressure ratio, the air flow rate increases when the LP fraction increases, making the eS operate with higher efficiency. In case 5,
Figure 19 shows that eS power was the major controller of the A/F ratio in the LP fraction 0 case. However, as the LP fraction increased, eS rpm became the dominant controller of the A/F ratio. In the cases wherein the LP fraction = 0.5 and 1.0, as the LP fraction increased, eS power and rpm decreased under the same BSFC conditions. This was for the same reason as in cases 3 and 4, i.e., the eS operated in a higher efficiency area as the LP fraction increased.
3.7. Optimization Results
In
Figure 20 and
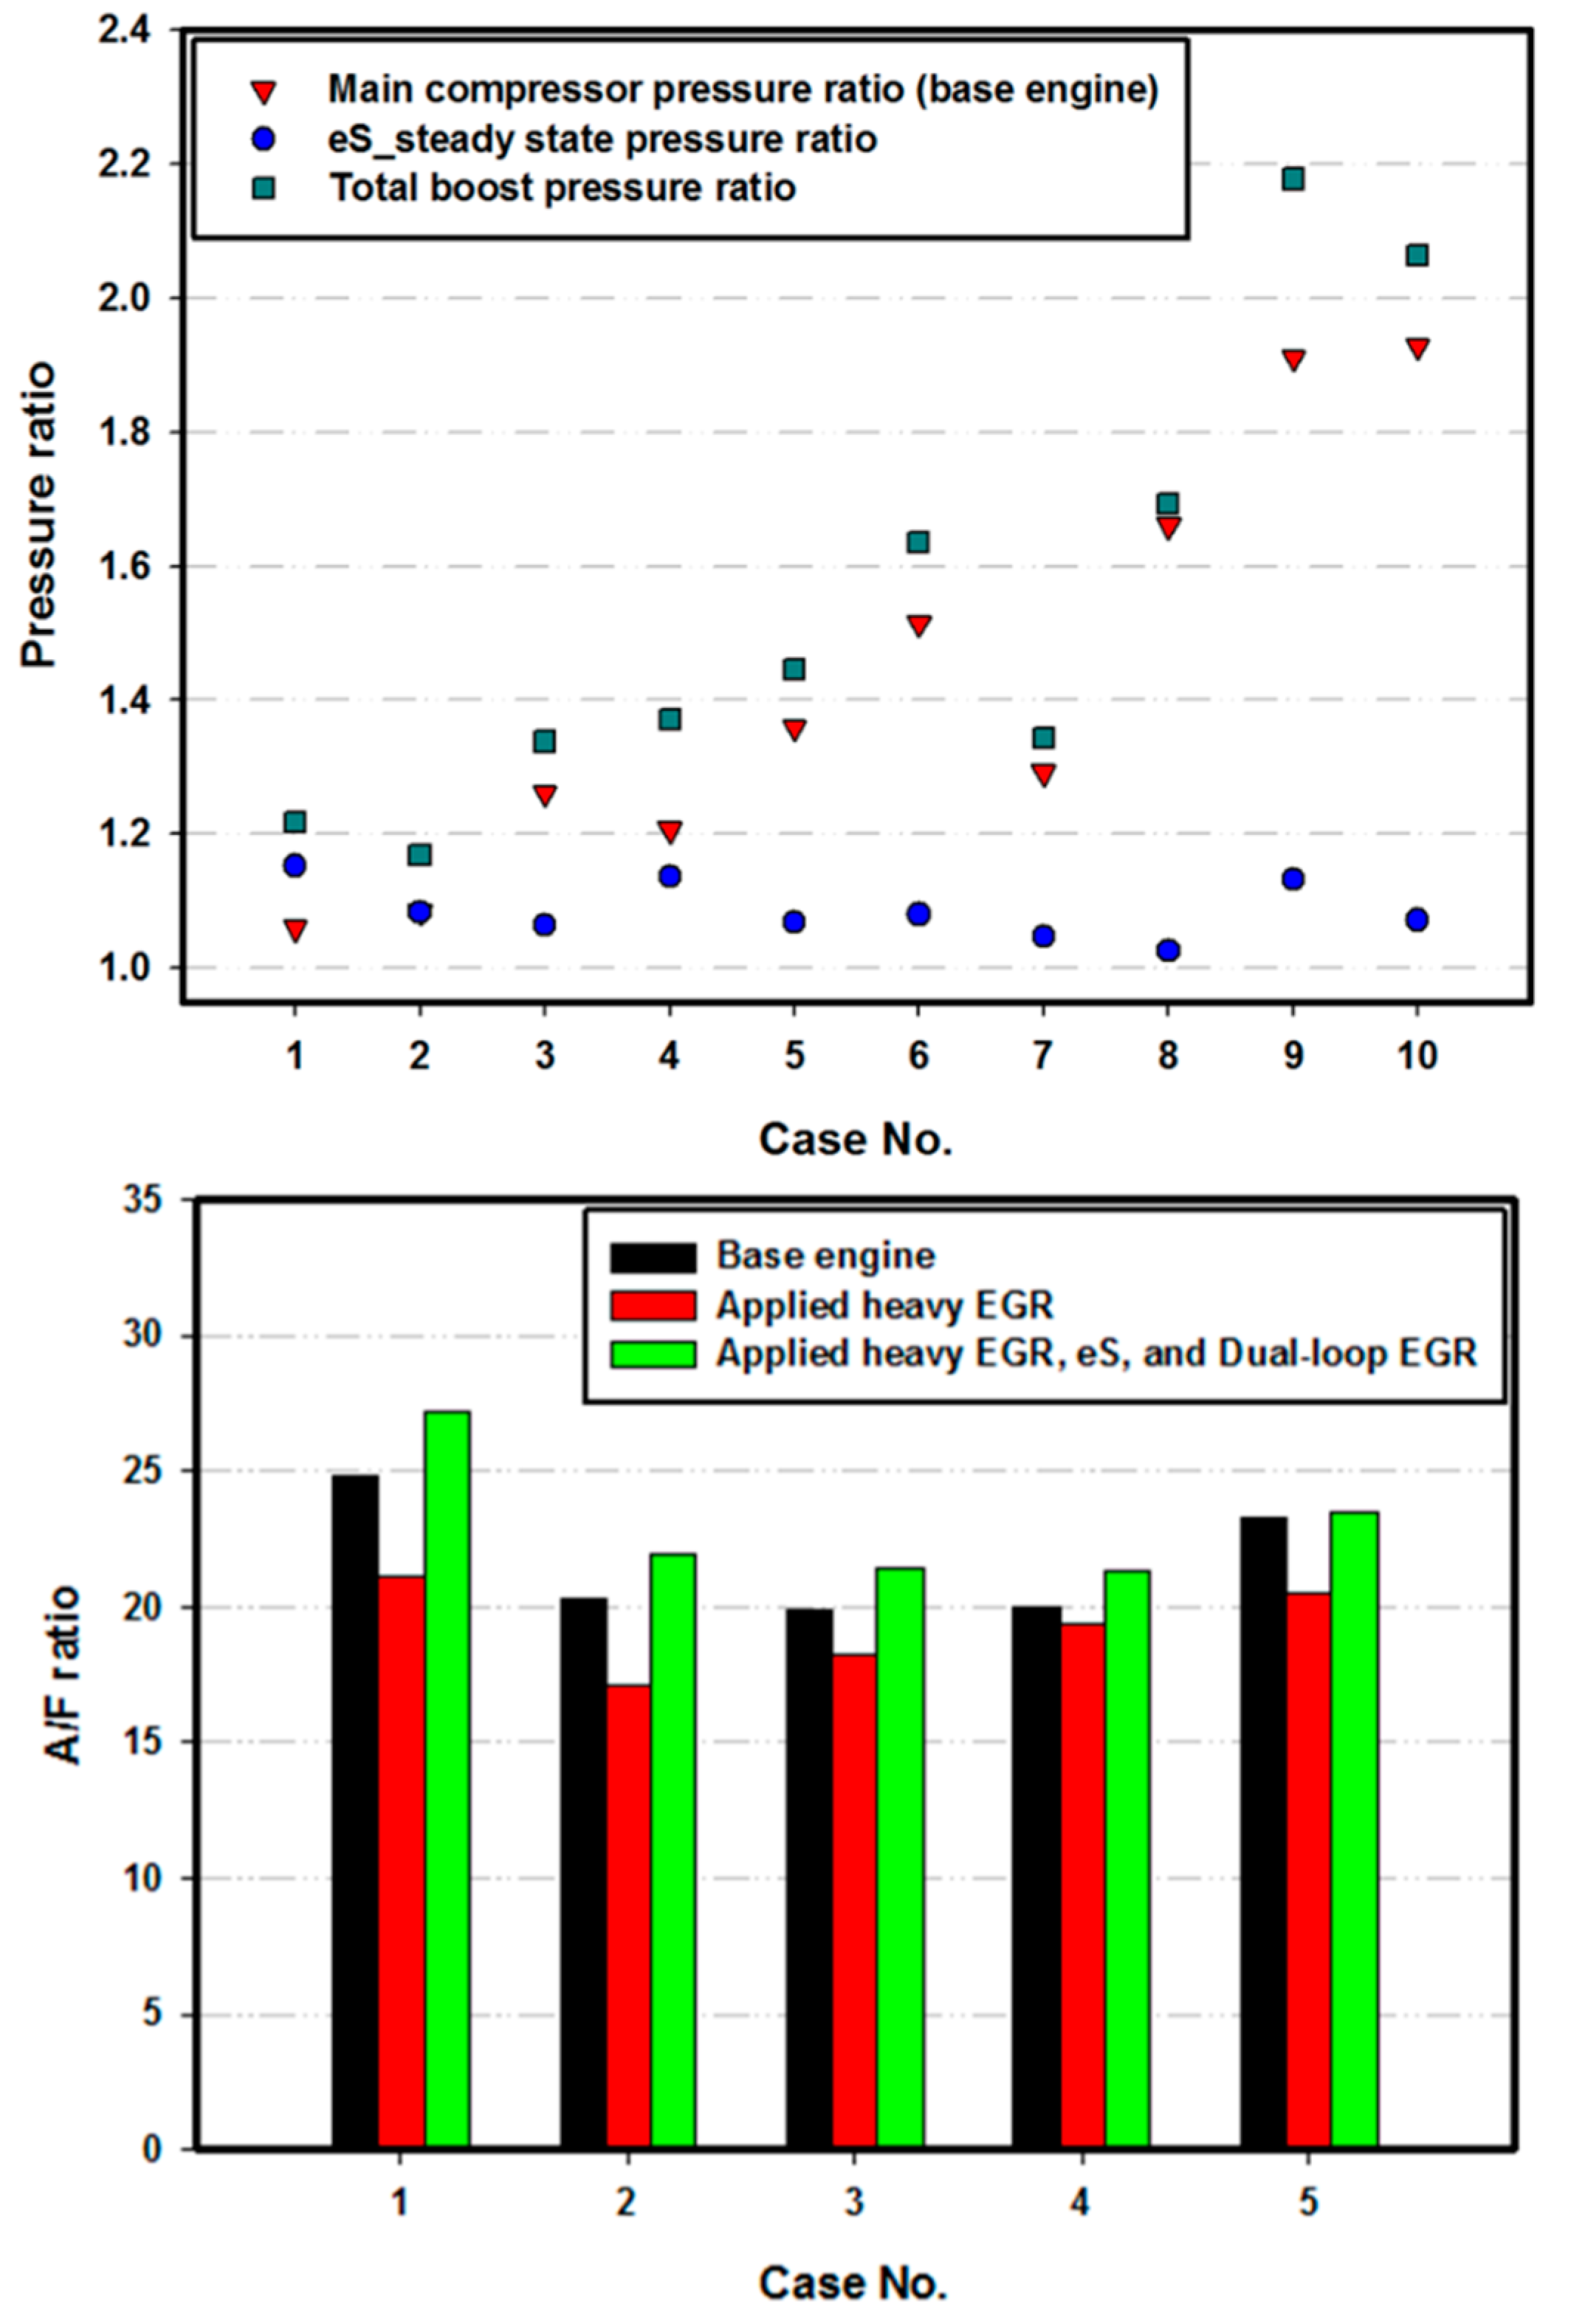
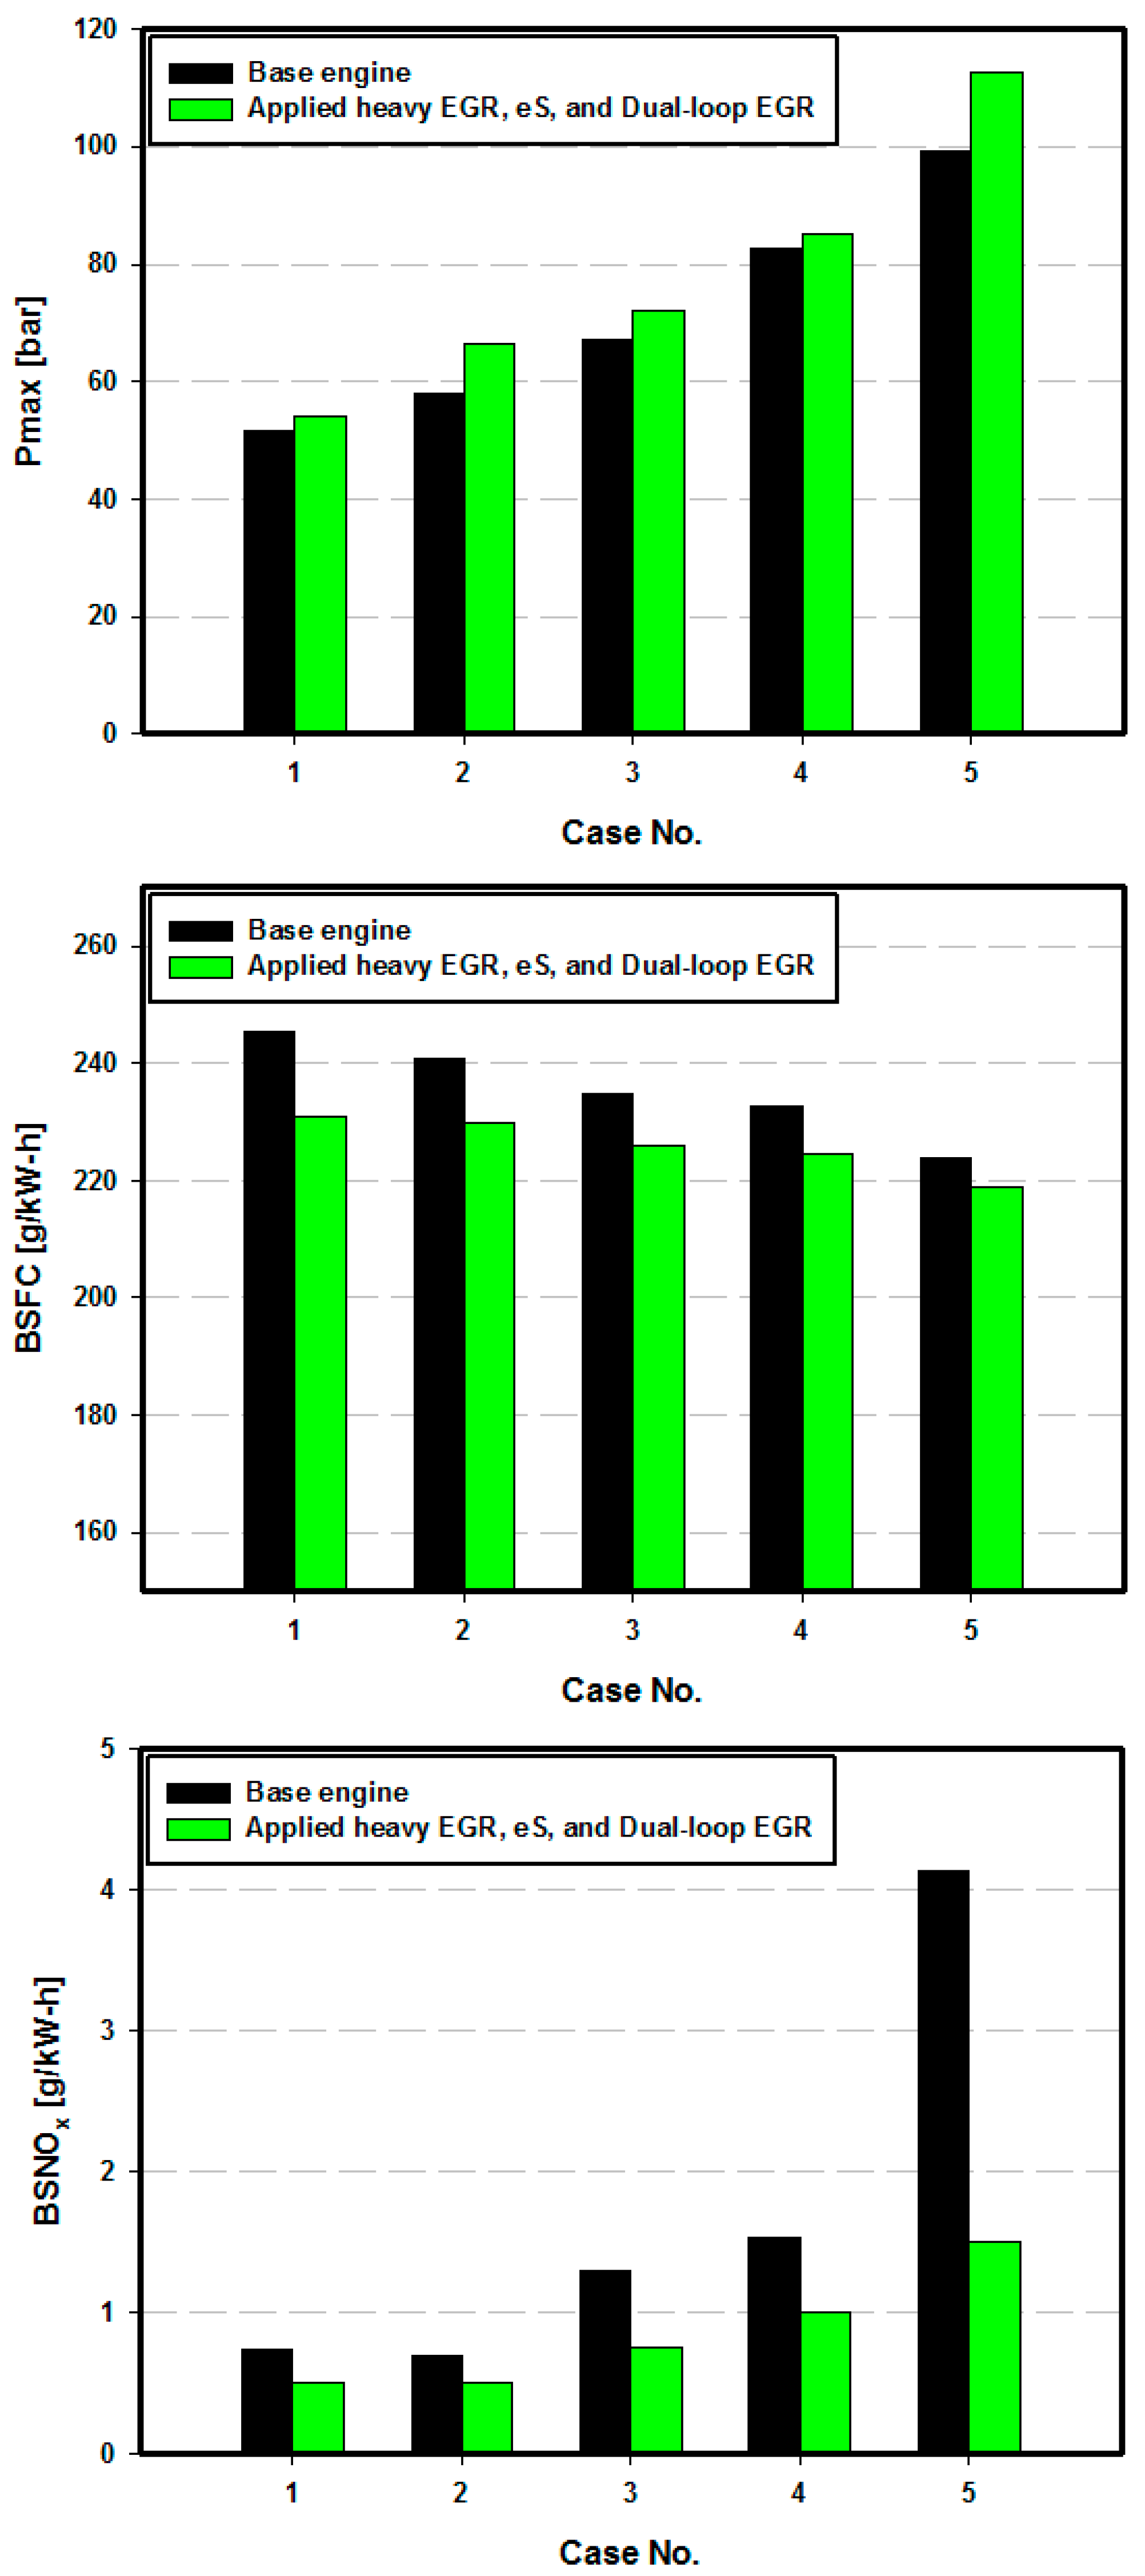
Figure 21, the base engine, heavy EGR conditions, and optimization results are compared. The selected LP fractions are case 1 with an LP fraction of 0.25, cases 2 and 3 with LP fractions of 0.5, case 4 with an LP fraction of 0.75, and case 5 with an LP fraction of 1.0. The top panel of
Figure 20 shows the intake pressure of the base engine and the eS pressure ratio and the optimized intake pressures. In case 4, the eS pressure ratio was lower than that of the other cases, so that its A/F ratio was controlled by eS power alone. In the bottom panel of
Figure 20, the A/F ratios are compared. By applying heavy EGR, the A/F ratio decreased. However, by applying and optimizing eS, the A/F ratio increased, so that the thermal efficiency of the engine also increased. However, in the case of an intake pressure increase, Pmax would also be expected to increase. In the top panel of
Figure 21, Pmax for the optimized engine is shown. The maximum Pmax was 112.53 bar, which was lower than the engine’s maximum pressure limit (165 bar). Thus, it was rational to apply the maximum Pmax. As shown in the middle panel of
Figure 21, the BSFC under all conditions decreased when applying and optimizing eS and dual-loop EGR. BSFC decreased by a maximum of 5.86% in case 1. However, for the whole engine system, the eS power of 0.54 kW needs to be considered. Finally in the bottom panel of
Figure 21, by applying heavy EGR and dual-loop EGR, BSNO
x decreased with better thermal efficiency. BSNO
x decreased by a maximum of 63.73% in case 5. In case 1, BSFC decreased by 5.86% but BSNO
x decreased by 32.87% simultaneously.


