Article

Damage Evolution and Failure Behavior of Post-Mainshock Damaged Rocks under Aftershock Effects

1
School of Resources and Safety Engineering, Central South University, Changsha 410083, China
2
College of Civil Engineering and Architecture, Hainan University, Haikou 570228, China
3
School of Civil Engineering, Changsha University of Science & Technology, Changsha 410076, China
*
Authors to whom correspondence should be addressed.
Energies 2019, 12(23), 4429; https://doi.org/10.3390/en12234429
Submission received: 29 October 2019 / Revised: 15 November 2019 / Accepted: 18 November 2019 / Published: 21 November 2019

Abstract

:
Rock stability has long been a hot topic during underground energy exploitation, but the failure process of rock materials under earthquake effects is extremely complicated, and the failure mechanism still remains unclear. In order to investigate the fatigue damage and failure behavior of rocks under aftershock effects considering the post-mainshock damage states, a series of laboratory tests were conducted on marble specimens subjected to stepwise cyclic loading. Four levels of peak stress (i.e., 10, 30, 50, and 70 MPa) were applied in the first cycle, to simulate mainshock damage. The results indicate that, with the increase of initial cycle amplitude, mainshock damage has a significant effect on deformation behavior, dissipated energy, P-wave velocity, and AE characteristics of tested specimens during aftershock process. The increasing amplitude of initial cycle enhances irreversible deformation and weakens the resistance to deformation, which accelerates the expansion of specimen volume and results in the reduction of bearing capacity. Furthermore, the increasing amplitude of initial cycle obviously changes the failure morphologies and intensifies the final macro-fracture scale of tested specimens, which are verified by acoustic emission AF-RA value and b-value, respectively.

1. Introduction

Rock materials, as a common construction element due to excellent mechanical properties and convenient in situ collection, have been extensively applied in many underground engineering applications, such as hydropower station, oil gas storage, deep-lying tunnel, and underground goaf [1,2,3,4,5]. During the construction and operation process, due to high in situ stress, weak structural planes, and other uncontrollable geological conditions, many underground rock structures subjected to external disturbance often suffer from rock burst, spalling, high-stress collapse, and larger deformation [6,7,8,9,10]. In particular, the underground rock pillar embedded in rock mass after excavation often suffers various cyclic loads caused by earthquake vibrations, mechanical excavation, volcanic action, blasting, drilling, etc. [11,12,13,14,15,16,17], as shown in Figure 1. Hence, it is highly worthwhile to investigate the fatigue damage and failure mechanism of rock materials under cyclic loads for the design and construction of engineering projects.
In the last ten years, the fatigue damage and failure characteristics of rock materials subjected to cyclic loading have become the research focus of scholars. Xiao et al. [18] analyzed and discussed the advantages and disadvantages of six commonly used methods for defining damage variables based on the test data of granite under cyclic loading. The variations of elastic moduli measured during increasing amplitude cyclic stressing experiments on dry and water-saturated samples of Etna basalt were used by Heap et al. [16] to interpret volcano-tectonic seismicity and deformation at Mt. Etna volcano. Fan et al. [19] conducted comparisons between conventional fatigue tests and interval fatigue tests on the fatigue activity of rock salt. Liu et al. [20] developed a damage constitutive model based on energy dissipation to describe the behavior of rocks under cyclic loading. The mechanical behavior of intermittent jointed rocks under random cyclic compression with different loading parameters was investigated by Liu et al. [15], revealing the mechanical response of synthetic jointed rocks to the seismic loading. Jia et al. [21] and Peng et al. [22] carried out a series of triaxial cyclic compression tests, in order to characterize the deformation behavior under different confining pressures. In terms of nondestructive testing, Meng et al. [23] explored AE characteristics of rock materials during the deformation and failure process under periodic loads, and the relationships among stress, strain, AE activity, accumulated AE activity, and duration under 36 loading and unloading rates were established. Meanwhile, Jia et al. [24] used the code-wave interferometry method to evaluate the variation of the ultrasonic wave velocity and found fluctuations of wave velocity during the cyclic loading corresponding with loading stress change. These previous studies have greatly improved our understanding of the failure mechanism of rock materials under cyclic loads. Nevertheless, for deep rock structures, the failure process is extremely complex, and the disaster mechanism has not been clearly studied.
Due to frequent earthquakes in the world, underground engineering structures are likely to be subjected to cyclic loading, resulting from earthquakes, during their service lives. A number of aftershocks are often triggered by the main earthquake in a short time, which can cause additional damage to mainshock-damaged rock structures [25,26,27]. It was reported that the 8.0-magnitude earthquake in Wenchuan on 12 May 2008 triggered 104 aftershocks of more than magnitude 4.0 within 72 h [28]. Aftershocks can further aggravate the structural damage caused by the mainshocks and result in more loss of property and life, especially for structures already severely damaged. Unfortunately, previous researches on aftershocks mainly focused on wood structure, steel structure, masonry structure, and concrete [29,30,31], and rarely considered the impact of aftershocks on the mainshock damaged rock structure.
In this study, a series of axial cyclic-loading tests with different peak stresses in the first cycle were carried out on marble rocks, to investigate the fatigue damage and failure behavior of the post-mainshock damaged rocks under aftershock effects, which helps to further understand the damage pattern of underground rock structures during seismic sequences.

2. Experimental Materials and Procedures

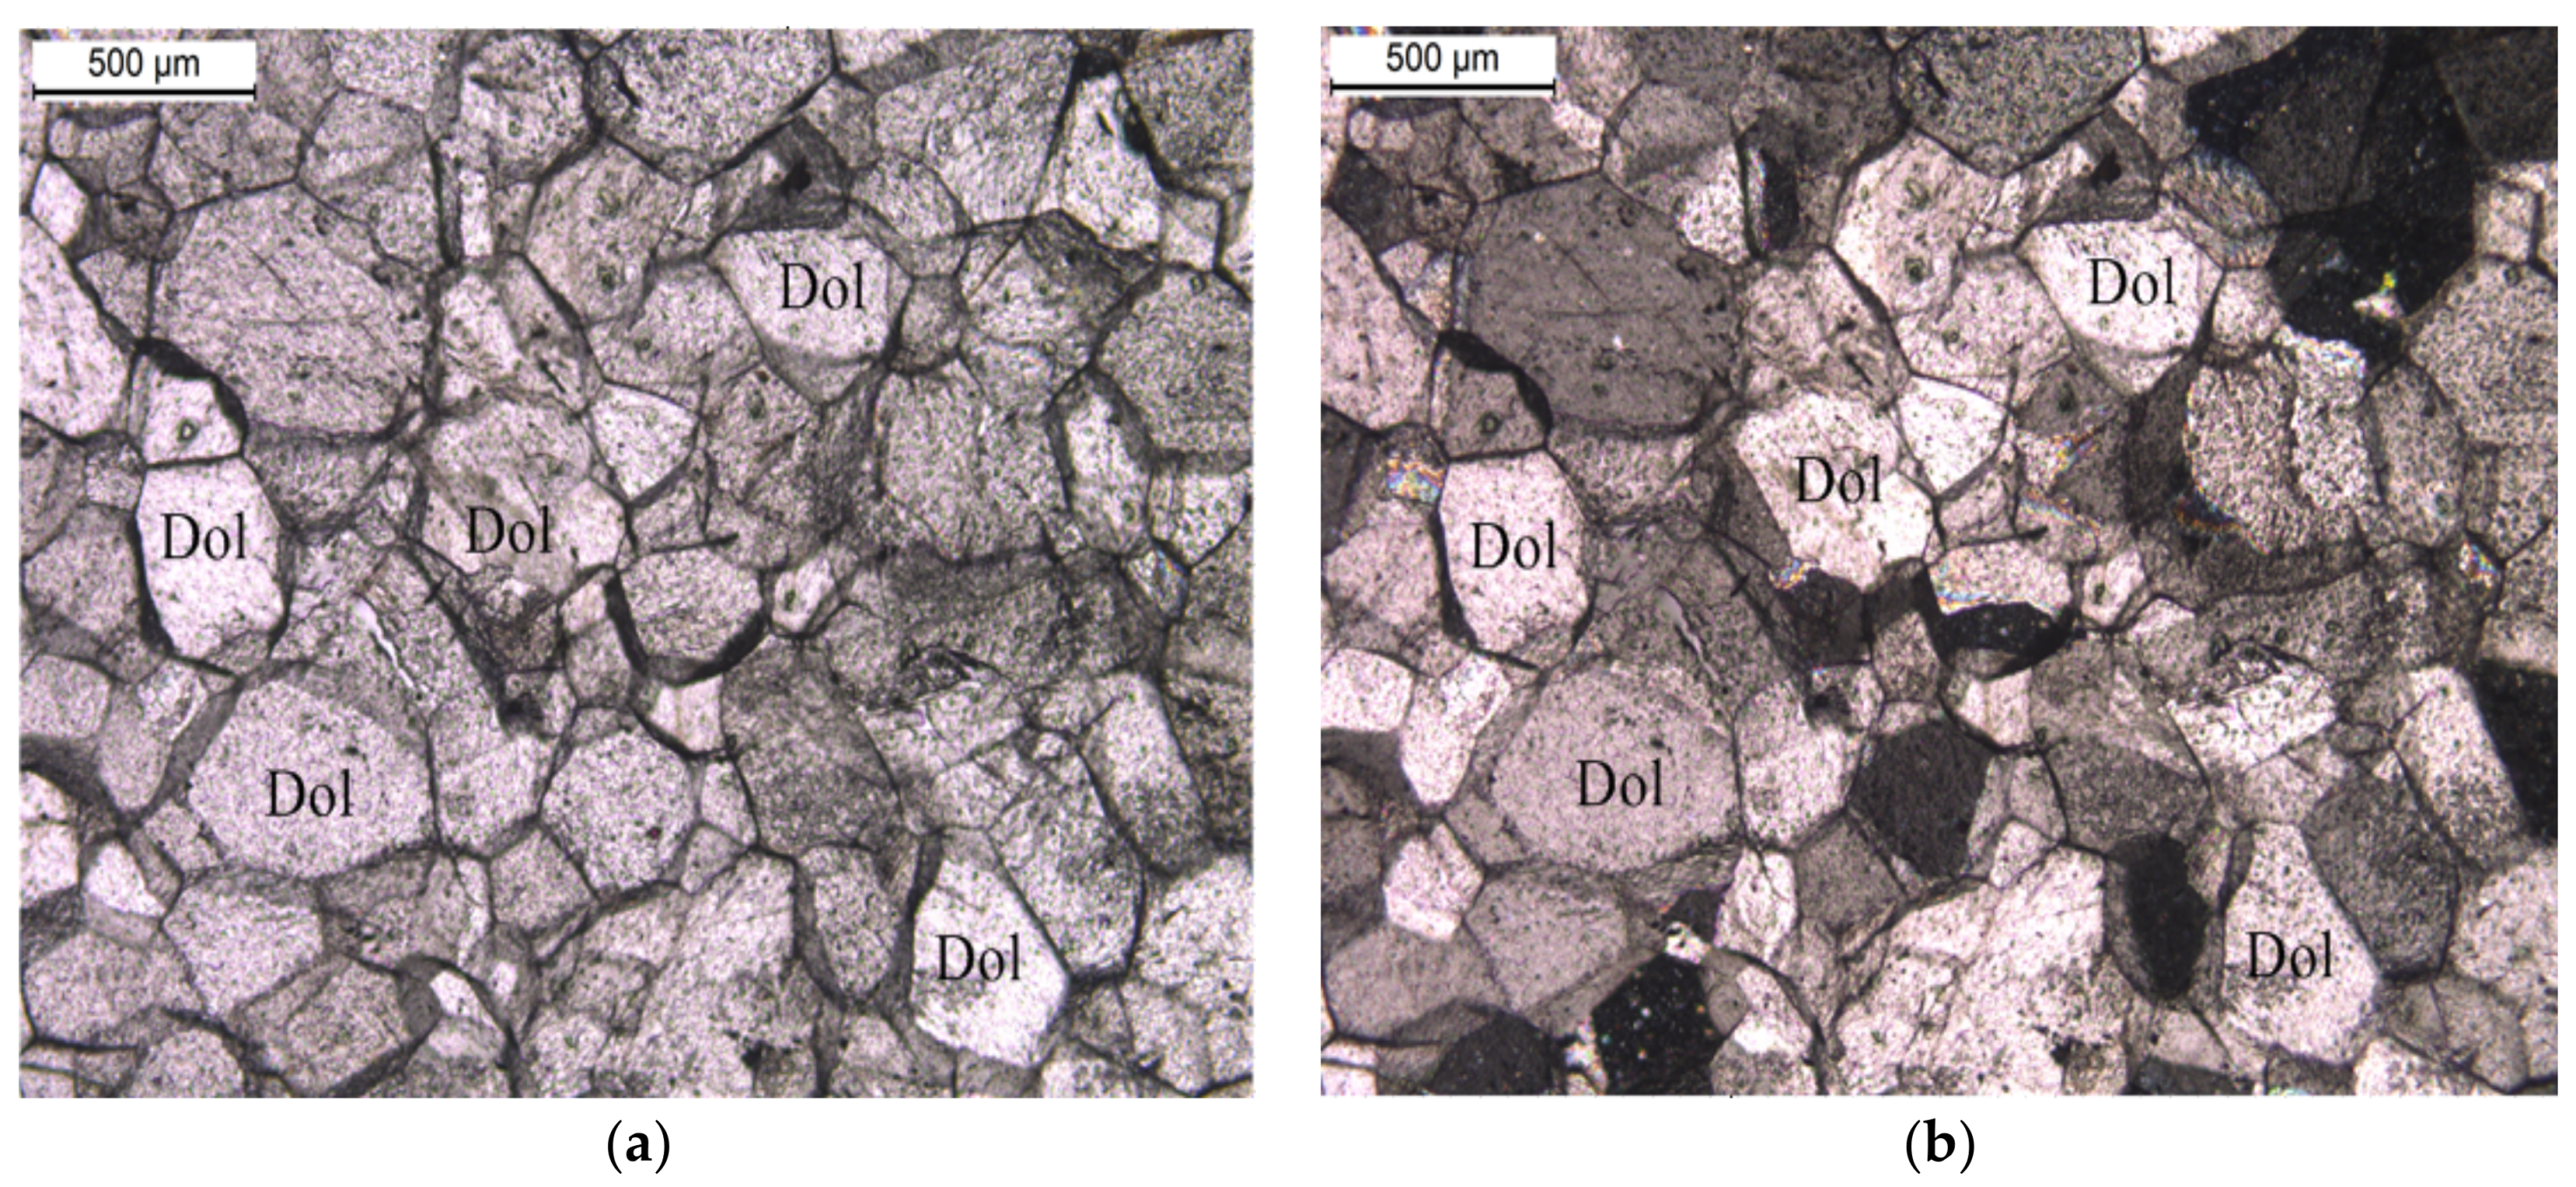
2.1. Sample Preparation

White marble selected as the testing material was collected from metal mine at –100 m in Yunnan province, China. According to the standard of the International Society for Rock Mechanics and Rock Engineering (ISRM) [32], all cylindrical specimens with 50 mm in diameter and 100 mm in length were obtained from an intact rock block. Particular attention was paid to the parallelism of the both ends of specimens, and the surface flatness error on both ends was controlled within 0.02 mm. The mineral composition and micro-structure of the marble were determined by a polarized optical microscope, as shown in Figure 2. The marble is classified as semidiomorphic-idiomorphic crystal dolomite, with irregular granular and blocky mosaic structure. It is primarily comprised of dolomite, a carbonaceous substance, and opaque minerals, and their content and grain size are listed in Table 1.

2.2. Experimental Apparatus

All tests were conducted on MTS815 servo-controlled material testing system (developed by MTS Systems Corporation) in the Advanced Research Center at Central South University, as shown in Figure 3. The maximum loading capacity of the test machine was 4600 kN. The servo sensitivity, strain loading rate, and the minimum sampling interval of the MTS 815 system were 290 Hz, 10−7–10−2/s, and 50 μs, respectively. Axial and circumferential extensometers fixed on rock specimens were used to monitor real-time axial and transverse deformation, respectively. The MTS ultrasonic velocity system, including specially designed platens, transducers, cabling, and feedthroughs, was applied to measure longitudinal ultrasonic velocity (or P-wave) in the axial direction of the tested sample. A couple of transducers were placed on opposite ends, lengthwise, of the specimen. The center frequency of the transducer for P-wave was 1000 kHz. Additionally, an acoustic emission (AE) acquisition system produced by the Physical Acoustics Corporation (PAC) was employed to acquire the AE activity information in real time. Two AE Nano30 sensors with a frequency between 125 Hz and 750 kHz were attached on the rock surface. The preamplifier (PAC 2/4/6) was set to 40 dB to avoid potential noise interference from electronic devices.

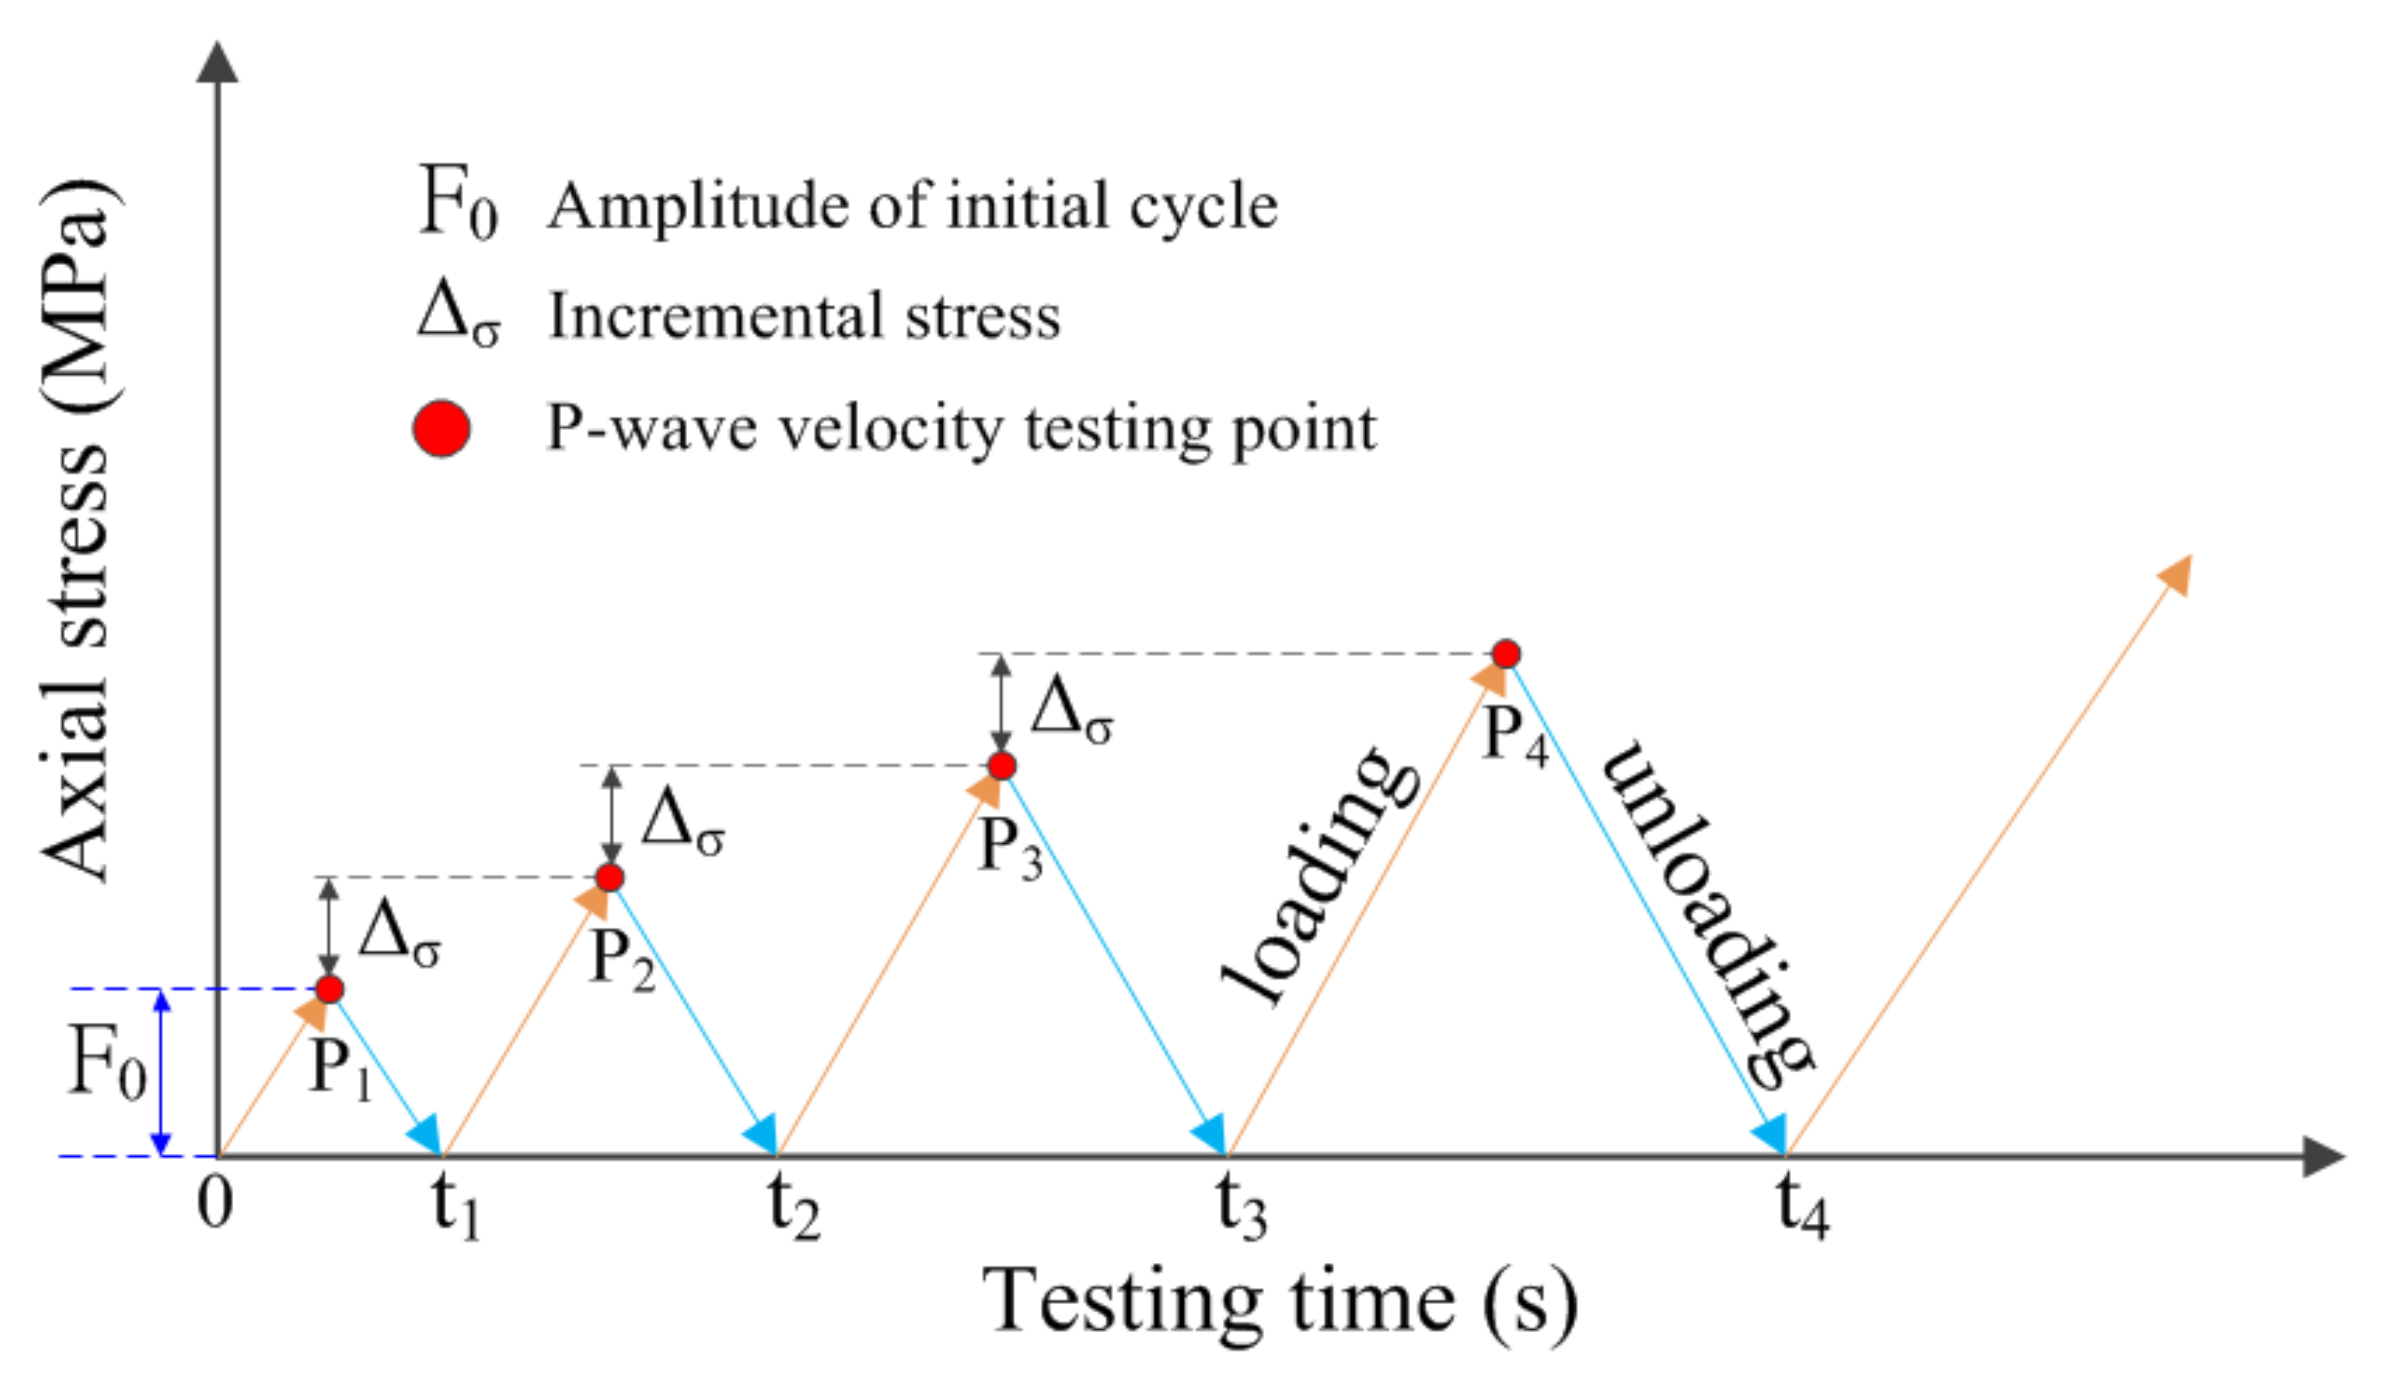
2.3. Testing Procedures

Four groups stress paths were designed for tests. For each group, the peak stress in the first cycle is at different levels of intensity, which are used to define the initial damage states caused by mainshocks. The amplitude of initial cycle ( F 0 ) is 10, 30, 50, and 70 MPa, respectively. The following stepwise cyclic loading processes represent aftershocks, the peak stress increases with a constant increment of 10 MPa until the specimen fails, as shown in Figure 4. Both loading and unloading rates were 0.002 mm/s. In order to reduce the discretization of test results, five specimens were prepared for each group test. In addition, ultrasonic P-wave velocity (UPV) in the axial direction of specimens was monitored at each stress unloading point.

3. Experimental Results and Discussion

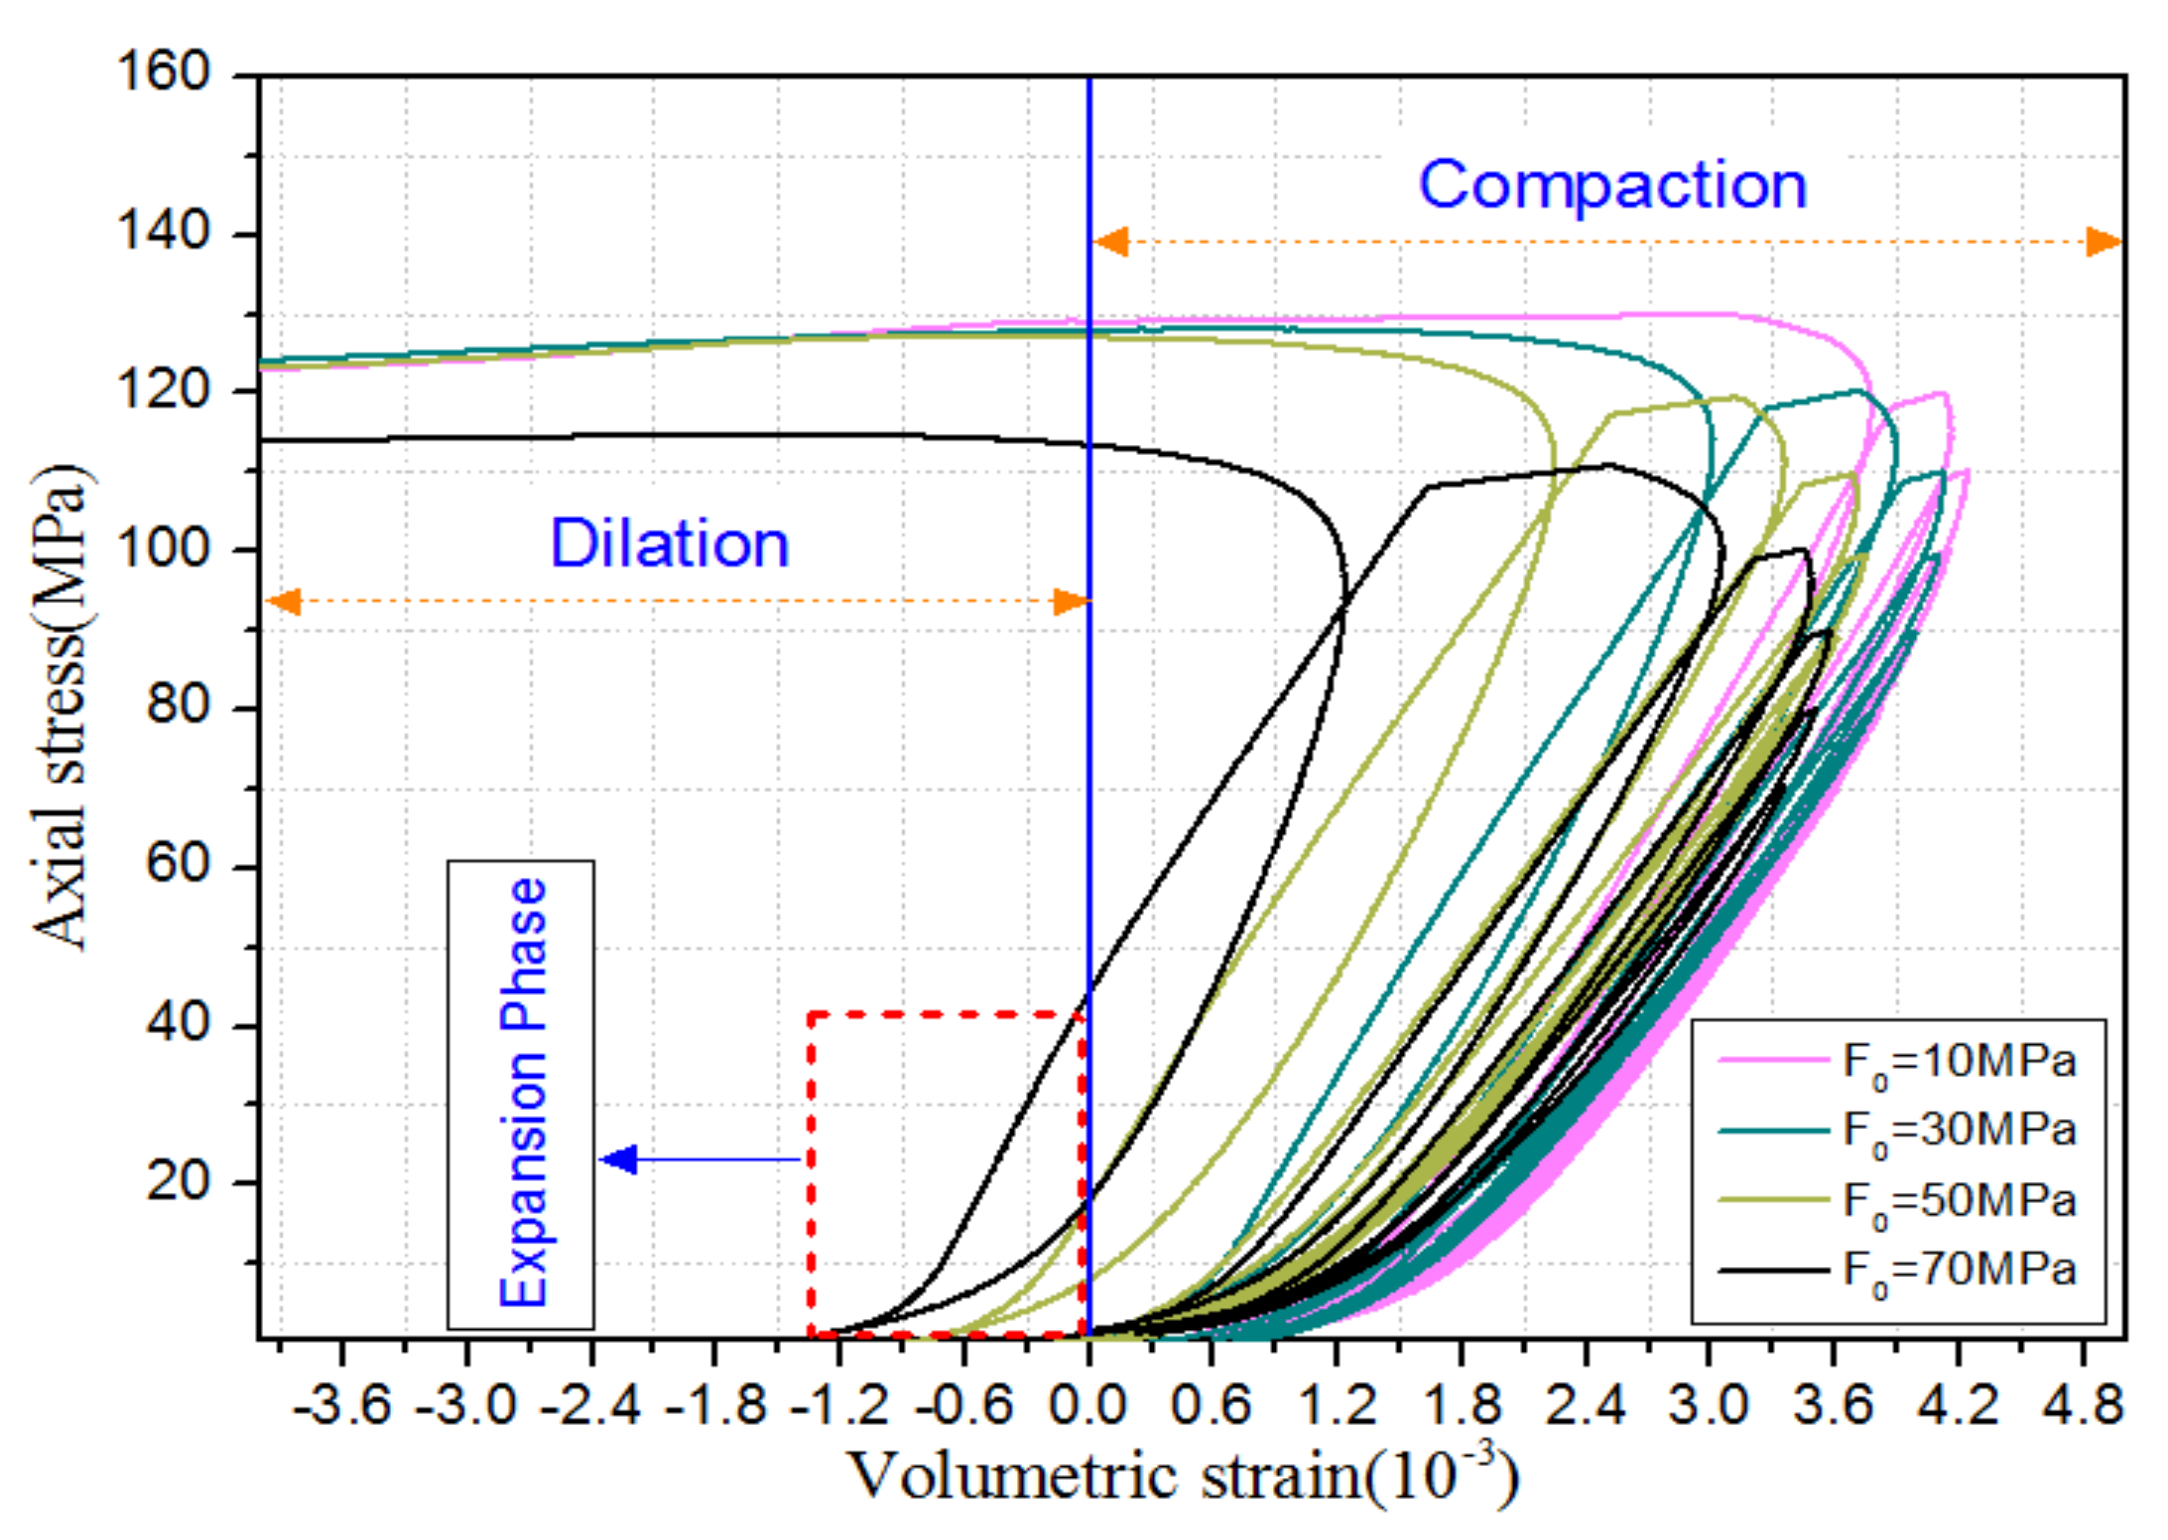
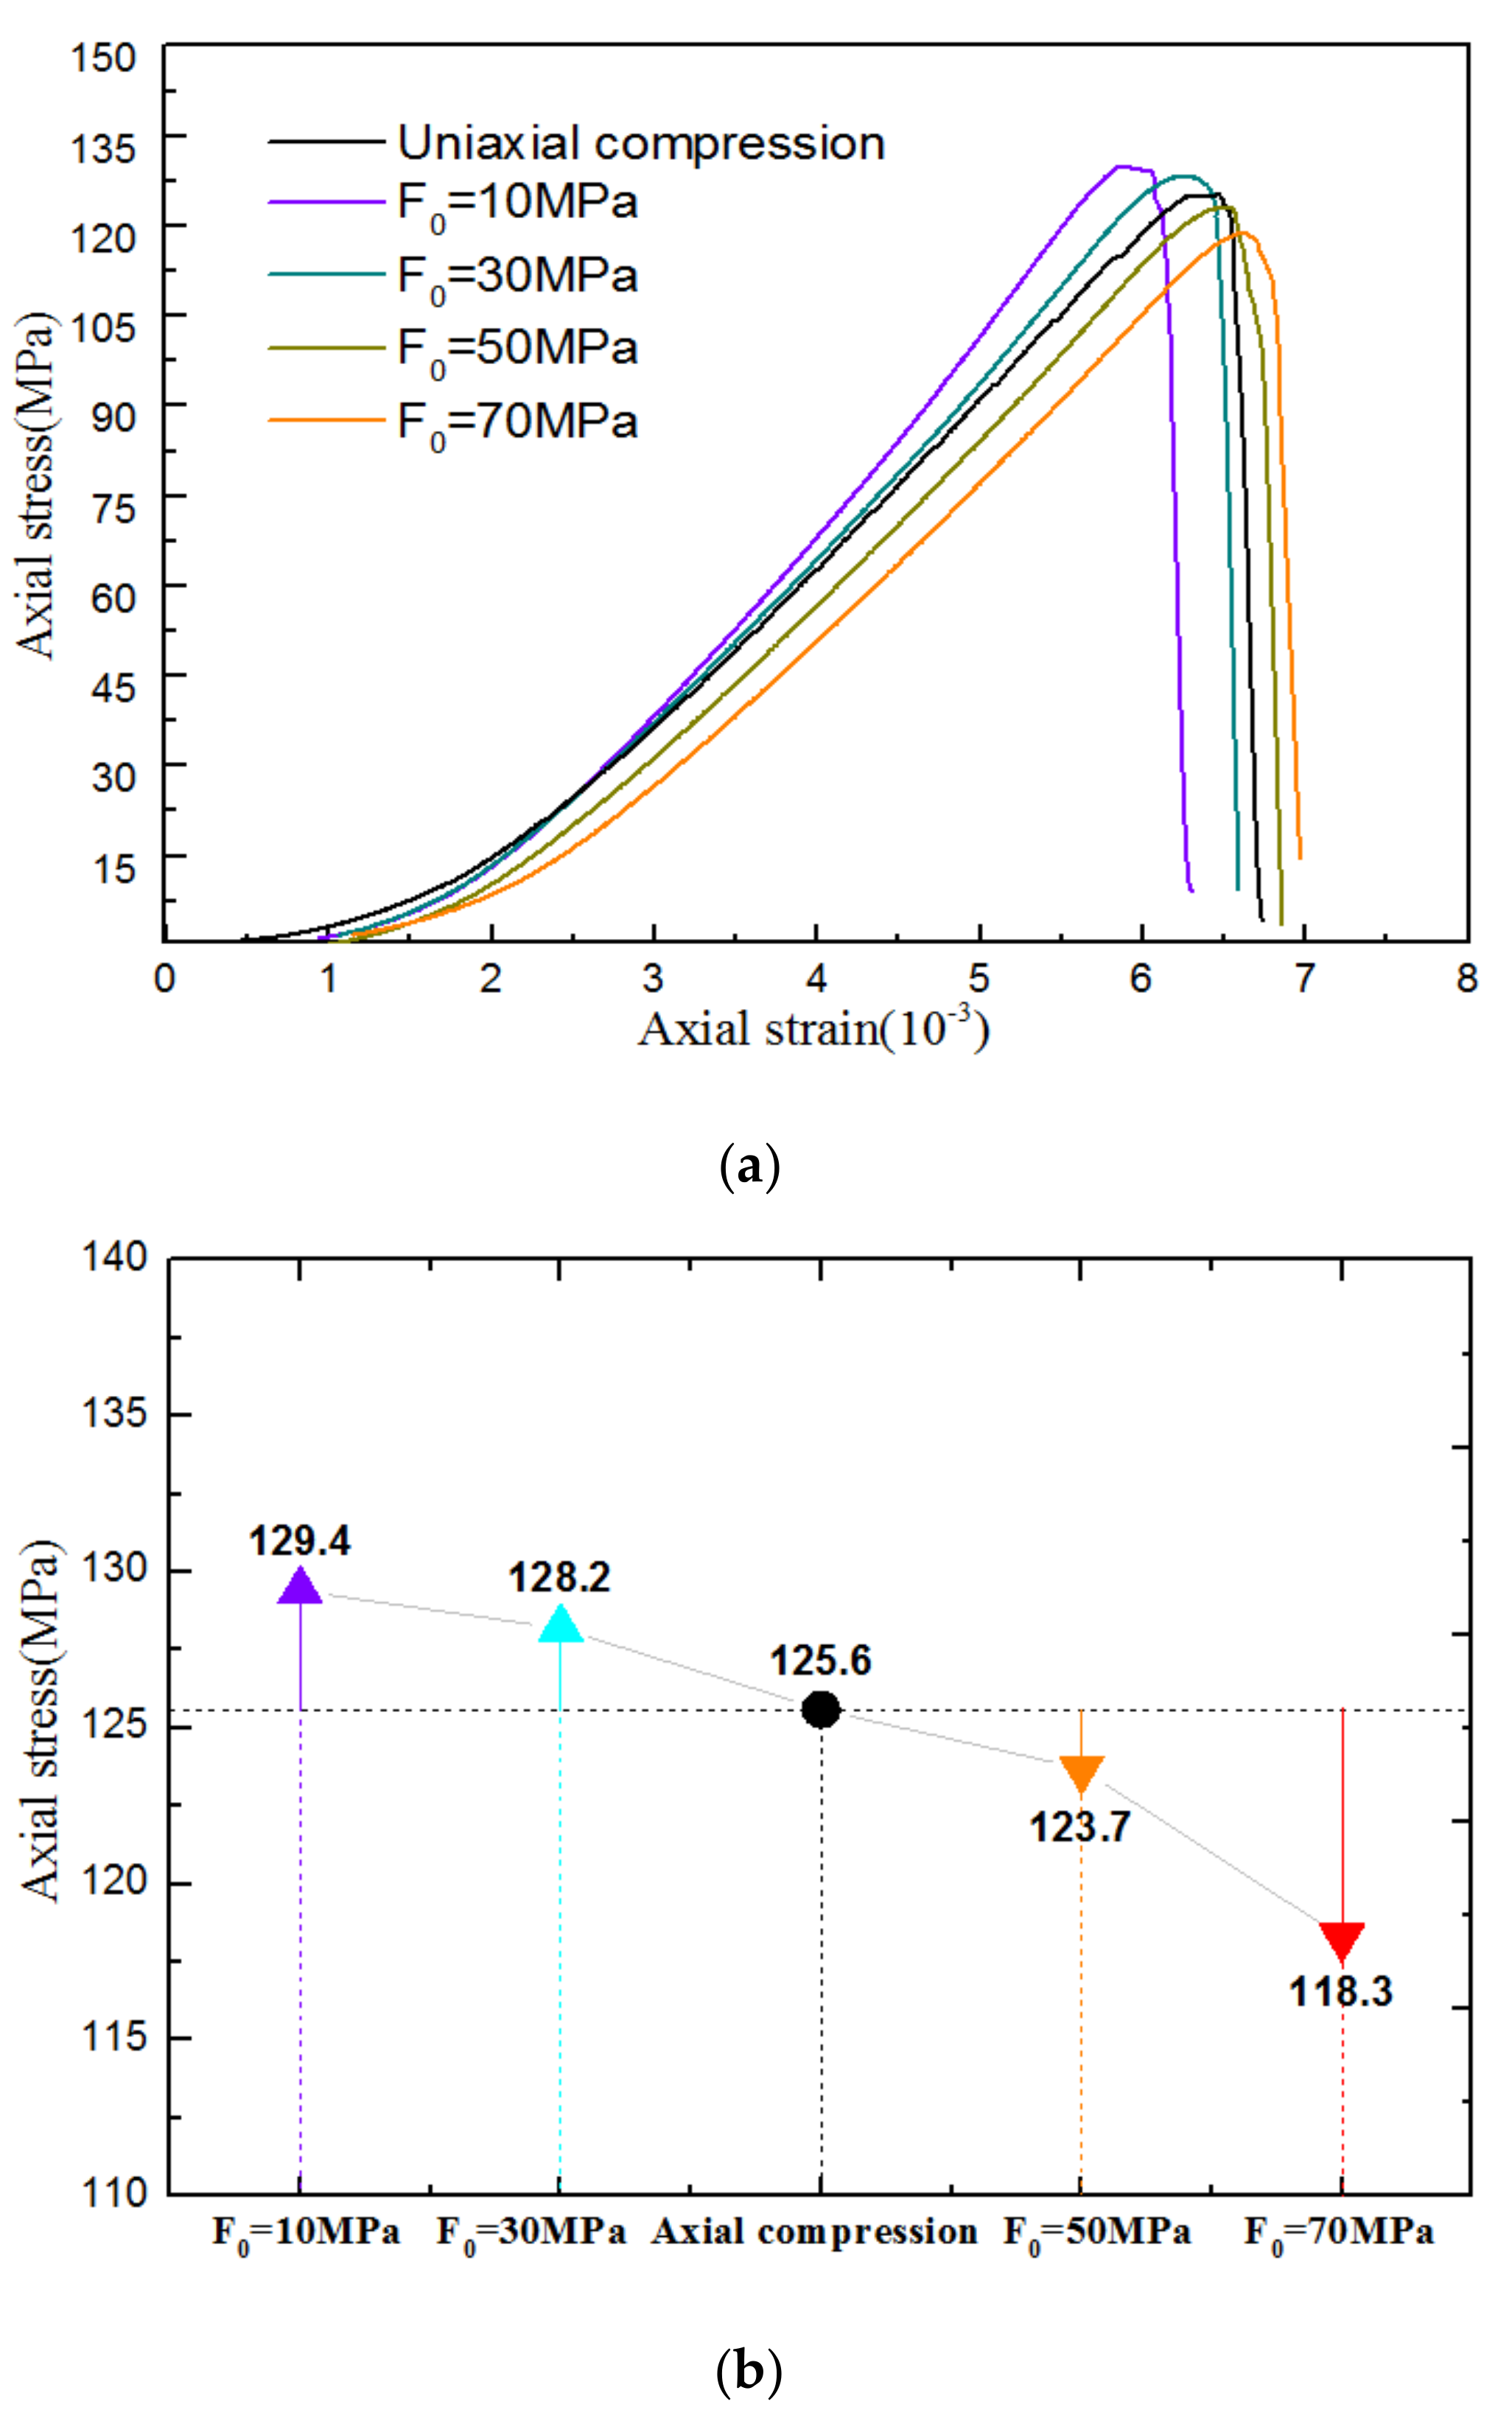
3.1. Deformation Behavior

The stress-strain relationship is an important index to characterize the physical and mechanical properties of rock materials, which not only helps establish the constitutive relationship, but can also determine the basic evaluation parameters for rock engineering stability [15,33,34,35,36]. The complete stress–strain curves of tested samples in different loading schemes are depicted in Figure 5a. It can be seen that the stress–strain curves of rock specimens for different stress paths have consistent variation trends. The loading curve does not overlap with the unloading curve and the reloading curve, resulting in a plastic hysteresis loop due to the irreversible strain. Figure 5b,c respectively show the variation of plastic hysteresis loop area under the same unloading stress with different initial cycle amplitude, taking the unloading stress levels of 70 and 110 MPa as examples.
It suggests that, with the increase of initial cycle amplitude, the area of plastic hysteresis loop varies with the same unloading stress level. That is to say, that the higher the initial cycle amplitude, the larger the hysteresis loop area.
The evolution curves between the volumetric strain and axial stress in different loading schemes are displayed in Figure 6. It can be observed that the four stress paths exhibited the similar change trend on the whole. The difference is that the degree of volume deformation varies under the same unloading level due to the damage of initial cycle amplitude. As the stress level gradually increases, the hysteresis curves gradually become wider and the width of the curves increases, so that the curves are distributed sparsely. Furthermore, the slope between the peak and the lowest point gradually increases, and even transits from positive to negative when approaching failure, especially for high initial cyclic amplitude (e.g., 50 and 70 MPa). This demonstrates that the development of the volumetric strain gradually changes from compaction to expansion. As can be observed, the rock volumetric strain curve under the lower initial cyclic amplitude is relatively dense in most cycles. In contrast, a sparse curve appears more rapidly under the higher initial cyclic amplitude. The curve of the final stress level demonstrates that the samples gradually transit from the compaction stage to the expansion state, especially under the condition of high initial cyclic amplitude, meaning that the increase of the initial cyclic amplitude intensifies the lateral strain of the rock, resulting in lateral dilation. This phenomenon is considered by Renani and Martin [37] to be the loss of rock cohesion.
Figure 7 shows the stress-strain curves from the unloading lowest point in the last cycle to the ultimate instability failure. Compared with the uniaxial compression test, each loading curve presents different slopes. It can be found that the slope of the lower initial cyclic amplitude (e.g., 10 and 30 MPa) is larger than that of uniaxial compression, whereas the slope of the higher initial cyclic amplitude (e.g., 50 and 70 MPa) is lower than that of uniaxial compression. It can be seen from Figure 7b that the peak strength of specimens increases under the low amplitude of initial cycle (e.g., 10 and 30 MPa), while the bearing capacity decreases under the high amplitude of initial cycle (e.g., 50 and 70 MPa). Generally, the stress threshold of rock crack initiation (σci) is considered to be approximately 30–50% of peak uniaxial load [38,39]. Therefore, the above phenomenon can be explained as follows: The high initial cyclic amplitude, exceeding the crack initiation threshold, causes irreversible deformation to the internal structure of rock specimens. The following cyclic loading and unloading process further aggravates the friction between the rock particles in the fractured parts and results in greater damage. Conversely, the low initial cycle amplitude makes the natural existing voids closure and compaction, raising the threshold of crack initiation. That is to say, in this study, the amplitude of initial cycle lower than the threshold of initiation damage strengthens the carrying capacity, and weakens it on the contrary.

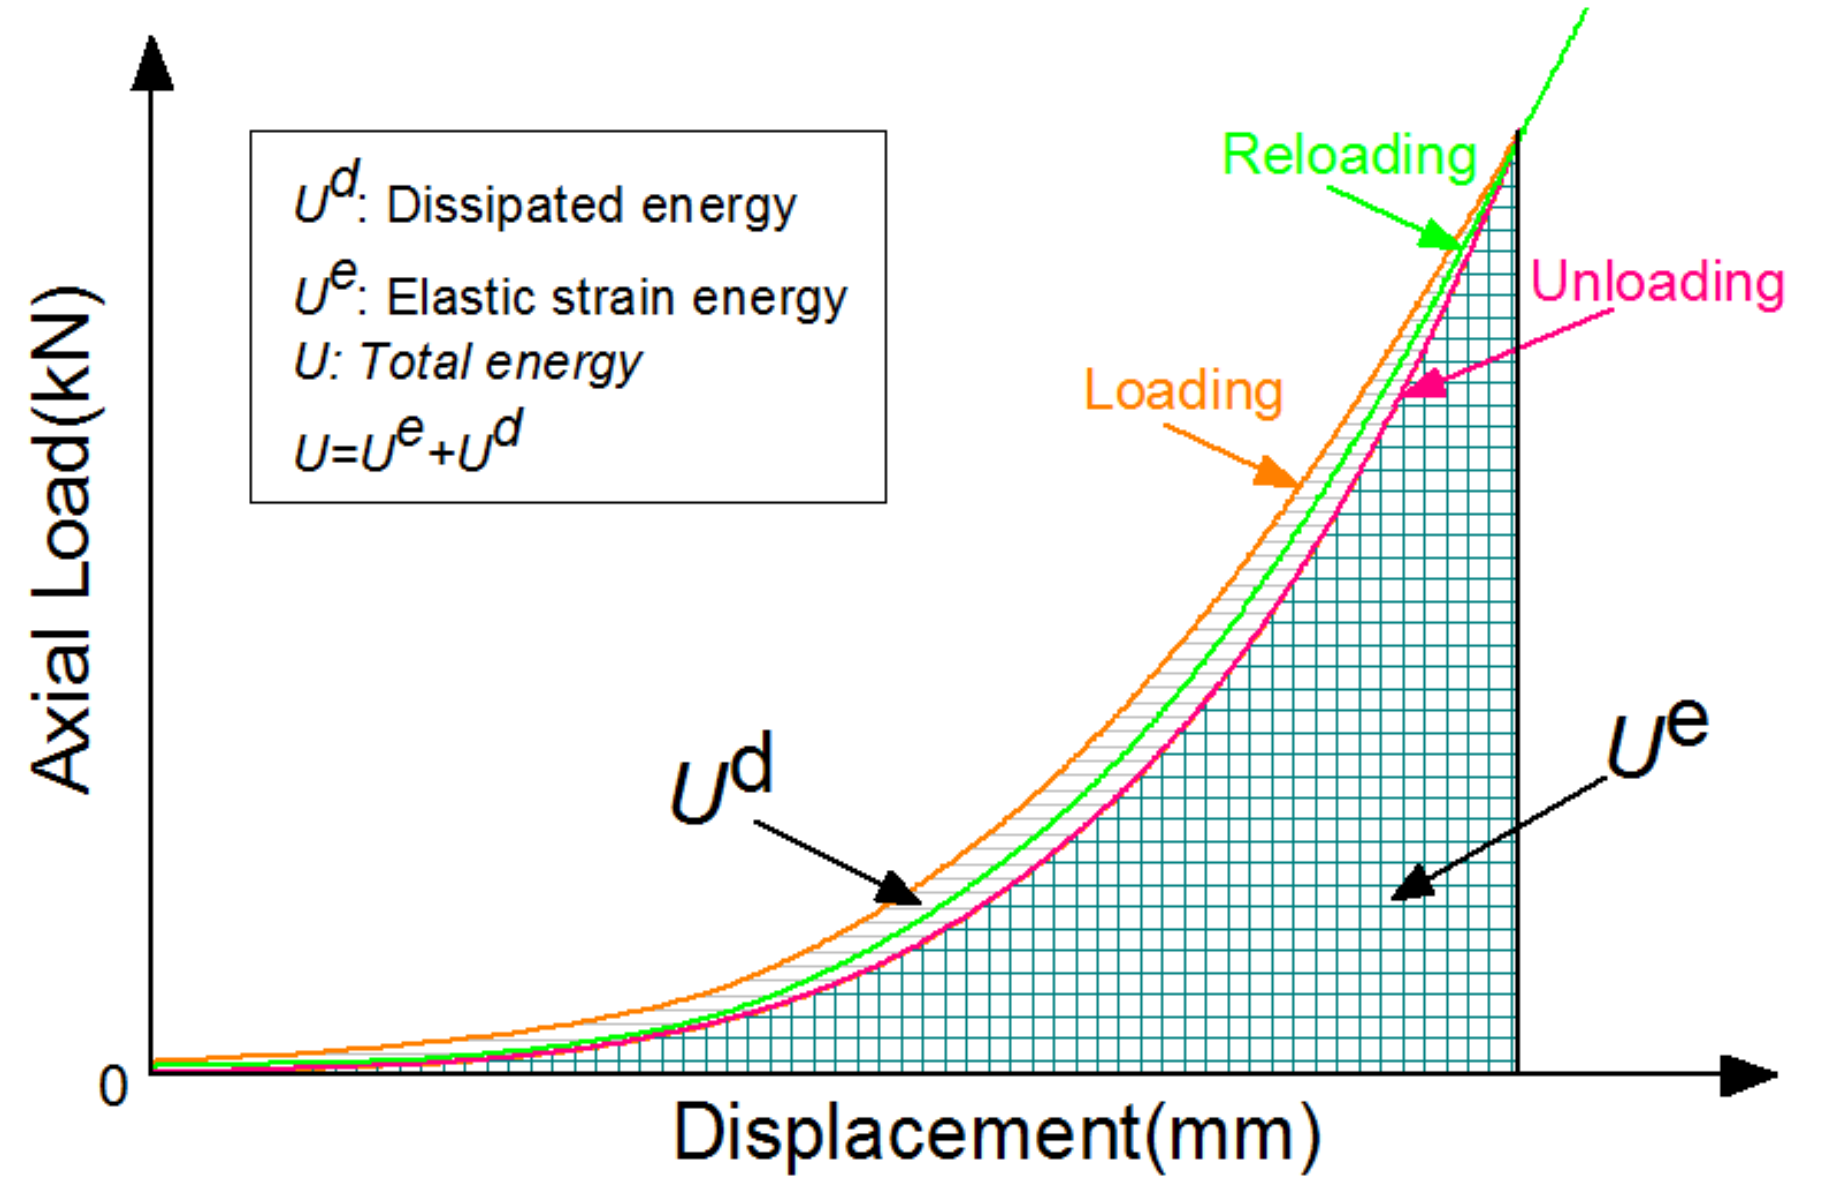
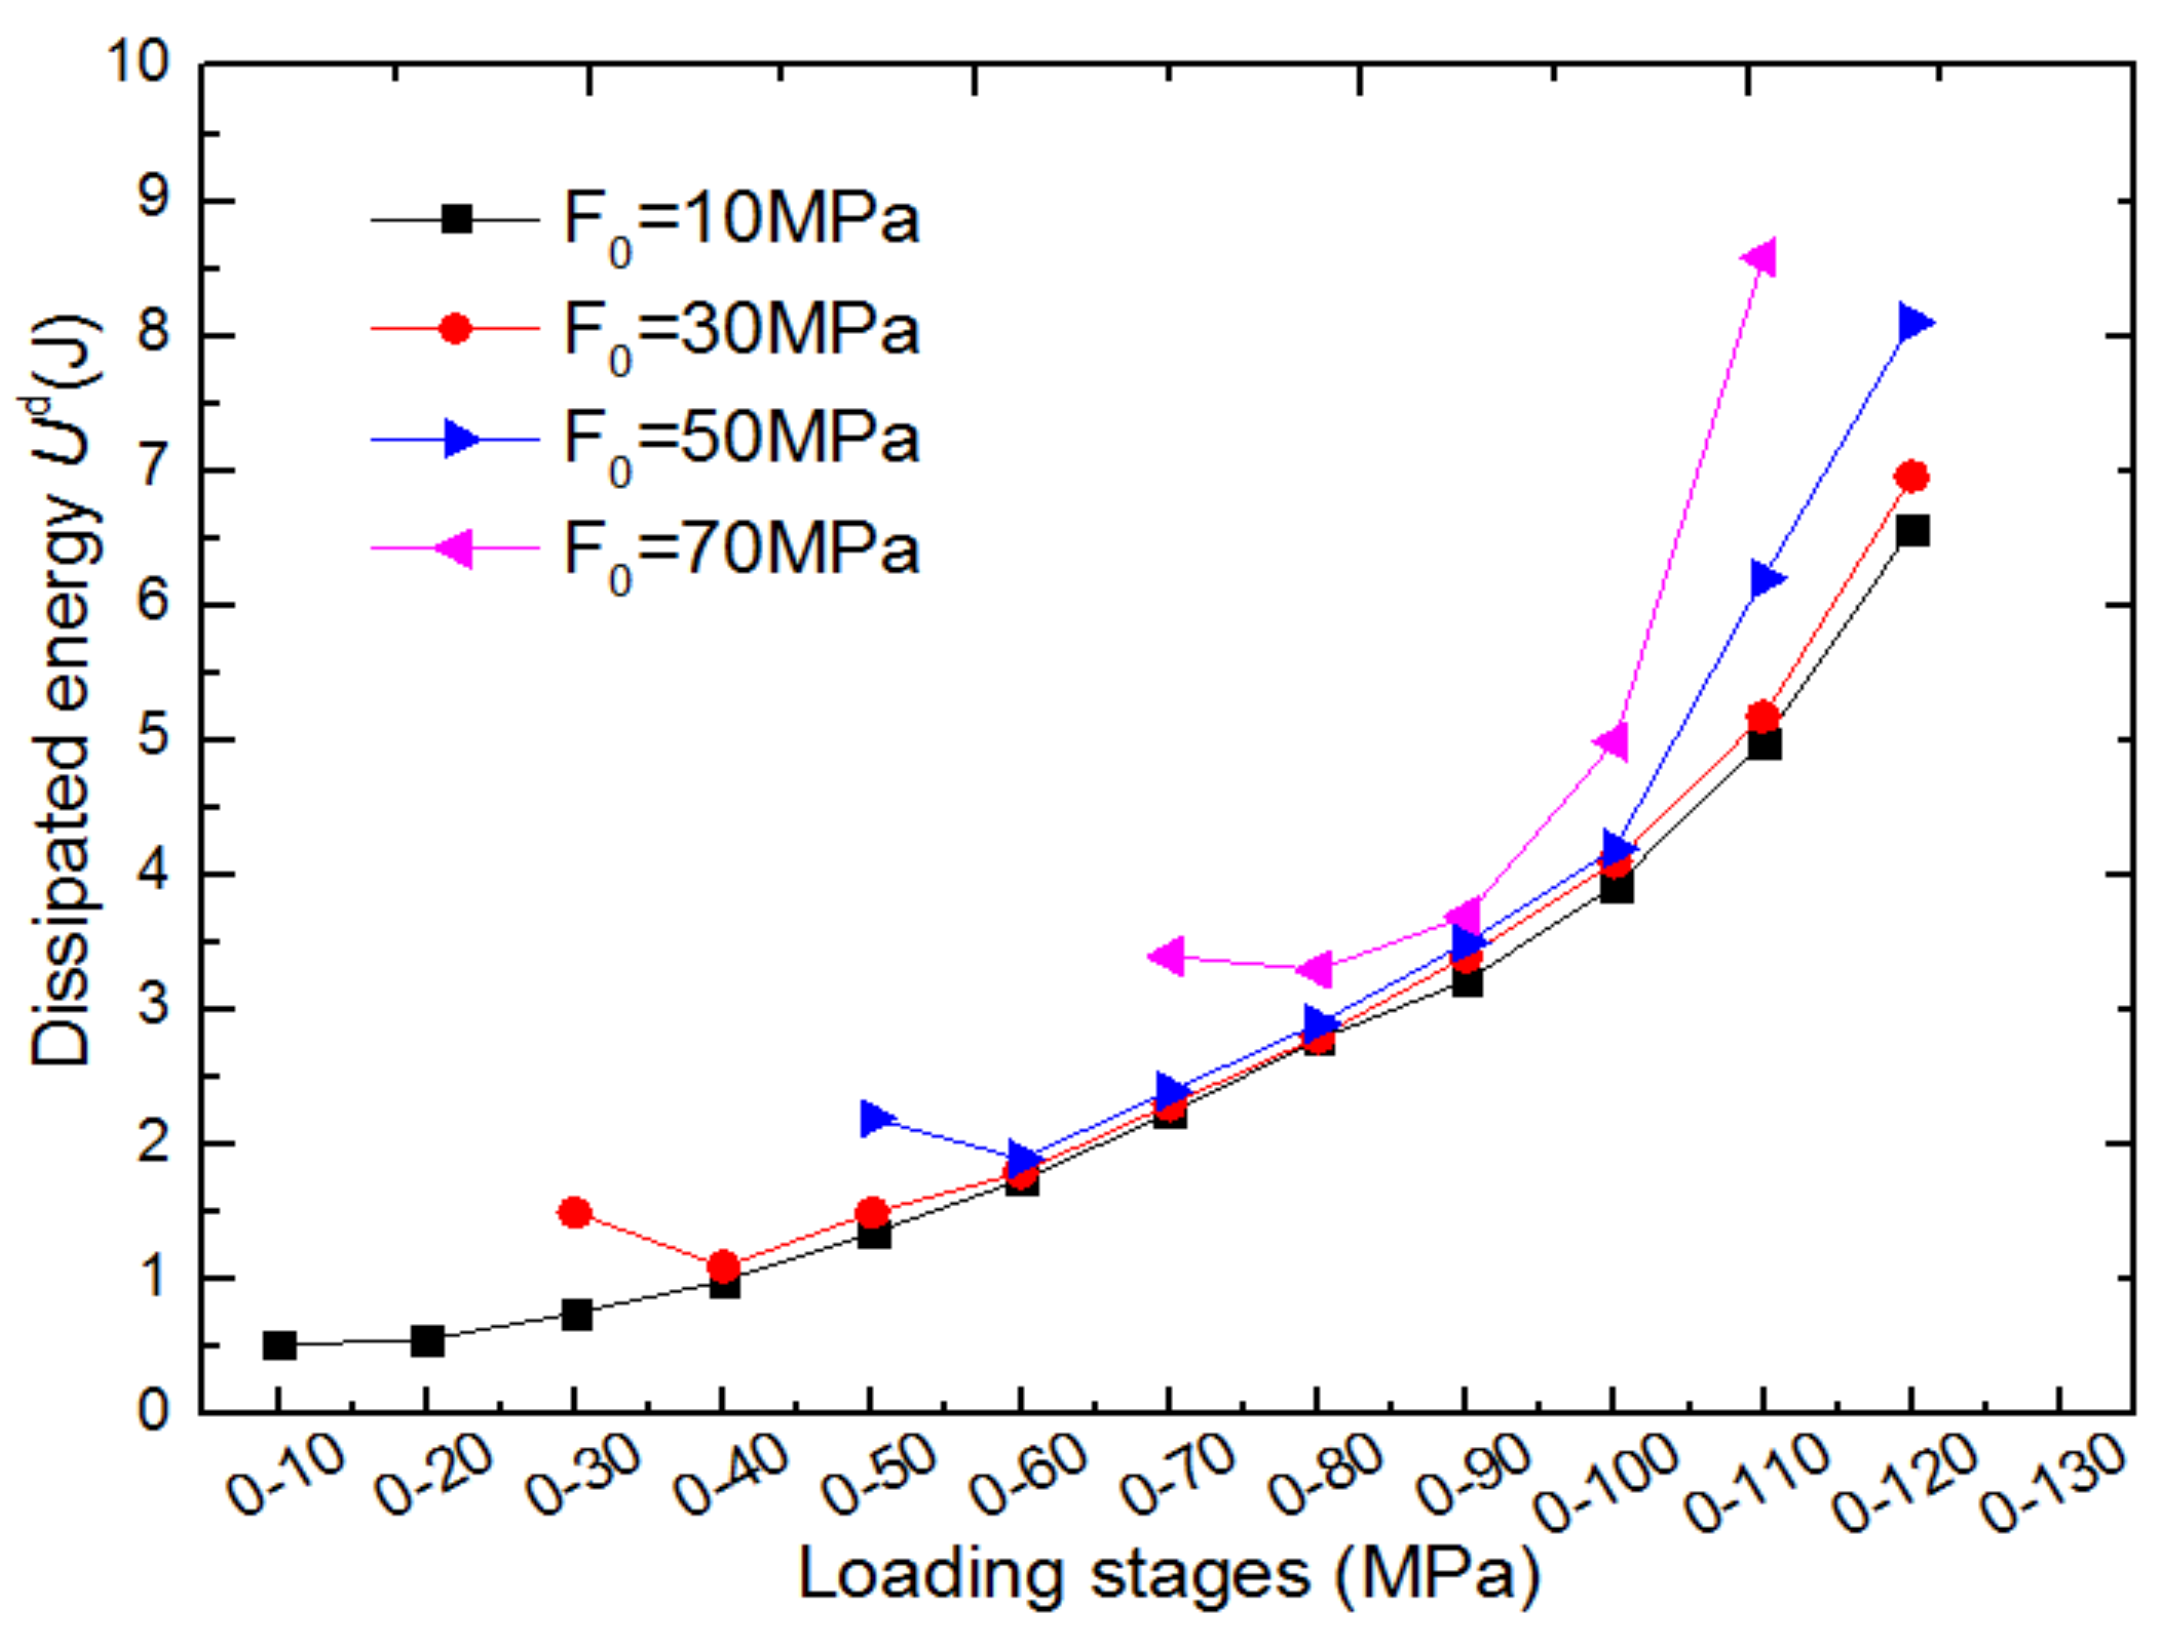
3.2. Energy Evolution

Previous studies suggest that the deformation and failure of rock materials are always accompanied by energy dissipation [40,41], which reflects that the irreversible damage inside the rock specimen occurs under external load, so the damage is closely related to the energy dissipation [20]. The area enclosed by the hysteresis loop presents the energy consumption ( U d ) in one loading–unloading cycle, as shown in Figure 8.
The dissipated energy of specimens under the same unloading stress with different initial cycle amplitude is shown in Figure 9. With the increase of cyclic number, the energy dissipation presents an exponential growth trend. The difference is that, under the same unloading stress, the higher the initial cycle amplitude, the greater the energy releases, especially the initial cycle amplitude higher than the threshold of crack initiation. More important, the last cycle before failure is more affected by the high amplitude of initial cycle and releases more energy. Therefore, it can be inferred that, under the same unloading stress level, the deterioration of rock induced by external load is mainly dominated by the amplitude of initial cycle, and the irreversible deformation of the rock caused by the amplitude of initial cycle beyond the threshold of crack initiation is more serious.

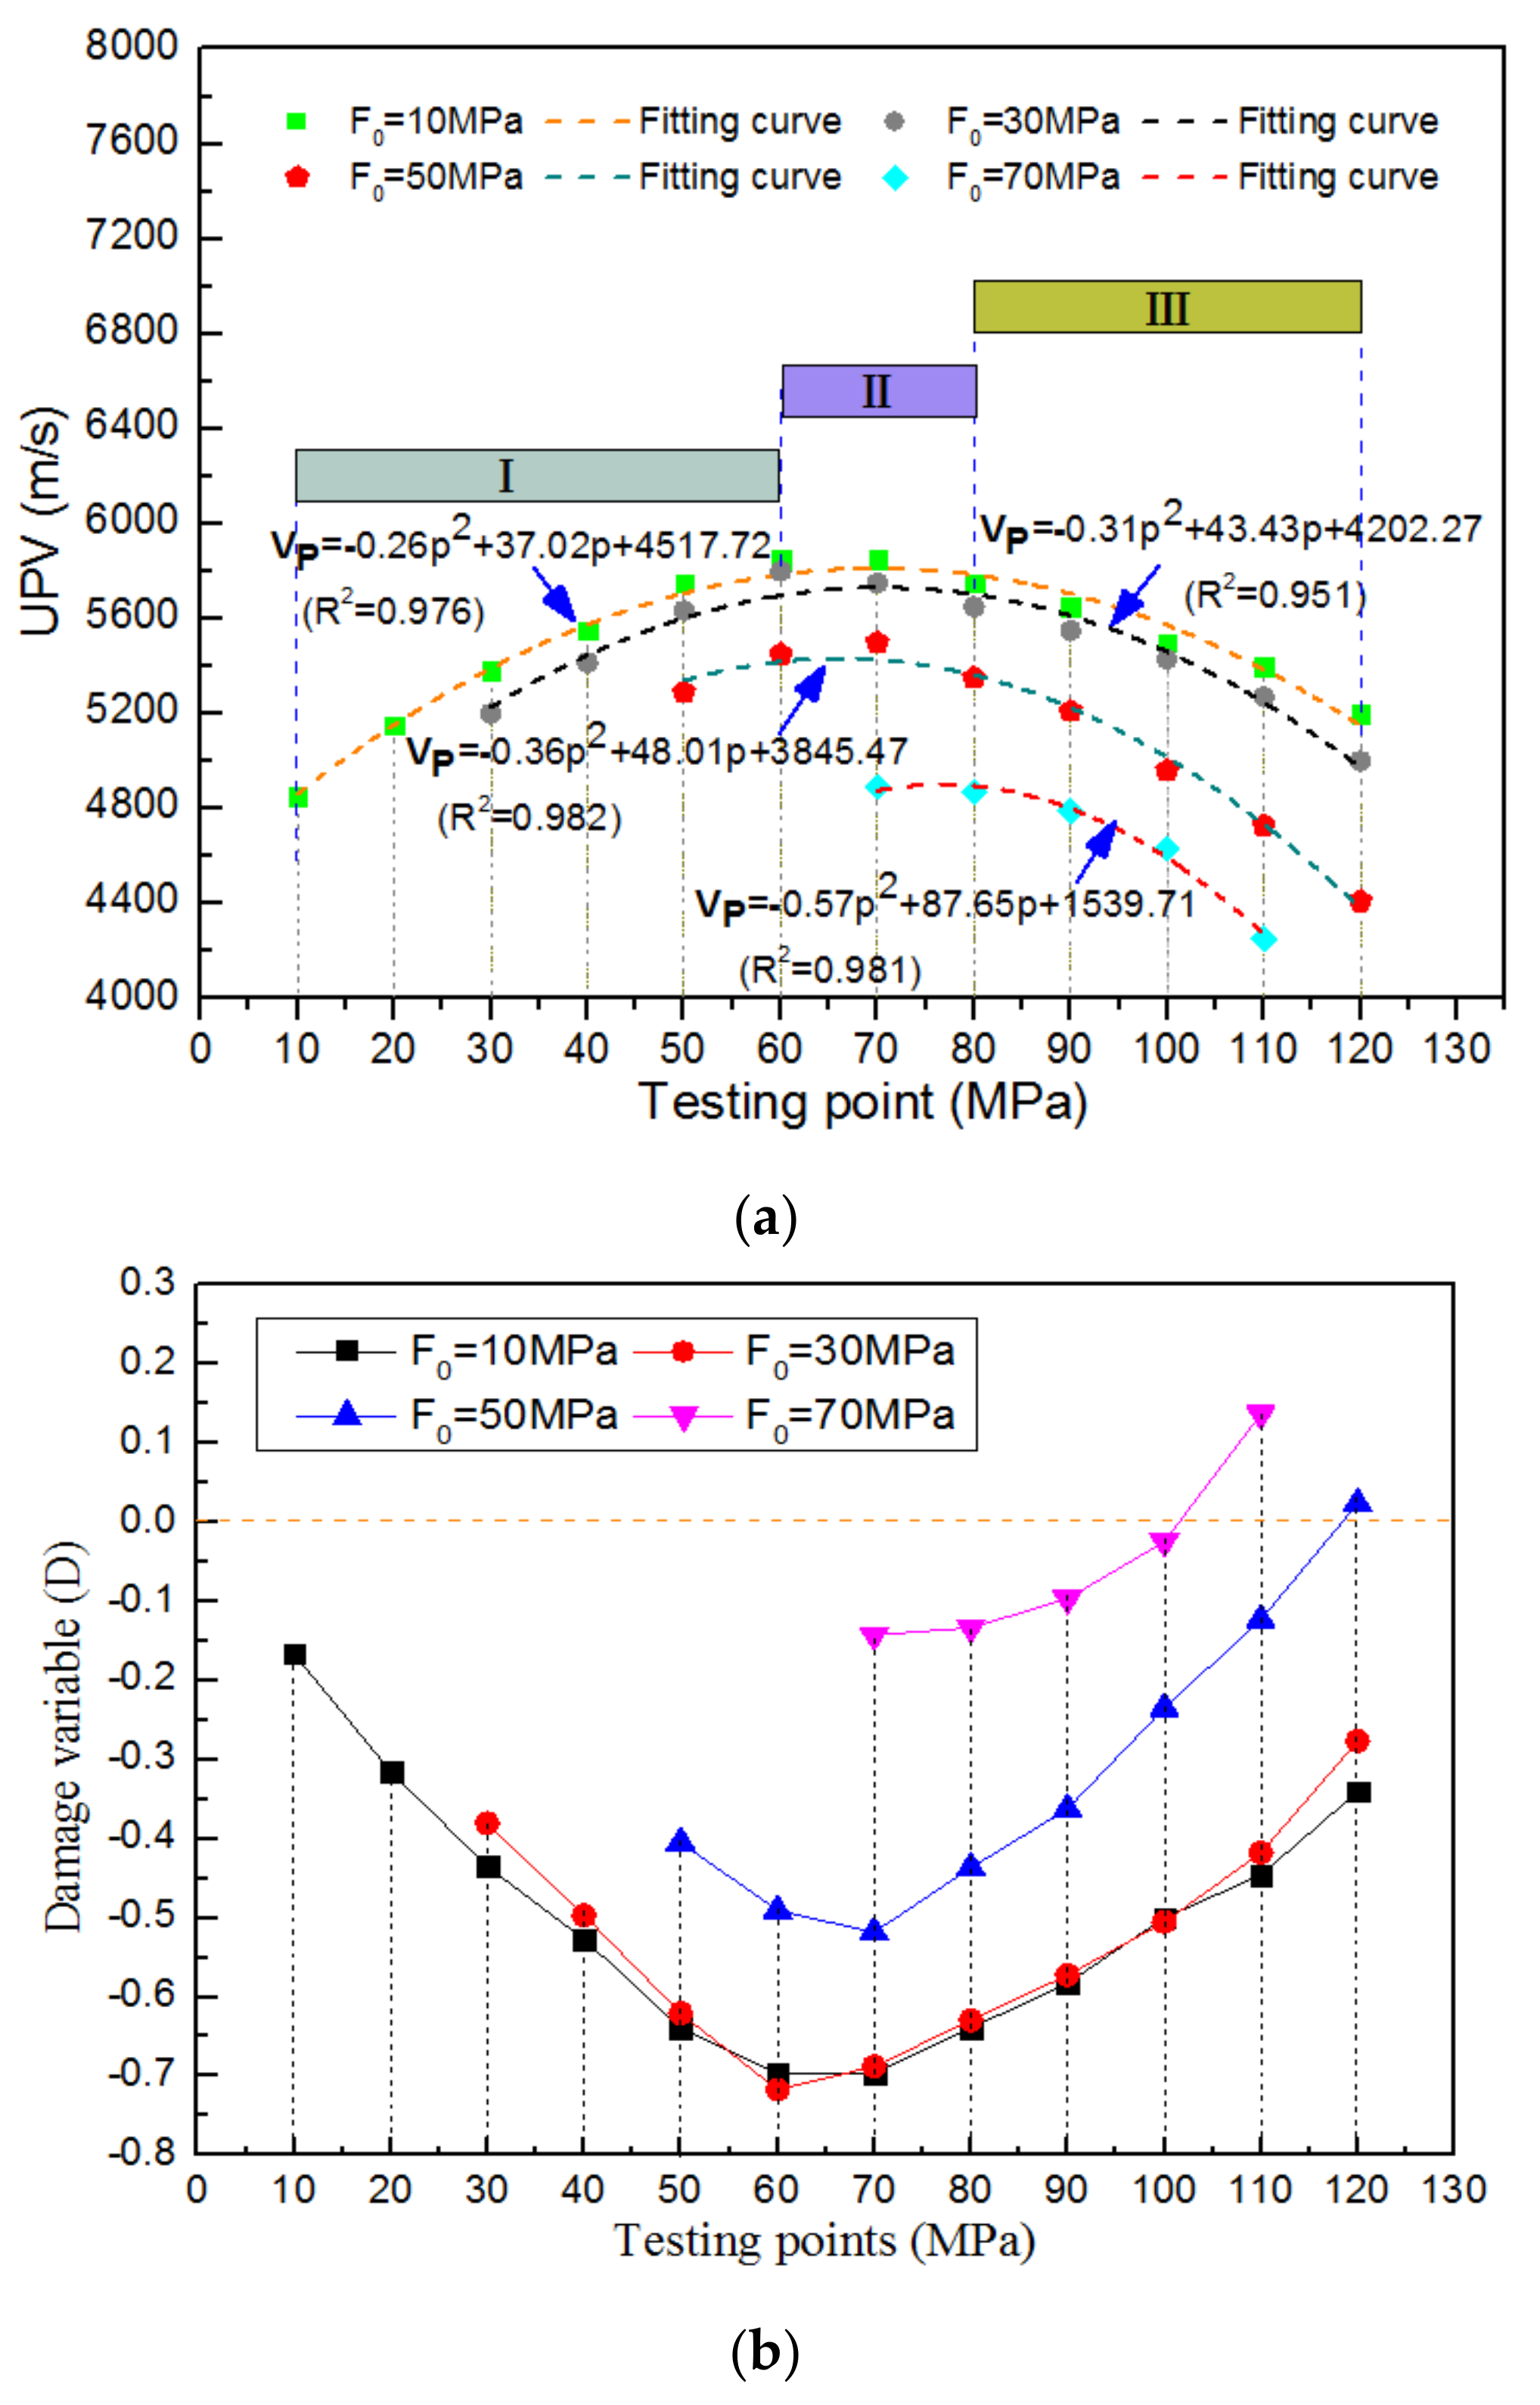
3.3. P-Wave Velocity

Ultrasonic P-wave velocity (UPV) technique is an effective nondestructive testing method to evaluate the inner damage state of rock [42,43,44]. Previous studies suggested that the variation of wave velocity depends on the damage extent of rocks [45,46]. In this paper, the P-wave velocity in the axial direction was monitored at the peak stress in each cycle. The variations of P-wave velocities at each stress-unloading point in each cycle are illustrated in Figure 10a.
The variation of P-wave velocity for each loading path shows a downward parabola trend. In other words, the P-wave velocity changes during the whole loading process can be divided into three phases, i.e., it increases rapidly first, then increases slowly or remains unchanged, and finally decreases rapidly. Combining the mechanical properties and ultrasonic-wave data, it can be found that the above change of the P-wave velocity during cyclic loading can be explained by the typical three phases of damage evolution. In the UPV rise phase (I), the applied load enables the pre-existing voids to close, which causes the volume of tested samples to shrink and UPVs to increase. In the crack initiation phase (II), new micro-cracks gradually generate, and UPVs stop growing or fluctuate slightly. Then, from the middle moment of the second phase, P-wave velocity decreases slowly due to the formation of micro-cracks. Finally, at the beginning of the last phase (III), a rapid decrease of UPV is observed, which is mainly related to accelerated deformation and surface macro-crack formation.
Notably, UPVs of tested samples undergoing different loads of initial cycle show obvious differences under the same unloading stress, especially at higher initial cycle stress beyond the threshold of crack initiation. According to previous studies [18], the damage variable was defined with P-wave velocity as D = 1 V T 2 / V 0 2 , where V T 2 and V 0 2 are the testing velocity of damaged material after loading and the origin wave velocity of undamaged material, respectively. The damage evolution curve of the P-wave velocity shown in Figure 10b can further prove the above conclusions. In particular, UPVs with the 70 MPa amplitude of initial cycle are significantly lower than that of other amplitudes. These results imply that, with the increase of initial cycle amplitude, the plastic deformation of marble specimens gradually intensifies and UPVs decrease.

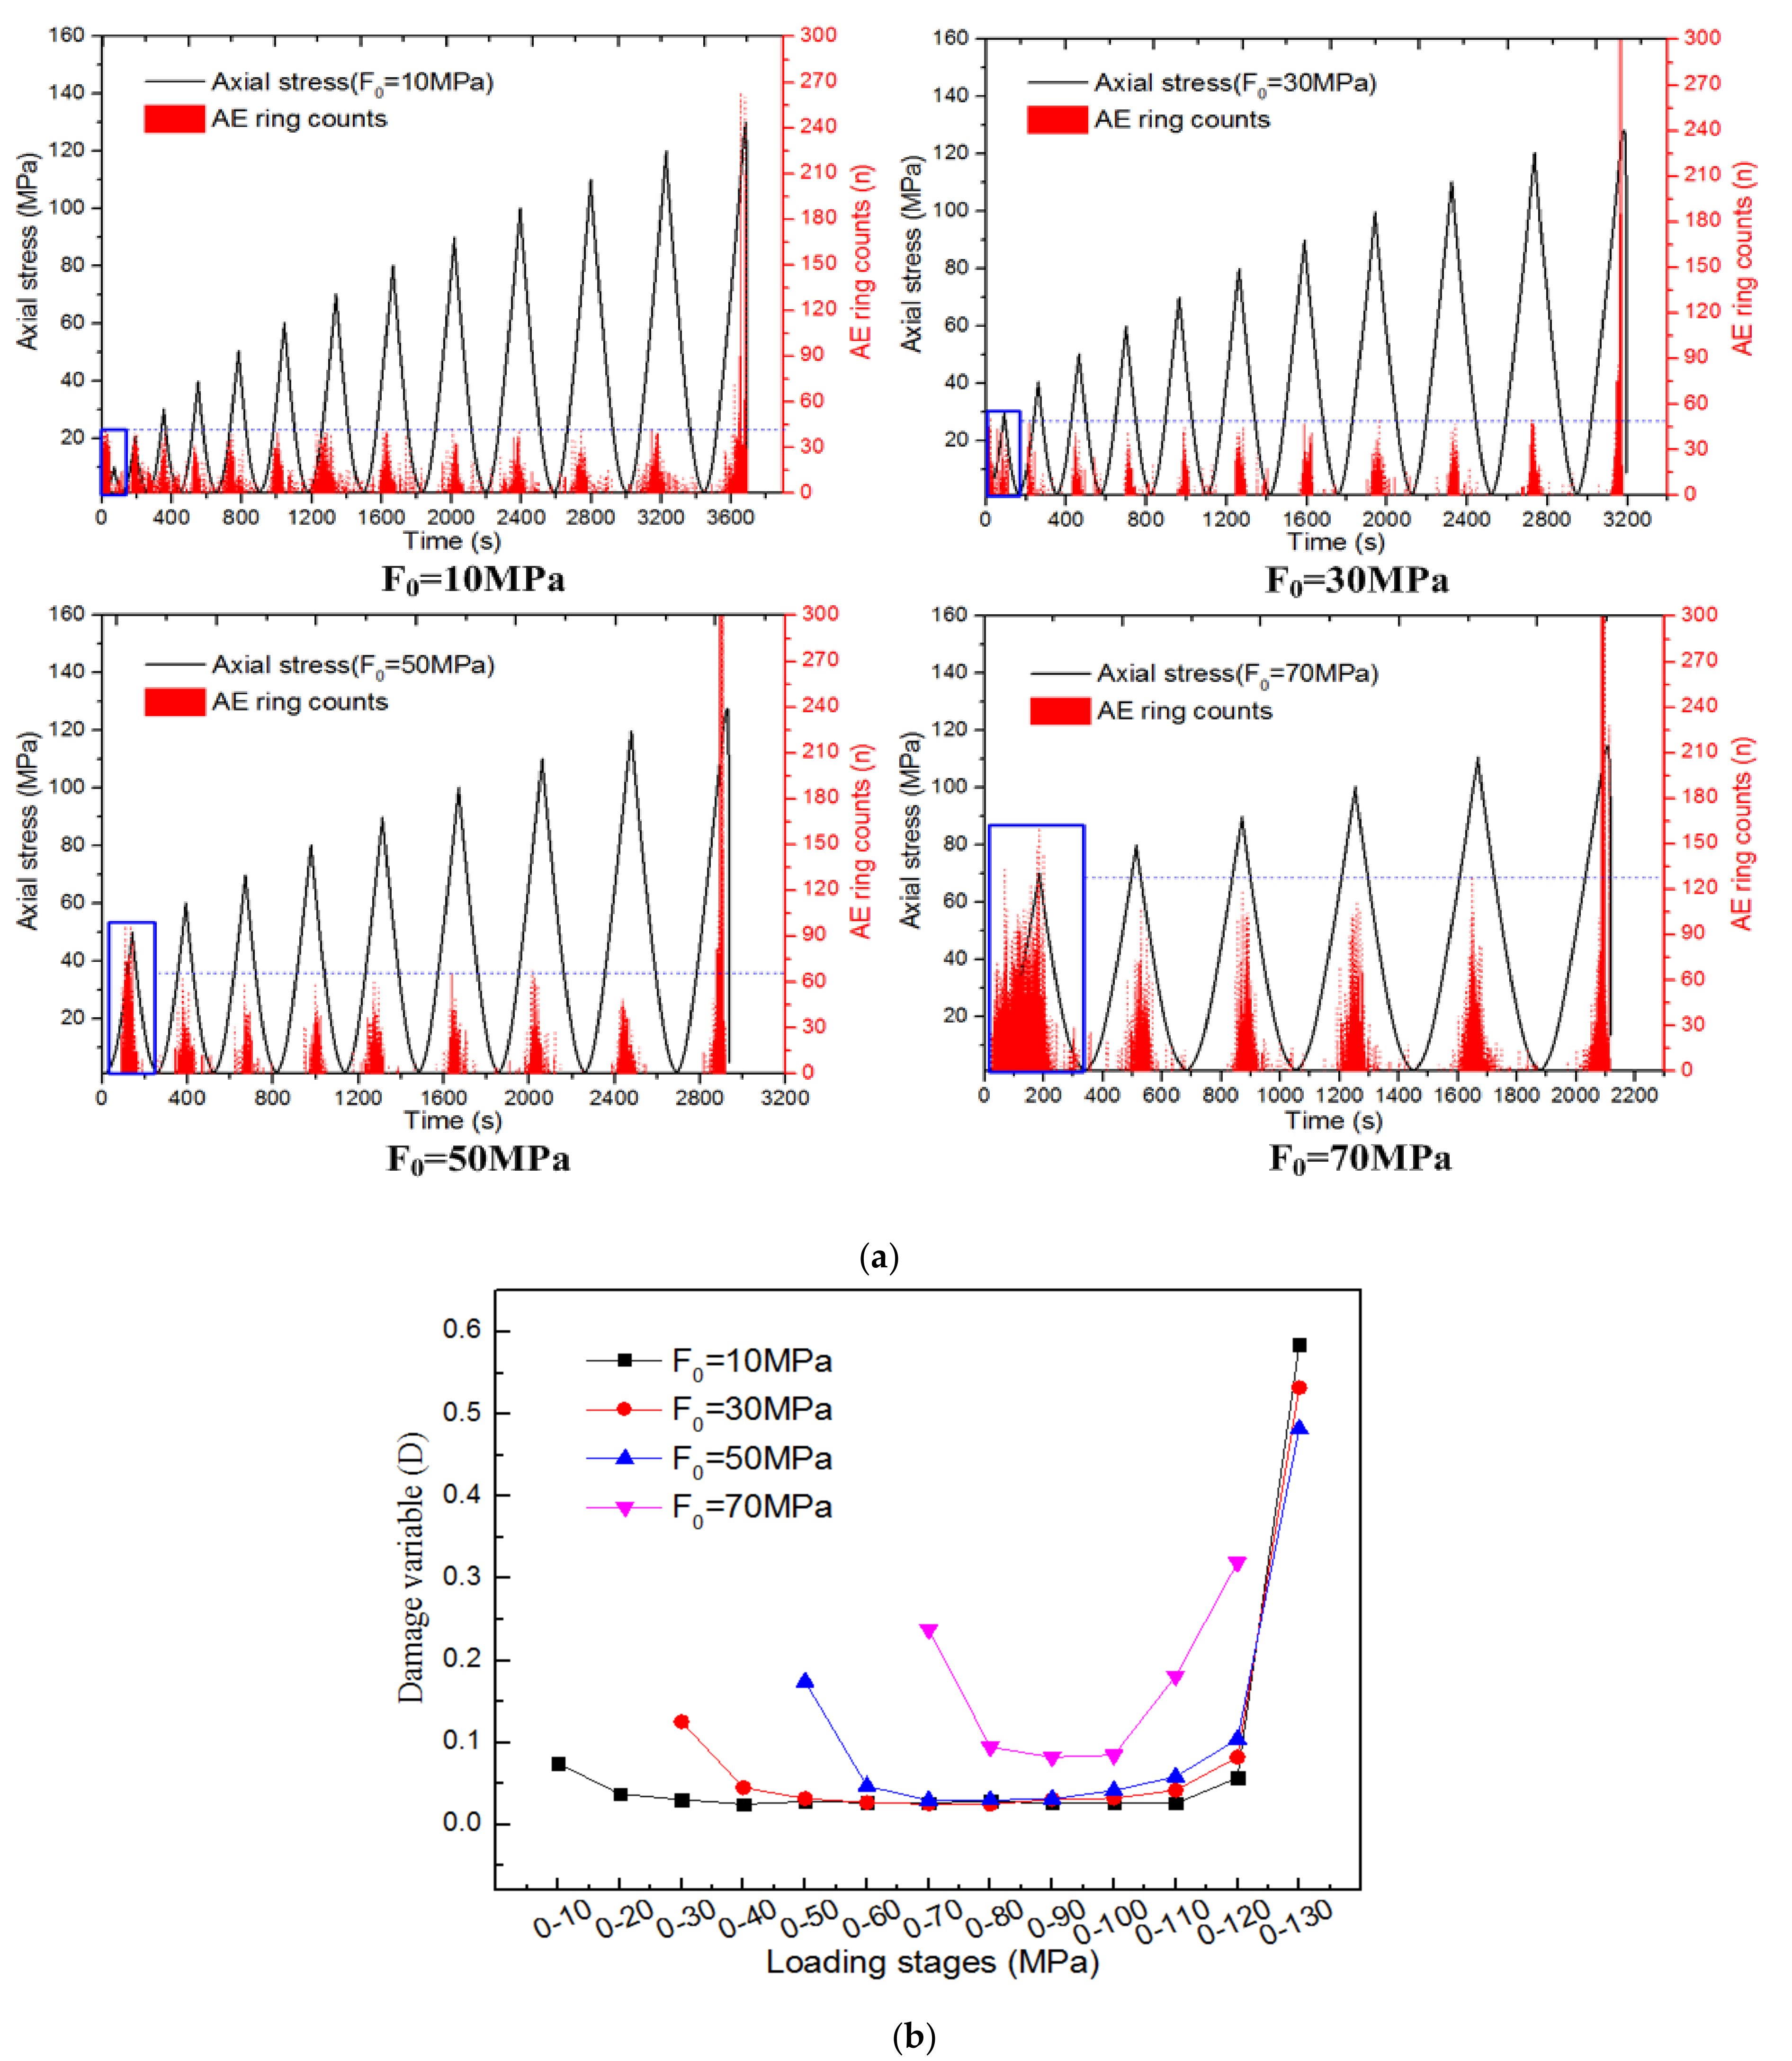
3.4. AE Characteristics

Acoustic emission (AE) is defined as the elastic energy released from materials undergoing deformation, which is a useful method for the investigation of local damage in rocks [47,48]. The micro-crack evolution of rocks was often characterized by AE ring counts (or ring-down counts) [34,49,50,51,52]. In this section, the ring counts evolution with stress is shown in Figure 11. It can be found that AE activities occur in the entire cyclic loading—unloading process under different loading paths. However, with various peak stresses in the first cycle, rock samples with a similar structure exhibit significantly different AE activities under cyclic loading. For the low amplitude of initial cycle (e.g., 10 and 30 MPa), except for the last cycle, a small amount of acoustic emission is mainly released in the loading stage during the whole process. With the increase of initial cycle amplitude, the number of AE rings obviously increases. The high-stress amplitudes in the first cycle (e.g., 70 MPa) especially result in a large number of AE events, indicating that the higher amplitude of initial cycle causes more and more serious damage to rock specimens. The maximum value of AE ringing counts during each loading phase usually appears near the unloading point. There are two main reasons for this phenomenon. On the one hand, the pre-existing voids, defects, and micro-cracks in rocks are compacted, which is a common situation. On the other hand, the applied stress in the first cycle exceeds the threshold of crack initiation, and new micro-cracks emerge and release more AE events. In the following cyclic loading phase, the damage was further aggravated. At the final peak load, AE activities increase sharply to the maximum value, and then gradually disappear during the post-peak stage.
Damage variables defined based on the percentage of AE ringing counts [18] in the whole process at each loading stage are shown in Figure 11b. The damage evolution process of the tested specimen shows that serious damage mainly occurs in the beginning loading stage and the end stage, especially the initial damage caused by the various peak stresses in the first cycle is different. In the remaining cycle loading stage, constant slight damage is generated due to repeated loading, which means that aftershocks can cause certain damage to the post-mainshock damaged rocks and continue to accumulate.

3.5. Failure Morphology

To explore the influence of initial cycle amplitude on the failure morphologies, the final failure patterns of tested samples were observed in Figure 12. It can be found that the failure modes vary with different initial cycle amplitudes. When the initial stress equals to 10 MPa, there is a main tensile crack along the axial loading direction, indicating the failure of the specimen is characterized by the tension splitting. With the increase of initial cycle amplitude, the number of cracks on the rock surface gradually increases and forms an inclining angle with the loading direction, presenting a combination of tension failure crossing the rock matrix and shear sliding with local stress concentration. In particular, under the high amplitude of initial cycle (e.g., 50 and 70 MPa), the number of surface cracks is significantly more than that of other low amplitudes (e.g., 10 and 30 MPa), and shear sliding failure is more prone to occur. Meanwhile, this observation shows that the crushing zones mainly appear in the middle of the specimen, meaning that stress concentration area forms in the middle of the specimen.
According to many researchers [53,54,55,56,57], the relationship between RA value (RA = rise time/amplitude) and average frequency (AF) (AF = counts/duration time) can be used to classify the tensile and shear crack. The tensile crack is considered to be an AE signal with higher AF and lower RA. On the contrary, the shear crack is a signal with lower AF and higher RA, as shown in Figure 13. In this study, the relationship between the RA and AF values of marble specimens under different loading paths is shown in Figure 14. It can be observed that, under the 10 MPa amplitude of initial cycle, the RA value is low and the AF value is fairly high. The clusters are mainly concentrated in the tensile region, which indicates that the tensile fracture dominates its failure. As the amplitude of initial cycle increases, the clusters gradually move toward the shear area. When the amplitude of initial cycle exceeds the threshold of crack initiation, both tensile crack and shear crack exist, that is, the failure patterns gradually change from tension failure mode to the mixture of tension and shear, which is consistent with the observed final failure state in Figure 12.
Additionally, fragments of different particle sizes were weighed by electronic scale, as listed in Table 2. The fragment-size distribution by weight was statistically depicted in Figure 15. The broken fragments were sieved by five sieves with different mesh sizes (i.e., 0.63, 1.25, 2.5, 5, and 10 mm). It can be found that, although large blocks are the majority, the mass of micro-sized fragments (<2.5 mm) increases with the increase of initial cycle amplitude, especially the particle size below 0.63 mm, which demonstrates that the higher the initial cycle amplitude, the greater the damage degree inside the rock, and the more smaller fragments are produced.
The b-value, one of the most important AE parameters, originates from the frequency–magnitude distribution data by means of Gutenberg—Richter relationship [59,60,61,62,63] and represents the micro fracture size when the material is damaged. The larger the b-value is, the smaller the fracture size is. In this work, consecutive sliding windows of 100 AE events in each loading stage were used to calculate the b-value. Figure 16 shows the curve of b-value and stress over time. For four loading paths, the overall variations of b-value show a trend of “firstly increasing, remaining unchanged or fluctuating in the middle and finally decreasing”, which is consistent with three typical processes of pore compaction in the early stage, elastic compression in the middle stage, and damage fracture in the later stage. It can be seen that, under the same unloading stress, the higher the initial cycle amplitude, the lower the b-value; the first loading and approaching failure are the most obvious, which is a good explanation for the fragment-size distribution by weight after rock fracture in Figure 15.

4. Conclusions

In this paper, a series of uniaxial cyclic compression tests with different peak stresses in the first cycle were carried out on marble rocks. The fatigue damage evolution and failure mechanism of the post-mainshock damaged rocks under aftershock effects were investigated. The following conclusions are drawn:
  • Owing to the increase of initial cycle amplitude, the irreversible deformation and dissipated energy increased. The bearing capacity increases under the low amplitude of initial cycle (e.g., 10 and 30 MPa) below the threshold of crack initiation, whereas it decreases under the high amplitude of initial cycle (e.g., 50 and 70 MPa).
  • The variation of P-wave velocity shows a downward parabola trend for each loading scheme. The damage evolution of P-wave velocity shows that various initial cyclic amplitudes make it have different damage responses. UPVs with the higher initial cycle amplitude (e.g., 50 and 70 MPa) are significantly lower than that of other initial amplitudes.
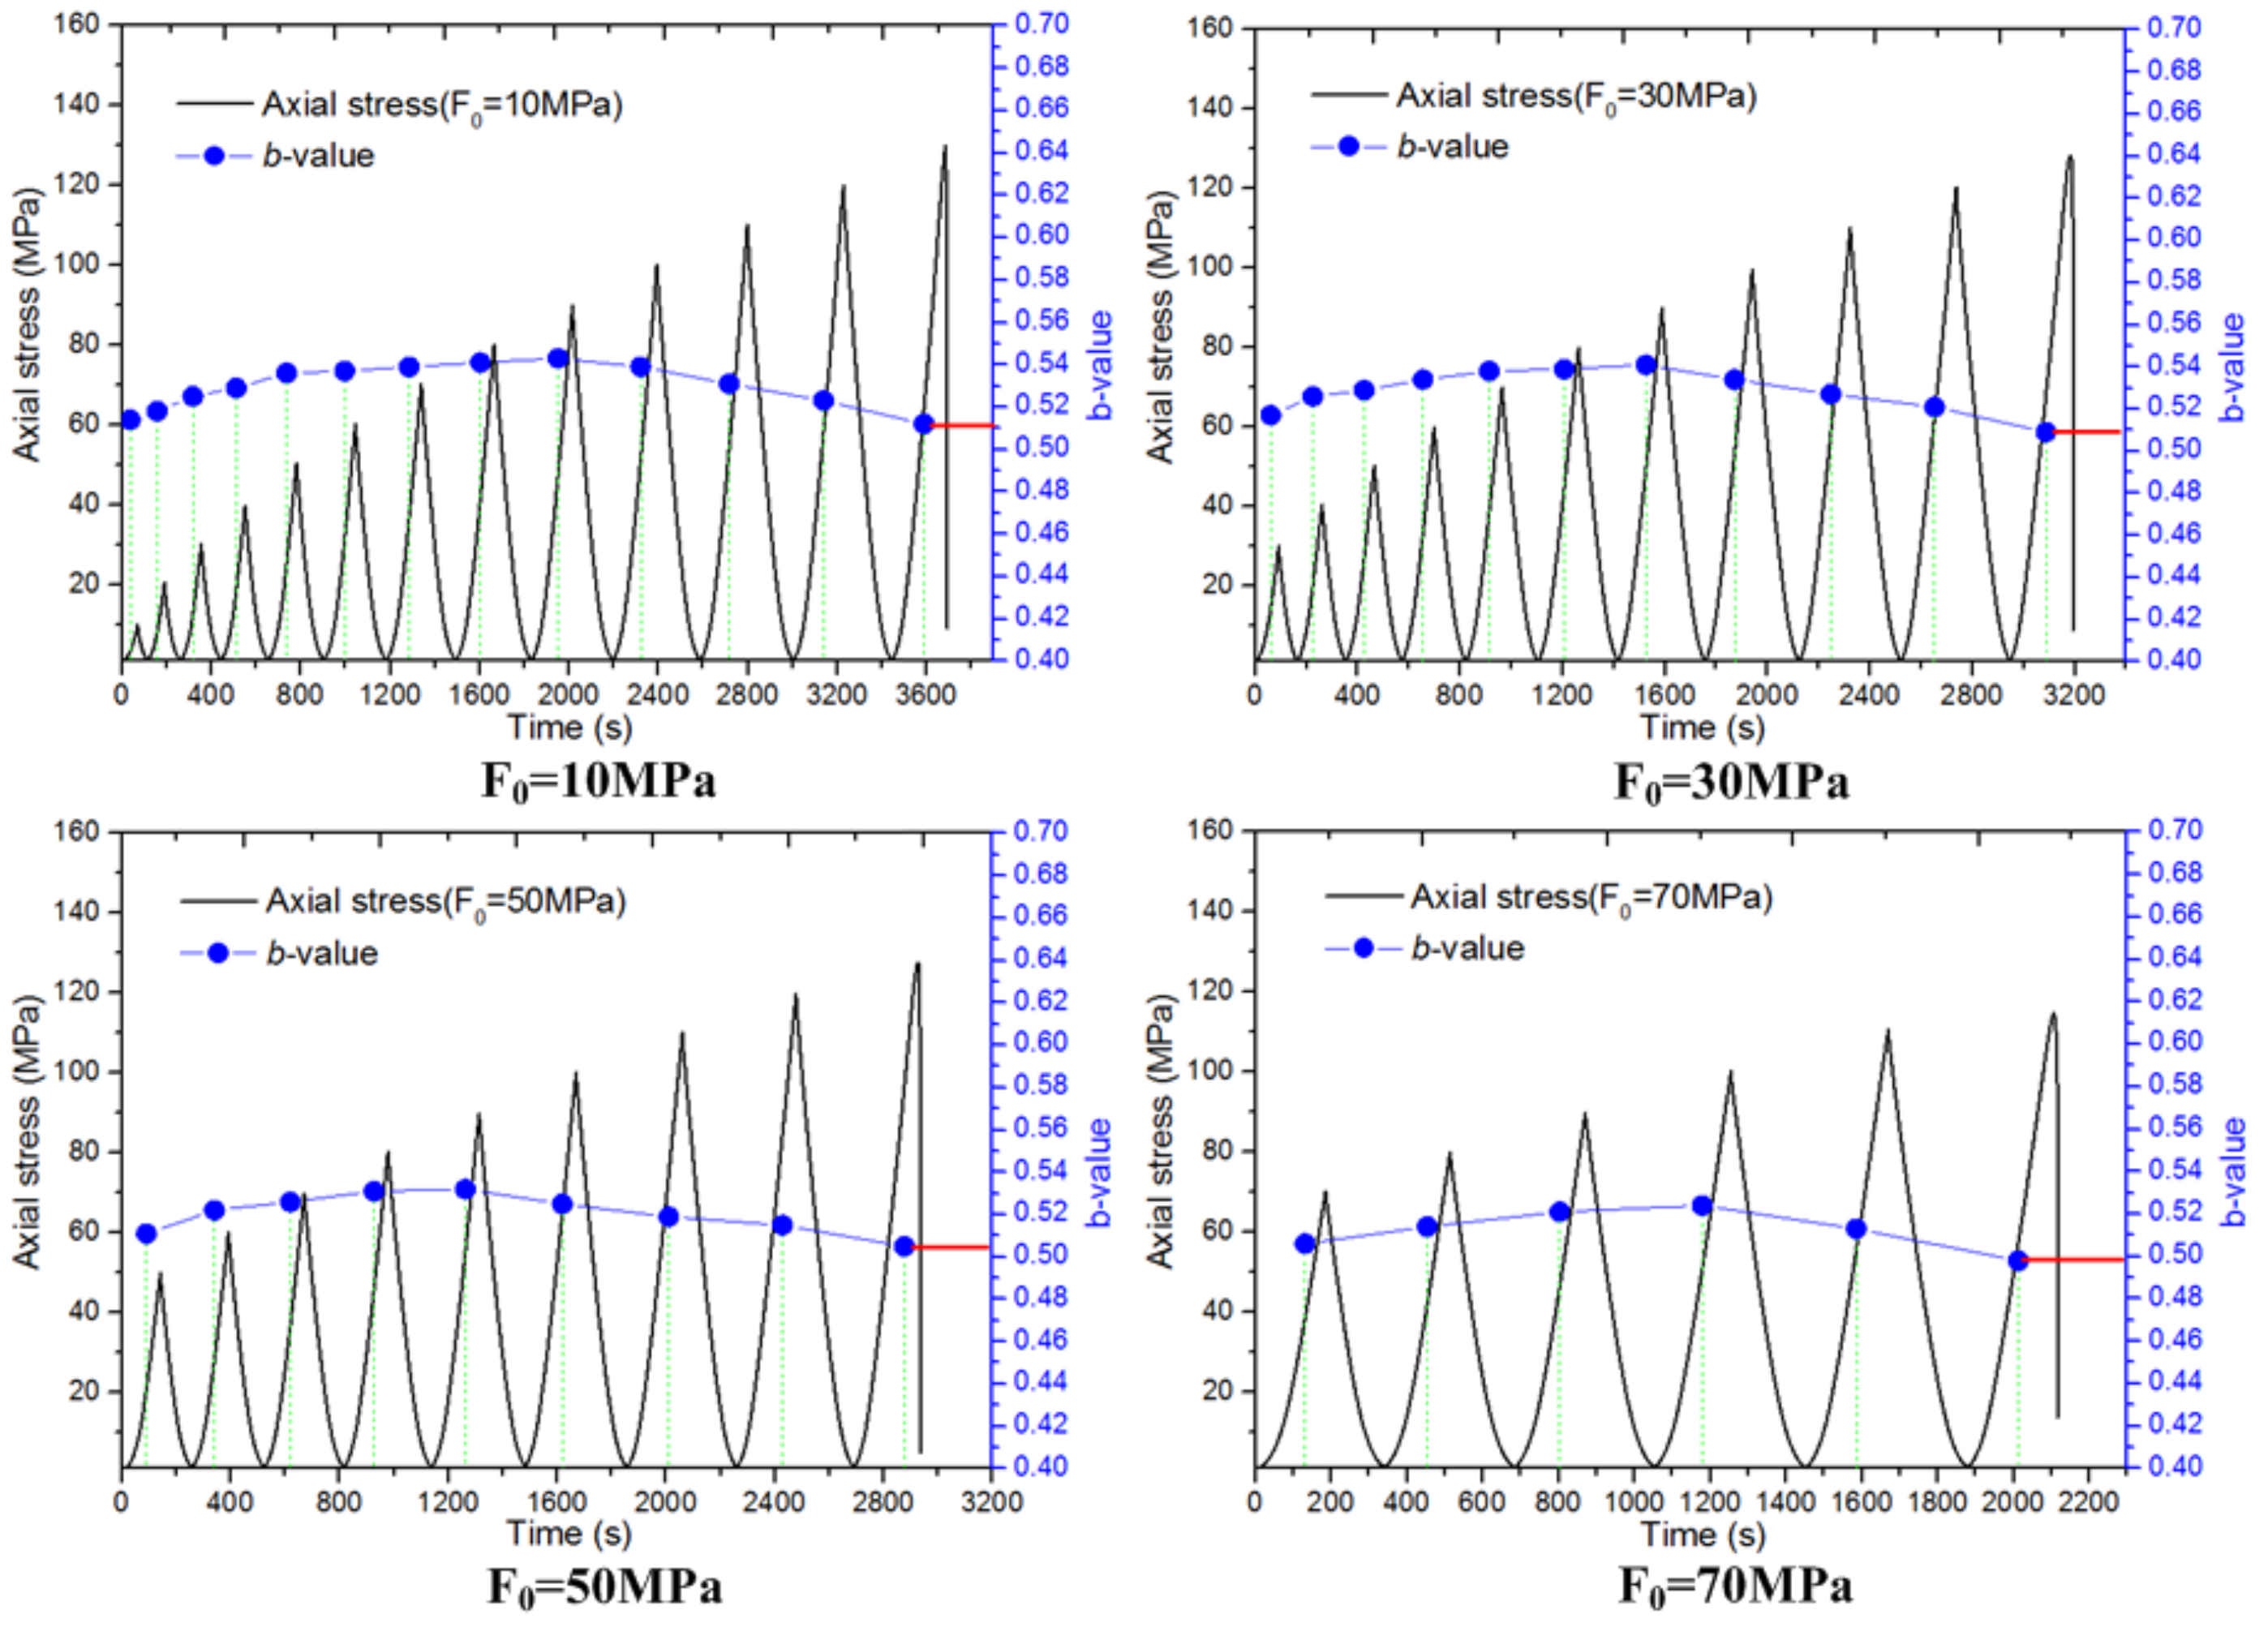
  • With various peak stresses in the first cycle, the tested samples exhibit significantly different AE activities under cyclic loading. A small amount of acoustic emission is mainly released in the loading stage under the low amplitude of initial cycle (e.g., 10 and 30 MPa). Increasing the amplitude of initial cycle (e.g., 50 and 70 MPa) significantly intensifies the number of AE ring counts, indicating that the higher amplitude of initial cycle causes more and more serious damage.
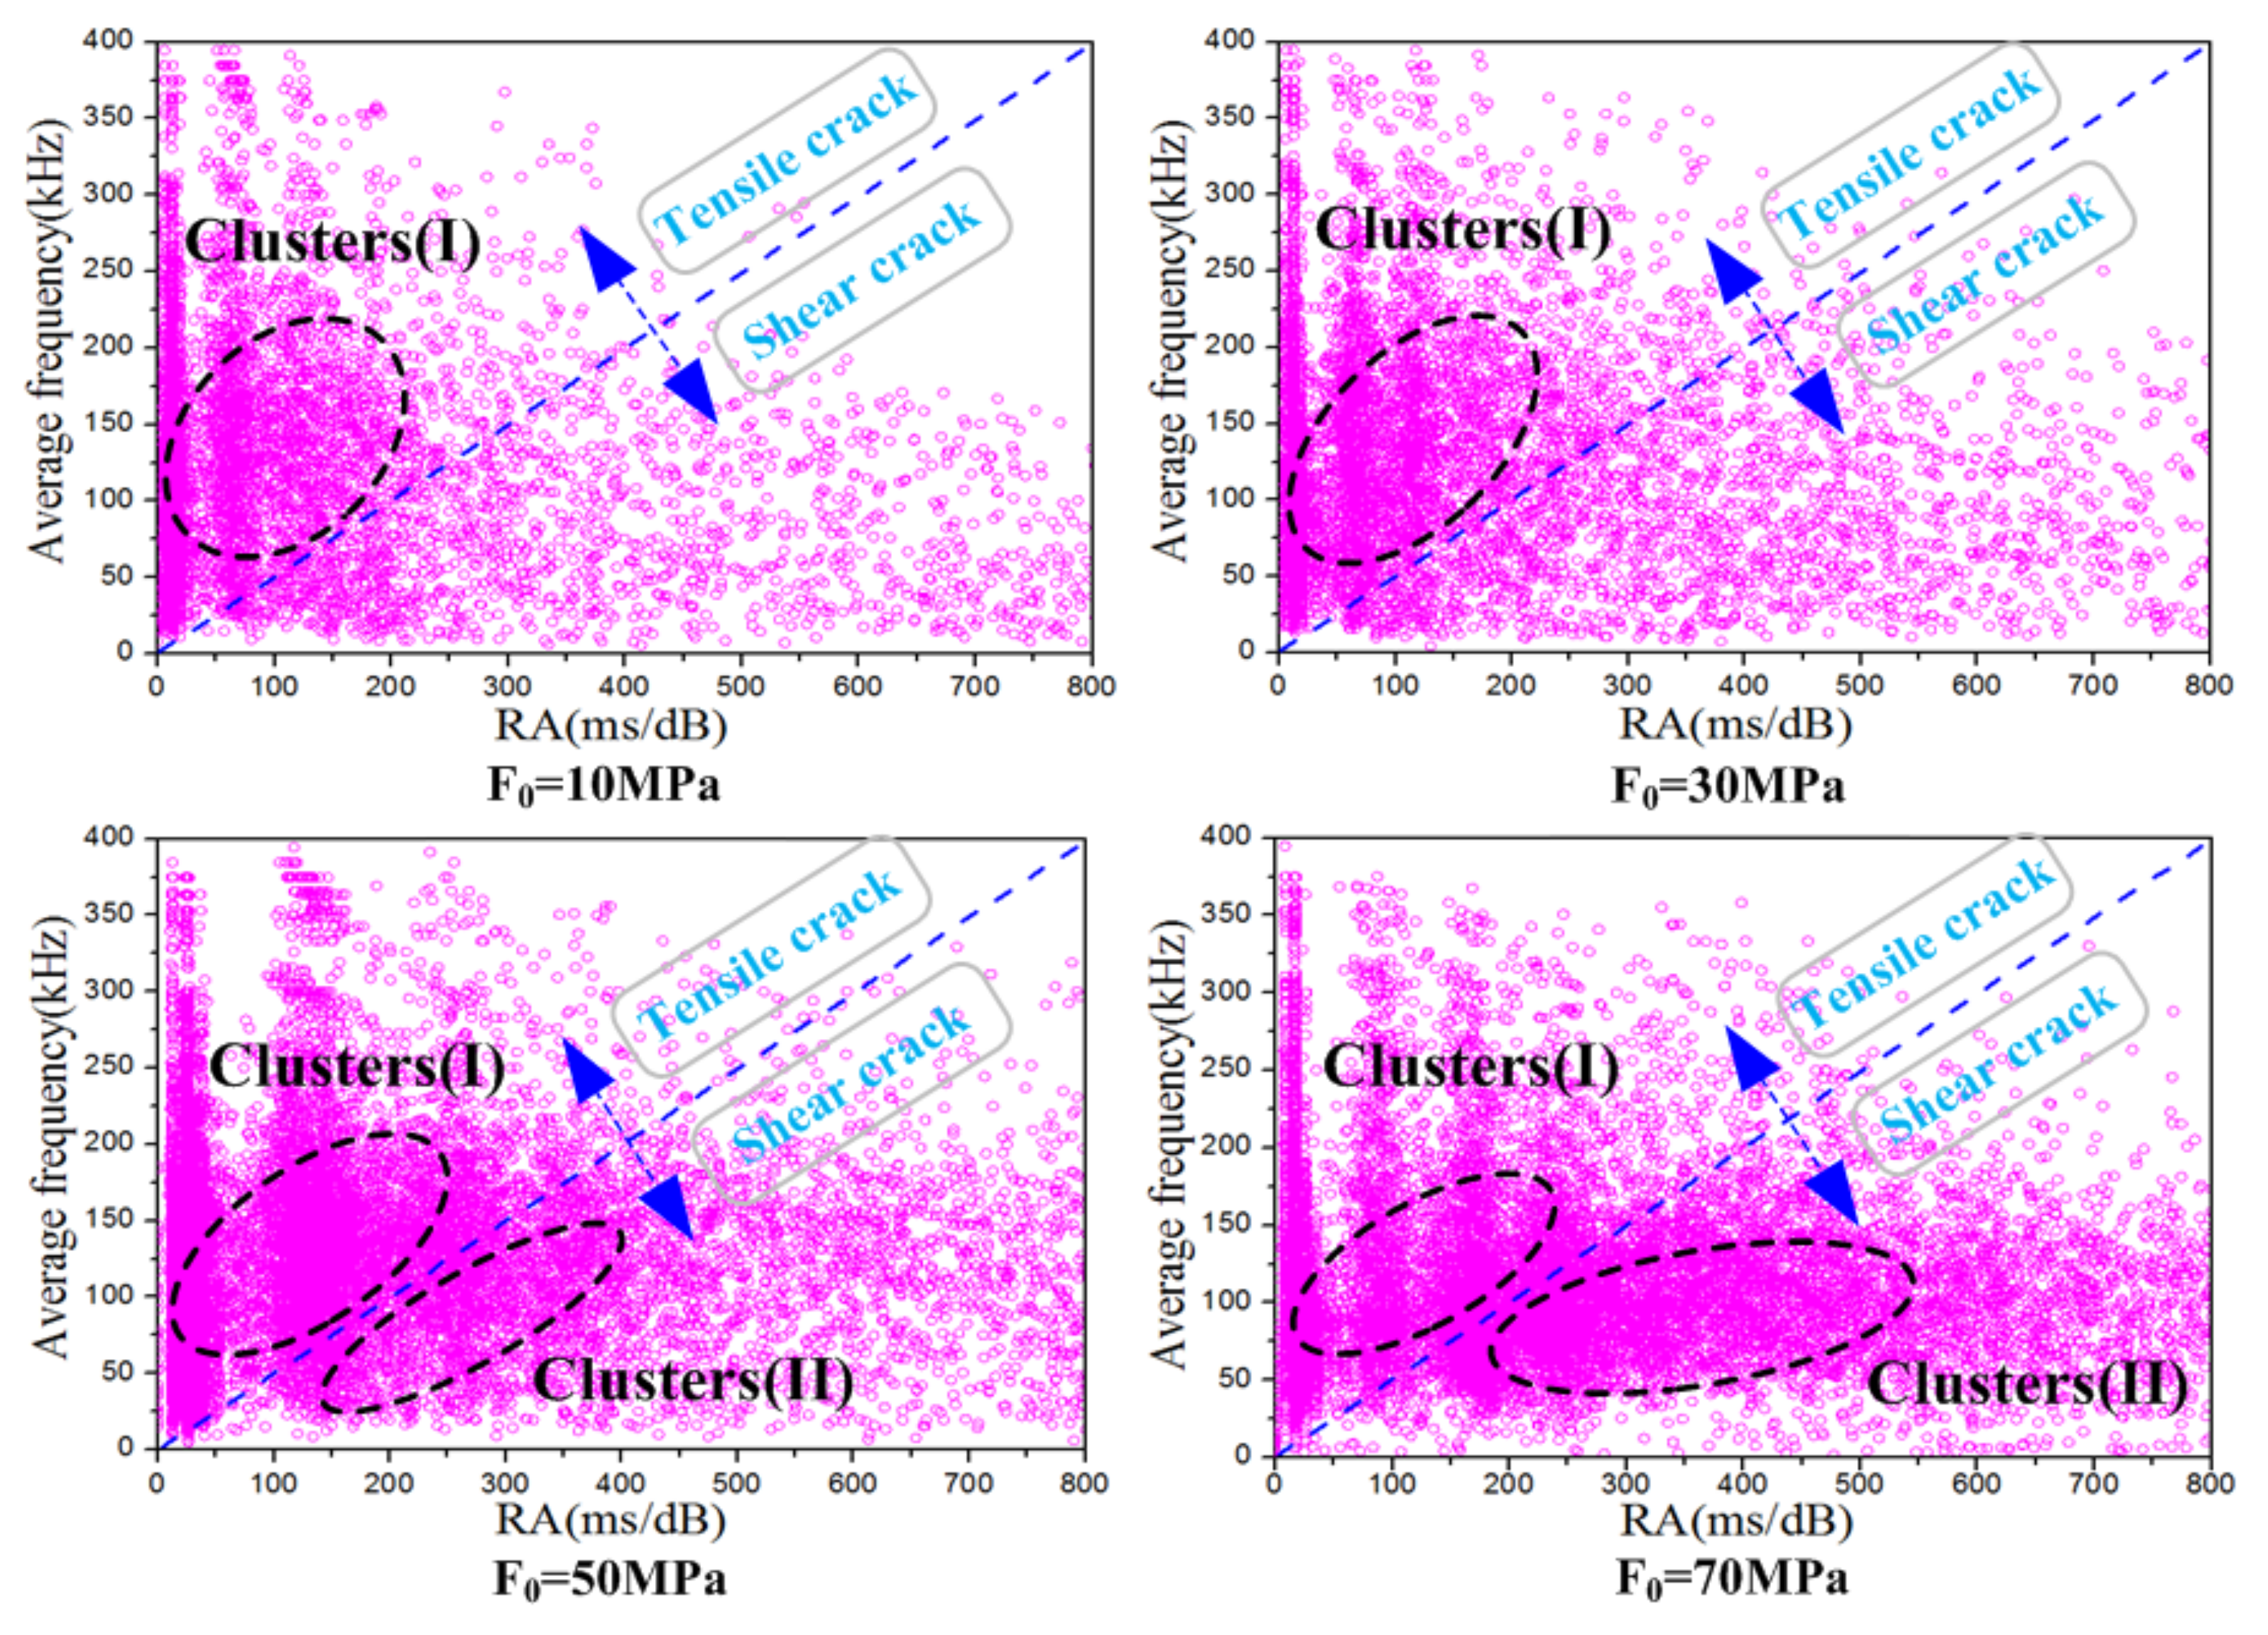
  • The final failure morphologies of specimens were obviously affected by the initial cyclic amplitude. With the increase of initial cycle amplitude, the number of cracks on the rock surface gradually increases. The failure patterns gradually change from tension failure to the mixture of tension and shear, which was verified by the crack identification method of acoustic emission AF–RA value.
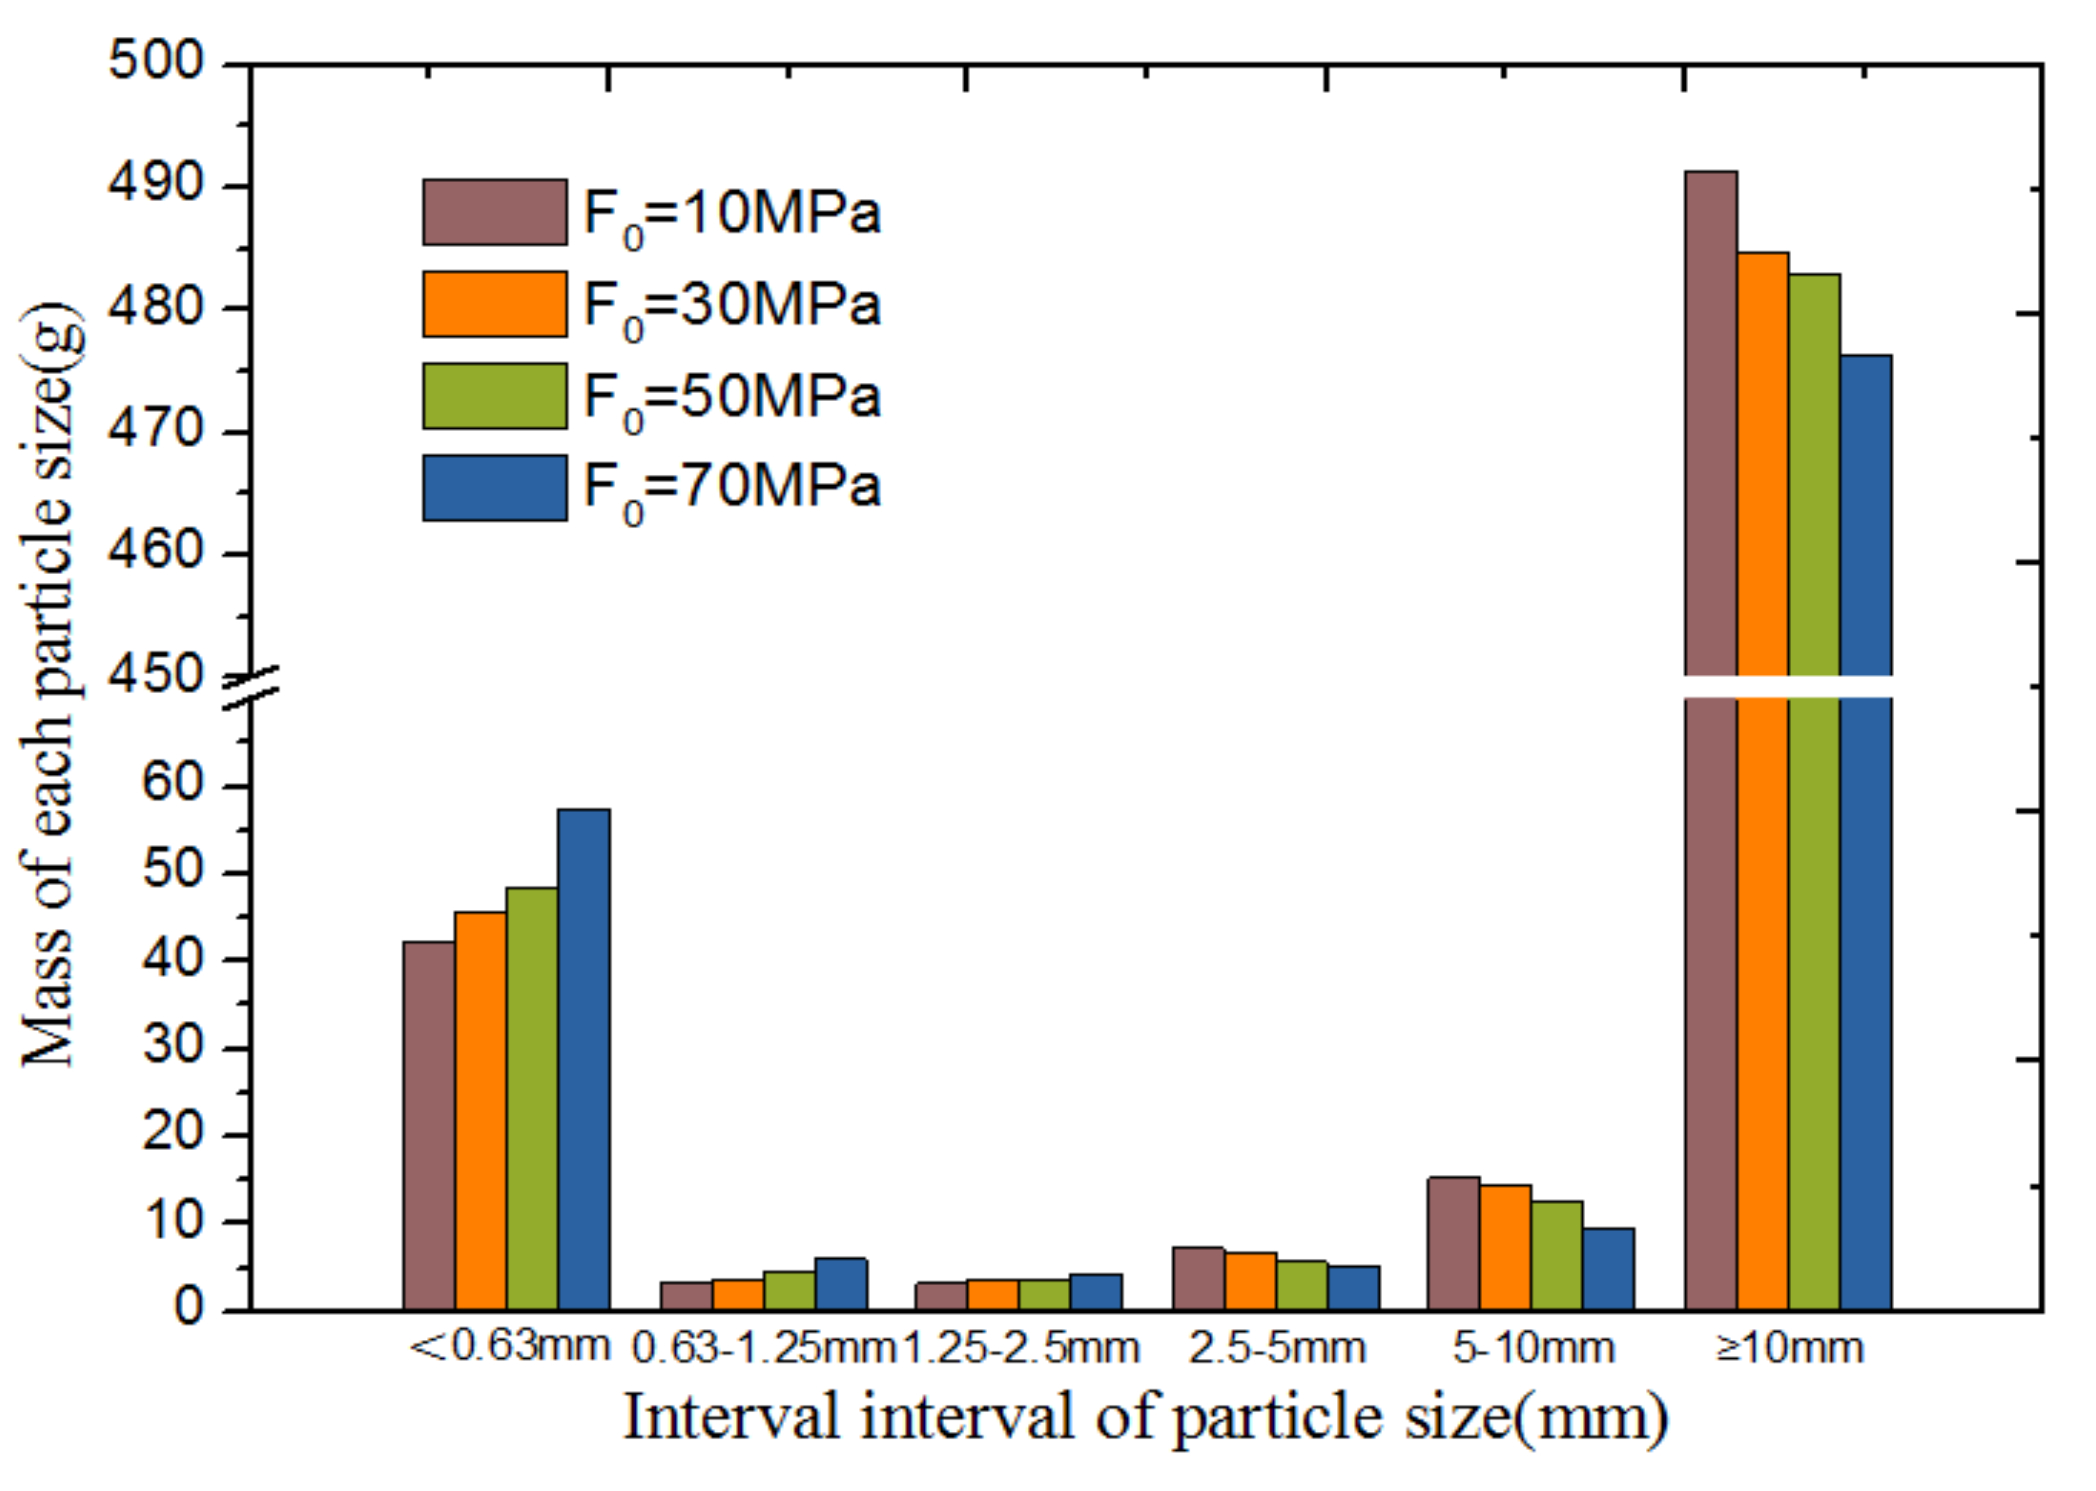
  • The final macro-fracture scales of tested marble were obviously intensified with the increase of initial cyclic amplitude, which was verified by the fragment size distribution and AE b-value.

Author Contributions

Conceptualization, Z.Z. and H.W.; methodology, H.W. and L.C.; software, R.C.; formal analysis, H.W.; investigation, H.W. and X.C.; data curation, Y.E.; writing—original draft preparation, H.W.; writing—review and editing, H.W. and X.C.

Funding

This work was supported by financial grants from the National Basic Research Program of China (2015CB060200), the National Natural Science Foundation of China (41772313), and the Fundamental Research Funds for the Central Universities of Central South University (2017zzts185). The authors are very grateful for the financial contribution and convey their appreciation for supporting this basic research.

Acknowledgments

This study is supported by the Fundamental Research Funds for the Central Universities of Central South University (Grant No. 2017zzts185). The authors would like to express their gratitude to the editors and anonymous reviewers for their constructive comments on the draft paper.

Conflicts of Interest

The authors declare no conflict of interest.

References

  1. Cording, E.J.; Hashash, Y.M.A.; Oh, J. Analysis of pillar stability of mined gas storage caverns in shale formations. Eng. Geol. 2015, 184, 71–80. [Google Scholar]
  2. Tong, L.; Liu, L.; Qiu, Y.; Liu, S. Tunneling in abandoned coal mine areas: Problems, impacts and protection measures. Tunn. Undergr. Space Technol. 2013, 38, 409–422. [Google Scholar] [CrossRef]
  3. Kuz’min, M.P.; Larionov, L.M.; Kondratiev, V.V.; Kuz’mina, M.Y.; Grigoriev, V.G.; Kuz’mina, A.S. Use of the burnt rock of coal deposits slag heaps in the concrete products manufacturing. Constr. Build. Mater. 2018, 179, 117–124. [Google Scholar] [CrossRef]
  4. Li, H.B.; Yang, X.G.; Zhang, X.B.; Zhou, J.W. Deformation and failure analyses of large underground caverns during construction of the Houziyan Hydropower Station, Southwest China. Eng. Fail. Anal. 2017, 80, 164–185. [Google Scholar] [CrossRef]
  5. Fan, J.; Jiang, D.; Liu, W.; Wu, F.; Chen, J.; Daemen, J. Discontinuous fatigue of salt rock with low-stress intervals. Int. J. Rock Mech. Min. Sci. 2019, 115, 77–86. [Google Scholar] [CrossRef]
  6. Liu, G.; Feng, X.T.; Jiang, Q.; Yao, Z.; Li, S. In situ observation of spalling process of intact rock mass at large cavern excavation. Eng. Geol. 2017, 226, 52–69. [Google Scholar] [CrossRef]
  7. Bérest, P.; Brouard, B.; Feuga, B.; Karimi-Jafari, M. The 1873 collapse of the Saint-Maximilien panel at the Varangeville salt mine. Int. J. Rock Mech. Min. Sci. 2008, 45, 1025–1043. [Google Scholar] [CrossRef]
  8. Naji, A.M.; Emad, M.Z.; Rehman, H.; Yoo, H. Geological and geomechanical heterogeneity in deep hydropower tunnels: A rock burst failure case study. Tunn. Undergr. Space Technol. 2019, 84, 507–521. [Google Scholar] [CrossRef]
  9. Wu, Q.; Chen, L.; Shen, B.; Dlamini, B.; Li, S.; Zhu, Y. Experimental Investigation on Rockbolt Performance Under the Tension Load. Rock Mech. Rock Eng. 2019, 4605–4618. [Google Scholar] [CrossRef]
  10. Zhou, Z.; Cai, X.; Ma, D.; Chen, L.; Wang, S.; Tan, L. Dynamic tensile properties of sandstone subjected to wetting and drying cycles. Constr. Build. Mater. 2018, 182, 215–232. [Google Scholar] [CrossRef]
  11. Zhou, Z.; Cai, X.; Li, X.; Cao, W.; Du, X. Dynamic Response and Energy Evolution of Sandstone Under Coupled Static–Dynamic Compression: Insights from Experimental Study into Deep Rock Engineering Applications. Rock Mech. Rock Eng. 2019, 1–27. [Google Scholar] [CrossRef]
  12. Lu, C.P.; Dou, L.M.; Zhang, N.; Xue, J.H.; Wang, X.N.; Liu, H.; Zhang, J.W. Microseismic frequency-spectrum evolutionary rule of rockburst triggered by roof fall. Int. J. Rock Mech. Min. Sci. 2013, 64, 6–16. [Google Scholar] [CrossRef]
  13. Bagde, M.N.; Petroš, V. Fatigue properties of intact sandstone samples subjected to dynamic uniaxial cyclical loading. Int. J. Rock Mech. Min. Sci. 2005, 42, 237–250. [Google Scholar] [CrossRef]
  14. Martin, C.D.; Chandler, N.A. The progressive fracture of Lac du Bonnet granite. Int. J. Rock Mech. Min. Sci. 1994, 31, 643–659. [Google Scholar] [CrossRef]
  15. Liu, Y.; Dai, F.; Feng, P.; Xu, N. Mechanical behavior of intermittent jointed rocks under random cyclic compression with different loading parameters. Soil Dyn. Earthq. Eng. 2018, 113, 12–24. [Google Scholar] [CrossRef]
  16. Heap, M.J.; Vinciguerra, S.; Meredith, P.G. The evolution of elastic moduli with increasing crack damage during cyclic stressing of a basalt from Mt. Etna volcano. Tectonophysics 2009, 471, 153–160. [Google Scholar] [CrossRef]
  17. Wang, S.; Li, X.; Yao, J.; Gong, F.; Li, X.; Du, K.; Tao, M.; Huang, L.; Du, S. Experimental investigation of rock breakage by a conical pick and its application to non-explosive mechanized mining in deep hard rock. Int. J. Rock Mech. Min. Sci. 2019, 122, 104063. [Google Scholar] [CrossRef]
  18. Xiao, J.Q.; Ding, D.X.; Jiang, F.L.; Xu, G. Fatigue damage variable and evolution of rock subjected to cyclic loading. Int. J. Rock Mech. Min. Sci. 2010, 47, 461–468. [Google Scholar] [CrossRef]
  19. Fan, J.; Chen, J.; Jiang, D.; Ren, S.; Wu, J. Fatigue properties of rock salt subjected to interval cyclic pressure. Int. J. Fatigue 2016, 90, 109–115. [Google Scholar] [CrossRef]
  20. Liu, X.S.; Ning, J.G.; Tan, Y.L.; Gu, Q.H. Damage constitutive model based on energy dissipation for intact rock subjected to cyclic loading. Int. J. Rock Mech. Min. Sci. 2016, 85, 27–32. [Google Scholar] [CrossRef]
  21. Jia, C.; Xu, W.; Wang, R.; Wang, W.; Zhang, J.; Yu, J. Characterization of the deformation behavior of fine-grained sandstone by triaxial cyclic loading. Constr. Build. Mater. 2018, 162, 113–123. [Google Scholar] [CrossRef]
  22. Peng, K.; Zhou, J.; Zou, Q.; Yan, F. Deformation characteristics of sandstones during cyclic loading and unloading with varying lower limits of stress under different confining pressures. Int. J. Fatigue 2019, 127, 82–100. [Google Scholar] [CrossRef]
  23. Meng, Q.; Zhang, M.; Han, L.; Pu, H.; Chen, Y. Acoustic Emission Characteristics of Red Sandstone Specimens Under Uniaxial Cyclic Loading and Unloading Compression. Rock Mech. Rock Eng. 2018, 51, 969–988. [Google Scholar] [CrossRef]
  24. Jia, H.; Wang, E.; Song, D.; Wang, X.; Ali, M. Precursory changes in wave velocity for coal and rock samples under cyclic loading. Results Phys. 2019, 12, 432–434. [Google Scholar] [CrossRef]
  25. Zhai, C.H.; Zheng, Z.; Li, S.; Xie, L.L. Seismic analyses of a RCC building under mainshock-aftershock seismic sequences. Soil Dyn. Earthq. Eng. 2015, 74, 46–55. [Google Scholar] [CrossRef]
  26. Varma, M.; Maji, V.B.; Boominathan, A. Numerical modeling of a tunnel in jointed rocks subjected to seismic loading. Undergr. Space 2019, 4, 133–146. [Google Scholar] [CrossRef]
  27. Hatheway, A.W. Fundamentals of earthquake prediction. Eng. Geol. 1996, 43, 81–82. [Google Scholar] [CrossRef]
  28. Zhai, C.H.; Bao, X.; Zheng, Z.; Wang, X.Y. Impact of aftershocks on a post-mainshock damaged containment structure considering duration. Soil Dyn. Earthq. Eng. 2018, 115, 129–141. [Google Scholar] [CrossRef]
  29. Tesfamariam, S.; Goda, K.; Mondal, G. Seismic vulnerability of reinforced concrete frame with unreinforced masonry infill due to main shock-aftershock earthquake sequences. Earthq. Spectra 2015, 31, 1427–1449. [Google Scholar] [CrossRef]
  30. Sanaz, R.; Armen, D.K. A stochastic ground motion model with separable temporal and spectral nonstationarities. Earthq. Eng. Struct. Dyn. 2012, 41, 1549–1568. [Google Scholar]
  31. Goda, K.; Salami, M.R. Inelastic seismic demand estimation of wood-frame houses subjected to mainshock-aftershock sequences. Bull. Earthq. Eng. 2014, 12, 855–874. [Google Scholar] [CrossRef]
  32. Ulusay, R. The ISRM Suggested Methods for Rock Characterization, Testing and Monitoring: 2007–2014. Springer. 2014. Available online: https://www.springer.com/gp/book/9783319077123 (accessed on 19 November 2019).
  33. Hatton, C.G.; Main, I.G.; Meredith, P.G. A comparison of seismic and structural measurements of scaling exponents during tensile subcritical crack growth. J. Struct. Geol. 1993, 15, 1485–1495. [Google Scholar] [CrossRef]
  34. Brindley, B.J.; Holt, J.; Palmer, I.G. The use of ring-down counting. Non-Destr. Test. 1973, 6, 299–306. [Google Scholar] [CrossRef]
  35. Song, Z.; Konietzky, H.; Frühwirt, T. Hysteresis energy-based failure indicators for concrete and brittle rocks under the condition of fatigue loading. Int. J. Fatigue 2018, 114, 298–310. [Google Scholar] [CrossRef]
  36. Song, Z.; Konietzky, H.; Herbst, M. Bonded-particle model-based simulation of artificial rock subjected to cyclic loading. Acta Geotech. 2019, 14, 955–971. [Google Scholar] [CrossRef]
  37. Li, X.; Huai, Z.; Konietzky, H.; Li, X.; Wang, Y. A numerical study of brittle failure in rocks with distinct microcrack characteristics. Int. J. Rock Mech. Min. Sci. 2018, 106, 289–299. [Google Scholar] [CrossRef]
  38. Cai, M.; Kaiser, P.K.; Tasaka, Y.; Maejima, T.; Morioka, H.; Minami, M. Generalized crack initiation and crack damage stress thresholds of brittle rock masses near underground excavations. Int. J. Rock Mech. Min. Sci. 2004, 41, 833–847. [Google Scholar] [CrossRef]
  39. Brace, W.F.; Paulding, B.W.; Scholz, C. Dilatancy in the fracture of crystalline rocks. J. Geophys. Res. 1966, 71, 3939–3953. [Google Scholar] [CrossRef]
  40. Song, D.; Wang, E.; Liu, J. Relationship between EMR and dissipated energy of coal rock mass during cyclic loading process. Saf. Sci. 2012, 50, 751–760. [Google Scholar] [CrossRef]
  41. Ye, D.; Wang, Z. A new approach to low-cycle fatigue damage based on exhaustion of static toughness and dissipation of cyclic plastic strain energy during fatigue. Int. J. Fatigue 2001, 23, 679–687. [Google Scholar]
  42. Yilmaz, T.; Ercikdi, B.; Karaman, K.; Külekçi, G. Assessment of strength properties of cemented paste backfill by ultrasonic pulse velocity test. Ultrasonics 2014, 54, 1386–1394. [Google Scholar] [CrossRef] [PubMed]
  43. Ayaz, Y.; Kocamaz, A.F.; Karakoç, M.B. Modeling of compressive strength and UPV of high-volume mineral-admixtured concrete using rule-based M5 rule and tree model M5P classifiers. Constr. Build. Mater. 2015, 94, 235–240. [Google Scholar] [CrossRef]
  44. Ercikdi, B.; Karaman, K.; Cihangir, F.; Yılmaz, T.; Aliyazıcıoğlu, Ş.; Kesimal, A. Core size effect on the dry and saturated ultrasonic pulse velocity of limestone samples. Ultrasonics 2016, 72, 143–149. [Google Scholar] [CrossRef] [PubMed]
  45. Scuderi, M.M.; Marone, C.; Tinti, E.; Di Stefano, G.; Collettini, C. Precursory changes in seismic velocity for the spectrum of earthquake failure modes. Nat. Geosci. 2016, 9, 695–700. [Google Scholar] [CrossRef] [PubMed] [Green Version]
  46. Korneev, V.; Glubokovskikh, S. Seismic velocity changes caused by an overburden stress. Geophysics 2013, 78, WC25–WC31. [Google Scholar] [CrossRef]
  47. Li, D.; Wang, E.; Kong, X.; Jia, H.; Wang, D.; Muhammad, A. Damage precursor of construction rocks under uniaxial cyclic loading tests analyzed by acoustic emission. Constr. Build. Mater. 2019, 206, 169–178. [Google Scholar]
  48. Mansurov, V.A. Acoustic emission from failing rock behaviour. Rock Mech. Rock Eng. 1994, 27, 173–182. [Google Scholar] [CrossRef]
  49. Lou, Q.; Song, D.; He, X.; Li, Z.; Qiu, L.; Wei, M.; He, S. Correlations between acoustic and electromagnetic emissions and stress drop induced by burst-prone coal and rock fracture. Saf. Sci. 2019, 115, 310–319. [Google Scholar] [CrossRef]
  50. Du, K.; Su, R.; Tao, M.; Yang, C.; Momeni, A.; Wang, S. Specimen shape and cross-section effects on the mechanical properties of rocks under uniaxial compressive stress. Bull. Eng. Geol. Environ. 2019, 78, 6061–6074. [Google Scholar] [CrossRef]
  51. Zhou, Z.; Cai, X.; Ma, D.; Du, X.; Chen, L.; Wang, H.; Zang, H. Water saturation effects on dynamic fracture behavior of sandstone. Int. J. Rock Mech. Min. Sci. 2019, 114, 46–61. [Google Scholar] [CrossRef]
  52. Zhu, Q.; Li, D.; Han, Z.; Li, X.; Zhou, Z. Mechanical properties and fracture evolution of sandstone specimens containing different inclusions under uniaxial compression. Int. J. Rock Mech. Min. Sci. 2019, 115, 33–47. [Google Scholar] [CrossRef]
  53. Ono, K. Structural Integrity Evaluation by Means of Acoustic Emission. Acoust. Emiss. Crit. Phenom. 2008, 13–27. [Google Scholar]
  54. Kencanawati, N.N.; Lizasa, S.; Shigeishi, M. Fracture process and reliability of concrete made from high grade recycled aggregate using acoustic emission technique under compression. Mater. Struct. Constr. 2013, 46, 1441–1448. [Google Scholar] [CrossRef]
  55. Elfergani, H.A.; Pullin, R.; Holford, K.M. Damage assessment of corrosion in prestressed concrete by acoustic emission. Constr. Build. Mater. 2013, 40, 925–933. [Google Scholar] [CrossRef]
  56. Ohno, K.; Ohtsu, M. Crack classification in concrete based on acoustic emission. Constr. Build. Mater. 2010, 24, 2339–2346. [Google Scholar] [CrossRef]
  57. Farhidzadeh, A.; Mpalaskas, A.C.; Matikas, T.E.; Farhidzadeh, H.; Aggelis, D.G. Fracture mode identification in cementitious materials using supervised pattern recognition of acoustic emission features. Constr. Build. Mater. 2014, 67, 129–138. [Google Scholar] [CrossRef]
  58. Cai, X.; Zhou, Z.; Liu, K.; Du, X.; Zang, H. Water-Weakening E ff ects on the Mechanical Behavior of Di ff erent Rock Types: Phenomena and Mechanisms. Appl. Sci. 2019, 9, 4450. [Google Scholar] [CrossRef] [Green Version]
  59. Lockner, D.A.; Byerlee, J.D.; Kuksenko, V.; Ponomarev, A.; Sidorin, A. Quasi-static fault growth and shear fracture energy in granite. Nature 1991, 350, 39–42. [Google Scholar] [CrossRef]
  60. Smith, W.D. The b-value as an earthquake precursor. Nature 1981, 289, 136–139. [Google Scholar] [CrossRef]
  61. Zhang, Q.; Zhang, X.P. A numerical study on cracking processes in limestone by the b-value analysis of acoustic emissions. Comput. Geotech. 2017, 92, 1–10. [Google Scholar] [CrossRef]
  62. Scholz, C.H. The frequency-magnitude relation of microfracturing in rock and its relation to earthquakes. Bull. Seismol. Soc. Am. 1968, 58, 399–415. [Google Scholar]
  63. Gutenberg, B.; Richter, C.F. Frequency of earthquakes in California. Nature 1945, 156, 371. [Google Scholar]
Figure 1. Diagram of actual stress state of underground structure.
Energies 12 04429 g001
Figure 2. Light micrographs of white marble: (a) plane polarized light and (b) cross polarized light (Dol = dolomite).
Energies 12 04429 g002
Figure 3. Diagram of experimental setup.
Energies 12 04429 g003
Figure 4. Path of uniaxial cyclic compression (the amplitude of initial cycle F0 = 10, 30, 50, and 70 MPa, and the incremental stress Δ σ = 10 MPa).
Energies 12 04429 g004
Figure 5. Relationship between stress and strain for different testing schemes: (a) the complete stress–strain curves; (b) hysteresis loop under 70 MPa stress level, and (c) hysteresis loop under 110 MPa stress level.
Energies 12 04429 g005
Figure 6. Evolution curves between the axial stress and volumetric strain in different loading schemes.
Energies 12 04429 g006
Figure 7. Graphs of uniaxial compression curve and the final loading curves of cyclic loading tests: (a) stress versus strain curves and (b) peak strength value.
Energies 12 04429 g007
Figure 8. Graph of dissipated energy ( U d ) during one loading—unloading process.
Energies 12 04429 g008
Figure 9. Dissipated energy ( U d ) during each cyclic loading phase.
Energies 12 04429 g009
Figure 10. Characteristic of ultrasonic P-wave velocity at peak stress in each cycle: (a) variation of ultrasonic P-wave velocity and (b) damage evolution curve.
Energies 12 04429 g010
Figure 11. Characteristic in different loading schemes: (a) the relationship between axial stress and ring counts and (b) damage evolution curve.
Energies 12 04429 g011
Figure 12. Views of failure pattern in different loading schemes.
Energies 12 04429 g012
Figure 13. Classification in JCMS-IIIB5706 code [58].
Energies 12 04429 g013
Figure 14. Identification for tested specimens by the relationship of AF–RA value.
Energies 12 04429 g014
Figure 15. Fragment-size distribution by weight after failure.
Energies 12 04429 g015
Figure 16. Relationship between axial stress and b-value in different loading schemes.
Energies 12 04429 g016
Table 1. Composition and particle-size distribution of marble.
Mineral CompositionContent (%)Particle Size (mm)
Dolomite96.20.2–0.6
Opaque minerals20.05–0.1
Carbonaceous substance1.8≤0.05
Table 2. Each particle size of marble specimen after failure in different loading schemes.
Initial StressMass of Each Particle Size (g)Total Mass (g)
<0.63 mm0.63–1.25 mm1.25–2.5 mm2.5–5 mm5–10 mm≥10 mm
10 MPa42.243.253.237.2115.24491.28562.45
30 MPa45.583.513.666.8514.53484.63558.76
50 MPa48.374.423.455.6112.44482.88557.17
70 MPa57.335.964.395.179.47476.31558.63

