Abstract
In this study, we develop a method for calculating electric vehicle lithium-ion battery pack performance and cost. To begin, we construct a model allowing for calculation of cell performance and material cost using a bottom-up approach starting with real-world material costs. It thus provides a supplement to existing models, which often begin with fixed cathode active material (CAM) prices that do not reflect raw metal price fluctuations. We collect and display data from the London Metal Exchange to show that such metal prices, in this case specifically cobalt and nickel, do indeed fluctuate and cannot be assumed to remain static or decrease consistently. We input this data into our model, which allows for a visualization of the effects of these metal price fluctuations on the prices of the CAMs. CAMs analyzed include various lithium transition metal oxide-type layered oxide (NMC and NCA) technologies, as well as cubic spinel oxide (LMO), high voltage spinel oxide (LNMO), and lithium metal phosphate (LFP). The calculated CAM costs are combined with additional cell component costs in order to calculate full cell costs, which are in turn scaled up to full battery pack costs. Economies of scale are accounted for separately for each cost fraction.
1. Introduction
The majority of current transportation technologies rely on fossil fuels as their predominant energy source [1]. Fossil fuels, however, are a nonrenewable resource whose processing and combustion cause environmental pollution [2,3,4]. As such, there is currently growing interest in alternative energy sources which are clean, renewable, and affordable.
One such proposed alternative is that of electric motors and electric vehicles (EVs). Though experimental versions have existed since the 1820s, the increasing awareness of the aforementioned issues with fossil fuels has led to increased interest in the technology over the last few decades [5]. This has led to a surge of EV development, with models such as the Tesla Model S and Nissan Leaf selling upwards of 150,000 and 300,000 units, respectively [6,7]. Government agencies in various countries are also setting goals for increasing the presence of EVs and are often offering incentives to do so [8,9,10,11].
Lithium ion batteries currently are the most predominant power source for recently developed EVs [12,13]. These batteries make up a significant portion of the total EV cost, roughly 33% of the price of a 2018 Chevrolet Bolt and 40% of a 2018 Tesla Model 3, and few current batteries allow for EV ranges of greater than 500 km [14,15,16,17]. This makes these batteries a target for improvement. While some technologies, such as all-solid state, sodium ion, and lithium-sulfur in the near future, and lithium-air on the far horizon, have shown some degree of promise as possible alternatives to lithium ion batteries, they are currently not far enough along in development to be in a commercializable state [18,19].
Due to the importance of affordable, high-performing batteries for the advancement of EV technology, several research groups have developed models which compile known information and utilize equations relating physical properties and economic rules to allow researchers to estimate the cost and performance of theoretical batteries based on factors including cell chemistry and dimensions, processing costs, and production scale. This allows for predictions regarding the viability of future battery technologies to be made. The most well-known of these cost models is BatPaC, which stands for Battery Performance and Cost, developed by Argonne National Laboratory in the USA [20]. Other groups, such as Berg et al., have developed their own cost models, as well [21].
As is the case with any model, simplifying assumptions have been made with these models. One such simplification that is often made is to begin calculations with pre-determined cathode active material (CAM) costs. While there is often the option to modify these costs directly, methods to calculate said costs are absent. This simplification is feasible in the context of relatively steady CAM costs, though would cease to lead to valid cost predictions in the case of fluctuating CAM prices.
A major factor determining the final costs of CAMs is the cost of their constituent raw materials, which often make up more than 50% of the total cost [22]. As most battery manufacturers currently lack long-term, fixed-price contracts with suppliers of critical constituent metals such as cobalt, fluctuations in the prices of said metals would ultimately result in corresponding fluctuations in the prices of the CAMs that they are used to create [23,24]. Such fluctuations do indeed occur. For instance, the price of cobalt—used in CAMs such as NMC, NCA, and LCO—quadrupled between March 2016 and March 2018, after which it has since decreased by about a third [25,26]. Trends such as these show that the costs of raw CAM metals cannot be assumed to remain constant, and thus neither can the costs of the CAMs themselves.
We have thus developed a model with the goal of providing the ability to calculate CAM and cell costs based on real-time metal costs. It does not aim to replace any existing models, some of which, such as BatPaC, have more elaborate, detailed, and customizable methods of examining full battery packs, but rather to act as a supplement to these models. In this way, we hope to further the overall field of battery research by more closely examining the raw metals that serve as critical materials in the construction of said battery packs. To this end, we attempt to make our model as open and transparent as possible, and to clearly articulate all assumptions and logic used in its development. We also invite any other researchers with an interest in the further refinement and development of our model to make suggestions or directly join us in collaboration.
2. Battery Cell Energy and Cost Estimation
We have developed a theoretical bottom-up battery Cell Energy and Cost model (CellEst) featuring a modifiable prismatic pouch cell design based on commonly used industrial standards. The model is built in a modular way with four main components, each responsible for different calculation-based outputs. The central aim of these components and the model as a whole is to calculate the total material costs of simulated battery cells based on different cell chemistries. The four main components are the modules called Cell Model, Cathode Cost Calculation, Raw Material Costs, and Component Costs, all of which can be found in the supplementary spreadsheet. These sheets are heavily interconnected. Additionally, total cell costs incorporating cell-level processing costs and scaled up pack costs for automotive applications are estimated through the adaptation of a cost-plus methodology and shown in Section 6 of this work.
To determine the total material cost of a battery cell, we divide the material costs into three parts. First, the raw material-driven cost portion of the CAM; second, the process-related cost portion of the CAM; and third, the secondary material costs, which we here define as the anode—usually a graphite-based material—conductive carbon, binder, aluminum and copper current collectors, and separator. We especially focus on a detailed calculation of the CAM costs since they are assembled by the battery manufacturers themselves, whereas the secondary materials are usually purchased as ready-to-use products. Thus, the CAM calculation is divided between a material- and a process-related cost portion [27]. The model calculates the kilogram-based costs of each battery component using cell dimensions, physical material properties, and component-based masses. The model is built around cell dimensions instead of a fixed capacity because we assume that cell dimensions are more important to a car manufacturer and thus engineers than a targeted capacity per cell [28]. These numbers are used as preliminary data for an economy of scale analysis where we differentiate between three major production scenarios for a battery cell manufacturer. These scenarios are a 1 to 2 GWh small production, an 8 GWh medium production, and a 35 GWh mass production [29,30].
The core of the model is the Cell Model sheet. With it, the mass of each cell component is calculated along with the energy per cell. To achieve this, we compute the total stacks per simulated cell through the use of user-definable parameters such as geometrical cell dimensions and material densities. Through this process, cell energy, cell and electrode capacities, and gravimetric and volumetric energies of the respective cells are calculated.
The Cell Model sheet is built on certain base parameters including practical discharge capacity, average discharge potential, crystallographic density, and electrode porosity of the evaluated cell chemistries. We have used a variety of references to obtain usable theoretical data for these parameters [15,21,31,32,33,34,35,36]. The default electrode porosity is defined as 32% while the active mass fractions of the cathode and anode are 91% active electrode material, 5% binder, and 4% conductive carbon. Separator porosity is defined at 50%. All parameters, however, are modifiable if the user desires to use their own data instead of that which we have collected. Modifiable parameters are indicated by green input boxes throughout all sheets of the spreadsheet.
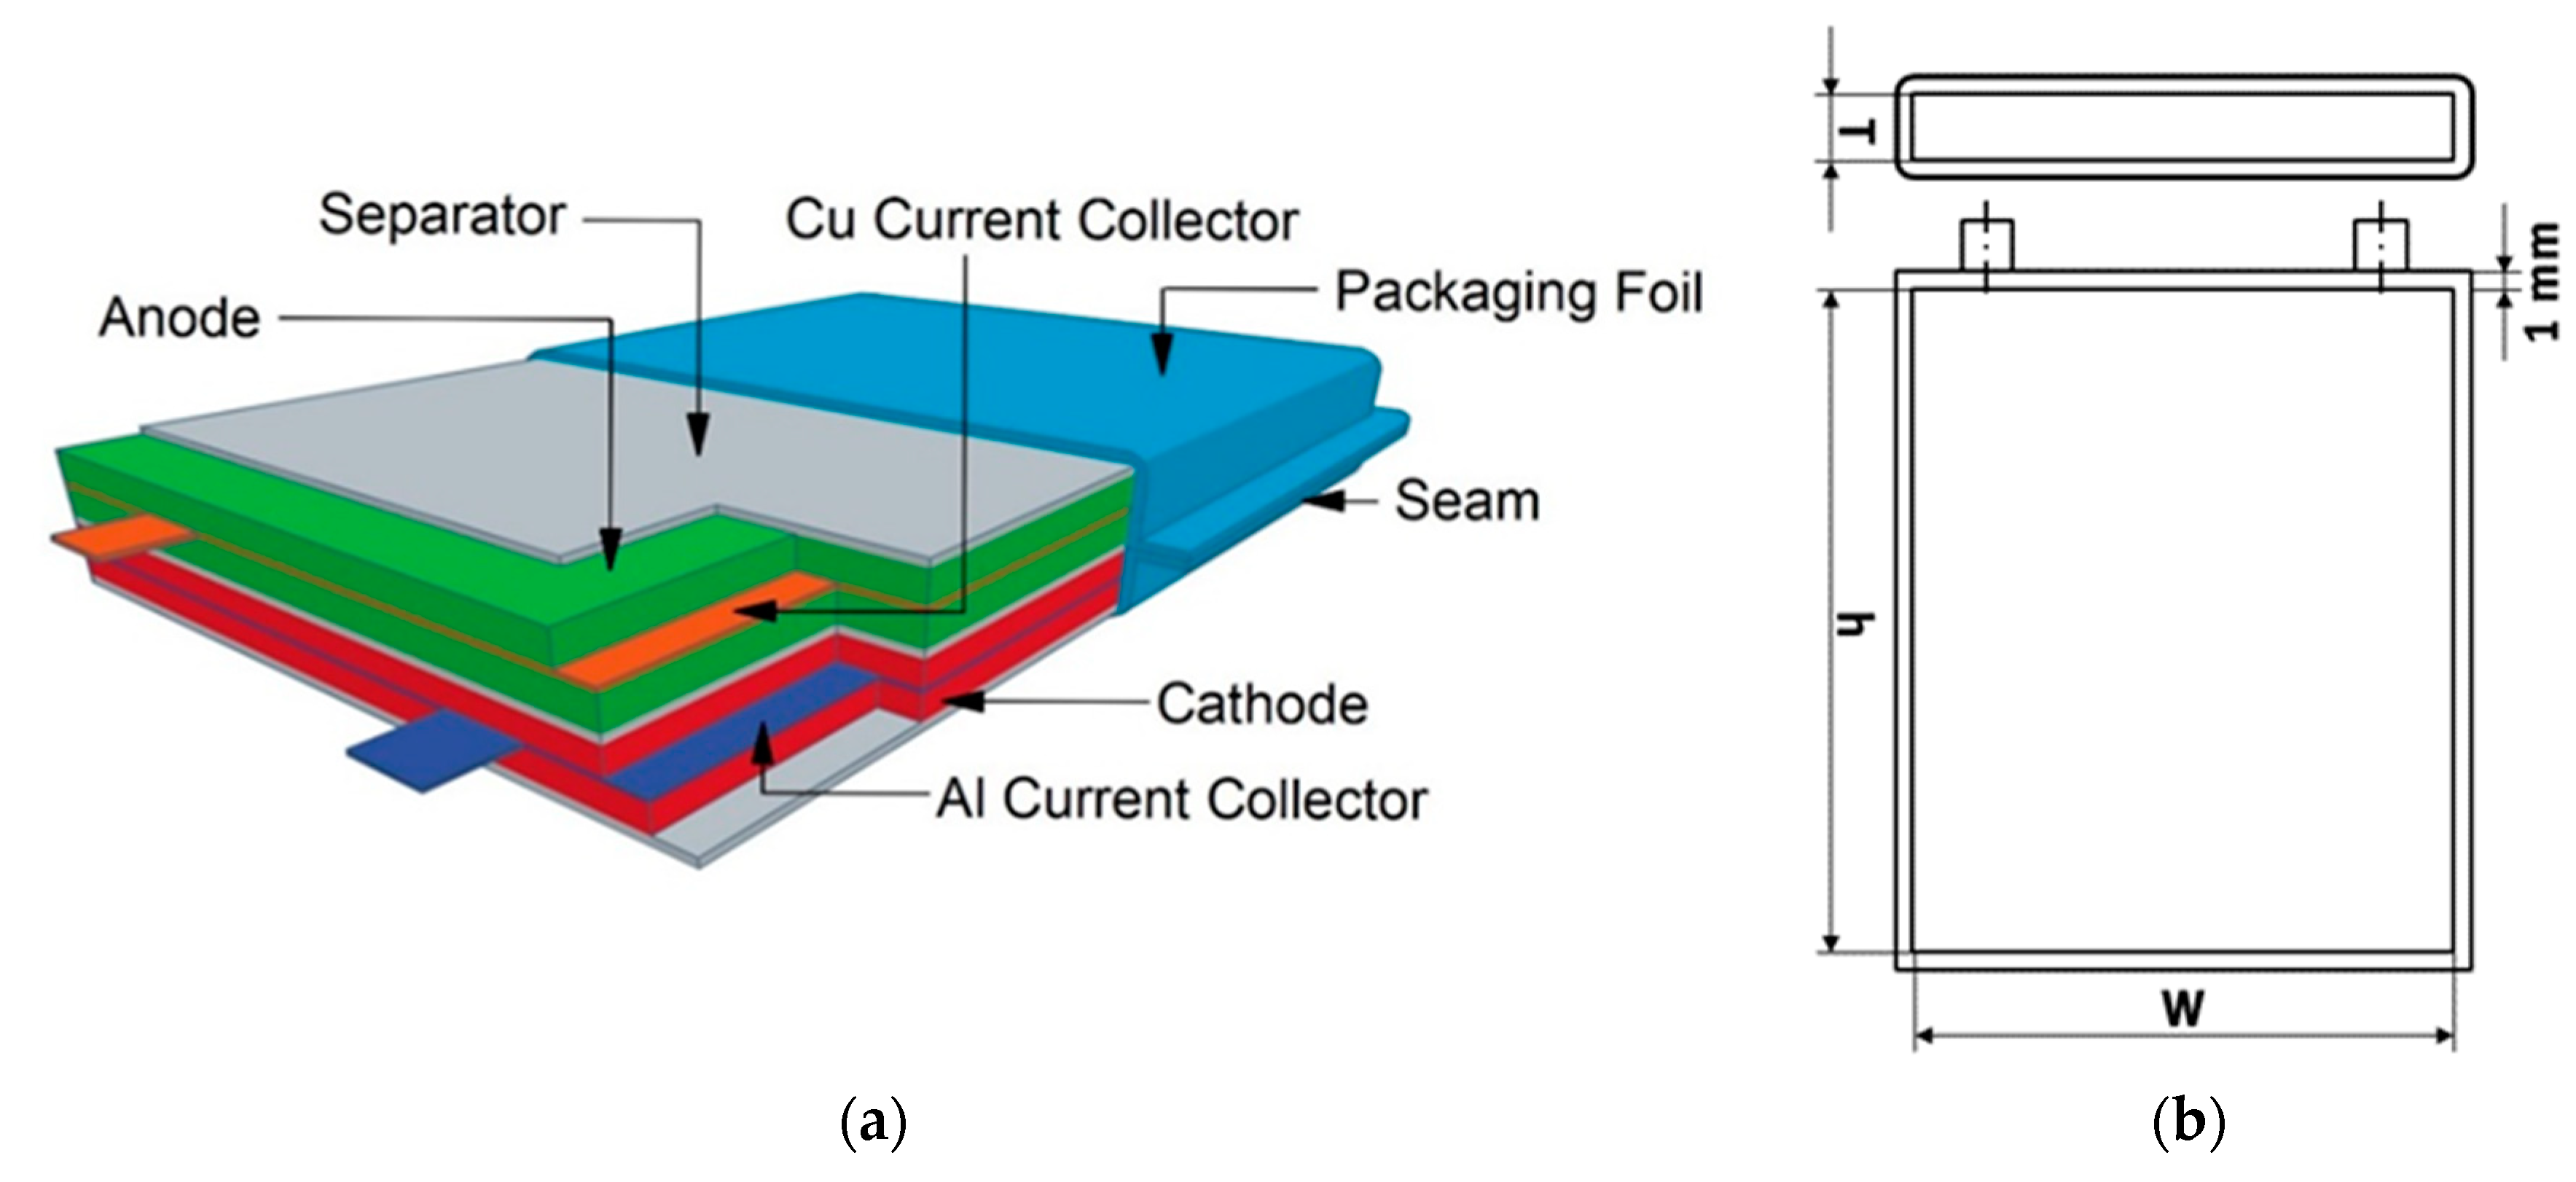
As mentioned earlier, one of the main purposes of the Cell Model is the calculation of exact component masses. For the calculation of the number of stacks contained in one cell, we adapted the definition from Berg et al. of one “stack” as a scalable unit in the cell containing one separator layer, one layer each of anode and cathode electrode material, and half layers of aluminum and copper current collectors [21]. The total cell is subsequently calculated as an integer number, rounding down, of stacks, where said number is determined by the dimensions of the total cell and stack. The design of this stack along with a designation of cell dimensions is shown in Figure 1.
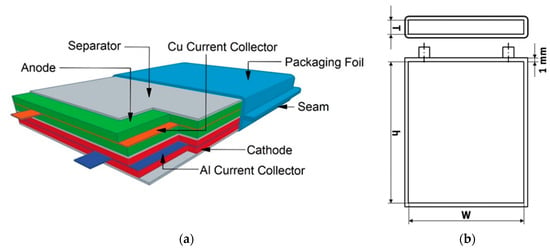
Figure 1.
(a) Basic cell stack; (b) Technical drawing of the cell dimensions with default model parameters.
For the bottom-up cost calculation, the cells are calculated as full cells, which are characterized by the presence of both cathode and anode. We selected ten cell chemistries for examination, all using graphite anodes but each with a different CAM: NMC-111 (LiNi1/3Mn1/3Co1/3O2), NMC-442 (LiNi0.4Mn0.4Co0.2O2), NMC-532 (LiNi0.5Mn0.3Co0.2O2), NMC-622 (LiNi0.6Mn0.2Co0.2O2), NMC-811 (LiNi0.8Mn0.1Co0.1O2), NCA (LiNi0.8Co0.15Al0.05O2), LR-NMC (Li1.15Ni0.15Mn0.55Co0.15O1.7), LNMO (LiNi0.5Mn1.5O4), LMO (LiMn2O4), and LFP (LiFePO4). These were chosen based on their status as state-of-the-art technologies currently being produced on an industrial scale. This status allowed for the collection of empirical data on industrial processing costs, an essential component of our cost model. Future technologies such as those using sulfur cathodes and silicon anodes were thus omitted, as, although they show promise and are currently the subject of large amounts of laboratory research, industrial-scale empirical data is not yet available. Due to the modular basis of the model, however, it is possible to add other such technologies if such empirical data becomes available in the future.
The positive electrode coating thickness is set by default at 65 µm after all processing steps due to its use as a standard industrial dimension [15,37,38]. The negative electrode coating thickness is calculated based on a capacity ratio of anode to cathode of 1.1. This means that the anode thickness varies depending on the cathode material, with default values ranging from 51.29 µm graphite for LNMO to 86.99 µm graphite for LR-NMC. Additionally, a prelithiation step, in which lithium is added to the active lithium content of either the cathode or anode of a LIB, is assumed in order to compensate for capacity loss due to cycling and the formation of a solid-electrolyte interphase [39]. If users do not wish to assume such a step, the lithium loss percentage due to SEI formation can be modified within this sheet. Positive and negative electrodes are modeled as being coated on aluminum and copper current collector foils of 20 µm and 10 µm thickness, respectively. For our default cell design, we define a maximum cell thickness of 10 mm with cathode dimensions of 105 × 145 mm and packaging foil thickness of 1 mm. Using these default parameters leads to simulation of full cells with approximately 85 to 100 Wh energy and a capacity ranging from 19.05 to 27.23 Ah. Details can be seen in Table 1. This is comparable to a typical industrial 96 Wh PHEV pouch cell at 3.7 V, depending on which cell chemistries are used [22].

Table 1.
Key cell parameters from CellEst.
For the determination of the full costs of CAMs, it was important to include both material costs and preparation costs. Raw material prices were gathered through the London Metal Exchange and metalary.com database. Material costs were based on stoichiometric assumptions regarding the CAMs themselves. The CAM material and processing costs are calculated in the Cathode Cost Calculation component of the model. According to various sources, approximately 60 to 80% of the full costs of CAMs are based solely on raw material prices [37,40,41]. To begin, we calculate the molar masses of each CAM using available raw material molar masses. Component mass per cell information from the Cell Model sheet allows for subsequent calculation of raw material mass per cell. We then add a process cost fraction to the raw material prices, which accounts for approximately 30 to 40% of the total CAM costs depending on the specific cell chemistry. According to research by Petri et al., it was determined that processing costs for established CAM technologies were unlikely to decrease further over time and that the change in production cost would be based on changes in raw material pricing and economies of scale but not due to further learning curve effects [27,42]. Thus, on the same sheet, these process costs are used for an economy of scale simulation using a standard logarithmic curve approach. We assume that the maximum possible CAM process cost savings due to upscaling are 50%, reaching such a point when comparing a 1 GWh small production factory with a 35 GWh mass production factory. This savings factor is also modifiable by the user.
The Cathode Cost Calculation sheet is followed by the Raw Material Costs component of CellEst. On this sheet, we provide the user the ability to enter a specific price per kilogram of raw or secondary material as well as anode used. In creating this sheet, we collected cost values from a wide variety of sources. We offer these values along with their respective sources to the user, along with an input box that they can use to input their own data if they choose not to use that which we have provided. Default values are provided if such customization is not desired. In combination with the kilogram-based processing cost from the Cathode Cost Calculation sheet, the data is used to calculate the material prices per cell for each cell chemistry in the Component Costs module using a “kilo-costing” method, the fundamentals of which were developed by the US Air Force in order to directly connect aircraft component masses to costs [43].
The Component Costs module is the last core section of CellEst. Data from all three previously outlined modules is used together to calculate the costs per cell of the CAM material, CAM processing, anode, and secondary materials in USD per kWh for each cell chemistry. Following a similar method as for the processing-related portion of the CAM cost, we use a logarithmic curve approach to calculate the prices for the aforementioned three different economy of scale scenarios (small, medium, and mass production). However, the methodology used is distinct, following the need to address material and processing costs separately due to their fundamentally different underlying economics. We expect cost savings in this area through dynamic and static effects such as improved efficiency in logistics, general operations management, long-term supplier contracts with bulk pricing discounts for materials, and the full utilization of production lines [44]. We expect this savings factor, however, to be smaller than the one for process costs, maximizing at 30% when comparing small and mass production volumes. This assumption is in line with numbers referencing the Tesla Gigafactory in Nevada [30]. These scaling numbers are also comparable with the economies of scale approach given in existing, widely adapted models, such as BatPaC. A final, comprehensive cell cost overview for the 1 GWh production scenario is given on the bottom of the Cell Model sheet. This overview includes combined CAM cost, anode cost, and secondary materials cost in USD per kWh, as well as the contribution percentage of each component to the total cell cost.
3. Battery Cell Performance and Costs Comparison
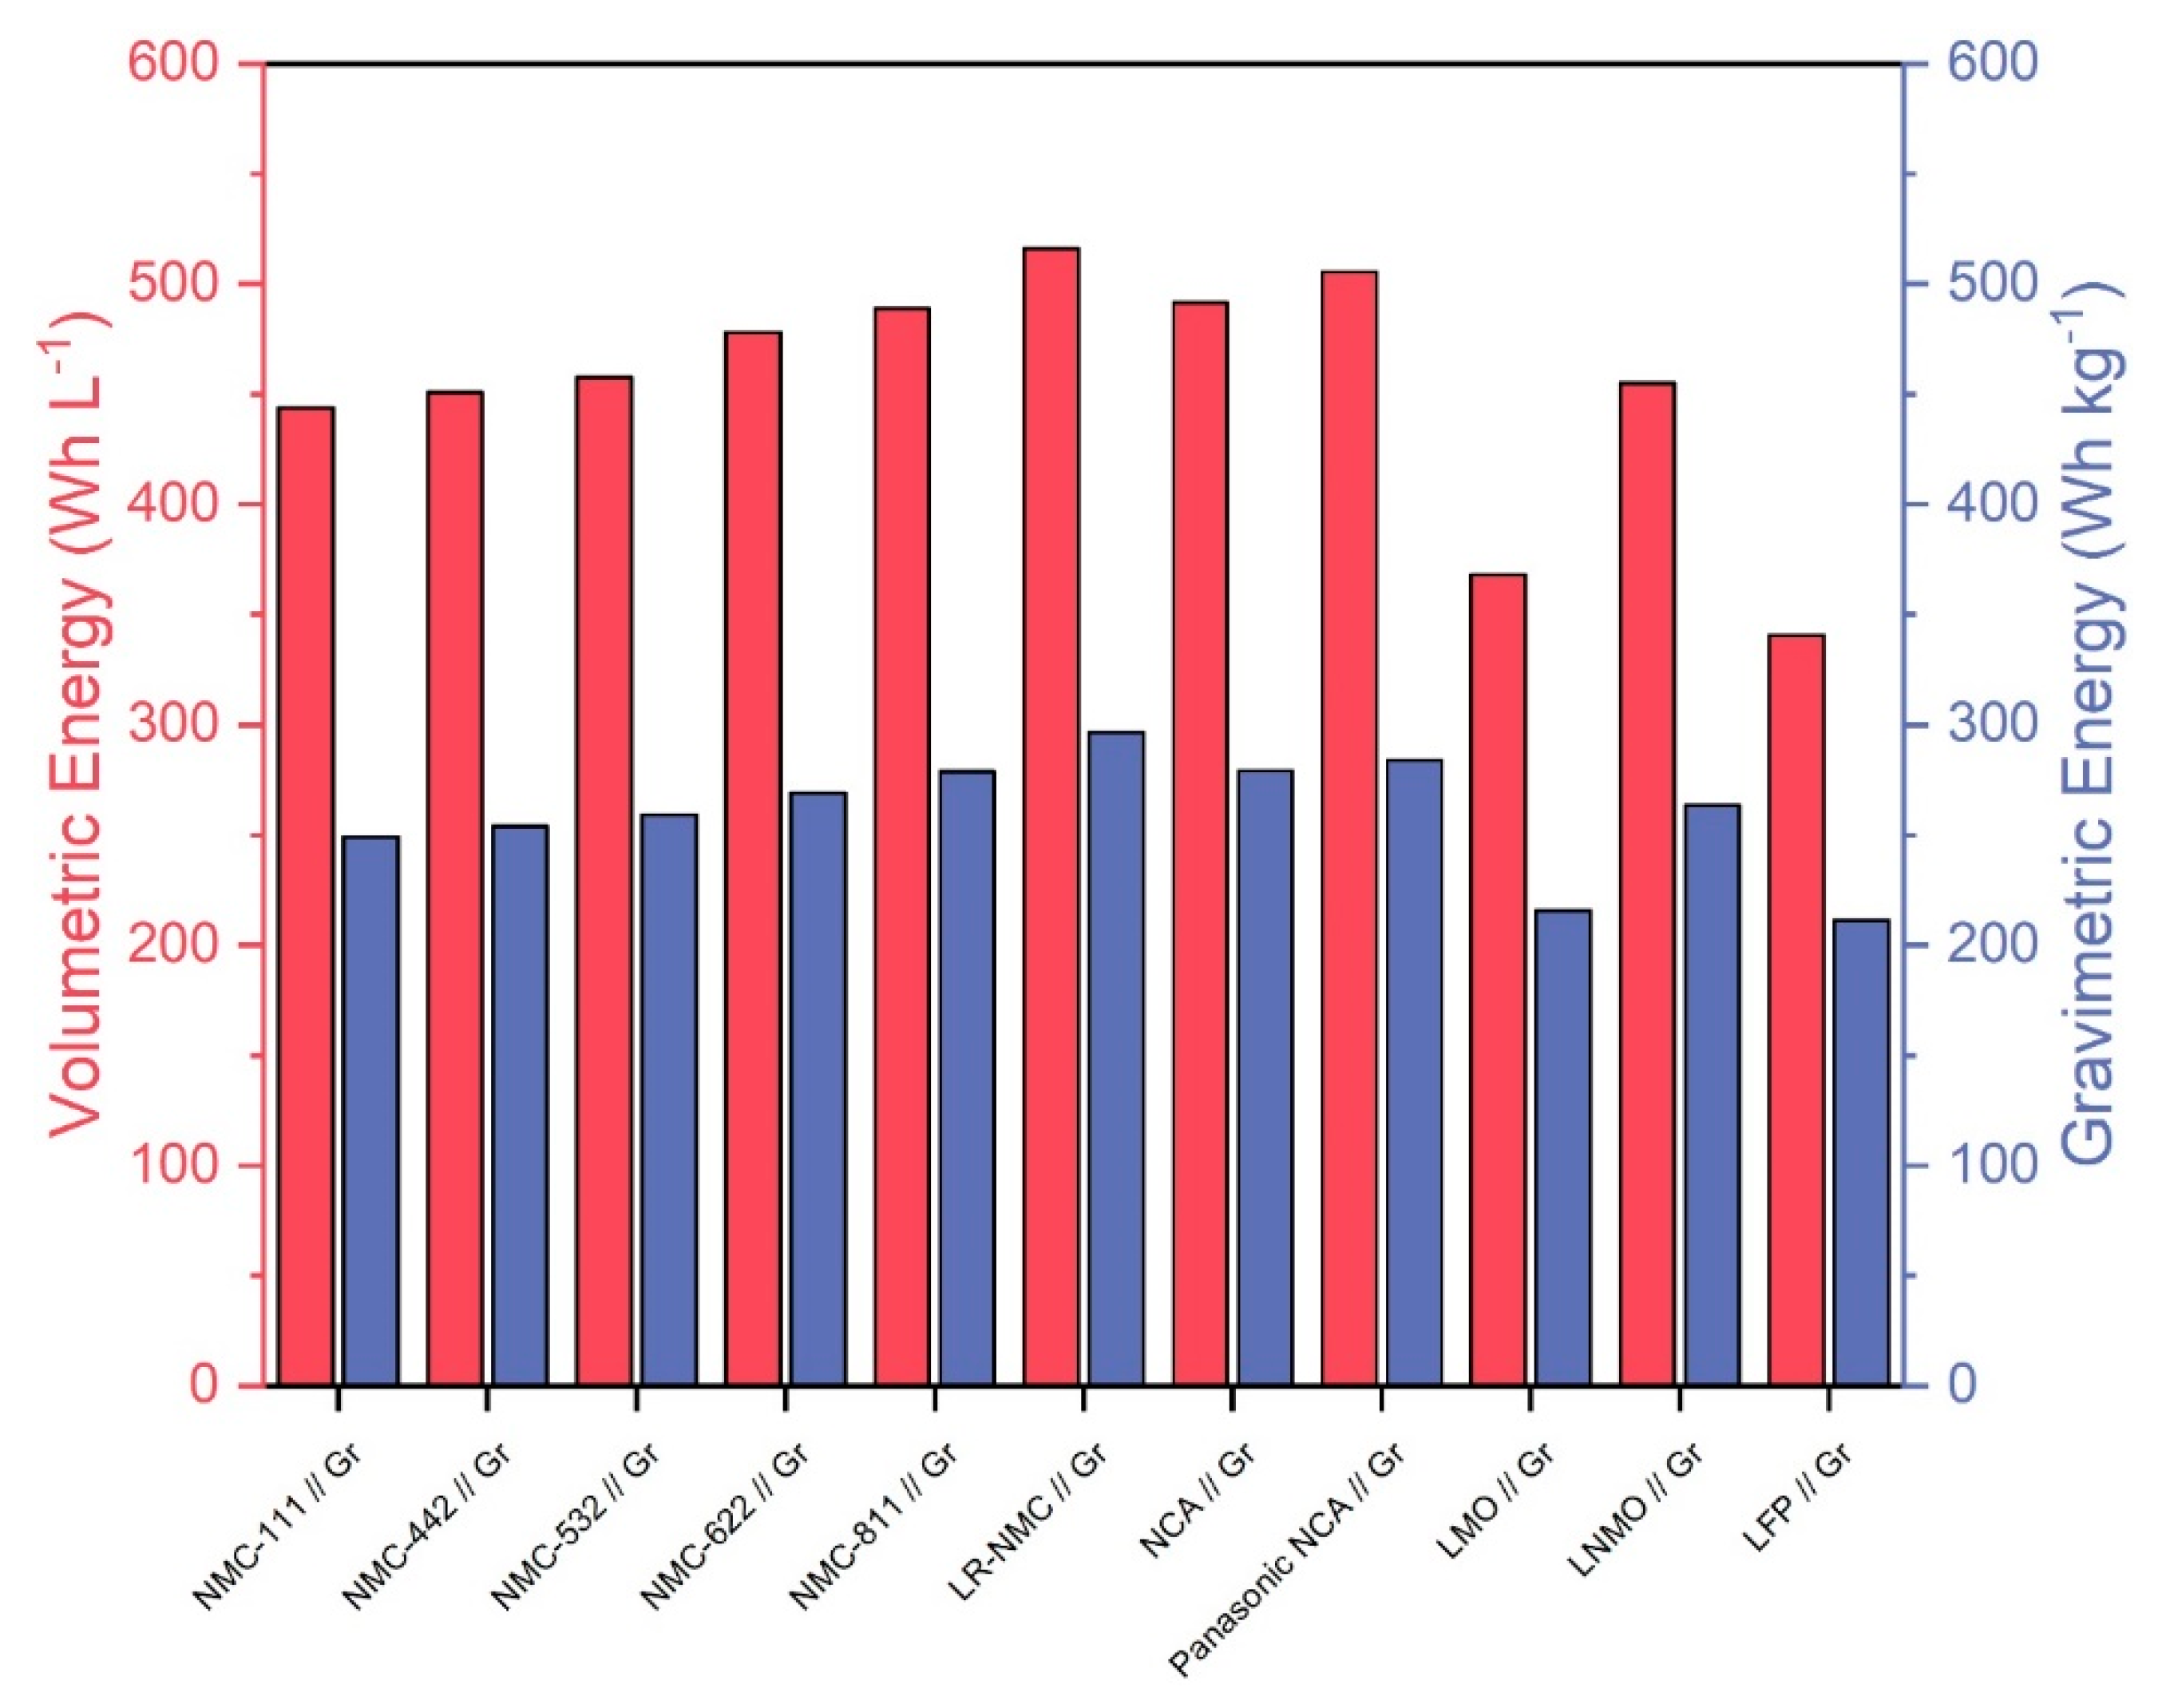
Figure 2 shows volumetric and gravimetric energies of the ten cell chemistries. Also included is a Panasonic NCA cell in which the overall cobalt content was reduced by around 60% relative to a standard NCA cell chemistry between 2012 and 2018 [45]. We thus estimate that the Panasonic cell chemistry consists of approximately 3% cobalt and 55% nickel instead of the 9% cobalt and 49% nickel of standard NCA chemistry. In the case of NMC, increasing the nickel content while decreasing the cobalt content increases the discharge capacity and energy [46], leading to increased performance and decreased material costs relative to standard NMC chemistry. We assume that this relationship also applies to NCA, meaning that the Panasonic NCA cell would have increased discharge capacity and performance relative to standard NCA. This makes it an interesting cell chemistry to compare with other, more established chemistries. Overall, lithium-rich NMC, NMC-811, and NCA seem to be the most promising technologies in terms of energy densities. The Panasonic NCA cell chemistry shows slightly increased energy densities compared to standard NCA, indicating an improvement over the traditional technology. All calculations were based on CellEst default parameters.
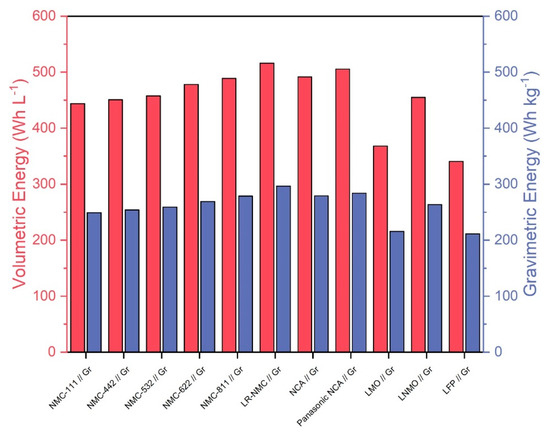
Figure 2.
Volumetric energy in (Wh L−1) based on used material volume and gravimetric energy in (Wh kg−1) of the 10 considered cell chemistries plus the Panasonic NCA Use Case.
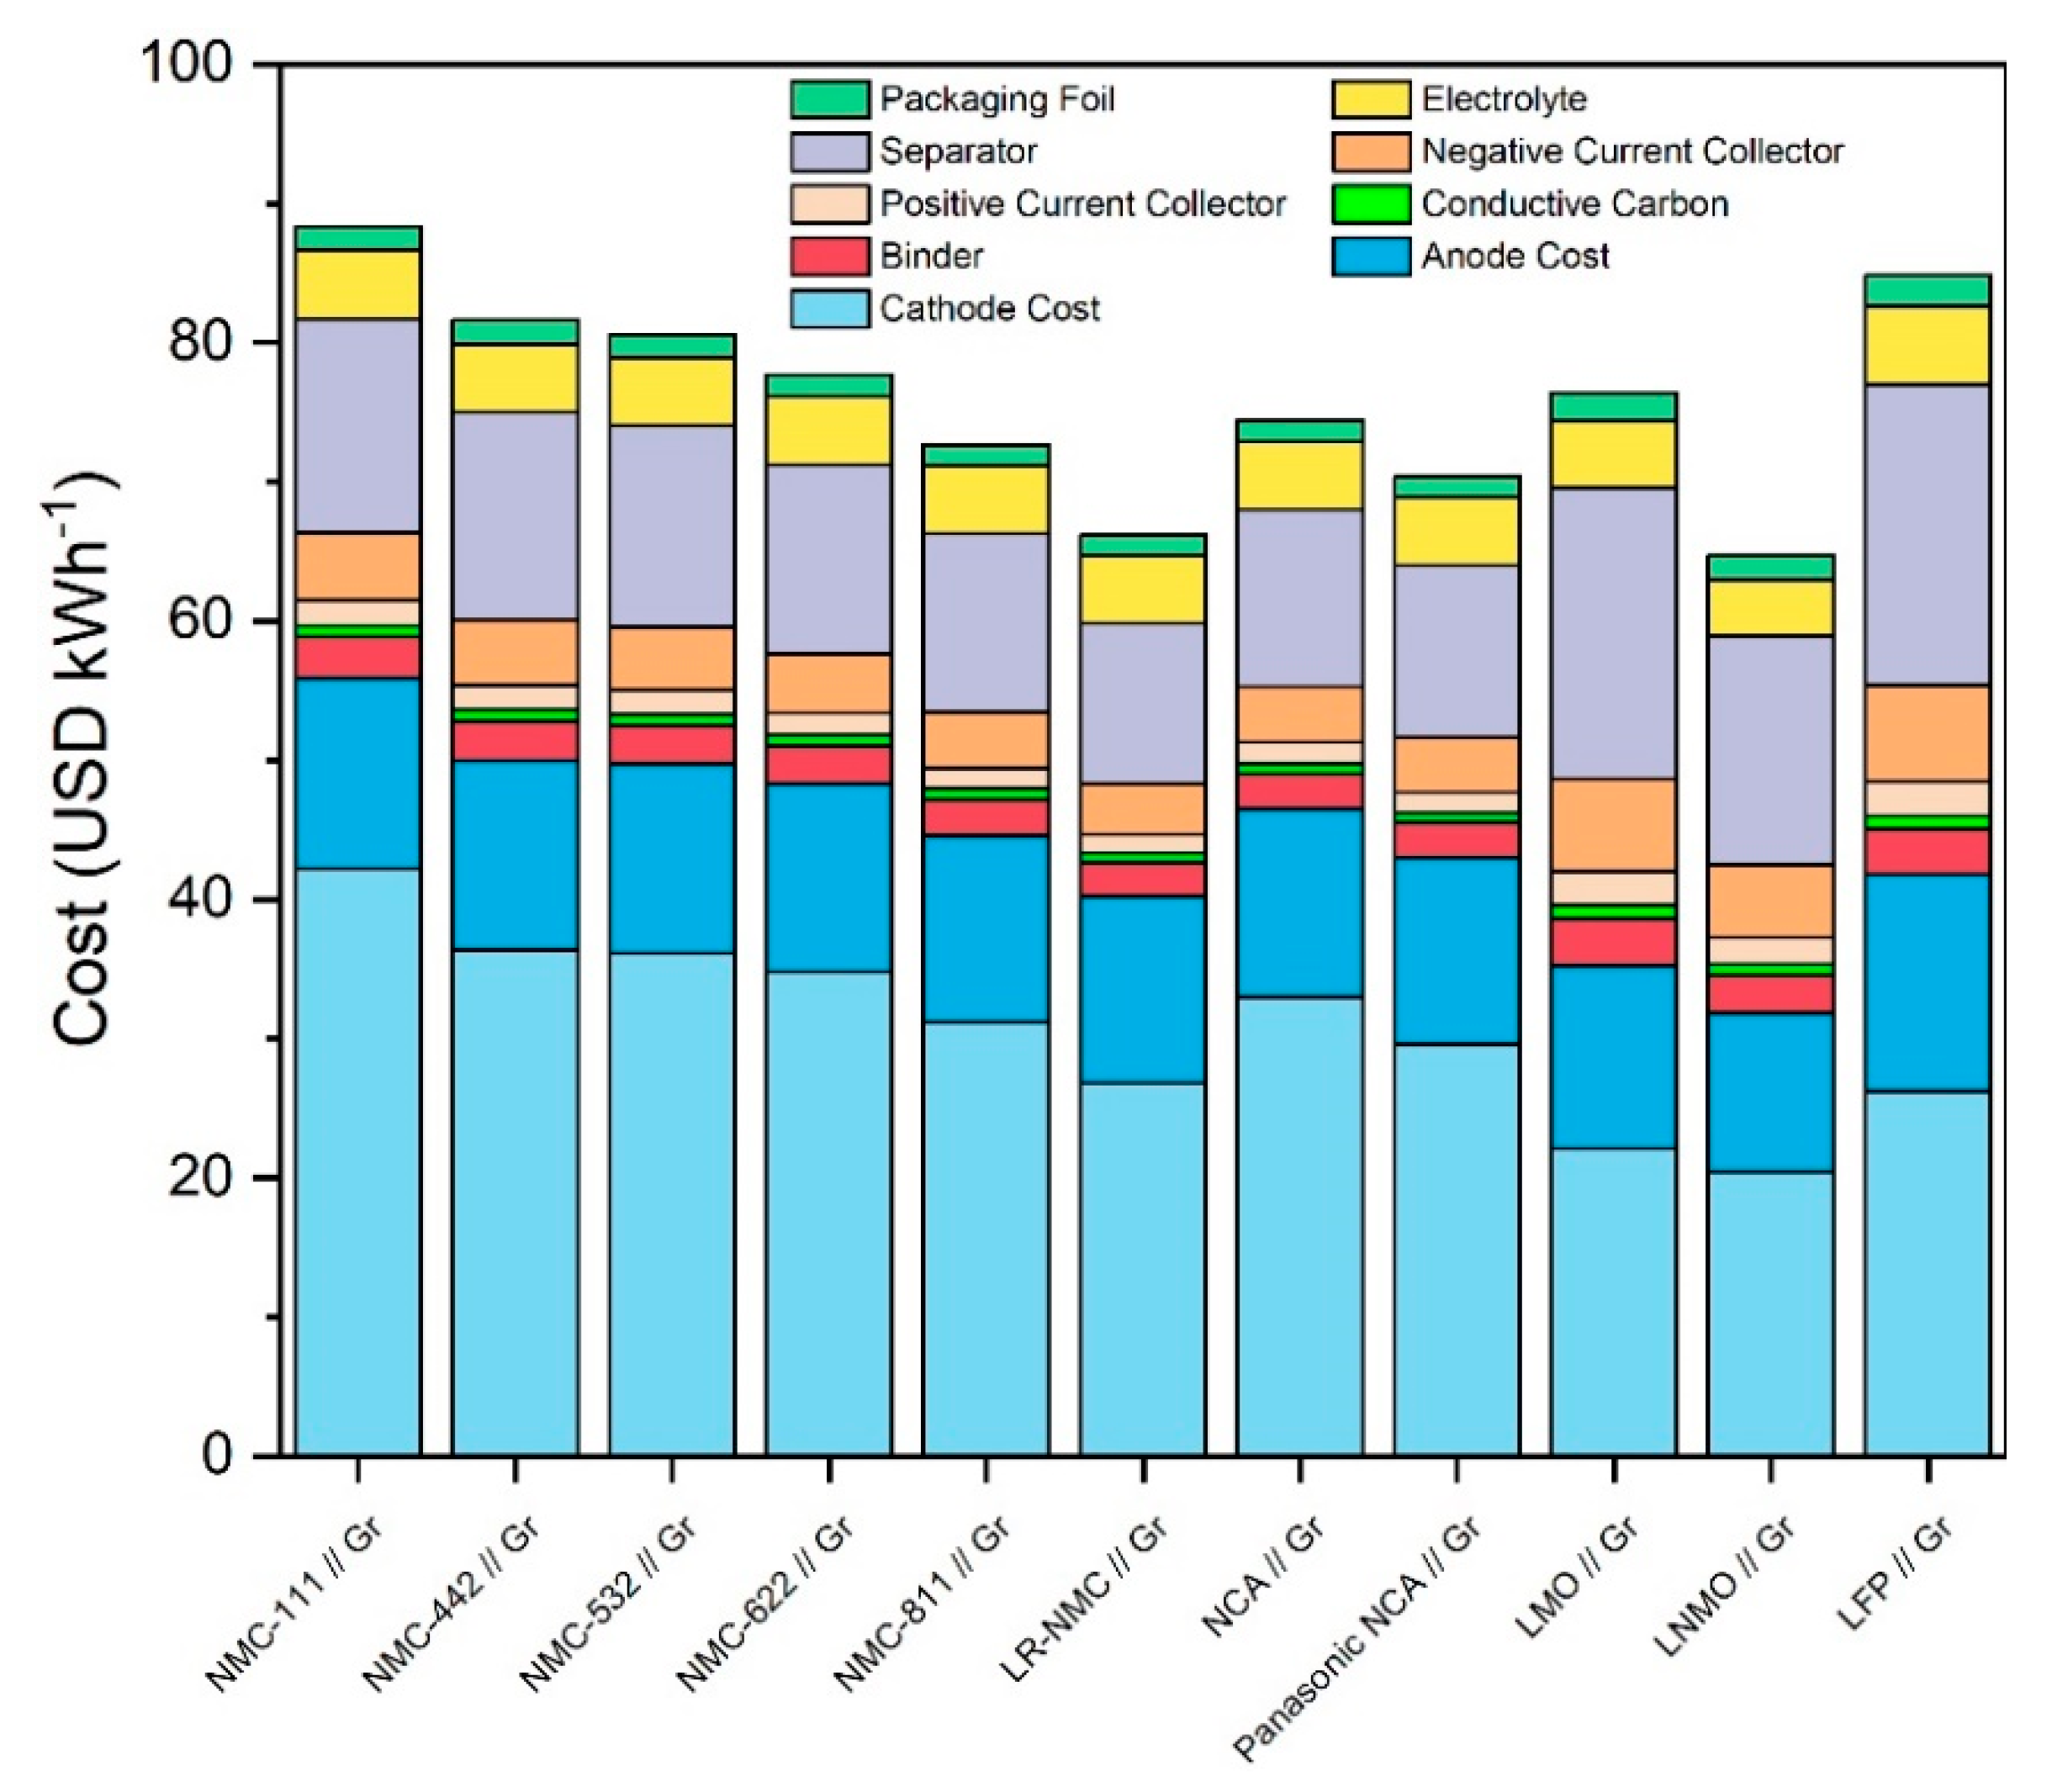
Figure 3 shows the total material costs of all ten cell chemistries in USD per kWh. In this figure, the “Cathode Cost” price component consists of cathode raw materials costs as well as processing costs in order to make it comparable with other models which use a single price for CAMs. From this figure, it can be seen that lithium-rich NMC, NMC-811, NCA, and LNMO are the least expensive and thus most economically promising cell chemistries. The Panasonic NCA cell is approximately 4 USD kWh−1 cheaper than the standard NCA chemistry per cell. In a 35 GWh mass production scenario, approximately 360 million Panasonic NCA cells are produced, and so even a relatively small price decrease of 4 USD kWh−1 can have a large impact on a manufacturer. Another interesting relationship can be seen between LNMO and LMO, where LNMO has a lower price and higher energy densities relative to LMO. Both of these technologies contain no cobalt. In the case of LNMO, this lack of cobalt combined with high energy densities leads to a low cost. Specific and volumetric capacities versus Li/Li+ of the LMO cell chemistry are too low to yield a strong economic performance relative to the other cell chemistries in the same way.
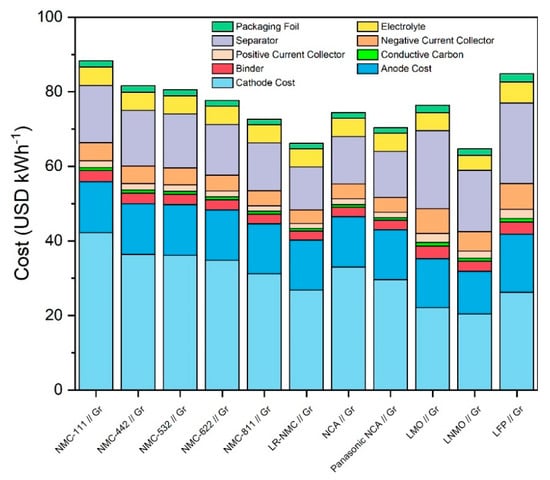
Figure 3.
Total material costs of all 10 considered cell chemistries plus Panasonic NCA Use Case differentiated in combined CAM cost, anode cost, and secondary material costs.
Several possible strategic paths could be chosen concerning these cell technologies. The first would be to continue optimizing and improving NCA technology. As shown by the Panasonic example, further improvement is indeed possible. A second way would be to further increase the nickel content in NMC while further decreasing cobalt. NMC-811 is not currently implemented on an industrial level nor is it yet used in mass produced goods, so this path may be less certain than continuing the development of established NCA technology. A third path is the development of lithium-rich NMC material. By increasing the lithium content from 7% to around 10%, it is possible to make it the least expensive NMC material in regard to material costs. A fourth path would be to focus on LNMO materials where cobalt is completely absent and thus the material cost is low, although the energy densities are not as high as, for instance, NCA or LR-NMC. Furthermore, the use of composite CAMs mixing LMO with NMC and/or NCA has been documented to increase rate capability and lower costs. It is thus possible that similar composites made with LNMO instead of LMO could further improve these CAMs [47].
4. Average Cathode Active Material Price Trends
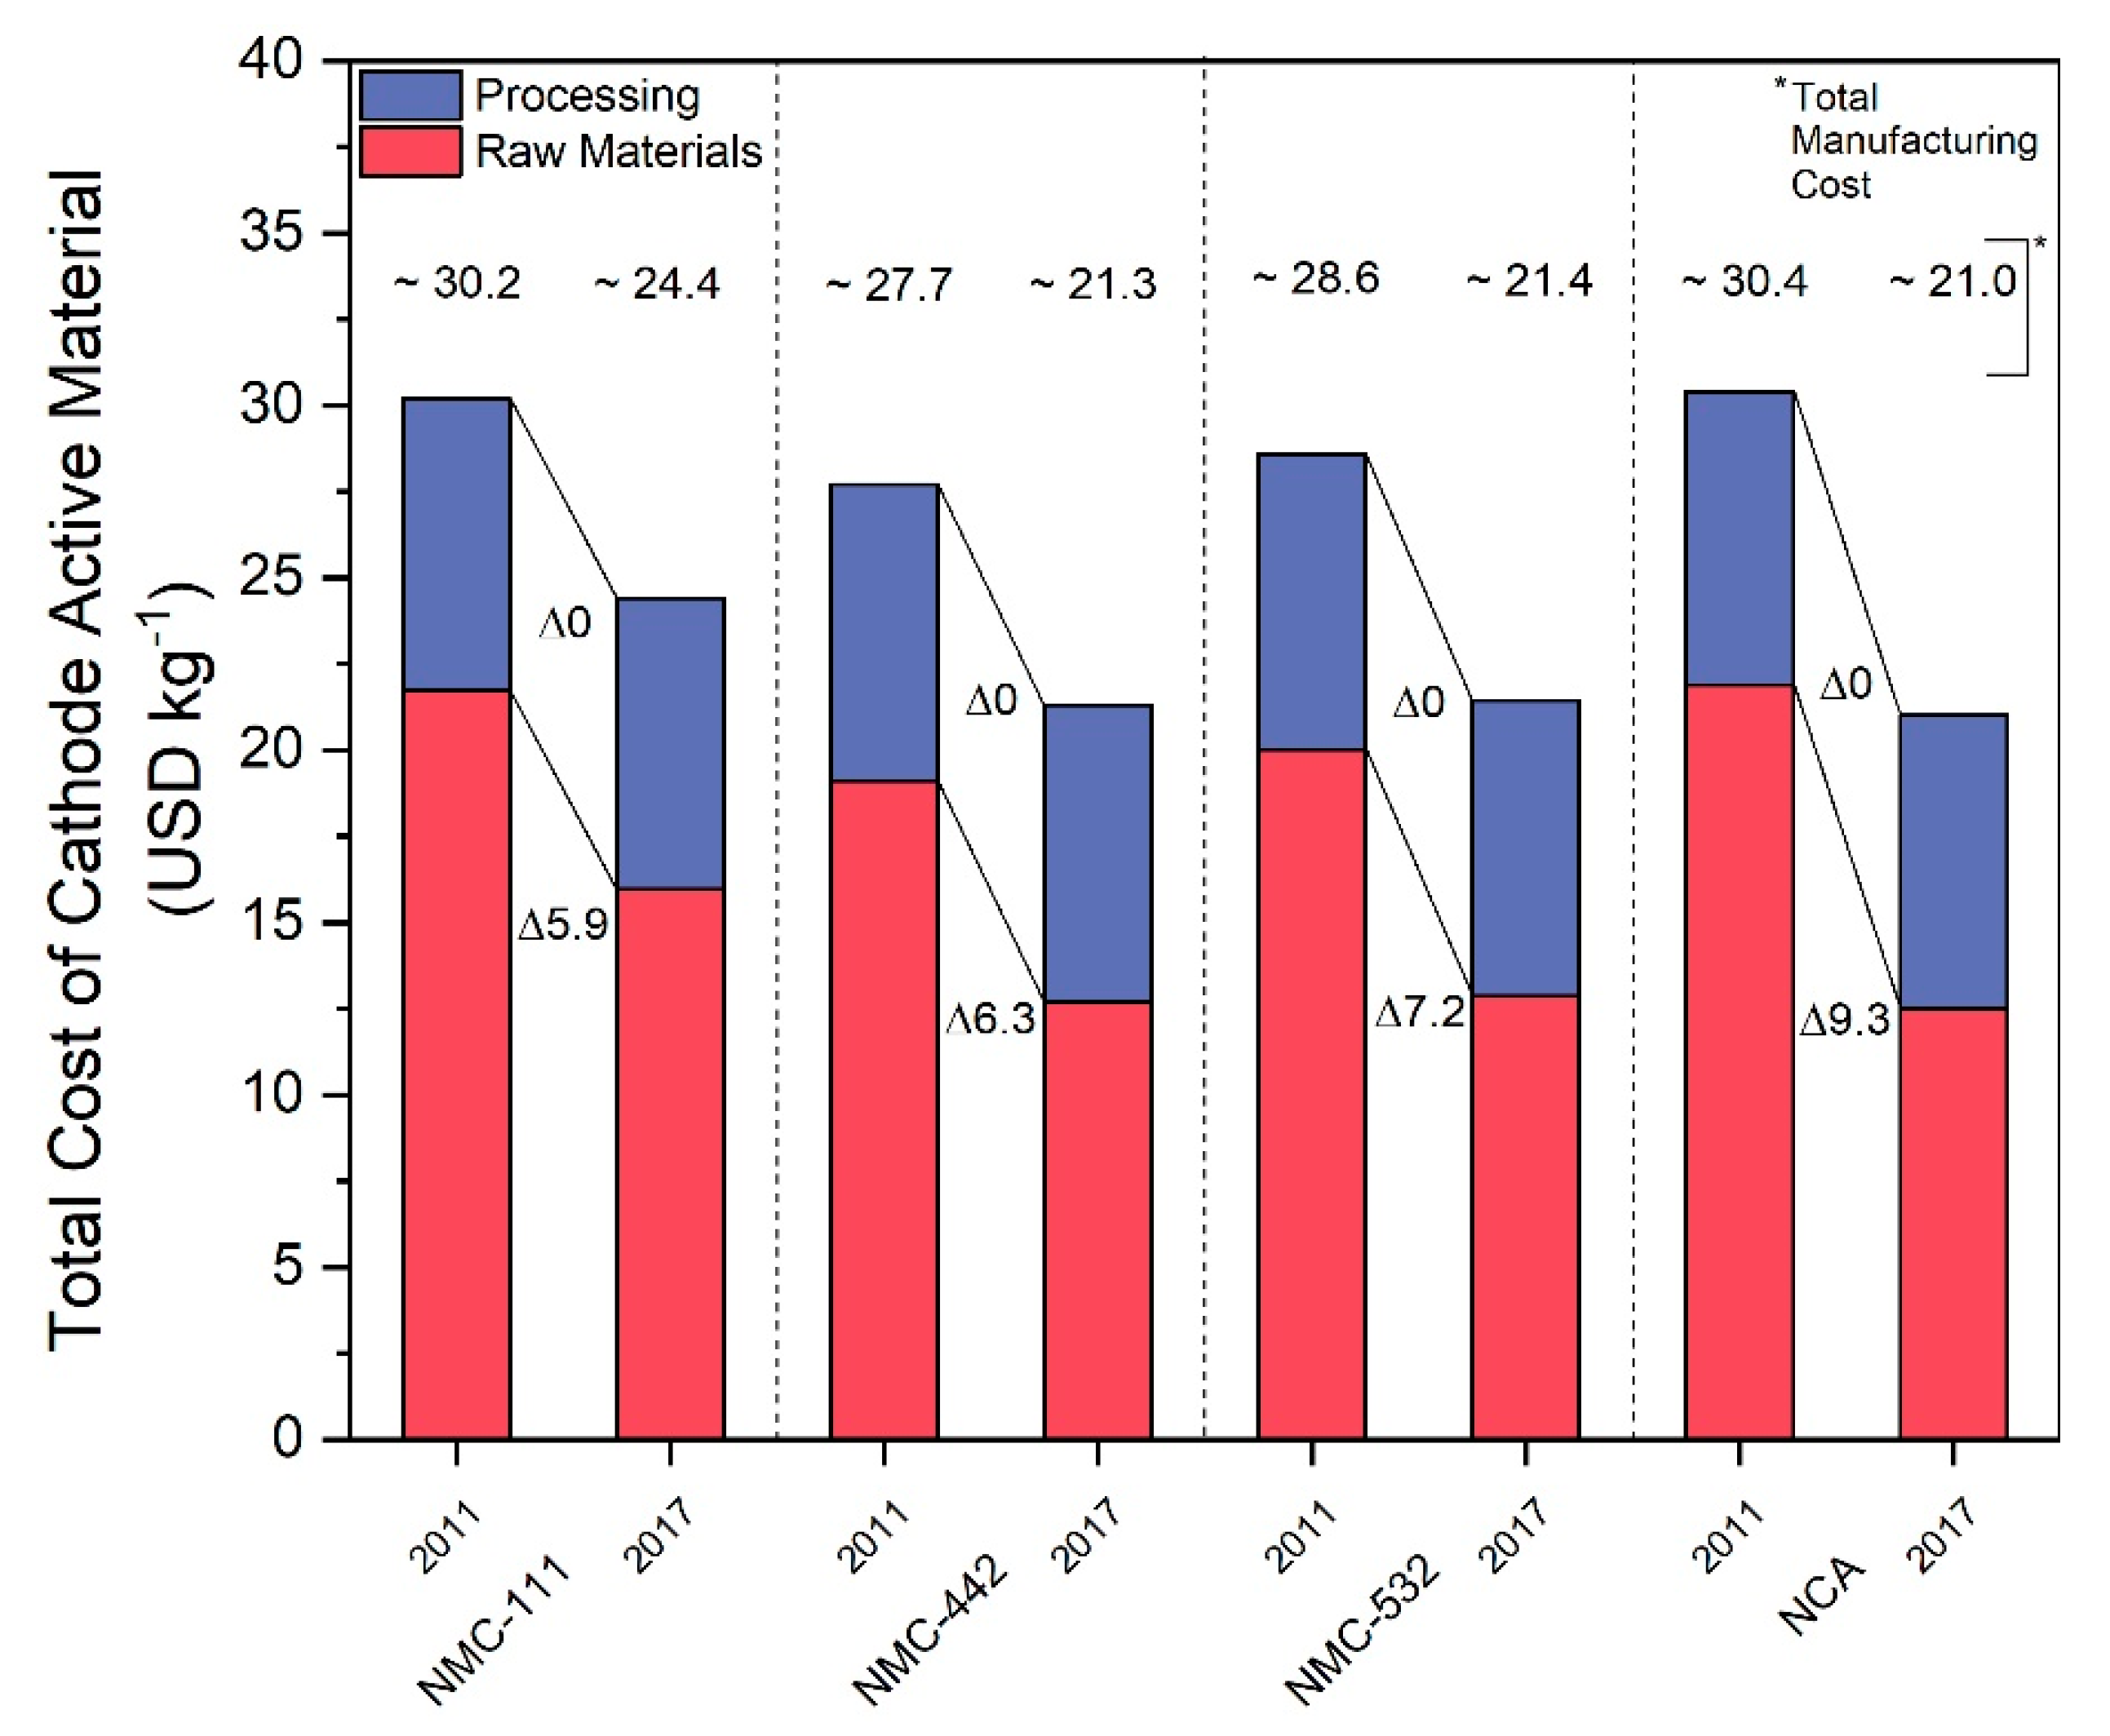
In order to demonstrate potential uses of our model, we examined the effects of real-world raw material price fluctuations on the costs of finished CAMs. First, a comparison of battery CAM prices from 2011 and 2017 was made in order to show historical trends. The 2011 data was collected from analysis made by Roland Berger Strategy Consultants in 2012. In this analysis, Roland Berger gave total manufacturing costs of different CAMs as well as a breakdown of the components of these total costs. We grouped these components into two categories: raw materials and processing costs. This process was performed for four different CAM technologies: NCA, NMC-111, NMC-442, and NMC-532. These were chosen due to the presence of nickel and cobalt, the two metals chosen as the focus of this analysis. Other technologies were included in the Roland Berger analysis but omitted from our analysis for various reasons. LCO was omitted due to its high cost and status as a technology attracting less attention over time. HCMA and HV spinel technologies were omitted due to their status as future technologies, making their incorporation into our model unfeasible. The breakdown for the 2011 prices of these technologies can be seen in the first column of each section of Figure 4. According to research by Petri et al., it was determined that processing costs for established CAM technologies were unlikely to decrease further over time and that the change in production cost would be based on changes in raw material pricing and economies of scale but not due to further learning curve effects [42]. Based on this, we assumed that CAM processing costs would not have changed between 2011 and 2017. We then used the average raw material prices from 2011 and 2017 as given by metalary.com and input them into our model to estimate the change in the raw material price component of these CAMs. This was combined with the static processing costs to construct the 2017 cost breakdown and estimate the 2017 total manufacturing costs shown in the second column of each section of Figure 4.
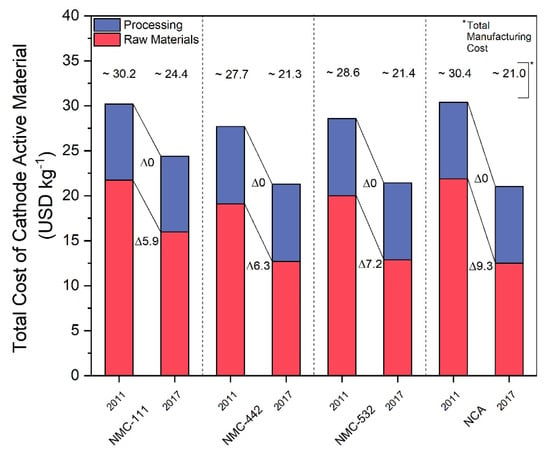
Figure 4.
Comparison of cost breakdowns of NCA, NMC-111, NMC-442, and NMC-532 cathode active materials into raw material and processing costs between 2011 and 2017. Delta values indicate change in USD kg−1 per cost fraction. 2011 data adapted from [22].
Figure 4 thus shows pricing breakdowns and trends on several key CAM technologies from 2011 to 2017. It can be seen that the raw material prices make up the bulk of the total manufacturing costs for each technology, contributing at least 60% of the total costs in each case analyzed. Furthermore, the costs of each technology decreased over the period from 2011 to 2017, some more substantially than others, reflecting the decrease in price of cobalt and nickel over this same time period, as seen in Table 2. Such data has been cited repeatedly in literature in recent years as support for forecasts predicting steadily decreasing overall CAM costs. The March 2018 London Metal Exchange (LME) data, however, also seen in Table 2, shows that prices would not continue to decrease indefinitely, and would in fact increase significantly.

Table 2.
Relevant raw material prices over time.
It is important not only to validate different battery CAM materials in terms of performance, but also based on the economic stability of their constituent raw materials. Raw material prices have a large and direct impact on the manufacturing costs of CAMs and thus complete lithium-ion batteries as well. To compare different CAM technologies, it is therefore important to examine both historical information and current developments regarding the overall supply. For instance, factors such as political instability, dwindling of resources, or the occurrence of monopolies can create supply risk and strongly affect cost stability [48]. In 2010, the European commission installed the Ad-Hoc Working Group on Defining Critical Raw Materials for the European Union, which has since identified 27 raw materials as critical [49,50,51]. Among these is cobalt, which, as described earlier, is currently used in most lithium-ion CAMs [51]. In fact, roughly 50% of the world’s produced cobalt is used in rechargeable batteries [52]. This is complimented by findings from an OECD study and the Critical Materials Strategy by the US Department of Energy [53,54,55]. While demand for cobalt is predicted to increase over the next years, two-thirds of the world’s supply is sourced from the Democratic Republic of the Congo, a politically unstable and corrupt country that uses child labor and environmentally damaging methods of extraction and processing. The country also plans on doubling its tax on cobalt [56,57,58]. Accordingly, we calculated the global supply concentration (GSC), an index ranging from 0–100 that puts a numerical value on supply concentration, of cobalt to be 82 as of 2016, a number that indicates a high level of concentration [59]. Overall, there is thus a forecasted decrease in cobalt availability as well as an already noticeable price increase [60].
An interesting case is that of the EU, where the most important external cobalt supplier is Russia, accounting for 91% of imports, while the Congo only contributes 7%. However, 66% of cobalt used in the EU is sourced from Finland, with only 31% from Russia and less than 3% from the Congo. Having a source of cobalt within the EU thus insulates it from some of the effects of political instability in other regions of the world. This does not change the fact, though, that the world as a whole is still largely dependent on such regions for its cobalt supply. While having an EU member state as a source of cobalt is beneficial to the EU, it does not solve all of its problems related to cobalt. For instance, the End-of-Life Recycling quote in 2017 was at 0%, meaning that none of the cobalt sourced for EU use was from recycled sources [51]. As cobalt is also a finite resource, supply depletion is inevitable unless recycling methods are widely adopted and recycled cobalt is utilized throughout the value chain.
Nickel is not recognized as a critical material in the same manner as cobalt. In 2011, the US Department of Energy predicted that in 2015, availability of Nickel was expected to meet the forecasted global demand and would continue doing so into the future [53]. For the last decade, a majority of the world’s nickel has been produced in Canada, Russia, Australia, and Norway. This less centralized supply results in a lower calculated GSC of 59. However, nickel is becoming increasingly dependent on supply from higher political risk areas such as Indonesia and Philippines, and prices have recently started to rise as demand begins to outstrip supply [61,62]. Nickel use also carries environmental costs, often heavily polluting the areas in which it is mined and processed [63]. While nickel can be viewed as a strategic substitute for cobalt in batteries in order to increase energy densities while decreasing price, it is thus important to be aware of potential future issues with nickel supply and to examine the effect that price fluctuations could have on the battery market.
5. Sensitivity of Cathode Active Material Price to Raw Material Prices
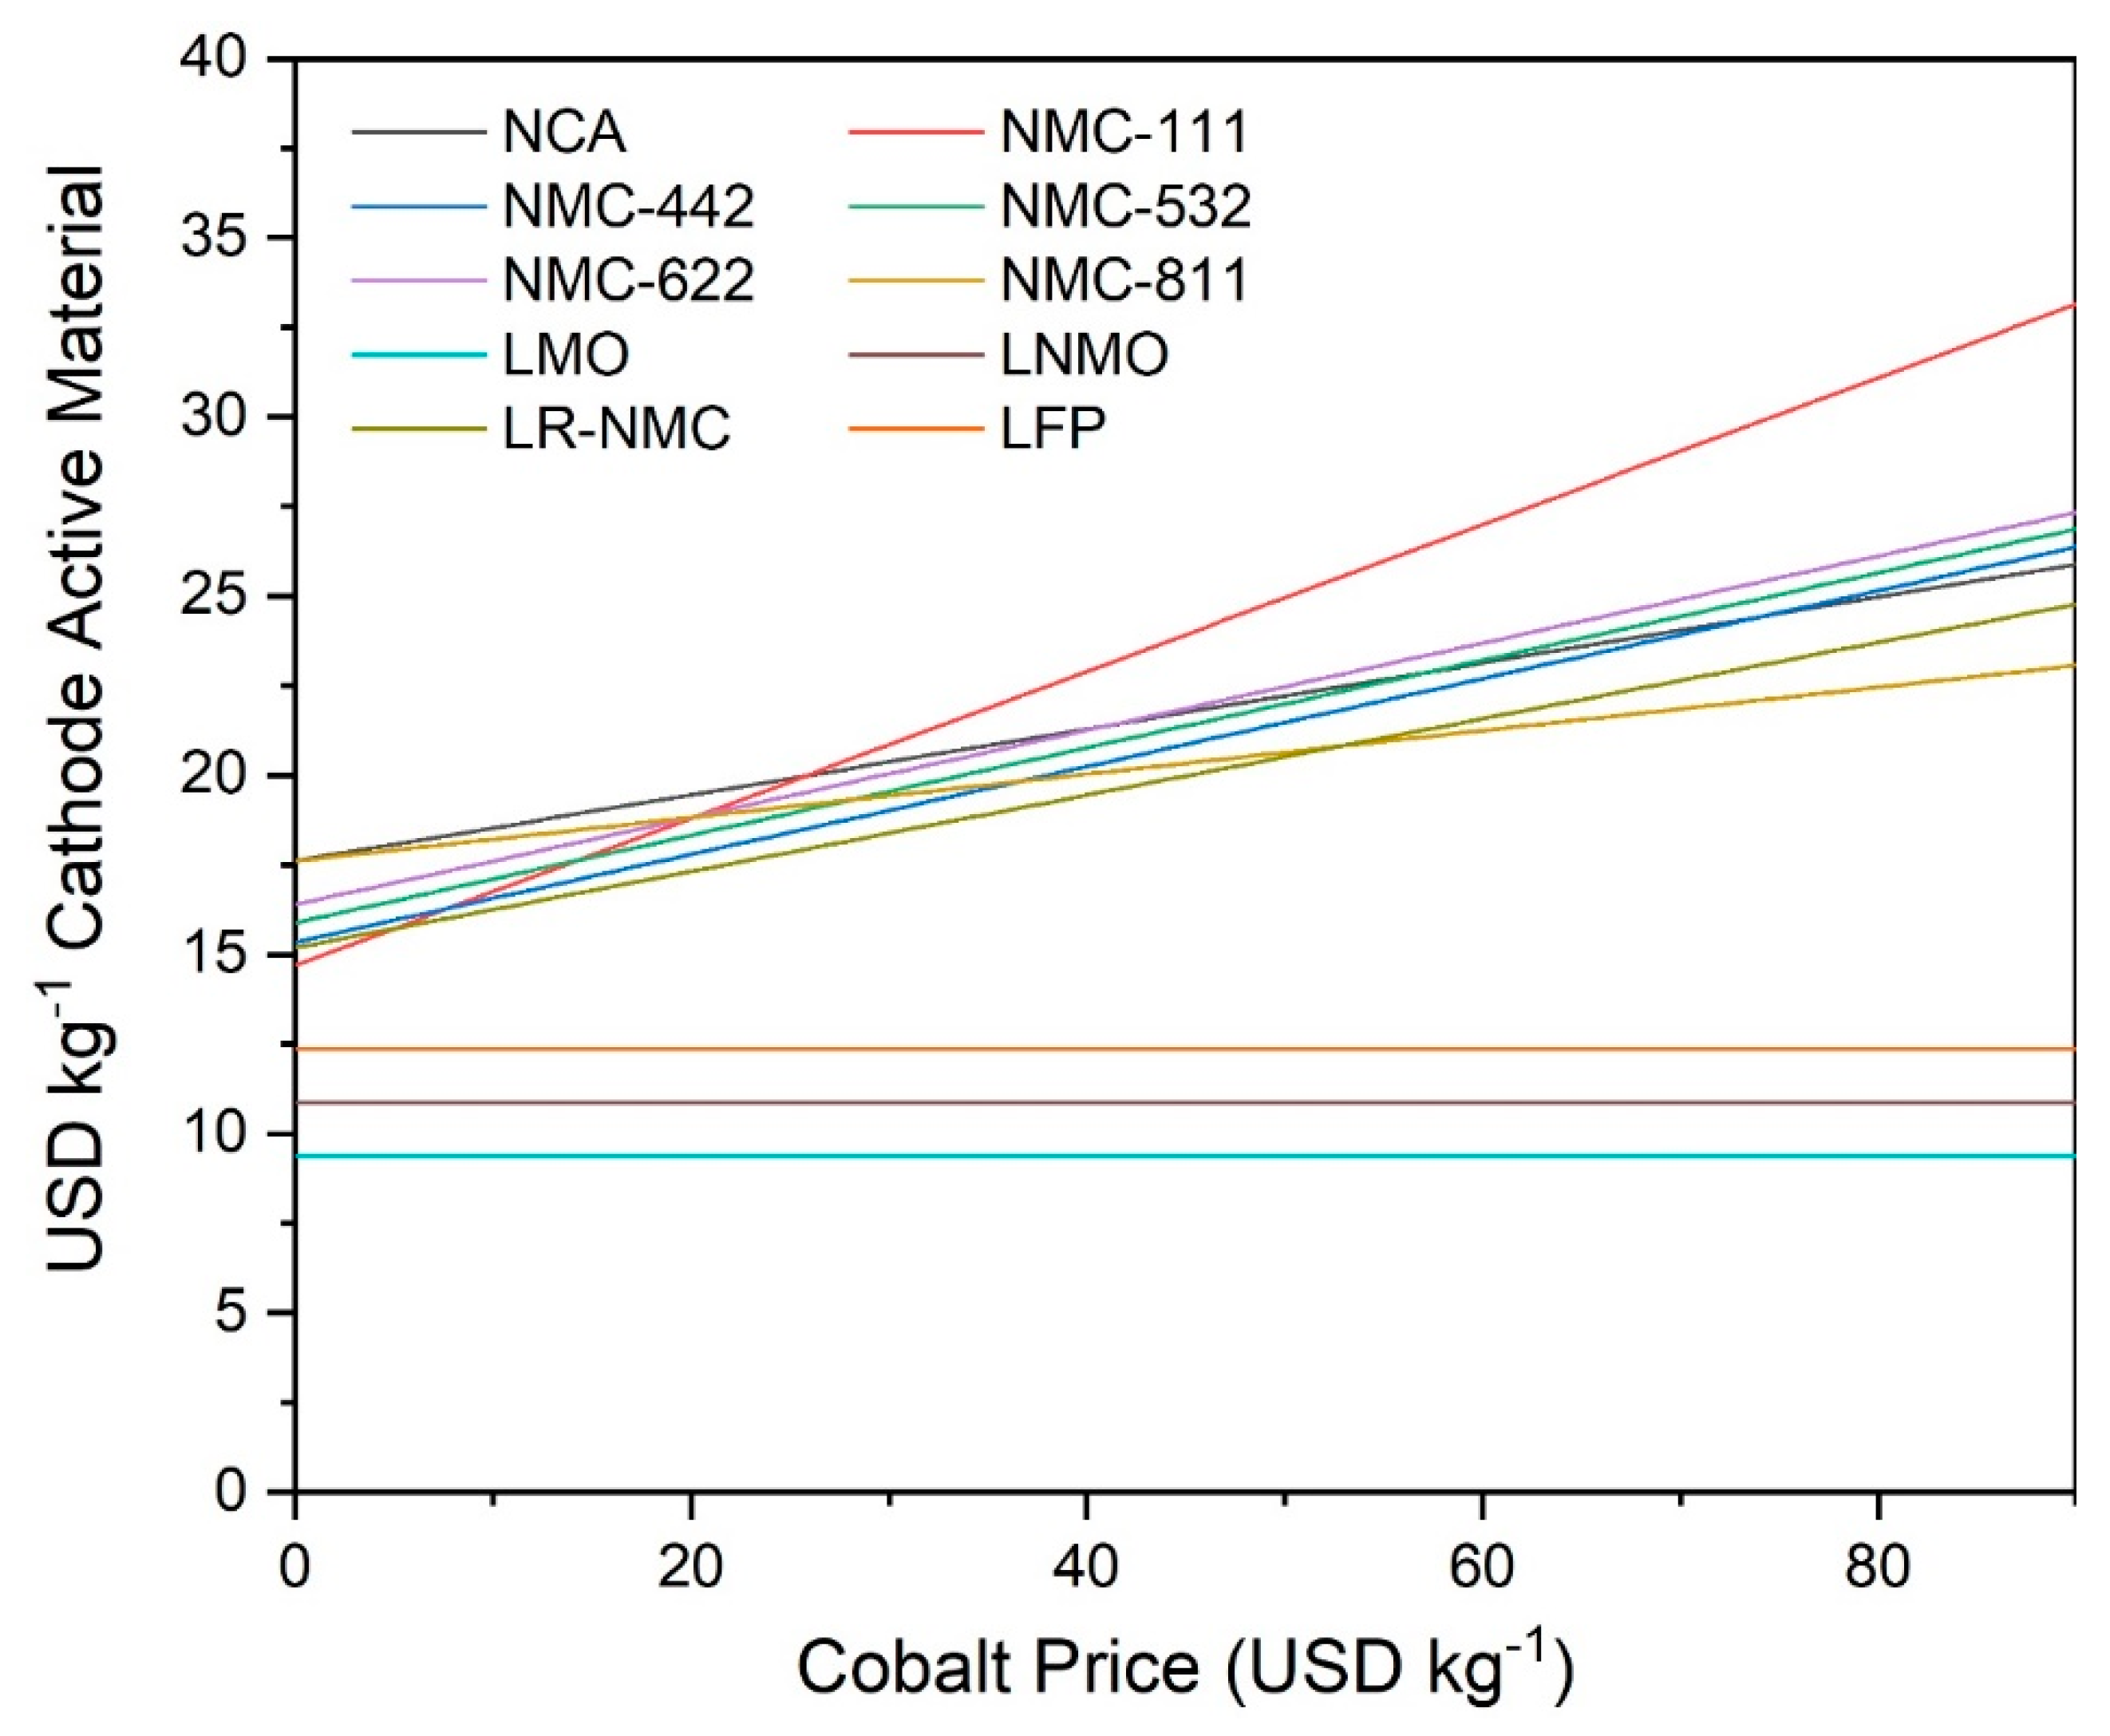
We next examined the sensitivity of CAMs to cobalt pricing by plotting the total manufacturing costs of NCA, NMC-111, NMC-442, NMC-532, NMC-622, NMC-811, LMO, LNMO, LR-NMC, and LFP technologies against a range of cobalt prices from 0 USD kg−1 to 85 USD kg−1. Total manufacturing costs in USD kg−1 were calculated by the input of raw material prices into our cost model. The results of this can be seen in Figure 5.
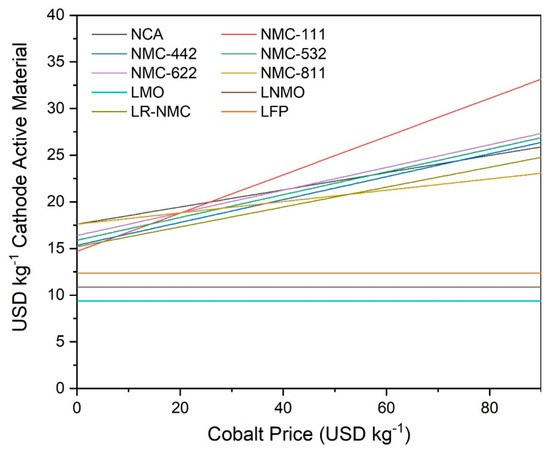
Figure 5.
Sensitivity of total manufacturing costs of NCA, NMC-111, NMC-442, NMC-532, NMC-622, NMC-811, LMO, LNMO, LR-NMC, and LFP cathode active materials to market price of cobalt from theoretical range of 0 USD kg−1 to 90 USD kg−1 as determined by battery cell and cost model.
Figure 5 shows several interesting trends that emerge when examining total manufacturing costs as a function of cobalt market price. All cobalt-containing CAMs are affected by cobalt price change, of course, and such a price change can affect the relative attractiveness of cobalt-containing technologies. For instance, at low cobalt prices, NMC-111 is the cheapest CAM by mass. However, it becomes the most expensive CAM at high cobalt prices. NMC-811, on the other hand, is one of the most expensive CAMs at low cobalt prices and the cheapest cobalt-containing CAM at high cobalt prices. This shows the dramatic effect that cobalt price can have on the total manufacturing cost of CAM technologies. LMO, LNMO, and LFP are the cheapest CAMs in this comparison due to their lack of cobalt.
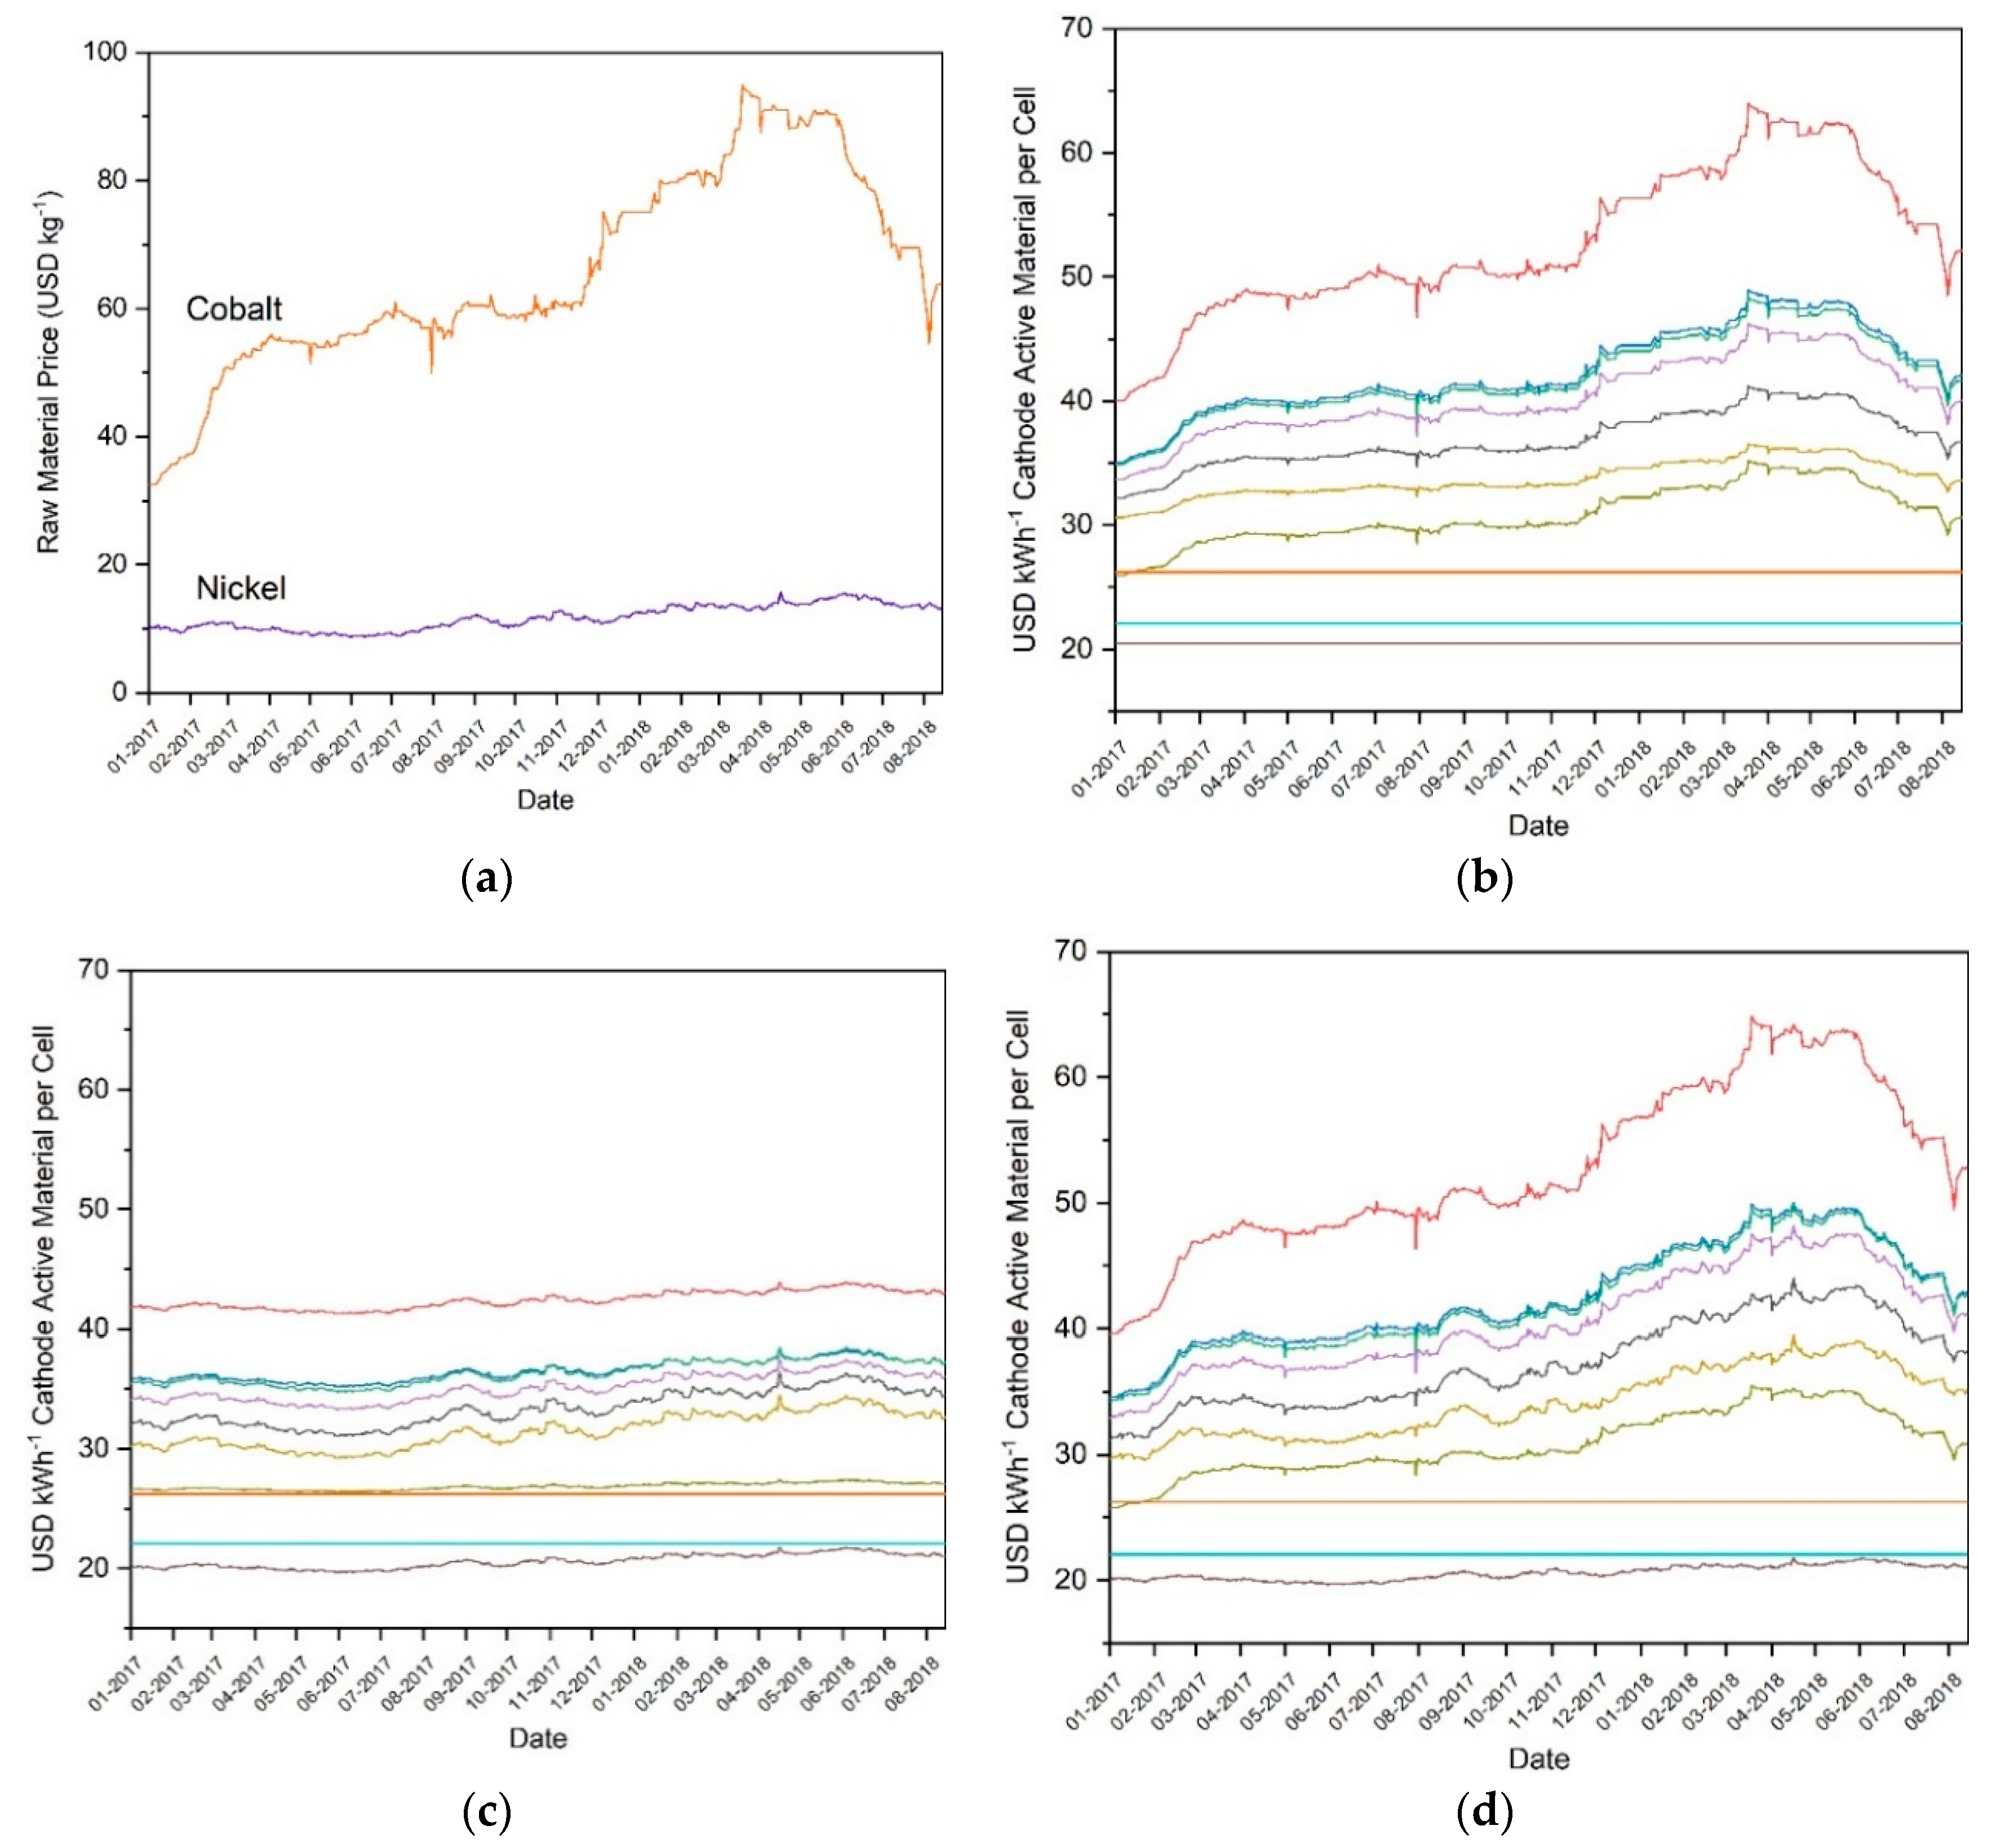
The effects of real-world metal pricing on the total manufacturing costs of CAMs were then examined. First, data was taken from the LME and used to plot the market price in USD kg−1 for cobalt and nickel as a function of date. The date range chosen was from Jan 01 2017 to August 17 2018. This means that pricing data for each day during this twenty-month period was collected. Next, the sensitivity of the total manufacturing costs of the CAMs in USD kWh−1 was analyzed based on the daily market price of cobalt. This was done by keeping the nickel value constant at the metalary.com 2017 average price per kg while inputting the daily LME price of cobalt into our model. The sensitivity of these total manufacturing costs to the daily market price of nickel was then analyzed by following the procedure described before, but keeping the cobalt price constant at the Metalary 2017 average and inputting the daily nickel price into our model. Finally, the sensitivity of these total manufacturing costs to the daily market prices of both cobalt and nickel was analyzed by repeating this same procedure but inputting the daily prices of both cobalt and nickel into our model.
Figure 6a shows that, despite the prices of nickel and cobalt falling from 2011 to 2017 as illustrated in Figure 4, these prices increased substantially during 2017 and the first quarter of 2018. Cobalt, in particular, nearly tripled in cost from approximately 35 USD kg−1 to approximately 95 USD kg−1. While cobalt prices have since decreased from this peak, the extent of this fluctuation nonetheless demonstrates that prices cannot be assumed to remain stable or decrease steadily. Figure 6b shows that this cobalt price fluctuation had a significant effect on CAM prices. LMO, LNMO, and LFP, being CAMs without cobalt, were unaffected by the fluctuating price of cobalt. All others increased and decreased substantially. The effect of the nickel price increase can be seen to be relatively modest, but still noticeable, in Figure 6c. The price of the examined CAM technologies fluctuated slightly, but without large price increases or decreases. CAMs containing a higher amount of nickel, such as NMC-811, were more affected by these fluctuations. Figure 6d shows the combination of cobalt and nickel sensitivity, and as such gives an approximation of the real-world prices of the CAMs by date. As mentioned earlier, lithium has been shown to contribute a very small percentage of the total cost, and manganese, while contributing up to nearly three times more by mass percent to the final CAM than lithium, has been less than one fourth of the price by mass since 2017, so both can be omitted and still obtain a reasonable estimate.
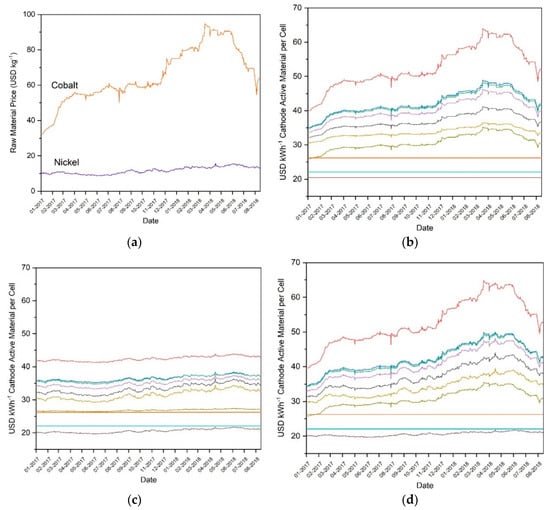
Figure 6.
(a) Real-world market prices of raw cobalt and nickel metal from 01-2017 to 03-2018, along with sensitivity of total CAM manufacturing costs to real-world market price of (b) cobalt, (c) nickel, and (d) cobalt and nickel during this same time window as determined by CellEst for NMC-111 (red), NMC-442 (blue), NMC-532 (green), NMC-622 (purple), NMC-811 (yellow), NCA (black), LMO (turquoise), LNMO (brown), LR-NMC (olive), and LFP (orange). Data from London Metal Exchange.
The price values for each CAM during January 2017 and March 2018 period were compared in order to assess the extent to which the prices changed as a percentage value. These two points were chosen due to containing the lowest and highest price values, respectively. The price change percentage can be seen in Table 3. Cobalt containing CAMs were most affected, with NMC-111 increasing in price by 63.56%, while CAMs containing minimal cobalt increased in price by a smaller margin, such as NCA, which increased 36.21%. LNMO, containing nickel but no cobalt, increased only 4.67%. LMO and LFP, containing neither nickel nor cobalt, experienced no price fluctuations and so are not included in the table. Taken together, this data shows that the price of cobalt is unstable, temporarily having more than doubled in the last year despite having decreased during the period from 2011 to 2017. This instability has a direct and substantial effect on the costs of CAMs. Thus, in order to protect battery technologies against large price fluctuations, it may be desirable for future CAM research to focus on technologies with minimal cobalt content.

Table 3.
Total price increase comparison of cathode active materials examined by CellEst from January 2017 to March 2018.
6. Battery Pack Cost and Comparison with Real-World Data
Through the implementation of electrical vehicles, governments and manufacturers of different countries strive to replace internal combustion engines to decrease their carbon dioxide fleet footprint and overall contribution to worldwide greenhouse gas emissions. Lithium-ion battery manufacturers are thus attempting to develop batteries with increased capacity and energy along with decreased costs. While the target cost for auto manufacturers defined by the US Department of Energy is 125 USD kWh−1 per battery pack, recent estimations in 2017 were around 145 USD kWh−1 per cell and 190 USD kWh−1 per battery pack [14,64]. For the Tesla Model S, estimations are at the lower end of the battery pack cost spectrum with a cost of around 190 USD kWh−1 per pack, which would also demonstrate the advantage of their NCA technology as discussed within this paper. On the upper end of the battery pack cost spectrum are vehicles such as the Chevrolet Bolt, containing a 60 kWh battery pack built with an NMC cathode. This yields an estimated pack cost of approximately 215 USD kWh−1 with the aforementioned cell cost of around 145 USD kWh−1. These examples indicate a 48% increase from cell costs to reach the pack costs used by auto manufacturers. However, these cost estimates are made by automotive insiders and experts without accounting for overhead or initial capital investment for production [14]. Despite this, it is possible to estimate that price is equal to cost in the case of Tesla, since the company’s Q2 2018 update states that the gross margin for the Model 3 has only recently turned positive [65]. Though the model itself is distinct from the Model S, Tesla standardizes its battery pack across all models, indicating that the finances for the battery fraction should be similar [45]. This indicates that, while these estimated costs may not always be fully accurate, they can still serve as approximate benchmarks for our cost calculations. Several sources indicate that the material cost fraction of the total manufacturing cost lies between 60 and 80%, with 66%, in particular, appearing to be a key number [37,40,41].
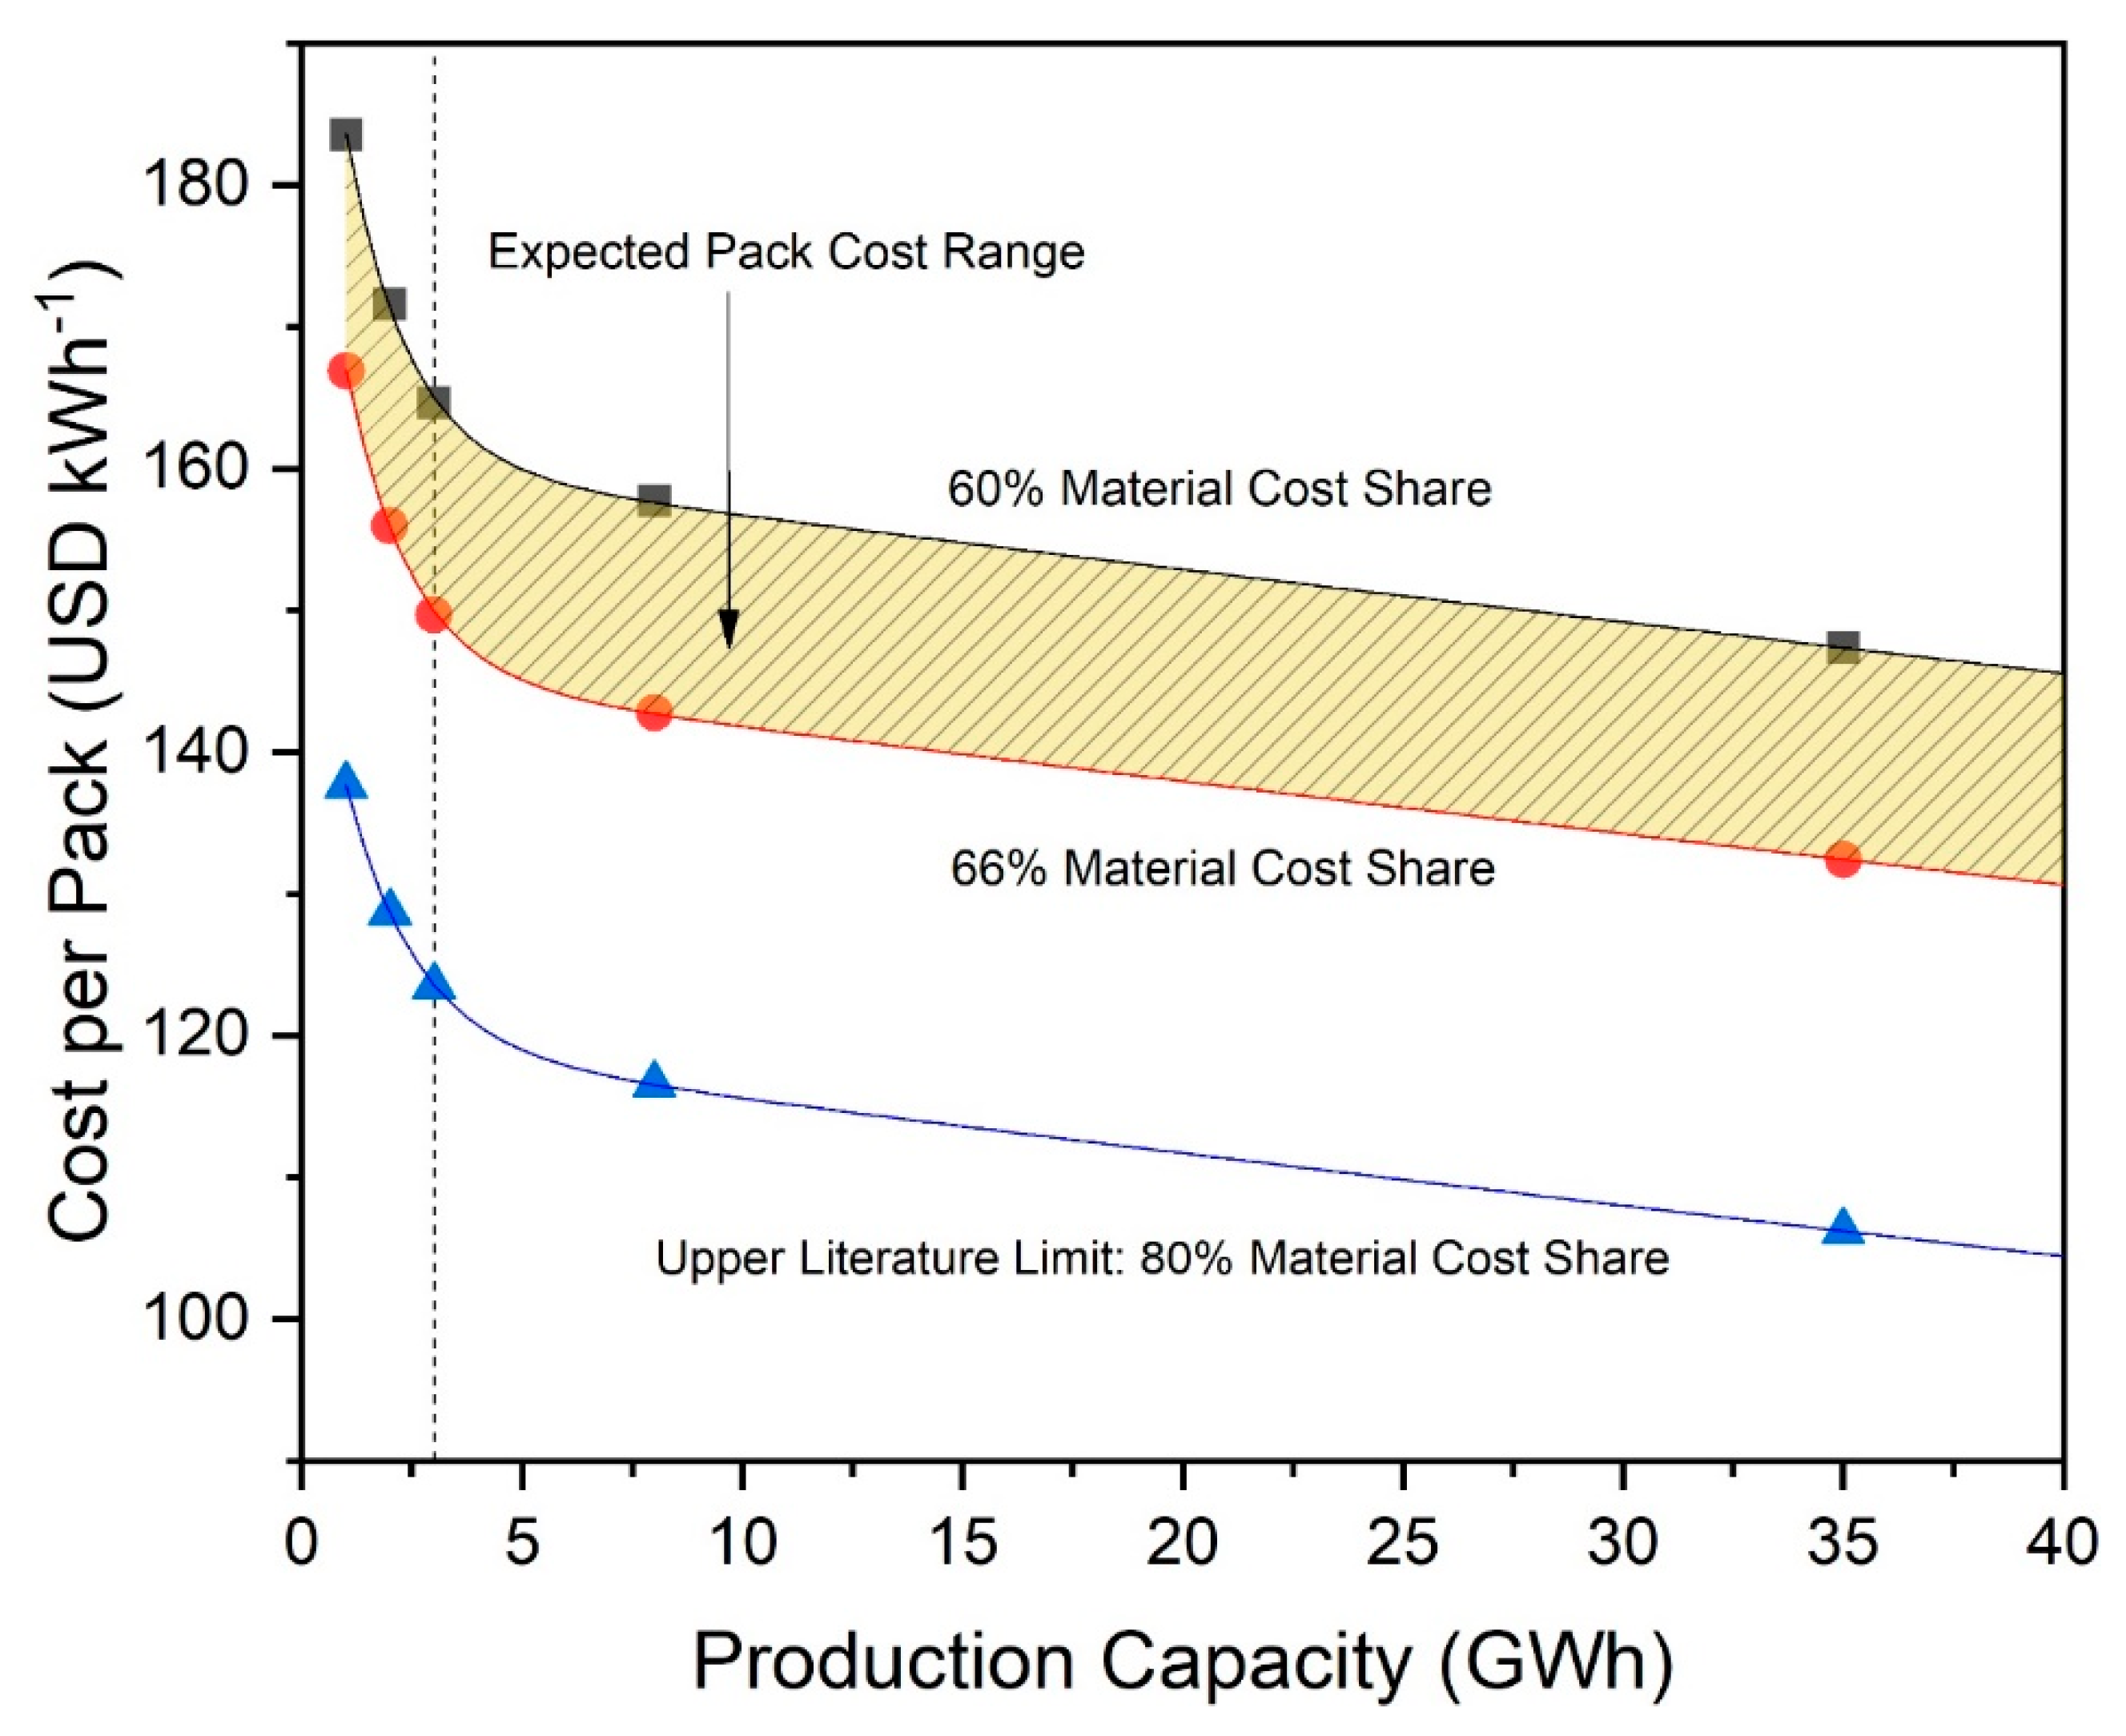
Figure 7 shows the calculated battery pack cost of a pack using NCA-graphite cell chemistry with cell material cost shares between 60 and 80%. We select a range between 60 and 66% as our expected pack cost range due to the aforementioned prominence of these points in our sources. The pack costs are based on the material cost fraction of the calculation provided by CellEst. Starting with this material cost, we then added a process cost-based fraction based on the chosen material cost shares to achieve total cell costs. These total cell costs were then scaled up to pack costs by adding a cell-to-pack scaling factor of 48%, a number based on expert opinion [14], to estimate pack costs per kWh. We expect economies of scale to apply for processing and pack assembly, which are heavily dependent on efficiency in utilizing full production line capacities and labor, and then to stabilize after reaching 3 GWh production, which we expect to approximate a full utilized production line. In 2015, other scholars expected economies of scale effects to be maximized at a lower threshold of 200 to 300 MWh annual production without differentiated cost fractions [37]. However, progress has been made in the last several years, and current expert insight points to a higher maximum threshold. Current production lines have a capacity of 3 to 6 GWh. As maximum economy of scale effects are reached when production capacity is fully utilized, we thus assume that economies of scale could realistically still have effect up to 3 GWh annual production in 2019.
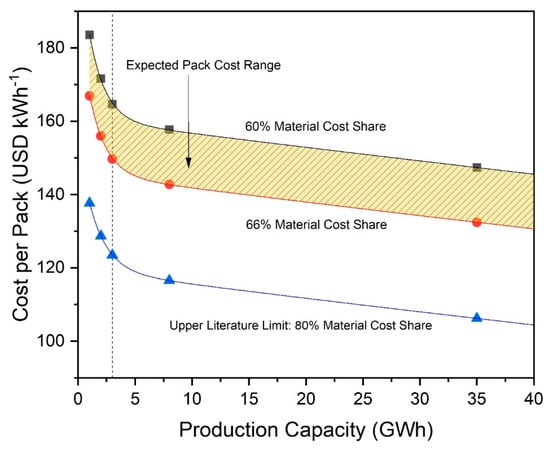
Figure 7.
Cost per battery pack for batteries based on NCA//Gr cell chemistry as a function of factory production capacity, with curves representing 60, 66, and 80% share, respectively, material cost. Dotted line indicates 3 GWh, the point at which process-based economy of scale effects reach their maximum.
Material costs follow different economics, however, and we expect this fraction to decrease in cost with production even over 3 GWh due to static economy of scale effects as described in Section 2 [44]. Figure 7 indicates that pack cost for NCA batteries could likely be between 156 and 172 USD kWh−1 for the small production scenario of 2 GWh. This shows that the costs that our model generates are within 10% of the expert’s estimation of around 190 USD kWh−1 for an NCA-based pack [14]. This difference could be explained by our approach in calculating cell energy content at its theoretical maximum and neglecting possible capacity loss effects due to cycling and SEI formation. Additionally, the numbers for especially high material cost shares (80%) and production capacities above 3 GWh indicate that it could be possible to reach the 125 USD kWh−1 target cost per battery pack of the US Department of Energy for auto manufacturers. This would require making full use of static economies of scale effects in combination with innovative efficiency increases within existing processes and/or development of entirely new processes. Current research also expects that it is possible to reduce processing costs by 20% by optimizing plant structure and overall processes and through the introduction of optimized digitization [66], which indicates that a material cost share of around 80% is likely achievable in the future. Pack costs for additional cell technologies are shown in Table 4.

Table 4.
Cost of Battery Pack, estimated by cost-plus pricing, without any overhead and capital investment.
7. Conclusion and Outlook
CellEst uses a modular approach to enable the user-friendly calculation of complete battery cell and pack cost and performance based on modifiable parameters and real-world raw material prices. Though estimations were required in developing the model, meaning that numbers generated may not be absolutely accurate, it still allows for comparison of different battery cell chemistries and evaluation of the impact of changes within these technologies. Also possible is the simulation of economy of scale effects, which apply to material and process cost fractions using separate and distinct methodologies.
The bottom-up nature of CellEst allows for analysis of the effect of raw material price fluctuations on total battery pack cost. We performed such an analysis by inputting the LME daily market prices of cobalt and nickel into CellEst. This allowed us to estimate that these price fluctuations increased the cost of cathode active materials between January 2017 and March 2018 by as much as 63.56% depending on the cell chemistry, largely due to a nearly threefold increase in cobalt price during the same time period. As cobalt is a critical raw material with high GSC in unstable regions, these price fluctuations could well continue into the future. While nickel is less critical and concentrated than cobalt, current trends are concerning, as supply increasingly is reliant on higher risk regions. This both illustrates the need for a cost model capable of performing bottom-up analysis and suggests that future battery research may do well to move away from dependency on cobalt and toward metals with more price stability.
We believe that this paper shows the valuable contribution CellEst makes to the technology assessment process within the field of battery research. For instance, it could be possible to make strategic decisions such as whether to pursue a new battery technology or further develop an existing one. Using CellEst shows the promise of altering existing CAM technologies such as NMC and NCA to yield NMC-811 and the Panasonic NCA example, respectively, due to their increased energy densities and decreased costs. The careful distinction between various cost fractions, such as material and process costs, also allows for consideration of which areas of battery production could be focused on for improvement.
Nonetheless, we recognize that there are still areas for improvement. For instance, our model is based on theoretical cost calculations based on cathode stoichiometry; access to real-world market prices of manufactured battery packs or CAMs could enable us to perform regression analyses based on real data. We are open to the idea of collaboration with other research groups, as we believe this to be an important tool to develop.
Supplementary Materials
The following are available online at http://www.mdpi.com/1996-1073/12/3/504/s1. CellEst Model.
Author Contributions
M.W. initially conceived the idea and research conceptualization. M.W. and M.G. wrote the article and developed the model in cooperation. Both worked cooperatively on data acquisition, analysis and discussion throughout the work. J.L. gave guidance and was responsible for proofreading and general advice throughout the research project. The final manuscript was read and approved by all authors.
Funding
This work was funded and supported by the Bundesministerium für Bildung und Forschung (BMBF) and the Ministerium für Wirtschaft, Innovation, Digitalisierung und Energie des Landes Nordrhein-Westfalen within the projects BenchBatt [03XP0047A] and GrEEn [313-W044A].
Acknowledgments
We thank R. Schmuch for the ongoing knowledge exchange and helpful insights on the topic of battery performance. We further thank M. Chofor Asaba for the graphical support.
Conflicts of Interest
The authors declare no conflict of interest.
References
- U.S. Energy Information Administration (EIA)—Total Energy. Available online: https://www.eia.gov/totalenergy/ (accessed on 13 September 2018).
- United States Environmental Protection Agency Overview of Greenhouse Gases. Available online: https://www.epa.gov/ghgemissions/overview-greenhouse-gases#carbon-dioxide (accessed on 14 September 2018).
- Ahuja, S. Food, Energy, and Water; Elsevier: Amsterdam, The Netherlands, 2015; ISBN 9780128002117. [Google Scholar]
- Hooftman, N.; Oliveira, L.; Messagie, M.; Coosemans, T.; Van Mierlo, J. Environmental analysis of petrol, diesel and electric passenger cars in a Belgian urban setting. Energies 2016, 9, 84. [Google Scholar] [CrossRef]
- Eberle, D.U.; von Helmolt, D.R. Sustainable transportation based on electric vehicle concepts: A brief overview. Energy Environ. Sci. 2010, 3, 689–699. [Google Scholar] [CrossRef]
- Cobb, J. Tesla Quietly Sold 200,000th Model S Last Year. Available online: https://www.hybridcars.com/tesla-quietly-sold-200000th-model-s-last-year/ (accessed on 14 September 2018).
- Nissan Motor Company Nissan Delivers 300,000th Nissan LEAF—Global Newsroom. Available online: https://newsroom.nissan-global.com/releases/release-4a75570239bf1983b1e6a41b7d00d8f5-nissan-delivers-300000th-nissan-leaf (accessed on 14 September 2018).
- Briscoe, N. Strict Electric Vehicle Targets Proposed by EU. Available online: https://www.irishtimes.com/business/transport-and-tourism/strict-electric-vehicle-targets-proposed-by-eu-1.3625303 (accessed on 14 September 2018).
- U.S. Department of Energy Electric Vehicle Technologies and Targets | Transportation Research | NREL. Available online: https://www.nrel.gov/transportation/vehicle-tech-targets.html (accessed on 14 September 2018).
- Office of Energy Efficiency & Renewable Energy Electric Vehicles: Tax Credits and Other Incentives | Department of Energy. Available online: https://www.energy.gov/eere/electricvehicles/electric-vehicles-tax-credits-and-other-incentives (accessed on 14 September 2018).
- European Automobile Manufacturers Association. Overview of tax incentives for electric vehicles in the EU; ACEA—European Automobile Manufacturers Association: Brussels, Belgium, 2017; pp. 2016–2019. [Google Scholar]
- U.S. Department of Energy Batteries for Hybrid and Plug-In Electric Vehicles. Available online: https://www.afdc.energy.gov/vehicles/electric_batteries.html (accessed on 14 September 2018).
- Goutam, S.; Timmermans, J.M.; Omar, N.; Van den Bossche, P.; Van Mierlo, J. Comparative study of surface temperature behavior of commercial li-ion pouch cells of different chemistries and capacities by infrared thermography. Energies 2015, 8, 8175–8192. [Google Scholar] [CrossRef]
- Voelcker, J. Electric-Car Battery Costs: Tesla $190 per kwh for Pack, GM $145 for Cells. Available online: https://www.greencarreports.com/news/1103667_electric-car-battery-costs-tesla-190-per-kwh-for-pack-gm-145-for-cells (accessed on 26 September 2018).
- Schmuch, R.; Wagner, R.; Hörpel, G.; Placke, T.; Winter, M. Materials for Automotive Batteries: Perspective on Performance and Cost of Lithium-Based Rechargeable Batteries. Nat. Energy 2017, 3, 267–278. [Google Scholar] [CrossRef]
- Chevrolet 2019 BOLT EV FWD LT. Available online: https://www.chevrolet.com/electric/bolt-ev-electric-car/build-and-price/trim (accessed on 18 October 2018).
- Valdes-Dapena, P. Here’s What You Get When You Buy Tesla’s $35,000 Model 3. Available online: https://money.cnn.com/2018/05/25/technology/tesla-model-3-pricing/index.html (accessed on 20 September 2018).
- The Boston Consulting Group. Focus Batteries for Electric Cars; The Boston Consulting Group: Boston, MA, USA, 2010. [Google Scholar]
- SAFT Three Battery Technologies that Could Power the Future. Available online: https://www.saftbatteries.com/media-resources/our-stories/three-battery-technologies-could-power-future (accessed on 20 September 2018).
- Nelson, P.A.; Gallagher, K.G.; Bloom, I.; Dees, D.W. Modeling the Performance and Cost of Lithium-Ion Batteries for Electric-Drive Vehicles; Argonne National Laboratory: Argonne, IL, USA, 2011. [Google Scholar]
- Berg, E.J.; Villevieille, C.; Streich, D.; Trabesinger, S.; Novák, P. Rechargeable Batteries: Grasping for the Limits of Chemistry. J. Electrochem. Soc. 2015, 162, A2468–A2475. [Google Scholar] [CrossRef]
- Bernhart, W.; Kruger, F.J. Technology & Market Drivers for Stationary and Automotive Battery Systems. In Proceedings of the Batteries, Nice, France, 24–26 October 2012. [Google Scholar]
- Autovista Group Battery Materials Could Push Manufacturers to New Limits in the Race To Secure Supply | Autovista Group. Available online: https://www.autovistagroup.com/news-and-insights/battery-materials-could-push-manufacturers-new-limits-race-secure-supply (accessed on 17 September 2018).
- Inagaki, K.; Sanderson, H.; Clover, C. Global Carmakers Race to Lock in Lithium for Electric Vehicles | Financial Times. Available online: https://www.ft.com/content/e9b83834-155b-11e8-9376-4a6390addb44 (accessed on 17 September 2018).
- Sanderson, H. Cobalt Price Hits Highest Level Since 2008 on Electric Car Demand Financial Times. Available online: https://www.ft.com/content/1e6303f6-2386-11e8-add1-0e8958b189ea (accessed on 17 September 2018).
- Desai, P. Battery Chemical Surplus Sparks Plunge in Cobalt Price Reuters. Available online: https://www.reuters.com/article/us-cobalt-chemicals-prices/battery-chemical-surplus-sparks-plunge-in-cobalt-price-idUSKBN1KL1OT (accessed on 17 September 2018).
- Petri, R.; Giebel, T.; Zhang, B.; Schünemann, J.H.; Herrmann, C. Material cost model for innovative li-ion battery cells in electric vehicle applications. Int. J. Precis. Eng. Manuf. Green Technol. 2015, 2, 263–268. [Google Scholar] [CrossRef]
- Kulkarni, A.; Kapoor, A.; Arora, S. Battery Packaging and System Design for an Electric Vehicle. In Proceedings of the 18th Asia Pacific Automotive Engineering Conference, Melbourne, Australia, 10–11 March 2015; p. 7. [Google Scholar]
- Korosec, K. Here’s Why Tesla’s Massive New Factory Will Change Everything. Time, 2014. [Google Scholar]
- Tesla Inc. Gigafactory. Available online: https://www.tesla.com/sites/default/files/blog_attachments/gigafactory.pdf (accessed on 26 September 2018).
- Blomgren, G.E. The Development and Future of Lithium Ion Batteries. J. Electrochem. Soc. 2017, 164, A5019–A5025. [Google Scholar] [CrossRef]
- Gopalakrishnan, R.; Goutam, S.; Miguel Oliveira, L.; Timmermans, J.-M.; Omar, N.; Messagie, M.; Van den Bossche, P.; van Mierlo, J. A Comprehensive Study on Rechargeable Energy Storage Technologies. J. Electrochem. Energy Convers. Storage 2017, 13, 040801. [Google Scholar] [CrossRef]
- Placke, T.; Kloepsch, R.; Dühnen, S.; Winter, M. Lithium ion, lithium metal, and alternative rechargeable battery technologies: The odyssey for high energy density. J. Solid State Electrochem. 2017, 21, 1939–1964. [Google Scholar] [CrossRef]
- Meister, P.; Jia, H.; Li, J.; Kloepsch, R.; Winter, M.; Placke, T. Best Practice: Performance and Cost Evaluation of Lithium Ion Battery Active Materials with Special Emphasis on Energy Efficiency. Chem. Mater. 2016, 28, 7203–7217. [Google Scholar] [CrossRef]
- Nelson, P.A.; Gallagher, K.G.; Bloom, I.; Dees, D.W. Modeling the Performance and Cost of Lithium-Ion Batteries for Electric-Drive Vehicles, 2nd ed.; Argonne National Laboratory: Argonne, IL, USA, 2012. [Google Scholar]
- Brodd, R.J. Batteries for Sustainability; Brodd, R.J., Ed.; Springer: New York, NY, USA, 2013; ISBN 978-1-4614-5790-9. [Google Scholar]
- Sakti, A.; Michalek, J.J.; Fuchs, E.R.H.; Whitacre, J.F. A techno-economic analysis and optimization of Li-ion batteries for light-duty passenger vehicle electrification. J. Power Sources 2015, 273, 966–980. [Google Scholar] [CrossRef]
- Sakti, A.; Azevedo, I.M.L.; Fuchs, E.R.H.; Michalek, J.J.; Gallagher, K.G.; Whitacre, J.F. Consistency and robustness of forecasting for emerging technologies: The case of Li-ion batteries for electric vehicles. Energy Policy 2017, 106, 415–426. [Google Scholar] [CrossRef]
- Holtstiege, F.; Bärmann, P.; Nölle, R.; Winter, M.; Placke, T. Pre-Lithiation Strategies for Rechargeable Energy Storage Technologies: Concepts, Promises and Challenges. Batteries 2018, 4, 4. [Google Scholar] [CrossRef]
- Brodd, R.J.; Helou, C. Cost comparison of producing high-performance Li-ion batteries in the U.S. and in China. J. Power Sources 2013, 231, 293–300. [Google Scholar] [CrossRef]
- Berckmans, G.; Messagie, M.; Smekens, J.; Omar, N.; Vanhaverbeke, L.; Mierlo, J. Van Cost projection of state of the art lithium-ion batteries for electric vehicles up to 2030. Energies 2017, 10, 1314. [Google Scholar] [CrossRef]
- Petri, R. Technologiebasiertes Materialkostenmodell für Li-Ionen Batteriezellen in der Elektromobilität; Technischen Universität Carolo-Wilhelmina zu Braunschweig: Braunschweig, Germany, 2015. [Google Scholar]
- Younossi, O.; Arena, M.V.; Moore, R.M.; Lorell, M.A.; Mason, J.; Graser, J. Military Jet Engine Acquisition Technology Basics and Cost-Estimating Methodology; RAND Corporation: Santa Monica, CA, USA, 2003; ISBN 0-8330-3282-8. [Google Scholar]
- Coenenberg, A.G.; Fischer, T.M.; Günther, T. Kostenrechnung und Kostenanalyse, 8th ed.; Schaeffer-Poeschel Verlag für Wirtschaft, Steuern, Recht GmbH: Stuttgart, Germany, 2012; ISBN 978-3-7910-3188-0. [Google Scholar]
- Benchmark Mineral Intelligence PANASONIC REDUCES TESLA’S COBALT CONSUMPTION BY 60% IN 6 YEARS. Available online: http://www.benchmarkminerals.com/panasonic-reduces-teslas-cobalt-consumption-by-60-in-6-years/ (accessed on 25 September 2018).
- Noh, H.J.; Youn, S.; Yoon, C.S.; Sun, Y.K. Comparison of the structural and electrochemical properties of layered Li[NixCoyMnz]O2(x = 1/3, 0.5, 0.6, 0.7, 0.8 and 0.85) cathode material for lithium-ion batteries. J. Power Sources 2013, 233, 121–130. [Google Scholar] [CrossRef]
- Andre, D.; Kim, S.-J.; Lamp, P.; Lux, S.F.; Maglia, F.; Paschos, O.; Stiaszny, B. Future generations of cathode materials: An automotive industry perspective. J. Mater. Chem. A 2015, 3, 6709–6732. [Google Scholar] [CrossRef]
- Helbig, C.; Bradshaw, A.M.; Wietschel, L.; Thorenz, A.; Tuma, A. Supply risks associated with lithium-ion battery materials. J. Clean. Prod. 2018, 172, 274–286. [Google Scholar] [CrossRef]
- European Commission. EU Ad-Hoc Working Group on Raw Materials Report on Critical Raw Materials for the EU; European Commission: Brussels, Belgium, 2014. [Google Scholar]
- Europäische Kommission. Überprüfung der Liste kritischer Rohstoffe für die EU und die Umsetzung der Rohstoffinitiative; Europäische Kommission: Brussels, Belgium, 2014. [Google Scholar]
- Europäische Kommission. Liste kritischer Rohstoffe für die EU 2017; Europäische Kommission: Brussels, Belgium, 2017. [Google Scholar]
- Amoruso, B. Rechargeable Batteries. Available online: https://www.cobaltinstitute.org/rechargeable-batteries.html (accessed on 26 September 2018).
- U.S. Department of Energy. Critical Materials Strategy 2011; U.S. Department of Energy: Washington, DC, USA, 2011.
- Coulomb, R.; Dietz, S.; Godunova, M.; Nielsen, T.B. Critical Minerals Today and in 2030: An Analysis for OECD Countries; OECD: Paris, France, 2015. [Google Scholar]
- Committee on Critical Mineral Impacts of the U.S. Economy; Committee on Earth Resources; National Research Council. Minerals, Critical Minerals, and the U.S. Economy; National Academies Press: Washington, DC, USA, 2008; ISBN 9780309112826. [Google Scholar]
- Behrmann, E.; Farchy, J.; Dodge, S. Hype Meets Reality as Electric Car Dreams Run Into Metal Crunch. Available online: https://www.bloomberg.com/graphics/2018-cobalt-batteries/ (accessed on 17 September 2018).
- Sadof, K.D.; Mucha, L.; Frankel, T.C. The Environmental Impact of Cobalt Mining—The Washington Post. Available online: https://www.washingtonpost.com/news/in-sight/wp/2018/02/28/the-cost-of-cobalt/?noredirect=on&utm_term=.6d6d49cb2f29 (accessed on 17 September 2018).
- Holmes, F. The World’s Cobalt Supply Is in Jeopardy. Available online: https://www.forbes.com/sites/greatspeculations/2018/02/27/the-worlds-cobalt-supply-is-in-jeopardy/#369a56e21be5 (accessed on 17 September 2018).
- Graedel, T.E.; Barr, R.; Chandler, C.; Chase, T.; Choi, J.; Christoffersen, L.; Friedlander, E.; Henly, C.; Jun, C.; Nassar, N.T.; et al. Methodology of metal criticality determination. Environ. Sci. Technol. 2012, 46, 1063–1070. [Google Scholar] [CrossRef] [PubMed]
- Miningscout Cobalt—Trend towards Electric Mobility Will Continue to Drive Prices. Available online: https://www.miningscout.de/blog/2017/04/18/kobalt-trend-zur-elektromobilitaet-wird-preise-weiter-antreiben/ (accessed on 26 September 2018).
- Lazenby, H. RNC’s Mark Selby Dispels Myths Regarding Nickel Demand as New EV Markets Beckon. Available online: http://www.miningweekly.com/article/rncs-mark-selby-dispels-myths-regarding-nickel-demand-as-new-ev-markets-beckon-2018-03-14/rep_id:3650 (accessed on 17 September 2018).
- Tibballs, S. Nickel Prices to Move Higher over the Next Half Decade | INN. Available online: https://investingnews.com/daily/resource-investing/base-metals-investing/nickel-investing/that-nickel-in-your-pockets-worth-more-scotiabank/ (accessed on 17 September 2018).
- Opray, M. Nickel Mining: The Hidden Environmental Cost of Electric Cars. Available online: https://www.theguardian.com/sustainable-business/2017/aug/24/nickel-mining-hidden-environmental-cost-electric-cars-batteries (accessed on 17 September 2018).
- Office of Energy Efficiency & Renewable Energy about Electric Vehicles. Available online: https://www.energy.gov/eere/electricvehicles/about-electric-vehicles (accessed on 26 September 2018).
- Musk, E.; Deepak, A. Tesla Second Quarter 2018 Update; Tesla, Inc.: Palo Alto, CA, USA, 2018. [Google Scholar]
- Küpper, D.; Wolf, S.; Xu, G.; Kuhlmann, K.; Pieper, C.; Ahmad, J. The Future of Battery Production for Electric Vehicles; Boston Consulting Group, Inc.: Boston, MA, USA, 2018. [Google Scholar]
© 2019 by the authors. Licensee MDPI, Basel, Switzerland. This article is an open access article distributed under the terms and conditions of the Creative Commons Attribution (CC BY) license (http://creativecommons.org/licenses/by/4.0/).

