Abstract
A technical, environmental, and economic feasibility study for a patented hybrid renewable energy harvester system for residential application is conducted in this paper. This system can be mounted on top of an existing residential building to provide electricity from renewable sources. The system is characterized by its V-shaped roof guide vane (VRGV) that directs and augments airflow into the wind turbine, to enhance the rotational and power generation performance of the wind turbines in low wind speed areas. Furthermore, the VRGV increases the installation area for the solar photovoltaic panels and expand the rainwater collection area for the building, and facilitates natural ventilation and prevents excessive solar radiation into the room. The environment–economic evaluation of the system is conducted based on the life-cycle cost (LCC) in terms of low carbon and economic cost-effectiveness. The evaluation of the system with dimensions of 15 m (L) × 16 m (W) × 17.05 m (H) showed that the annual energy generated is 21.130 MWh. Annual low-carbon benefit of the system is estimated to be 11.894 t. The cumulative net present value (NPV) of the system in the life cycle time (20 years) is $52,207.247, with the consideration of a discount rate of 8%; also, the cash flow breakeven occurs in the 11th year. It is important to note that the carbon payback period (CPP) of the system is five years.
1. Introduction
The use of traditional fossil fuels is a main source of power generation and environmental pollution in the world. Increase in energy consumption is also a major issue faced by all countries in the world. According to the forecast by the International Energy Agency, global energy consumption is expected to increase by 53% in the year 2030 [1]. However, among this energy consumption, electricity has been recognized as the main way of energy consumption in many countries, and it is also accepted as one of the driving forces of economic development around the globe [2]. The challenge of continuously generating electricity and meeting the growing energy demands is exerting tremendous pressure on the energy infrastructures for many developed and developing countries [3,4]. In the growing energy consumption industries, the residential building industry is considered to be the fastest growing power consumption industry, and it is expected to grow by a rate of 48% from 2012 to 2040 [5].
Malaysia mainly relies on thermal power generation, and its power resource comes from fossil fuel (natural gas, coal, and oil). Natural gas has been the major fuel for electricity generation in Malaysia since the early 1980s [6]. As of 2009, almost 94.5% of the electricity in Malaysia was generated from fossil fuel [7]. About 55.9% of the fuel for electricity generation in 2010 emanated from natural gas, followed by coal (36.5%), hydropower (5.8%), and oil (1.8%) [8]. According to the report of Malaysia energy commission, the total installed capacity in Malaysia, as of December 2016, was about 22,919 MW, of which the natural gas installed capacity accounted for 49%, and the coal installed capacity accounted for 40% [9]. Therefore, it can be seen that thermal power generation is one of the main sources of CO2 emissions in Malaysia with the annual consumption of fossil fuel, which is about 1.6 billion tons [10], and the pollutant emission coefficient per kW h in Malaysia is higher than the world average level [11]. Thus, adopting renewable energy to generate power is an important technical method to reduce pollutant emissions. The use of wind and solar power generation as highly clean energy technologies produces almost no pollutants and has higher environmental value than the thermal power generation.
As the main alternative fuel for the power industry in the future, the environmental value of wind and solar power technologies cannot be ignored due to CO2 emission reduction. Furthermore, large-scale wind farms and solar farms have been widely accepted around the world in recent years due to the diversification of market demands, thus also providing more development space for small-scale wind and solar farms [12]. There are a number of urban buildings in Malaysia. The wind energy resources of the building’s roof and space are abundant. In addition, Malaysia is rich in solar energy resources and annual rainfall due to its proximity to the equator, which provides a good external environment for the design and application of the hybrid renewable energy harvester systems for residential buildings. This paper will conduct a techno-environment–economic evaluation for the hybrid renewable energy harvester system installed on a residential building based on Malaysia’s climate data and carbon footprint data.
In this paper, the technical features of a patented hybrid renewable energy harvester system are reviewed. An environmental evaluation is done by adopting the low-carbon benefit methods and carbon footprint analysis, to estimate the environmental benefits of the system. Economic evaluation is performed by using the life-cycle cost (LCC) method to calculate the cost and benefit of the system in the entire life-cycle.
2. Existing Renewable Energy Utilization Systems
In these contemporary times, the renewable energy harvester has become a major research topic to address problems caused by environmental pollution, climate change, and increased fossil fuel consumption [13]. In comparison to a large hybrid wind-solar power system, small-scale wind and solar power systems have been extensively researched and applied in the industrial and residential industries [14,15]. Similar to all alternative energy sources, the initial investment costs of the solar and wind power systems are expensive, but cheaper in terms of the operating and maintenance costs. In addition, a hybrid system that is based on the combination of a solar photovoltaic (PV) and wind turbine technology can achieve a more stable annual power generation, where the solar PV and wind turbine can complement each other to achieve an efficient use of the hybrid system. For example, Zahnd et al. tested a small-scaled solar–wind hybrid model with lead-acid batteries in a Nepal village. The results from their experiment showed that the solar PV panels and wind turbine complemented each other to meet the load or storage in the lead-acid battery, and this hybrid system was able to extend the average power generation time by 3 to 4 h per day [16]. Furthermore, Bekele and Palm studied the feasibility of integrating a wind–solar power system with a diesel generator for residential application in a remote area [17]. According to an economic analysis, this system took a shorter time to break even when compared with a single energy generation system. Therefore, a power generation system with an auxiliary and supplementary energy support is more competitive than a stand-alone power generation system. Jurasz et al. studied the effect of energy complementarity of a small-scale hybrid power system on the efficiency and reliability of a particular hybrid system [18]. The important technical task for a hybrid energy power system used in the building is to obtain the optimal size and configuration, so as to achieve a high efficiency and economy of the system [19]; for example, Ekren et al. developed a new method for optimizing the size of a hybrid wind–solar system integrated with the battery bank and analyzed the economics of the system [20]. Fathy developed a method to optimize the size of a hybrid system consisting of PV modules, wind turbines, and fuel module based on local solar radiation data, wind speed, and ambient temperature, with the aim of reducing the system annual load coverage cost [21]. In addition, Yang et al. went ahead to propose an innovative optimized technique for the hybrid wind–solar system, which has the ability to estimate the optimal configuration of the system and minimize the system cost [22].
Equipping a building with efficient renewable energy (solar, wind, and rainwater) is one of the effective ways to solve the issues of high energy consumption and pollution in modern cities. Previous researchers have indicated that about one-third of the global carbon dioxide emissions are related to residential and commercial buildings [23,24,25]. The application of the renewable energy concept in architectural design is attracting people’s interest, as researcher such as Yang et al. conducted a research on applying solar energy, wind energy, and rainwater on a house to achieve a high economic and ecological value [26]. Consequently, Chong et al. proposed a hybrid wind–solar–rain utilization system with a power augmentation guide vane (PAGV) for high-rise building applications, where the PAGV guided and increased wind speed into the wind turbine to improve power performance of the wind turbine that was installed in this system. According to the calculations that were undertaken, the system produced or saved a total of 160 MWh of electricity per year [27,28]. Moreover, the PAGV was able to act as a mounting bracket for solar panels and also acted as a rainwater harvester to reduce the electricity consumption of the high-rise building. In addition, building roof is considered to have a great potential for adopting renewable energy (wind, solar, and rain). Contino et al. investigated the possibility of a large-scale use of wind turbines combined with roof solar panels in rural and remote areas [29].
3. Economic and Environment Evaluation of Solar and Wind Power Generation
There are many economic–environmental performance indicators used in the field of product evaluation, such as LCC [27,30,31,32], LCA (life-cycle assessment) [33,34,35], LCOE (levelized cost of energy) [36,37], NPV (net present value) [31], EPBT (energy payback time) [38], ROI (return on investment) [39], BCR (benefit-to-cost ratio) [40], IRR (internal rate of return) [39], UEC (unit energy cost), and PBP (payback period) [31,39,41].
Lenzen [42] studied and summarized the wind power technology based on the LCC theory, in which the manufacturing materials, production techniques, and material recycling rates were taken into account. Other scholars, including Krauter et al., also evaluated the ability of photovoltaic power generation to reduce greenhouse gases, considering the stage of production, transportation, and installation of each component of a photovoltaic system, and the stage of operation and recycling of the photovoltaic power station [43]. More so, Korsavi et al. calculated the annual energy production, economic performance, and carbon dioxide emissions of 14 rooftop photovoltaic systems with a power of 5 kW by using the methods of PBP, NPV, ROI, and LCOE [44]. Wang et al. evaluated the performance of a small-scale horizontal axis wind turbine in terms of greenhouse gas emissions, energy consumption, electricity production, and economic benefits by using the LCA method [34]. Two cases of Oman’s hybrid solar–wind power system were investigated and compared by LCC and other methods. The results showed that the energy cost of the hybrid system located in Masira and Halaniyar were 0.182 $/kW h and 0.222 $/kW h, respectively [45]. Nookuea et al. studied the relationship between the LCC and the reliability of a hybrid solar–wind system with battery in the shrimp cultivation industry in Thailand [46]. The research on the LCC of the renewable energy power generation system (wind turbine and solar PV panels) involves all stages from the raw material processing to the end of life, however its main concentration is on the manufacturing stage [35,47,48].
Low-carbon benefit evaluation is based on the characteristics of the carbon emission reduction from photovoltaic and wind power generation, which is the algebraic sum of low-carbon positive and negative benefits that are generated during the whole life cycle. The low-carbon income of photovoltaic or wind power represents the economic benefits of the low-carbon benefits through the carbon trading mechanism. Kannan et al. [49] studied the potential low-carbon benefits and low-carbon income of a 2.7 kWp photovoltaic system. In their study, the construction, operation, and recovery phases of the photovoltaic power plant were considered. Furthermore, Ito et al. [50] analyzed six different large-scale solar photovoltaic systems using the LCA method and calculated the carbon dioxide emission intensity and the energy recovery period of the system. The result showed that the photovoltaic system with thin-film battery has the shortest carbon and energy recovery period.
4. Design Description of the System
This patented hybrid renewable energy harvester system consists of an energy generation system and an energy recovery system, where wind and solar energy are applied to generate electricity for the energy demands of a residential building where the system is installed. In addition, a rainwater harvester, heat rejection air vent, and natural daylight harvesting system, are applied to save part of the water and electricity for the residents. The design of this hybrid renewable energy harvester system is developed based on Malaysia’s climate experience data. This system can be blended into a building structure with minimal negative visual impact, as shown in Figure 1. The demonstration model of the system is shown in Figure 2.
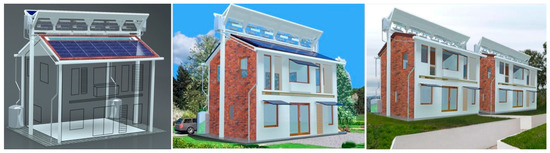
Figure 1.
Artistic expression of a hybrid renewable energy harvester system for a residential building.

Figure 2.
The model of the system.
The overview of the hybrid renewable energy harvester system is illustrated in Figure 3. The parameters of this system are listed in Table 1.
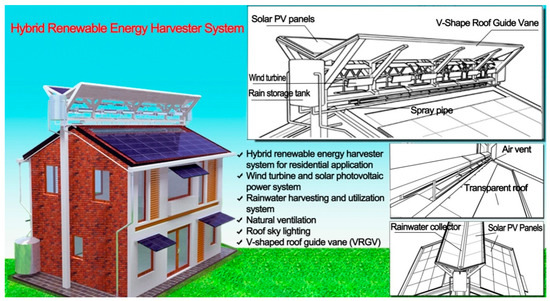
Figure 3.
Overall structure layout.

Table 1.
Specific parameters of the hybrid renewable energy harvester system.
The most visible feature of the system is a V-shaped roof guide vane (VRGV), installed on top of the building, which helps in concentrating the airflow from a large area and increasing the wind speed into the wind turbine. The VRGV and the double slope roof acts as a concentrator and diffusor to reduce the cross-section of the wind flow by the venturi effect to make the wind turbines generate more energy in the low wind speed areas. The VRGV is inclined at an angle of 19.5 degrees from the horizontal axis, which is known to be an optimized inclined angle for the wind concentration effect [52]. The VRGV can overcome the inferior aspect of the low wind speed by guiding and increasing the speed of the wind by 63% at the location of the wind turbines [52].
4.1. Energy Generation System
Six vertical axis wind turbines (VAWTs) are placed on the roof ridge for the generation of electricity. The parameters of the VAWTs are shown in Table 2. The rotational and power performance of the VAWTs installed in this hybrid renewable energy harvester was optimized by the increased wind speed caused by the VRGV [30].
Table 2.
Specific parameters of the wind turbine [53].
Solar panels can be strategically placed on top of the pitched roof and the VRGV, as shown in Figure 3. Solar panels are not placed on the part of the pitched roof where noon sunlight is blocked by the VRGV. The specifications of the solar PV panel are shown in Table 3.
Table 3.
Parameters of the solar photovoltaic (PV) system.
According to Dominguez et al.’s research on the effect of roof-mounted solar PV panels on the ceiling temperature [56], Figure 4 shows the temperature measured in the experiment for the cases of roof tilted PV array, roof flat PV array, and exposed roof. From the result, it was discovered that the negative heat effect on a roof with tilted and flat PV arrays is less than that of an exposed roof. Therefore, the roof-mounted tilted solar PV panels in this hybrid renewable energy harvester system were more conducive to keeping an indoor comfortable temperature.
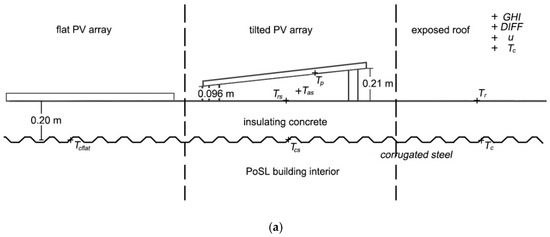
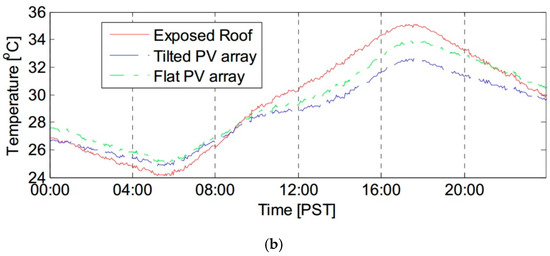
Figure 4.
(a) Schematic diagram; (b) interior ceiling surface temperatures under exposed roof, tilted PV array, and flat PV array. Reprint with permission from Reference [56]; 2011, Elsevier.
4.2. Energy Recovery System
A rainwater harvester comprises two water tanks, drainage channels, water spray pipes, connecting pipes, etc. In this system, the VRGV also forms the flow path for the rainwater collection that leads towards the water storage tanks, as shown in Figure 5. In the current study, a simplified passive automatic cleaning and cooling system with a water spray function was used to increase the power generation efficiency of the solar PV modules (refer to Figure 6). Sixteen equally spaced copper nozzles are applied in this cleaning and cooling system to maintain a uniform cleaning and cooling effect of the solar PV modules. According to the experiments conducted by Elnozahy et al. [57], the power generation efficiency (11.7%) of the cooled and cleaned solar PV modules was 2.7% higher than that of the solar PV modules without the cooling and cleaning system. Figure 7 shows the efficiency of the PV module with and without the cooling system.
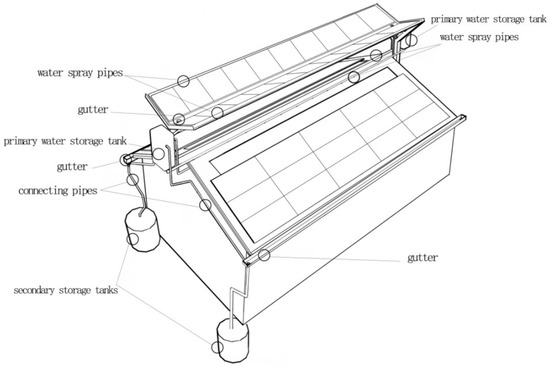
Figure 5.
Rainwater harvester.
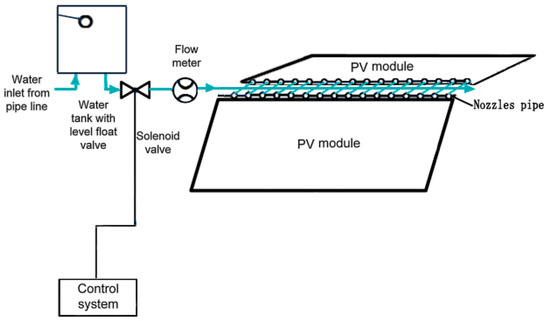
Figure 6.
Automatic cooling and cleaning system.
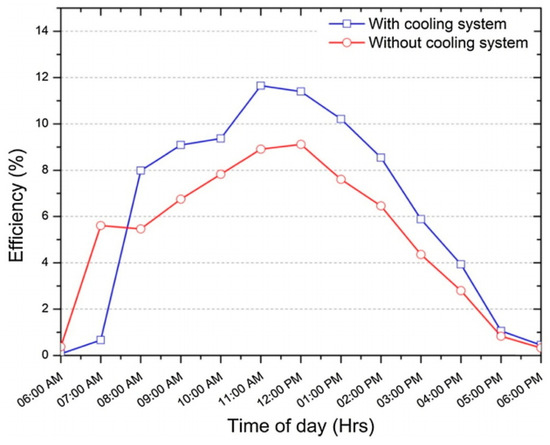
Figure 7.
Photovoltaic efficiencies of the PV modules with and without the cooling system. Reprint with permission from Reference [57]; 2015, Elsevier.
The hybrid renewable energy harvester system is also incorporated with a daylight harvesting system. Skylight windows are located on the double-sloped roof, which is close to the roof ridge and under the upper the VRGV; hence, the VRGV is able to prevent direct sunlight into the room at noon, as shown in Figure 8. Two skylight windows located at the center of the double-sloped roof of the building can be used to illuminate the space where daylight is difficult to access from the window. The skylight windows of this hybrid renewable energy harvester system can save a total energy of approximately 1.840 MWh per year and can replace about 18 lamps (each of 35 W) [58].
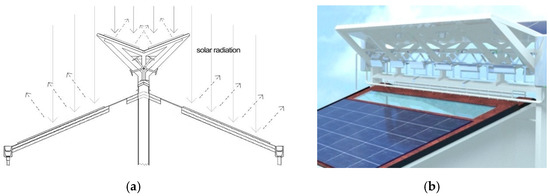
Figure 8.
Daylight harvesting system diagrams: (a) Schematic diagram; (b) skylight windows.
Along the ridge of the building, a heat rejection air vent is adopted to exhaust warm air from the building, as shown in Figure 9. When wind flow blows through the area between the VRGV and the double-pitched roof, the wind can be accelerated, creating a low-pressure area, while the warm air in the attic possesses a higher pressure. Natural convection occurs due to the pressure difference between the attic and the area where the VAWT is located. A simple computational fluid dynamics (CFD) analysis was implemented to research on the pressure distribution between the VRGV and the double-pitched roof. The result showed that the night ventilation cooling effect of a windowed building equipped with this hybrid renewable energy harvester system (air vent) was 2.9 °C, assuming an average outdoor temperature of 30 °C and an outdoor temperature fluctuation of 5 °C [58]. Additionally, rainwater is prevented from entering the building by a series of side louvers along the air vent.
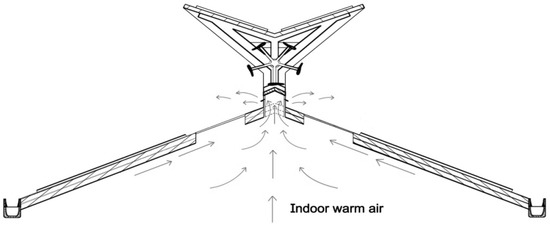
Figure 9.
Schematic diagram of ventilation.
5. Methodology: Environment and Economic Evaluation
Solar PV power generation and wind power generation are characterized by low carbon, environmentally friendliness, and sustainability. This study conducted the environmental evaluation and economic evaluation for all aspects of the hybrid renewable energy harvester system installed on a building, including the component production, transportation, installation, operating, and maintenance, as shown in Figure 10. The LCC method was applied in this study, which took into account the cost of each stage and the fluctuation of the operating and maintenance cost, tariff rate, discount rates, and tax rate. The task of the LCC assessment method is the evaluation of the costs, process, and structure of the product by identifying the energy, materials used, and wastes released to the environment.
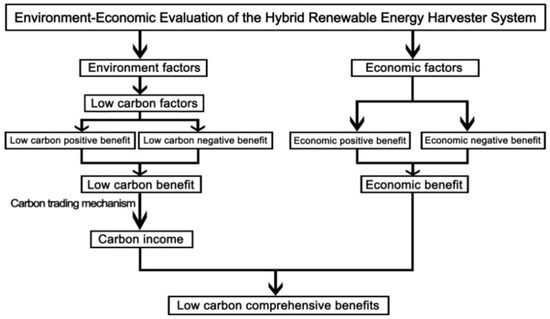
Figure 10.
Framework of low-carbon comprehensive benefit.
In the present study, only the environmental and economic evaluation of the solar energy system and the wind energy system of the hybrid renewable energy harvester system were analyzed. The environmental and economic evaluation of the rainwater harvester and the heat rejection air vent in this hybrid renewable energy harvester system were not considered. The environmental and economic evaluation of the system was conducted based on its technical characteristics and the meteorological data obtained from Subang city, Malaysia. (Lat.: 3°4′25″ N and Long.: 101°35′17″ E), as shown in Figure 11. To conduct the environmental and economic evaluation for the system, the climate, economic, and financing characteristics of Malaysia were used. In this study, it is assumed that the electricity generated by the proposed hybrid energy system is fed into the urban electricity network.
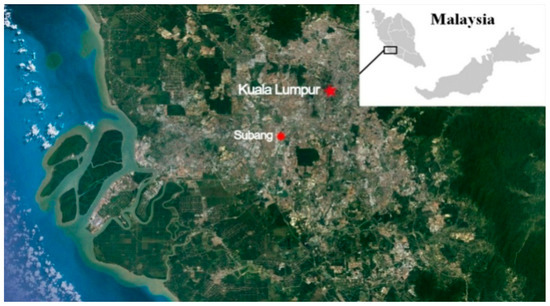
Figure 11.
Map of Subang city, Malaysia.
Solar and wind power generation can reduce traditional fuels consumption and carbon emission; furthermore, solar and wind power generation also has some economic benefits. Therefore, the revenue link of the solar and wind power generation is a positive factor of the low-carbon economy. The cost link of the solar and wind power generation is a negative factor of the low-carbon economy. This paper conducts a low-carbon and economic analysis for all aspects of the solar photovoltaic power generation over a life cycle.
5.1. Output of the System
5.1.1. Output of the Solar Energy System
The climatic condition in Malaysia is favorable for the development of solar energy due to the abundant sunshine throughout the year. In this study, the solar radiation data used in the calculations were collected at a weather station in Subang. The power output of the solar photovoltaic panel can be estimated by the following equation:
where, is the annual average solar radiation value (kW h m−2); As is the effective area of the solar PV panels (m2); K is the shadow influence factor; is the influence factor of the dip angle and orientation of the solar module on the energy output; is energy conversion efficiency of the solar module; and PR is the system performance ratio. The average monthly solar radiation in Subang, Malaysia is shown in Figure 12. The calculation parameters are shown in Table 4.
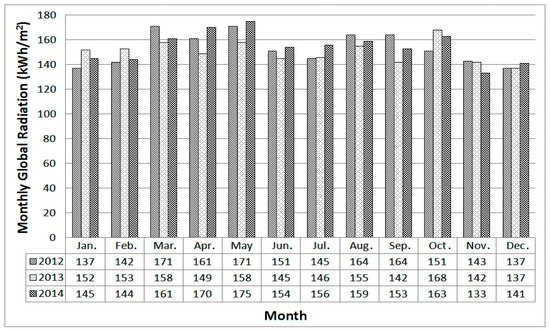
Figure 12.
Monthly average solar radiation (kW h/m2) data of Subang, Malaysia (2012–2014).
Table 4.
Parameters for solar PV panel calculation.
5.1.2. Output of the Wind Energy System
Six VAWTs are applied on the building roof, as shown in Figure 13. The wind turbines are installed in a space between a double-sloped roof and the VRGV, where the wind flow into the wind turbines can be augmented. Hence, the wind energy can be converted into electricity through these wind turbines. The electricity generation from the wind turbines can be calculated using Betz law of wind power:
where is the air density; is the rotor efficiency; is the wind turbine efficiency; is the loss factor in the wind direction; is the coverage area of the blades of a wind turbine; is the increased wind velocity at the region of the wind turbine from the ground in the presence of the optimized VRGV structure. In this case, six VAWTs with a rated power of 300 W (Diameter = 1.2 m) were selected to match the building, and they were readily available and cheap in the market; also, the dimension matched the selected building.
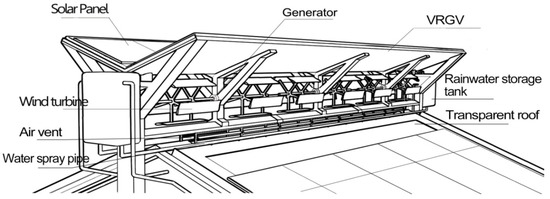
Figure 13.
Wind energy system of the hybrid renewable energy harvester system.
Table 5 shows the parameters for calculating the electricity generation from the wind energy system.
Table 5.
Parameters for calculating the electricity generation of the wind turbine [58].
According to the studies (including CFD simulations and experimental tests), the shape of the VRGV was optimized for the maximum utilization of wind energy, and the optimized wind velocity increased by a factor of 1.63 due to the optimized VRGV design being found. Therefore, the increased wind velocity () data in the presence of the optimized VRGV at the region of the wind turbine (height of 11.1 m) in Subang, Malaysia are listed in Figure 14.
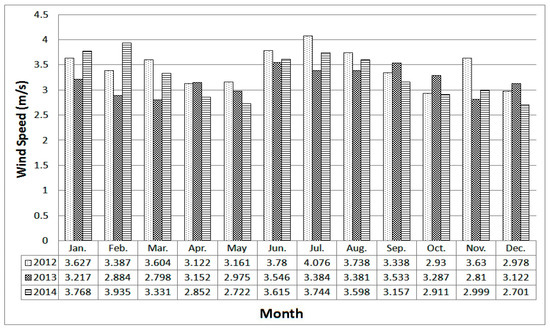
Figure 14.
The increased wind velocity in the presence of the optimized V-shaped roof guide vane (VRGV) structure at the region of the wind turbine in Subang (m/s) (2012–2014).
5.2. Low-Carbon Benefit of the System
In this article, low-carbon benefit is the algebraic sum of carbon emission reductions (low-carbon positive benefit) and carbon emissions (low-carbon negative benefit) from the solar and wind power generation of the system during the life cycle. The annual low-carbon benefit of the system is expressed as
where refers to the annual carbon dioxide emission reduction of the solar and wind power generation; (/n) refers to the annual carbon dioxide emission of the solar and wind power generation, that is, the annual carbon cost generated by the system; C2 is the carbon cost of the system, mainly referring to the initial carbon investment cost and maintenance carbon cost; whereas n is the life of the solar and wind energy system.
Annual carbon dioxide emission reduction (low-carbon positive benefit) of the solar and wind power generation is calculated as follows:
where is the local (Malaysia) carbon dioxide emission factor for power generation (kg/kW h).
The carbon cost (low-carbon negative benefit) of the solar and wind energy system is calculated as follows:
where is the initial carbon investment cost of the solar energy system; is the initial carbon investment cost of the wind energy system; is the maintenance carbon cost of the solar energy system; and is the maintenance carbon cost of the wind energy system. Furthermore, the initial carbon investment cost mainly considers the carbon dioxide emission generated during the process of the raw material production, equipment manufacturing, equipment transportation, and construction of the solar PV panels and wind turbines.
5.2.1. The Carbon Cost of the Solar Energy System
The initial carbon investment cost of the solar energy system () is expressed as
where is the electric energy consumed by the producing unit power solar photovoltaic panel (kW h/kW); is the total capacity of the solar energy system (kw); represents the total weight of the solar energy system (kg); is the carbon dioxide emission intensity of the transportation (kg/t·km); is the distance between the location of the solar PV panel manufacturer and the project site (km); m is the species of material required to install the solar PV panels; i is the ith material required to install the solar PV panels; is the carbon dioxide emission coefficient of the ith material (kg/kg); and is the weight of the ith material (kg).
The maintenance carbon cost of the solar energy system (), mainly considering the carbon dioxide emission from the operation and routine maintenance of the solar PV panels as well as the components replacement of the solar PV panels, is expressed as follows:
where is the ratio of the carbon cost of the operating and maintenance versus its initial carbon investment.
Furthermore, the parameters used in the process of estimating the carbon cost of the solar PV power generation of the hybrid renewable energy harvester system installed on a residential building are listed in Table 6.
Table 6.
Specific parameters for evaluating the carbon cost of the solar energy system.
5.2.2. The Carbon Cost of the Wind Energy System
In this study, a crane was used throughout the process of the construction of the wind turbines. Also, the carbon dioxide emission of the working crane was considered as the major part of the carbon footprint in the process of the wind turbines construction. The initial carbon investment cost () of the wind energy system is calculated as follows:
where n represents the species of materials required for the wind turbine fabrication; j is the jth material required for the wind turbine fabrication; is the weight of the jth material (kg); is the carbon dioxide emission coefficient of the jth material (kg/kg); is the total weight of the wind power system (kg); is the carbon dioxide emission intensity of the transportation (kg/t·km); is the distance between the location of the wind turbine manufacturer and the project site (km); is the weight of the crane (t); is the distance between the location of the crane and the project site (km); is the mass of the carbon dioxide emission per hour by the working crane (kgCO2/hr); while denotes the working hours of the crane (hr).
Consequently, is the carbon dioxide emission in the process of the wind turbine fabrication. The main components and required materials in the wind turbine fabrication are shown in Table 7 [68,69]. The percentage of the key materials used in the wind turbine fabrication is shown in Figure 15.
Table 7.
Main components and key manufacturing materials of the wind turbine.
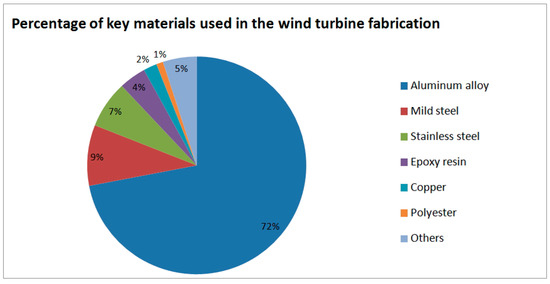
Figure 15.
Percentage of key materials used in the wind turbine fabrication. Reprint with permission from Reference [68]; 2006, SAGE.
Moreover, the quality of the key materials that are required for the wind turbine fabrication and the corresponding carbon dioxide emission coefficient is shown in Table 8 [70,71,72,73,74]. The carbon dioxide emission coefficient is determined by summing up the environmental impacts of the corresponding material at each stage of the life cycle [75,76].
Table 8.
Quality of the key materials required for a wind turbine fabrication and the corresponding carbon dioxide emission coefficient.
Additionally, is the carbon dioxide emission in the transportation of the wind turbines. The transportation carrier of the wind turbine is a vehicle. The vehicle consumes fuel and produces carbon dioxide emissions during the transportation of the wind turbines. The parameters for estimating the carbon dioxide emission in the wind turbines transportation are listed in Table 9.
Table 9.
Parameters for estimating the carbon dioxide emission in the wind turbines transportation.
In this study, the carbon dioxide emission of the crane is considered to be the main carbon consumption required for the installation process of the wind turbines. The carbon dioxide emission generated in the transporting of the crane () should be taken into consideration. In this study, it is assumed that a lorry, using diesel, transports the crane to the project site. Additionally, the carbon dioxide emission in the process of the working crane () should be considered. Therefore, the parameters for estimating the carbon dioxide emission during the installation process of the wind turbines are shown in Table 10.
Table 10.
Parameters of estimating the carbon dioxide emission in the crane transportation.
The maintenance carbon cost of the wind energy system () mainly considers the carbon dioxide emission generated in the operational process and the routine maintenance of the wind turbines as well as the components replacement of the wind turbines, and it is expressed as follows:
where is the ratio of the operating and maintenance carbon cost of the wind energy system versus its initial carbon investment of 5% [78].
5.3. Economic Benefit of the System
The annual economic benefit of the system can be estimated by the following equation:
where refers to the annual economic income of the solar and wind energy system; ( = /n) refers to the annual economic cost of the solar and wind energy system; refers to the economic cost of the solar and wind energy system; and n indicates the life of the system.
The annual economic income of the solar and wind energy system (economic positive benefit) can be calculated by the following equation:
where refers to the feed-in tariff (FiT) rates of the renewable energy generation.
The economic cost of the solar and wind energy system () mainly includes the initial investment, operating, and maintenance cost as well as the equipment replacement cost. The operating and maintenance cost coupled with the equipment replacement cost need to take the price inflation rate into consideration. Hence, the economic cost of the solar and wind energy system is calculated by following Equation (12). Also, the details of the initial capital cost, operating and maintenance cost, and the equipment replacement cost are shown in Table 11. The economic cost of the system is calculated as follows:
where is the capital investment in the tth year; is the operating and maintenance cost and the equipment replacement cost in the tth year; and is the inflation rate.
Table 11.
Detailed cost of the system.
5.4. Annual Comprehensive Benefit of the System
Based on Equations (3) and (10), the annual comprehensive benefit of the system (E) can be obtained as follows:
where is the carbon trading price; is the annual low-carbon economic benefit of the system.
The economic reference data for assessing the annual comprehensive benefit of the system are described in Table 12.
Table 12.
Economic reference data for assessing the annual comprehensive benefit of the system.
5.5. Carbon Payback Period (CPP) of the System
CPP is the ratio of the initial carbon investment cost of the solar and wind energy system to the annual low-carbon benefit from the system. It is given as:
6. Results and Discussion
6.1. Electricity Generation by the Hybrid Renewable Energy Harvester System
According to Equation (1), the specifications of the solar PV panel in Table 3, the monthly solar radiation of Subang city, Malaysia in Figure 12, and other calculation parameters in Table 4, the annual electricity generation by the solar energy system is calculated to be approximately 20.433 MWh/year. With reference to Equation (2), the specifications of the wind turbine in Table 2, the parameters for calculating the power output of the wind turbine in Table 5, and the wind speed data at the region of the wind turbine in Figure 14, the annual electricity generation by the wind energy system is approximately 0.697 MWh/year. The building with the hybrid renewable energy harvester system is placed to face the north-northwest in the fourth quadrant (300°–320°) in order to take advantage of as much wind energy as possible, as shown in Figure 16.
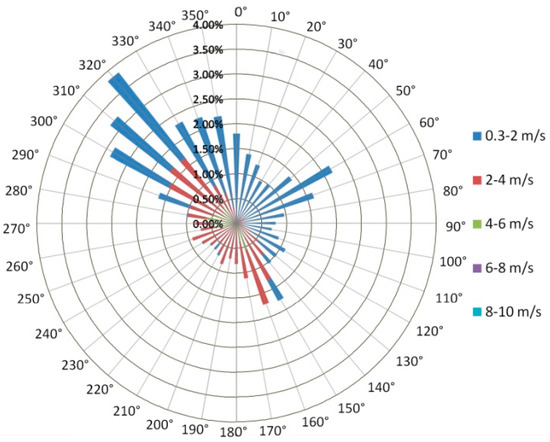
Figure 16.
Wind direction frequency in Subang.
6.2. Low-Carbon Benefit of the Hybrid Renewable Energy Harvester System
Solar and wind power generation can reduce the consumption of traditional fuels, thus helping to reduce carbon emissions. Therefore, the carbon dioxide emission reduction of this hybrid renewable energy harvester system is considered as a low-carbon positive factor. The initial carbon investment cost of the system (including the process of raw material production, equipment manufacturing, equipment transportation, and system installation) and the maintenance carbon cost of the system are the low-carbon negative factors. In this study, it is assumed that the life cycle of the system is 20 years. According to Equation (4) and the result from Section 6.1, the annual carbon dioxide emission reduction of the system is estimated to be 15.340 t. According to Equations (6) and (8) and the parameters in Table 8, Table 9 and Table 10, the initial carbon investment cost of the system is estimated to be 65.653 t. With regards to Equations (7) and (9), the maintenance carbon cost of the system is calculated to be 3.283 t. Thus, the annual low-carbon benefit of the system is estimated to be 11.894 t based on Equation (3). According to Equation (14), the CPP of the hybrid renewable energy harvester system is calculated to be about five years.
6.3. Economic Evaluation of the Hybrid Renewable Energy Harvester System
The LCC approach was adopted to estimate the investment costs and economic benefits throughout the life cycle; moreover, it calculates the payback period of the capital and operating costs as well as the NPV over the life cycle. In the economic evaluation of the system, some economic parameters need to be considered, including the FiT rate, fluctuation rate of the FiT, extra property tax, market discount rate, operating and maintenance price, fluctuation rate of the operating and maintenance price, the fluctuation rate of the extra property tax, etc. Furthermore, the commodity price (including energy price) fluctuation in Malaysia is mainly determined by market factors, while the government regulatory measures also have an impact on the energy price [87]. The commercial FiT rate of renewable energy generation is about $0.2/kW h [84], as shown in Table 12. According to the trend of the FiT rate in Malaysia, its rate is assessed to be 10% per year [27]. The additional property tax and the market discount rate are expected to be 2% and 8%, respectively [27,88]. Furthermore, the operating and maintenance price of the solar and wind energy system is expected to be $0.011 per kW h [81] and $0.029 per kW h [82,83], increasing by 2.13% per year according to the price trends [89]. Detailed economic parameters for the economic evaluation are listed in Table 13.
Table 13.
Economic parameters.
The saving (E) of this hybrid renewable energy harvester system is the difference of the commercial electricity tariff rate (CETR) and the cost of energy production (CEP) which is given as
E = CETR − CEP.
However, the present worth factor (PWF) is employed to define the economic revenue of this hybrid renewable energy harvester system. In this study, it is assumed that the annual electricity output of the system is replicated and the feed-in tariff fluctuates at a rate of i yearly, hence the PWF is estimated by the following formula:
where N is the period for the economic estimation, i is the fluctuation rate, and d is the market discount factor. In order to determine the present value (PVE) of the income for the Nth year, the following equation is adopted:
Thus, the NPV of the system is the summation of the present value within a given period of time and it is obtained from the aforesaid calculations. The economic evaluation of the hybrid renewable energy harvester system indicates that the cash flow breakeven appeared at the year of 11 (total 20-year life cycle). The cumulative NPV of the system over a cycle time (20 years) is $52,207.25 under the condition of a market discount rate of 8%, as referred to in Figure 17. In the economic evaluation of the system, the initial carbon investment cost price, maintenance carbon cost price of the system, as well as the low-carbon economic profit price of the electricity generated by the system are taken into account; those prices are calculated based on the international carbon trading price [85,86]. Table 14 shows the financial analysis of the system.
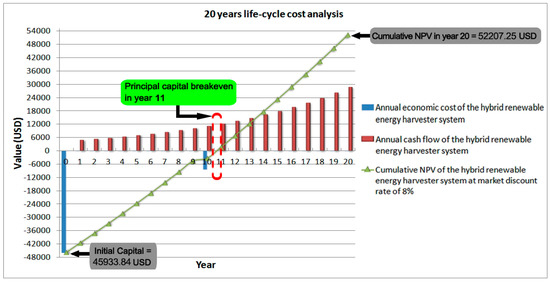
Figure 17.
Cost-effectiveness analysis of the hybrid renewable energy harvester system in 20-year life cycle.
Table 14.
The financial analysis of the hybrid renewable energy harvester system (solar and wind energy system) in Subang city, Malaysia (20-year life cycle).
6.4. Sensitivity Analysis
Sensitivity analysis is conducted to investigate the impact of the variation of the input parameters on the low-carbon and economic benefits of the system and to determine the most sensitive parameters. In this study, the parameters varied in the sensitivity analysis includes solar radiation, wind speed, as well as some economic parameters (inflation rate of price). The model employed for this sensitivity analysis works as intended, which can ensure that the expected increase and decrease can be found.
6.4.1. Sensitivity Analysis of Solar Radiation
The solar radiation per month is varied from 133.119 kW h m−2 (minimum) to 174.656 kW h m−2 (maximum) between 2012 to 2014. In order to ensure consistency of the analysis, the wind speed, solar PV panels, wind turbines, and the economic parameters have remained the same. As shown in Table 15, the power output of the system increases from 18.522 MWh/year to 24.083 MWh/year with an increase of 30.03% due to the increasing solar radiation values. Compared with the results calculated by the mean solar radiation value in this study, they decrease by 14.08% and increase by 13.98%, respectively. It is also observed that the annual carbon dioxide emission reduction of this hybrid renewable energy harvester system varies from 13.447 t to 17.484 t. The annual low-carbon benefit of the system increases from 10.000 t to 14.037 t, which reduces by 18.94% and increases by 18.01% comparing to the result in this study. Subsequently, the accumulated NPV of the system over a 20-year life cycle increases from $39,598.765 to $66,482.230, which decreases by 31.84% and increases by 27.34% compared to the accumulated NPV calculated in Section 6.3.
Table 15.
The impact of solar radiation on the environmental and economic profitability variables in this system.
6.4.2. Sensitivity Analysis of Wind Speed
Between 2012 and 2014, the monthly minimum and maximum wind speed at the location of wind turbines was 2.700 m/s and 4.075 m/s. In order to ensure consistency of the analysis, solar radiation, solar PV panels, wind turbines, and the economic parameters have remained the same. According to calculations, the power output of the system increases from 20.739 MWh/year to 21.487 MWh/year, as shown in Table 16. Compared with the energy generation of the system in this study, they decreased by 1.883% and increased by 1.69%, respectively. Additionally, it is observed that the annual carbon dioxide emission reduction of the system varies from 15.057 t to 15.600 t. The annual low-carbon benefit of the system increases from 11.610 t to 12.153 t. Subsequently, the accumulated NPV of the system over a 20-year life cycle increases from $50,401.809 to $53,795.838, which decreases by 3.58% and increases by 3.04% compared to the accumulated NPV calculated in Section 6.3.
Table 16.
The impact of wind speed on the environmental and economic profitability variables in this system.
6.4.3. Sensitivity Analysis of Economic Parameter
According to the trend of cost price inflation rate in Malaysia in the past five years, the minimum and maximum price inflation rate of 0.98% and 3.79% are adopted to forecast the variations in the environmental and economic performance of the system. In order to ensure consistency of the analysis, solar radiation, wind speed, solar PV panels, and wind turbines have remained the same. Therefore, the power output, annual carbon dioxide emission reduction, and annual low-carbon benefit of the system are consistent with the results calculated in Section 6.1, Section 6.2 and Section 6.3. The accumulated NPV of the system over 20 years varies from $52,880.810 to $51,092.459, which increases by 1.29% and decreases by 2.18% compared to the accumulated NPV calculated in Section 6.3, as shown in Table 17.
Table 17.
The impact of cost price inflation rate on the environmental and economic profitability variables in this system.
In summary, solar radiation is the parameter with the largest impact on the variables related to the environmental and economic profitability (power output, carbon dioxide emission reduction, low-carbon benefit, and accumulated NPV) of the hybrid renewable energy harvester system at the selected installation location (Subang, Malaysia).
7. Conclusions
In this paper, a techno–environment–economic analysis has been conducted on a novel hybrid renewable energy harvester system for a residential application with an electricity generation system (VAWTs and solar PV system) and a recovery system (rainwater utilization system, heat rejection air vent, and daylight harvester). This system can partially meet the energy requirements of the building where it is installed and help to make the electricity supply of the building partially independent. The most visible feature of the system is a VRGV, which is installed on top of the building; it augments the wind flow to reach the wind turbines to improve the power performance of the wind turbines. This technical viability study shows that a wind velocity percentage increment of 63% can be obtained in the presence of the VRGV with an inclination angle of 19.5° via CFD simulations and experiments. The VRGV design can enhance the self-starting behavior of the VAWT mounted on the double-sloped roof by 13.78% more than that of the case without the VRGV [30]. Higher power coefficient values can be achieved by the VAWT mounted in this hybrid renewable energy harvester system with the VRGV, than that of the case without the VRGV. Taking into account the characteristics of the VRGV and its impacts on the building, the preliminary results show the possibility of its application in the areas with low wind speed.
Furthermore, the energy generation analysis shows that a residential building with the hybrid renewable energy harvester system in Subang city, Malaysia (length 15 m × width 16 m × height 17.05 m) including six VAWTs (length 1.4 m × diameter 1.2 m) and 112 solar photovoltaic panels (length 1.956 m × width 0.992 m) can generate 21.130 MWh/year.
The carbon emission reduction analysis shows that the annual carbon dioxide emission reduction of the system is estimated to be 15.340 t, and the annual low-carbon benefit of the system is calculated to be 11.894 t over the life cycle, only considering the solar and wind energy systems in the assessment process. Also, the CPP of this system is estimated to be about five years.
Consequently, an economic evaluation of this hybrid renewable energy harvester system (only considering solar and wind energy system) has been carried out. In the economic evaluation, the initial carbon investment cost price and the maintenance carbon cost price of the solar power system and the wind power system, as well as the low-carbon economic profits of the electricity generated by the solar and wind system are taken into account. The result shows that the accumulated NPV of the hybrid renewable energy harvester system over a 20-year life cycle is $52,207.25, under the condition of the market discount rate of 8%, and it was also indicated that a cash flow breakeven appeared at the 11th year.
This hybrid renewable energy harvester system can be retrofitted into a standardized configuration to be installed on an existing building for energy generation and saving, which can alleviate some problems of a hybrid energy system such as energy efficiency, visual impact, safety, and sensitivity to the wind. In this study, the selected location for the evaluation is located in a low wind speed area, hence the payback period of the system can be expected to be shorter in a high wind speed region.
For future study, a wind tunnel test will be conducted to study the detailed impact of the different wind directions on the power performance of the wind turbine in this hybrid renewable energy harvester system. Additionally, a field test will also be performed to investigate actual power generation and economic profits of an actual size prototype. In this study, only the environmental impacts and economic profits of the solar and wind energy system of the hybrid energy system were considered, without considering rainwater harvester, natural ventilation system, and daylight harvesting system. Therefore, a more comprehensive analysis methodology will be developed for this hybrid energy system in the future study.
8. Patent
A patent entitled “Wind harvester installation on a building” (Application NO: PI 2016703622) resulted from the project described in this paper (refer to Figure 18).
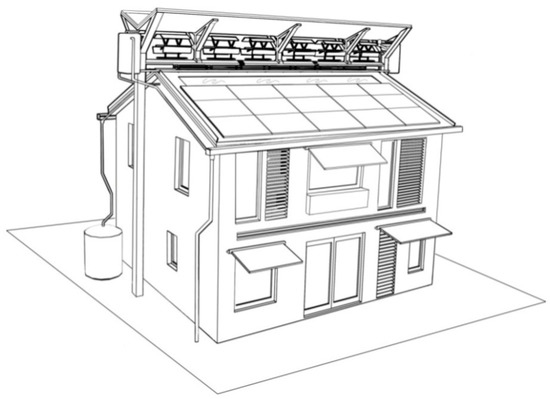
Figure 18.
Harvester installation on a building.
Author Contributions
Conceptualization, X.W. and W.C.; methodology, X.W. and K.W.; software, X.W. and K.W.; data curation, L.S.; writing—original draft preparation, X.W.; writing—review and editing, X.X. and C.-T.W.; supervision, W.C. and S.L.
Funding
This research was funded by University of Malaya for the UMRG grant (RP043A-17AET) and the Malaysian Ministry of Higher Education for the Fundamental Research Grant Scheme (FP053-2017A), as well as the RU grant ST016-2018.
Acknowledgments
The acknowledgment will be expressed by the authors to Guangxi Department of Education for the research grant allocated (KY2016LX422). Special appreciation is also credited to Qinzhou Advanced Technology Laboratory for IOT.
Conflicts of Interest
The authors declare no conflict of interest.
Nomenclature
| VRGV | V-shaped roof guide vane |
| LCC | Life cycle cost |
| NPV | Net present value |
| CPP | Carbon payback period |
| PV | Photovoltaic |
| PAGV | Power augmentation guide vane |
| LCA | Life cycle assessment |
| LCOE | Levelized cost of energy |
| EPBT | Energy payback time |
| ROI | Return on investment |
| BCR | Benefit to cost ratio |
| IRR | Internal rate of return |
| UEC | Unit energy cost |
| PBP | Payback period |
| VAWTs | Vertical axis wind turbines |
| CFD | Computational fluid dynamics |
| PR | Performance ratio |
| CETR | Commercial electricity tariff rate |
| CEP | Cost of energy production |
| PWF | Present worth factor |
| PVE | Present value |
| A | Coverage area of a wind turbine |
| K | Shadow influence factor |
| N | Period for the economic estimation |
| Acells | Active area of a solar photovoltaic panel |
| As | Total effective areas of the solar PV panels |
| Gs | Annual average solar radiation value |
| εpv | Influence factor of dip angle and direction of solar PV panel |
| ηps | Module conversion efficiency |
| ρ | Air density |
| Cp | Rotor efficiency |
| ηg | Wind turbine efficiency |
| ηWD | Loss factor in wind direction |
| V’ | Increased wind velocity |
| Cn | Annual low carbon benefit |
| Annual carbon dioxide emission reduction | |
| Annual carbon dioxide emission | |
| mc | Carbon dioxide emission factor for power generation |
| C0s | Initial carbon investment cost of the solar energy system |
| C0w | Initial carbon investment cost of the wind energy system |
| Cms | Maintenance carbon cost of the solar energy system |
| Cmw | Maintenance carbon cost of the wind energy system |
| k | Electric energy consumed by the producing unit power solar photovoltaic panel |
| P0 | Total capacity of the solar energy system |
| W1 | Total weight of the solar energy system |
| g | Carbon dioxide emission intensity of the transportation |
| S1 | Distance between the location of the solar PV panel manufacturer and the project site |
| m | Species of material required to install the solar PV panels |
| i | ith material required to install the solar PV panels |
| λi | Carbon dioxide emission coefficient of the ith material |
| Gi | Weight of the ith material |
| β | Ratio of operating and maintenance carbon cost of the solar energy system versus its initial carbon investment |
| n | Life of the solar PV system |
| W2 | Total weight of the wind energy system |
| S2 | Distance between the wind turbine manufacturer location and wind power plant |
| W3 | Weight of the crane |
| S3 | Distance between the location of the crane and the project site |
| mcrane | Mass of carbon dioxide emission per hour by the working crane |
| h | Working hour of the crane |
| En | Annual economic benefit |
| E1 | Annual economic income |
| Annual economic cost | |
| It | Capital investment in the tth year |
| Eopt | Operating and maintenance cost and the equipment replacement cost in the tth year |
| Pr | FiT rates of renewable energy generation |
| PT | Carbon trading price |
| d | Market discount factor |
References
- Ong, H.; Mahlia, T.; Masjuki, H. A review on energy scenario and sustainable energy in Malaysia. Renew. Sustain. Energy Rev. 2011, 15, 639–647. [Google Scholar] [CrossRef]
- Ali, R.; Daut, I.; Taib, S. A review on existing and future energy sources for electrical power generation in Malaysia. Renew. Sustain. Energy Rev. 2012, 16, 4047–4055. [Google Scholar] [CrossRef]
- Kaundinya, D.P.; Balachandra, P.; Ravindranath, N.H. Grid-connected versus stand-alone energy systems for decentralized power—A review of literature. Renew. Sustain. Energy Rev. 2009, 13, 2041–2050. [Google Scholar] [CrossRef]
- Zhang, Q.; Zhang, J.; Chemori, A.; Xiang, X. Virtual submerged floating operational system for robotic manipulation. Complexity 2018, 2018, 9528313. [Google Scholar] [CrossRef]
- Office, G.P. International Energy Outlook 2016: With Projections to 2040, 3rd ed.; Energy Information Administration: Washington, DC, USA, 2016; pp. 101–111.
- Petinrin, J.; Shaaban, M. Renewable energy for continuous energy sustainability in Malaysia. Renew. Sustain. Energy Rev. 2015, 50, 967–981. [Google Scholar] [CrossRef]
- Shafie, S.; Mahlia, T.; Masjuki, H.; Ahmad-Yazid, A. A review on electricity generation based on biomass residue in Malaysia. Renew. Sustain. Energy Rev. 2012, 16, 5879–5889. [Google Scholar] [CrossRef]
- Sulaiman, F.; Abdullah, N.; Gerhauser, H.; Shariff, A. A perspective of oil palm and its wastes. J. Phys. Sci. 2010, 21, 67–77. [Google Scholar]
- Commission, E. Peninsular Malaysia Electricity Supply Industry Outlook 2017; Energy Commission: Putrajaya, Malaysia, 2017; pp. 5–18.
- Malaysia Electricity Consumption. Available online: https://www.ceicdata.com/zh-hans/malaysia/electricity-generation-and-consumption/electricity-consumption (accessed on 15 February 2019).
- Mahlia, T. Emissions from electricity generation in Malaysia. Renew. Energy 2002, 27, 293–300. [Google Scholar] [CrossRef]
- Zeng, S.; Wang, Y. Economic Evaluation of Wind Energy Utilization for Building Integrated Wind Turbine System. Value Eng. 2015, 19, 53–56. [Google Scholar] [CrossRef]
- Mostafaeipour, A.; Bardel, B.; Mohammadi, K.; Sedaghat, A.; Dinpashoh, Y. Economic evaluation for cooling and ventilation of medicine storage warehouses utilizing wind catchers. Renew. Sustain. Energy Rev. 2014, 38, 12–19. [Google Scholar] [CrossRef]
- Bahaj, A.; Myers, L.; James, P. Urban energy generation: Influence of micro-wind turbine output on electricity consumption in buildings. Energy Build. 2007, 39, 154–165. [Google Scholar] [CrossRef]
- Beyer, H.G.; Langer, C. A method for the identification of configurations of PV/wind hybrid systems for the reliable supply of small loads. Sol. Energy 1996, 57, 381–391. [Google Scholar] [CrossRef]
- Zahnd, A.; Clark, A.; Cheung, W.; Zou, L.; Kleissl, J. Minimizing the lead-acid battery bank capacity through a solar PV-Wind turbine hybrid system for a high-altitude village in the Nepal Himalayas. Energy Procedia 2014, 57, 1516–1525. [Google Scholar] [CrossRef]
- Bekele, G.; Palm, B. Feasibility study for a standalone solar–wind-based hybrid energy system for application in Ethiopia. Appl. Energy 2010, 87, 487–495. [Google Scholar] [CrossRef]
- Jurasz, J.; Beluco, A.; Canales, F.A. The impact of complementarity on power supply reliability of small scale hybrid energy systems. Energy 2018, 161, 737–743. [Google Scholar] [CrossRef]
- Kalantar, M. Dynamic behavior of a stand-alone hybrid power generation system of wind turbine, microturbine, solar array and battery storage. Appl. Energy 2010, 87, 3051–3064. [Google Scholar] [CrossRef]
- Ekren, O.; Ekren, B.Y. Size optimization of a PV/wind hybrid energy conversion system with battery storage using response surface methodology. Appl. Energy 2008, 85, 1086–1101. [Google Scholar] [CrossRef]
- Fathy, A. A reliable methodology based on mine blast optimization algorithm for optimal sizing of hybrid PV-wind-FC system for remote area in Egypt. Renew. Energy 2016, 95, 367–380. [Google Scholar] [CrossRef]
- Yang, H.; Lu, L.; Zhou, W. A novel optimization sizing model for hybrid solar-wind power generation system. Sol. Energy 2007, 81, 76–84. [Google Scholar] [CrossRef]
- Levine, M.D.; Price, L.; Martin, N. Mitigation options for carbon dioxide emissions from buildings: A global analysis. Energy Policy 1996, 24, 937–949. [Google Scholar] [CrossRef]
- Wiel, S.; Martin, N.; Levine, M.; Price, L.; Sathaye, J. The role of building energy efficiency in managing atmospheric carbon dioxide. Environ. Sci. Policy 1998, 1, 27–38. [Google Scholar] [CrossRef]
- Ürge-Vorsatz, D.; Novikova, A. Potentials and costs of carbon dioxide mitigation in the world’s buildings. Energy Policy 2008, 36, 642–661. [Google Scholar] [CrossRef]
- Yang, H.; Wei, Z.; Chengzhi, L. Optimal design and techno-economic analysis of a hybrid solar-wind power generation system. Appl. Energy 2009, 86, 163–169. [Google Scholar] [CrossRef]
- Chong, W.T.; Naghavi, M.S.; Poh, S.C.; Mahlia, T.M.I.; Pan, K.C. Techno-economic analysis of a wind-solar hybrid renewable energy system with rainwater collection feature for urban high-rise application. Appl. Energy 2011, 88, 4067–4077. [Google Scholar] [CrossRef]
- Chong, W.T.; Fazlizan, A.; Poh, S.C.; Pan, K.C.; Ping, H.W. Early development of an innovative building integrated wind, solar and rain water harvester for urban high rise application. Energy Build. 2012, 47, 201–207. [Google Scholar] [CrossRef]
- Contino, R.; Leva, S.; Zaninelli, D. Integrated renewable sources for supplying remote power systems. WSEAS Trans. Power Syst. 2007, 2, 41–48. [Google Scholar]
- Wang, X.; Chong, W.; Wong, K.; Saw, L.; Poh, S.; Lai, S.; Wang, C.-T. Preliminary Performance Tests and Simulation of a V-Shape Roof Guide Vane Mounted on an Eco-Roof System. Energies 2018, 11, 2846. [Google Scholar] [CrossRef]
- Buker, M.S.; Mempouo, B.; Riffat, S.B. Performance evaluation and techno-economic analysis of a novel building integrated PV/T roof collector: An experimental validation. Energy Build. 2014, 76, 164–175. [Google Scholar] [CrossRef]
- Mithraratne, N. Roof-top wind turbines for microgeneration in urban houses in New Zealand. Energy Build. 2009, 41, 1013–1018. [Google Scholar] [CrossRef]
- Pereira, R.P.T.; Ribeiro, G.M.; Filimonau, V. The carbon footprint appraisal of local visitor travel in Brazil: A case of the Rio de Janeiro-São Paulo itinerary. J. Clean. Prod. 2017, 141, 256–266. [Google Scholar] [CrossRef]
- Wang, W.-C.; Teah, H.-Y. Life cycle assessment of small-scale horizontal axis wind turbines in Taiwan. J. Clean. Prod. 2017, 141, 492–501. [Google Scholar] [CrossRef]
- Ardente, F.; Beccali, M.; Cellura, M.; Brano, V.L. Energy performances and life cycle assessment of an Italian wind farm. Renew. Sustain. Energy Rev. 2008, 12, 200–217. [Google Scholar] [CrossRef]
- Riggs, B.C.; Biedenharn, R.; Dougher, C.; Ji, Y.V.; Xu, Q.; Romanin, V.; Codd, D.S.; Zahler, J.M.; Escarra, M.D. Techno-economic analysis of hybrid PV/T systems for process heat using electricity to subsidize the cost of heat. Appl. Energy 2017, 208, 1370–1378. [Google Scholar] [CrossRef]
- Ramos, A.; Chatzopoulou, M.A.; Guarracino, I.; Freeman, J.; Markides, C.N. Hybrid photovoltaic-thermal solar systems for combined heating, cooling and power provision in the urban environment. Energy Convers. Manag. 2017, 150, 838–850. [Google Scholar] [CrossRef]
- Wilson, R.; Young, A. The embodied energy payback period of photovoltaic installations applied to buildings in the UK. Build. Environ. 1996, 31, 299–305. [Google Scholar] [CrossRef]
- Zhang, X.; Shen, J.; Adkins, D.; Yang, T.; Tang, L.; Zhao, X.; He, W.; Xu, P.; Liu, C.; Luo, H. The early design stage for building renovation with a novel loop-heat-pipe based solar thermal facade (LHP-STF) heat pump water heating system: Techno-economic analysis in three European climates. Energy Convers. Manag. 2015, 106, 964–986. [Google Scholar] [CrossRef]
- Michael, J.J.; Selvarasan, I. Economic analysis and environmental impact of flat plate roof mounted solar energy systems. Sol. Energy 2017, 142, 159–170. [Google Scholar] [CrossRef]
- Herrando, M.; Markides, C.N.; Hellgardt, K. A UK-based assessment of hybrid PV and solar-thermal systems for domestic heating and power: System performance. Appl. Energy 2014, 122, 288–309. [Google Scholar] [CrossRef]
- Lenzen, M.; Munksgaard, J. Energy and CO2 life-cycle analyses of wind turbines—Review and applications. Renew. Energy 2002, 26, 339–362. [Google Scholar] [CrossRef]
- Krauter, S.; Rüther, R. Considerations for the calculation of greenhouse gas reduction by photovoltaic solar energy. Renew. Energy 2004, 29, 345–355. [Google Scholar] [CrossRef]
- Korsavi, S.S.; Zomorodian, Z.S.; Tahsildoost, M. Energy and economic performance of rooftop PV panels in the hot and dry climate of Iran. J. Clean. Prod. 2018, 174, 1204–1214. [Google Scholar] [CrossRef]
- Al Busaidi, A.S.; Kazem, H.A.; Al-Badi, A.H.; Khan, M.F. A review of optimum sizing of hybrid PV—Wind renewable energy systems in oman. Renew. Sustain. Energy Rev. 2016, 53, 185–193. [Google Scholar] [CrossRef]
- Nookuea, W.; Campana, P.E.; Yan, J. Evaluation of solar PV and wind alternatives for self renewable energy supply: Case study of shrimp cultivation. Energy Procedia 2016, 88, 462–469. [Google Scholar] [CrossRef]
- Guezuraga, B.; Zauner, R.; Pölz, W. Life cycle assessment of two different 2 MW class wind turbines. Renew. Energy 2012, 37, 37–44. [Google Scholar] [CrossRef]
- Wang, Y.; Sun, T. Life cycle assessment of CO2 emissions from wind power plants: Methodology and case studies. Renew. Energy 2012, 43, 30–36. [Google Scholar] [CrossRef]
- Kannan, R.; Leong, K.; Osman, R.; Ho, H.; Tso, C. Life cycle assessment study of solar PV systems: An example of a 2.7 kWp distributed solar PV system in Singapore. Sol. Energy 2006, 80, 555–563. [Google Scholar] [CrossRef]
- Ito, M.; Komoto, K.; Kurokawa, K. Life-cycle analyses of very-large scale PV systems using six types of PV modules. Curr. Appl. Phys. 2010, 10, S271–S273. [Google Scholar] [CrossRef]
- Siow, W.S. Formulation of Empirical Models for Solar Module by Optimisation of Its Tilt-Angle under Natural Conditions. Master’s Thesis, Universiti Putra Malaysia, Seri Kembangan, Malaysia, 2001. [Google Scholar]
- Hang, W.X.; Tong, C.W.; Hoe, W.K.; Chin-Tsan, W.; Huat, S.L.; Chew, P.S.; Hin, L.S. Preliminary Assessment of Optimized Accessorial Roof Shape for Performance of Wind Turbine Mounted on Eco-Roof System. Int. J. Pract. Eng. Manuf. Green Technol. 2018, 5, 375–385. [Google Scholar] [CrossRef]
- Silent Vertical Axis Wind Turbine. Available online: https://www.alibaba.com/product-detail/Silent1kw-48v-96v-220v-vertical-wind_60788254789.html?spm=a2700.7724838.2017203.3.4f646d361WyVvf&s=p (accessed on 29 March 2019).
- 300 W Monocrystalline Solar Panel. SingfoSolar. Available online: https://detail.1688.com/offer/521377075464.html?spm=a261b.2187593.1998088710.175.LPu4rx (accessed on 29 March 2019).
- Mondol, J.D.; Yohanis, Y.G.; Norton, B. The impact of array inclination and orientation on the performance of a grid-connected photovoltaic system. Renew. Energy 2007, 32, 118–140. [Google Scholar] [CrossRef]
- Dominguez, A.; Kleissl, J.; Luvall, J.C. Effects of solar photovoltaic panels on roof heat transfer. Sol. Energy 2011, 85, 2244–2255. [Google Scholar] [CrossRef]
- Elnozahy, A.; Rahman, A.K.A.; Ali, A.H.H.; Salam, M.A.; Ookawara, S. Performance of a PV module integrated with standalone building in hot arid areas as enhanced by surface cooling and cleaning. Energy Build. 2015, 88, 100–109. [Google Scholar] [CrossRef]
- Chong, W.T.; Wang, X.H.; Wong, K.H.; Mojumder, J.C.; Poh, S.C.; Saw, L.H.; Lai, S.H. Performance assessment of a hybrid solar-wind-rain eco-roof system for buildings. Energy Build. 2016, 127, 1028–1042. [Google Scholar] [CrossRef]
- Decker, B.; Jahn, U. Performance of 170 grid connected PV plants in northern Germany—Analysis of yields and optimization potentials. Sol. Energy 1997, 59, 127–133. [Google Scholar] [CrossRef]
- Sustainable Energy Development Authority Malaysia. Available online: http://www.seda.gov.my/?omaneg=00010100000001010101000100001000000000000000000000&s=540 (accessed on 15 February 2019).
- Knapp, K.; Jester, T. An empirical perspective on the energy payback time for photovoltaic modules. In Proceedings of the Solar 2000 Conference, Madison, WI, USA, 16–21 June 2000; American Solar Energy Society: Sacramento, CA, USA, 2000; pp. 641–648. [Google Scholar]
- DelSolar Products & Services. Available online: http://www.delsolarpv.com/products/Module.aspx?R=ww&C=en-us (accessed on 15 February 2019).
- Wu, P.; Low, S.P. Lean and Cleaner Production; Springer: Berlin, Germany, 2016; pp. 127–130. ISBN 978-3-642-42062-7. [Google Scholar]
- Technical Parameters of Industrial Aluminum Profiles MJ-6-2525. Available online: https://detail.1688.com/offer/1169735577.html?spm=a261y.7663282.commendOffer.1.44162efbF0LPBe&scm=1007.19151.114112.0 (accessed on 15 February 2019).
- Hasanbeigi, A.; Arens, M.; Cardenas, J.C.R.; Price, L.; Triolo, R. Comparison of carbon dioxide emissions intensity of steel production in China, Germany, Mexico, and the United States. Resour. Conserv. Recycl. 2016, 113, 127–139. [Google Scholar] [CrossRef]
- Cameron, C.P.; Goodrich, A.C. The levelized cost of energy for distributed PV: A parametric study. In Proceedings of the 35th IEEE Photovoltaic Specialists Conference (PVSC 2010), Honolulu, HI, USA, 20–25 June 2010; Institute of Electrical and Electronics Engineers (IEEE): Piscataway, NJ, USA, 2010; pp. 000529–000534. [Google Scholar]
- Ren, H.; Gao, W.; Ruan, Y. Economic optimization and sensitivity analysis of photovoltaic system in residential buildings. Renew. Energy 2009, 34, 883–889. [Google Scholar] [CrossRef]
- Rankine, R.K.; Chick, J.P.; Harrison, G.P. Energy and carbon audit of a rooftop wind turbine. Proc. Inst. Mech. Eng. A 2006, 220, 643–654. [Google Scholar] [CrossRef]
- Martínez, E.; Sanz, F.; Pellegrini, S.; Jiménez, E.; Blanco, J. Life cycle assessment of a multi-megawatt wind turbine. Renew. Energy 2009, 34, 667–673. [Google Scholar] [CrossRef]
- White, S.W.; Kulcinski, G.L. Birth to death analysis of the energy payback ratio and CO2 gas emission rates from coal, fission, wind, and DT-fusion electrical power plants. Fusion Eng. Des. 2000, 48, 473–481. [Google Scholar] [CrossRef]
- Schleisner, L. Life cycle assessment of a wind farm and related externalities. Renew. Energy 2000, 20, 279–288. [Google Scholar] [CrossRef]
- Giurco, D.; Stewart, M.; Suljada, T.; Petrie, J. Copper recycling alternatives: An environmental analysis. In Proceedings of the 5th Annual Environmental Engineering Research Event, Noosa, Australia, 20–23 October 2006; pp. 20–23. [Google Scholar]
- Rieradevall, J.; Domènech, X.; Fullana, P. Application of life cycle assessment to landfilling. Int. J. Life Cycle Assess 1997, 2, 141. [Google Scholar] [CrossRef]
- Markus, E. Cradle-to-Gate Life Cycle Inventory: Canadian and US Steel Production by Mill Type; Athena Soustainable Materials Institute: Ottawa, ON, Canada, 2002; pp. 3–12. [Google Scholar]
- Eisted, R.; Larsen, A.W.; Christensen, T.H. Collection, transfer and transport of waste: Accounting of greenhouse gases and global warming contribution. Waste Manag. Res. 2009, 27, 738–745. [Google Scholar] [CrossRef] [PubMed]
- White, S.W. Net energy payback and CO2 emissions from three Midwestern wind farms: An update. Nat. Resour. Res. 2006, 15, 271–281. [Google Scholar] [CrossRef]
- Couttie, R. The Embodied CO2 of a Wind farm. Master’s Thesis, University of Strathclyde, Glasgow, UK, 2014. [Google Scholar]
- Chen, C.; Huang, J.; Wu, Y.; Ma, J.; Qin, X. Low-carbon Comprehensive Benefits Analysis Of Joint Operation Of Wind Power And Pumped Storage Station. J. Phys. Conf. Ser. 2018, 1087, 042047. [Google Scholar] [CrossRef]
- Hybrid Power Inverter Price. Available online: https://www.alibaba.com/product-detail/Intelligent-10KW-15KW-20KW-30KW-Solar_60734444969.html?spm=a2700.7724857.normalList.42.9c919230gVbbBC (accessed on 29 March 2019).
- On Grid Wind Solar Hybrid Power Controller. Available online: https://www.alibaba.com/product-detail/On-grid-wind-solar-hybrid-power_60759820819.html?spm=a2700.7724838.2017115.150.3dc94236aemTuQ (accessed on 29 March 2019).
- Photovoltaic Economics. PVresources. Available online: http://www.pvresources.com/en/economics/lcoe.php (accessed on 29 March 2019).
- Renewable Energy Technologies: Cost Analysis Series. O&M Costs for Wind Projects. Available online: https://www.irena.org/documentdownloads/publications/re_technologies_cost_analysis-wind_power.pdf (accessed on 29 March 2019).
- IEA WIND 2011 Annual Report. Available online: https://community.ieawind.org/HigherLogic/System/DownloadDocumentFile.ashx?DocumentFileKey=f1931064-1e11-0286-71f9-fe70c13a84b6&forceDialog=0 (accessed on 29 March 2019).
- FiT Rates for Renewable Sources (Solar PV) (21 Years from FiT Commencement Date). Sustainable Energy Development Authority Malaysia. Available online: http://www.seda.gov.my/ (accessed on 15 February 2019).
- Carbon Trading. Available online: http://www.sda-architect.com/carbon-trading/ (accessed on 15 February 2019).
- Energy Pricing Practice. Asia Pacific Energy Research Centre (APERC). Available online: http://www.ieej.or.jp/aperc/final/pricing.pdf (accessed on 15 February 2019).
- Tan, C.; Maragatham, K.; Leong, Y. Electricity energy outlook in Malaysia. IOP Conf. Ser. Earth Environ. Sci. 2013, 16, 012126. [Google Scholar] [CrossRef]
- Life-Cycle Thinking for the Oil and Gas Exploration and Production Industry. Argonne National Laboratory. Available online: www.evs.anl.gov/pub/dsp_detail.cfm?PubID=2154 (accessed on 15 February 2019).
- Malaysia Inflation Rate. Trading Economics. Available online: https://tradingeconomics.com/malaysia/inflation-cpi (accessed on 15 February 2019).


© 2019 by the authors. Licensee MDPI, Basel, Switzerland. This article is an open access article distributed under the terms and conditions of the Creative Commons Attribution (CC BY) license (http://creativecommons.org/licenses/by/4.0/).