Review

Evaluation of School Building Energy Performance and Classroom Indoor Environment

by
Jitka Mohelníková
1,
Miloslav Novotný
1 and
Pavla Mocová
2,*
1
Faculty of Civil Engineering, Brno University of Technology, 602 00 Brno, Czech Republic
2
Faculty of Forestry and Wood Technology, Mendel University, 613 00 Brno, Czech Republic
*
Author to whom correspondence should be addressed.
Energies 2020, 13(10), 2489; https://doi.org/10.3390/en13102489
Submission received: 21 April 2020 / Revised: 10 May 2020 / Accepted: 12 May 2020 / Published: 15 May 2020
(This article belongs to the Special Issue Building Energy Audits-Diagnosis and Retrofitting)

Abstract

:
Existing building stock represents potential for energy saving renovations. Energy savings and indoor climate comfort are key demands for sustainable building refurbishment. Especially in schools, indoor comfort is an extremely important issue. A case study of energy consumption in selected school buildings in temperate climatic conditions of Central Europe region was performed. The studied buildings are representatives of various school premises constructed throughout the last century. The evaluation was based on data analysis of energy audits. The goal was aimed at assessment of the school building envelopes and their influence on energy consumption. One of the studied schools was selected for detailed evaluation. The school classroom was monitored for indoor thermal and visual environments. The monitoring was performed to compare the current state and renovation scenarios. Results of the evaluation show that the school buildings are highly inefficient even if renovated. Indoor climate in classrooms is largely influenced by windows. Solar gains affect interior thermal stability and daylighting. Thermal insulation quality of building envelopes and efficient solar shading systems appear to be fundamental tasks of school renovation strategies.

1. Introduction

Current trends are aimed at the improvement in building energy performance and sustainability [1,2]. Modern construction methods facilitate more energy conscious buildings compared to old building stocks [2,3,4]. Newly designed buildings comply with top-level energy efficiency [5,6]. Nevertheless, building refurbishment represents a rational approach towards sustainable development [7,8]. Energy conscious renovation became one of the promising ways to reduce carbon dioxide emissions from buildings [9,10]. Existing buildings in the EU region represent massive potentials for energy savings [1,2]. Energy renovation has utmost importance for the residential and public buildings sectors. These buildings exert high energy consumption for heating and ventilation or cooling systems as well as artificial lighting.
Especially school buildings have been objects of energy saving interests. Considerable numbers of programs are focused on school buildings performance [11,12,13]. Zero emissions and high quality of indoor environment were topical tasks of the project “School of the Future”, within the frame of the EU programme [14]. The aim of the project was to communicate examples of efficient buildings under different European climates.
Strategies for energy consumption [15,16,17,18,19,20,21] and thermal comfort assessments [22,23,24,25,26] were developed for educational buildings.
Energy efficiency, together with indoor climate comfort, are key features of good practice school performances in accordance with sustainable architecture principles [27,28]. Building envelopes play a substantial role in the built environment [29,30]. Particularly windows influence indoor thermal and visual comfort [31,32,33].
The abovementioned overview shows the importance of energy efficiency and indoor climate conscious attitudes [34] towards educational buildings. A study focused on the assessment of selected representatives of school buildings in temperate climatic conditions was performed to evaluate their energy saving potentials in accordance with recent trends of highly energy efficient schools in Central Europe [35].

2. Materials and Methods

A case study aimed at an analysis of energy consumption in selected school buildings in the Central Europe region was performed. The studied buildings are representatives of various school premises. The evaluation was based on the analysis of data from energy audits for specification of current state of building envelopes and their influence on energy consumption. One of the studied schools was selected for detailed evaluation. The school classroom was monitored for indoor thermal and visual climate.

2.1. Analysis of Energy Audits

The selected schools [36] were studied for their energy consumption. They are representatives of an existing school building stock of construction styles throughout the last century. Many schools are very old and some of them are listed as historically protected premises. Most of them are energy inefficient. Thermal insulation improvements and windows retrofit are required for upgraded efficiency. The case study is focused on analysis of the buildings’ energy performance and renovation potentials.
The school buildings were selected in accordance with the building site locality and climatic conditions, (Figure 1 and Table 1). The buildings’ construction is commonly represented by solid brick (70%) and ceramic block (18%) masonry systems or reinforced concrete prefabricated technology (12%). Central gas heating is widely used in the schools, while electric heating has minor application. The school buildings’ energy consumption is spent on heating and hot water services (80%), artificial lighting and electric appliances (12%) and auxiliary energy demands (8%).

2.2. School Classroom Thermal and Daylight Evaluation

One of the studied buildings was selected for detail evaluations—building 18 (Table 1). The main goal was thermal and daylight assessment of the school classrooms. The school building constructed in 1894 is listed as a historically protected premise (Figure 2) [37]. The three-storey building has a solid brick masonry and roof truss load-bearing structures. The ground floor is dedicated to the main entrance and school facilities as well as management and administrative departments. Educational rooms are on the first and second floor.
The school building maintenance has been limited by design obstructions like many other historical premises. The building was renovated in 2014 under an architectural preservation review. The renovation was mainly aimed at the building envelope. Window and facade retrofit was completed. It was not allowed to change the historical style of the facade and for this reason, external walls were thermally insulated from the interior side.
The school has spacious side lit classrooms. One of them, located on the second floor, was selected for the evaluation. Firstly, the classroom thermal assessment was performed for the current state and compared with renovation scenarios. Secondly, the classroom daylight evaluation was carried out. Daylight illuminance and luminance measurements were taken and completed with a daylight simulation study.

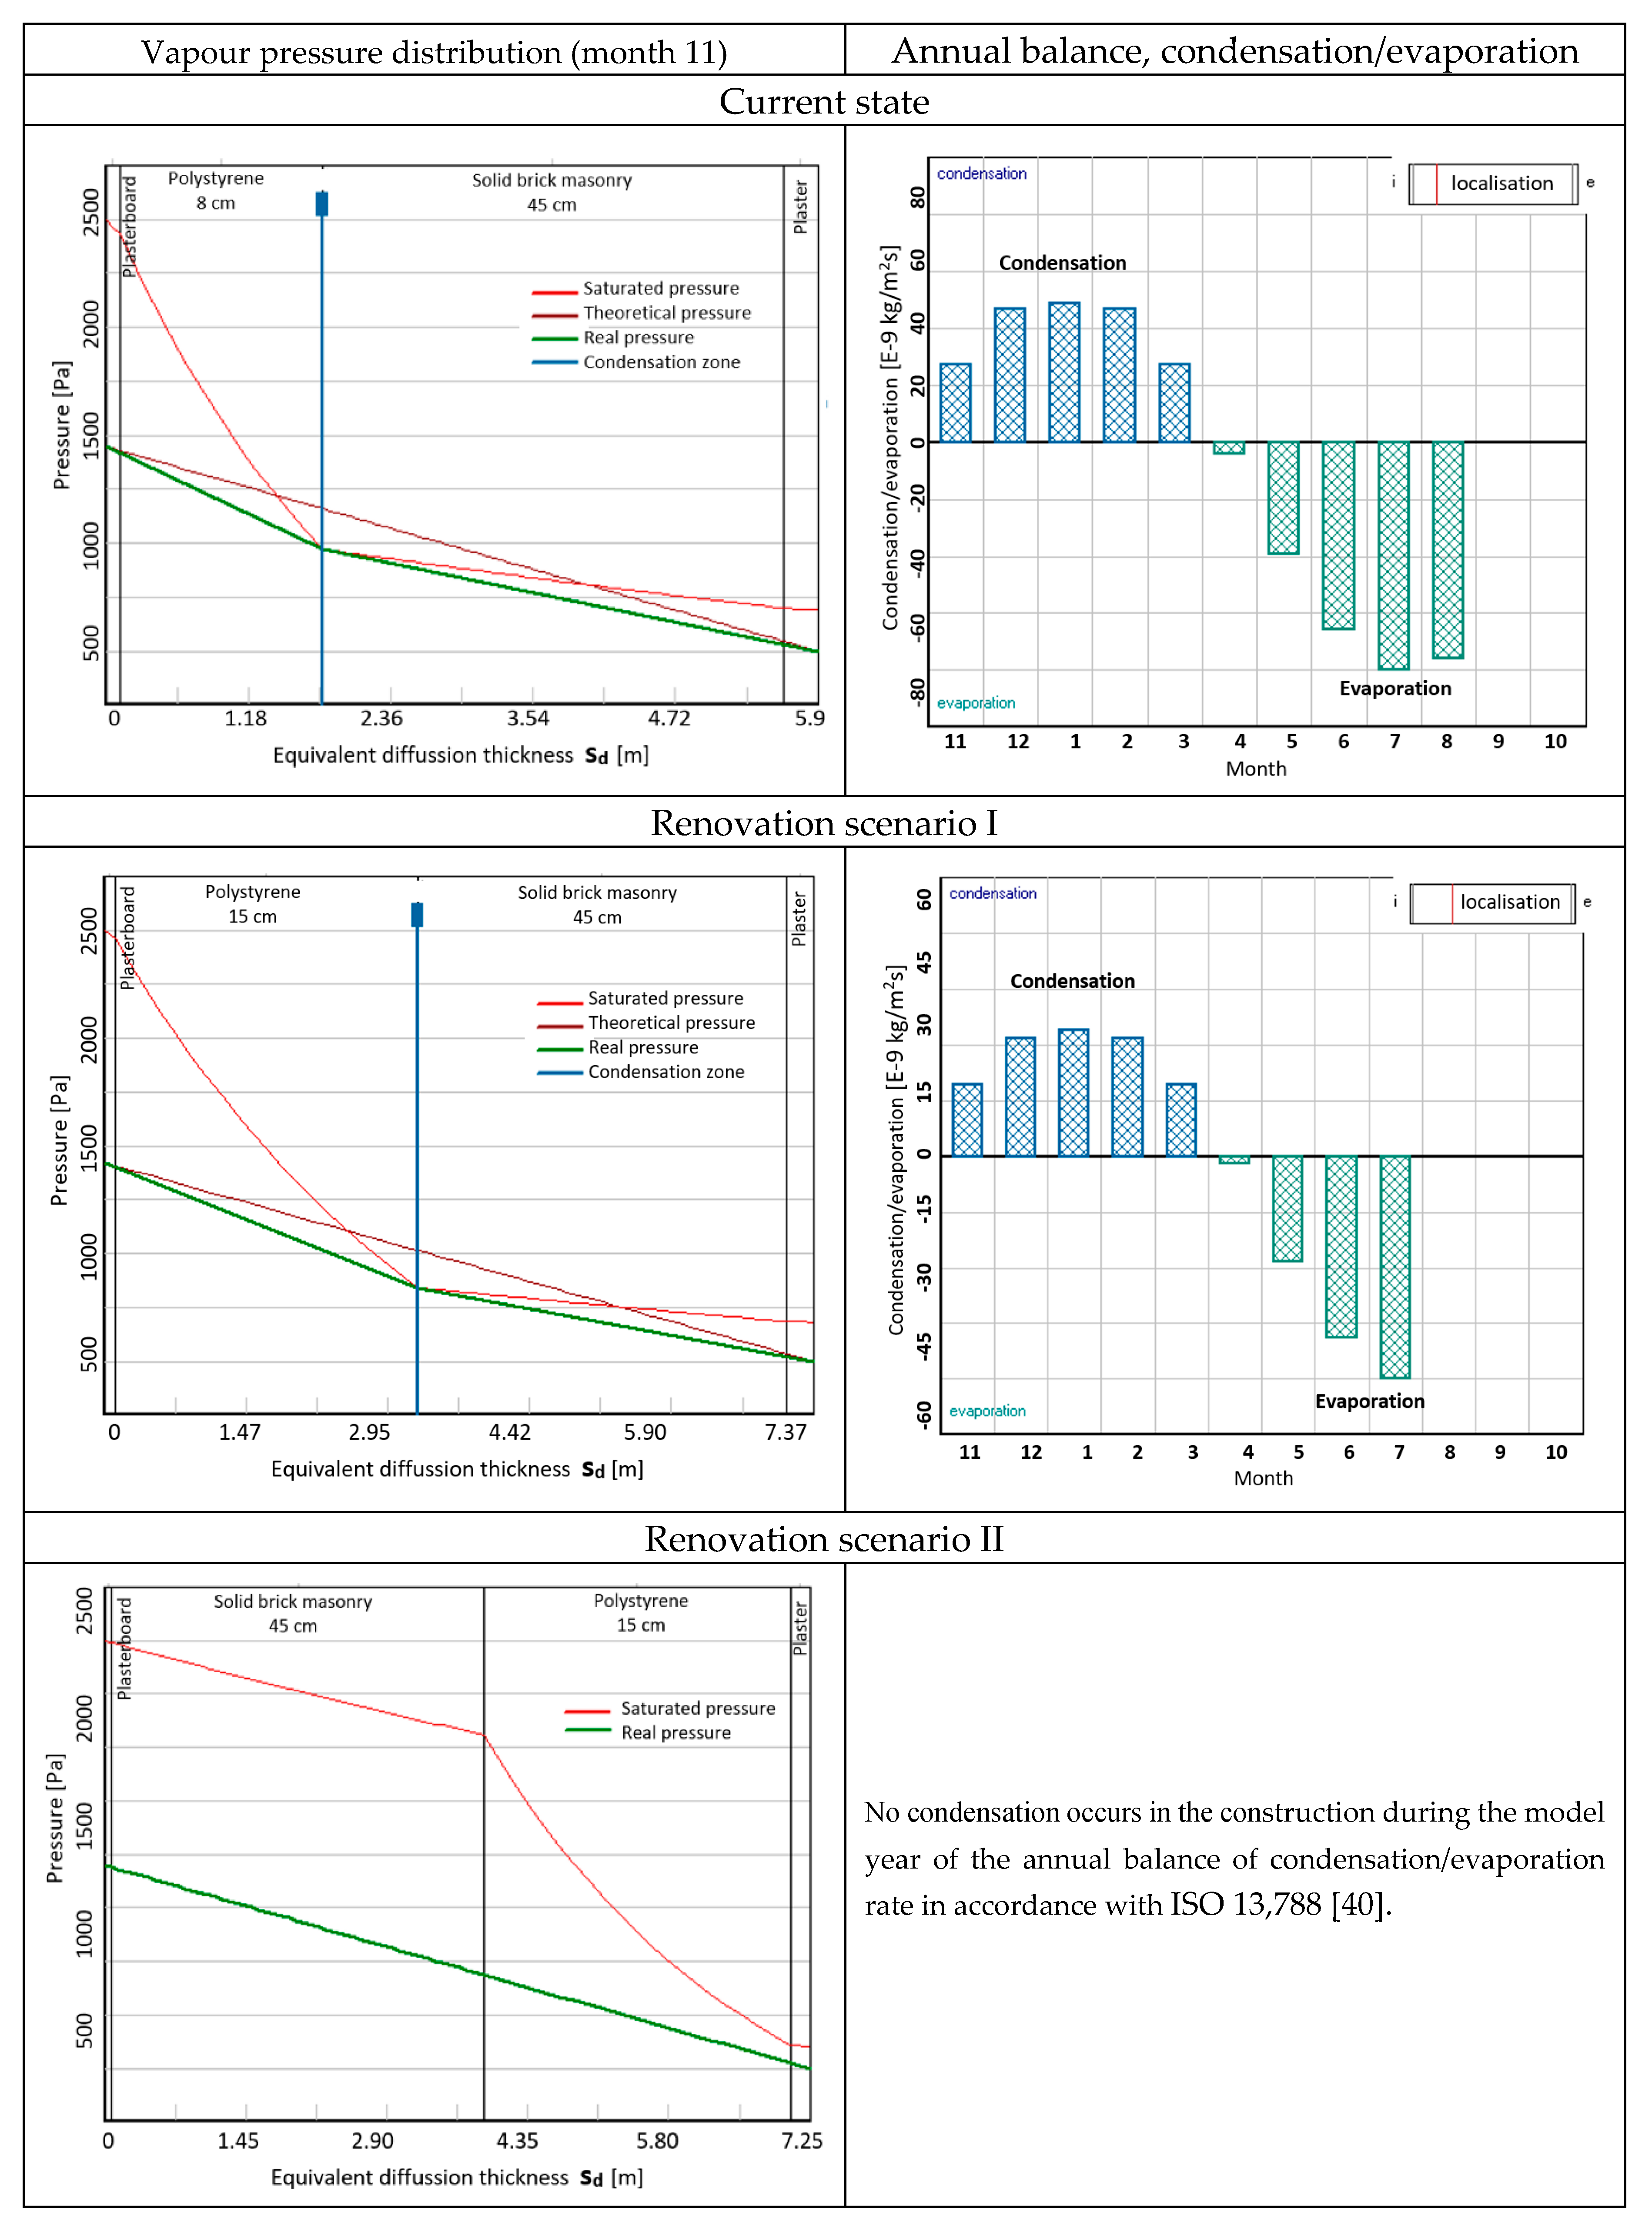
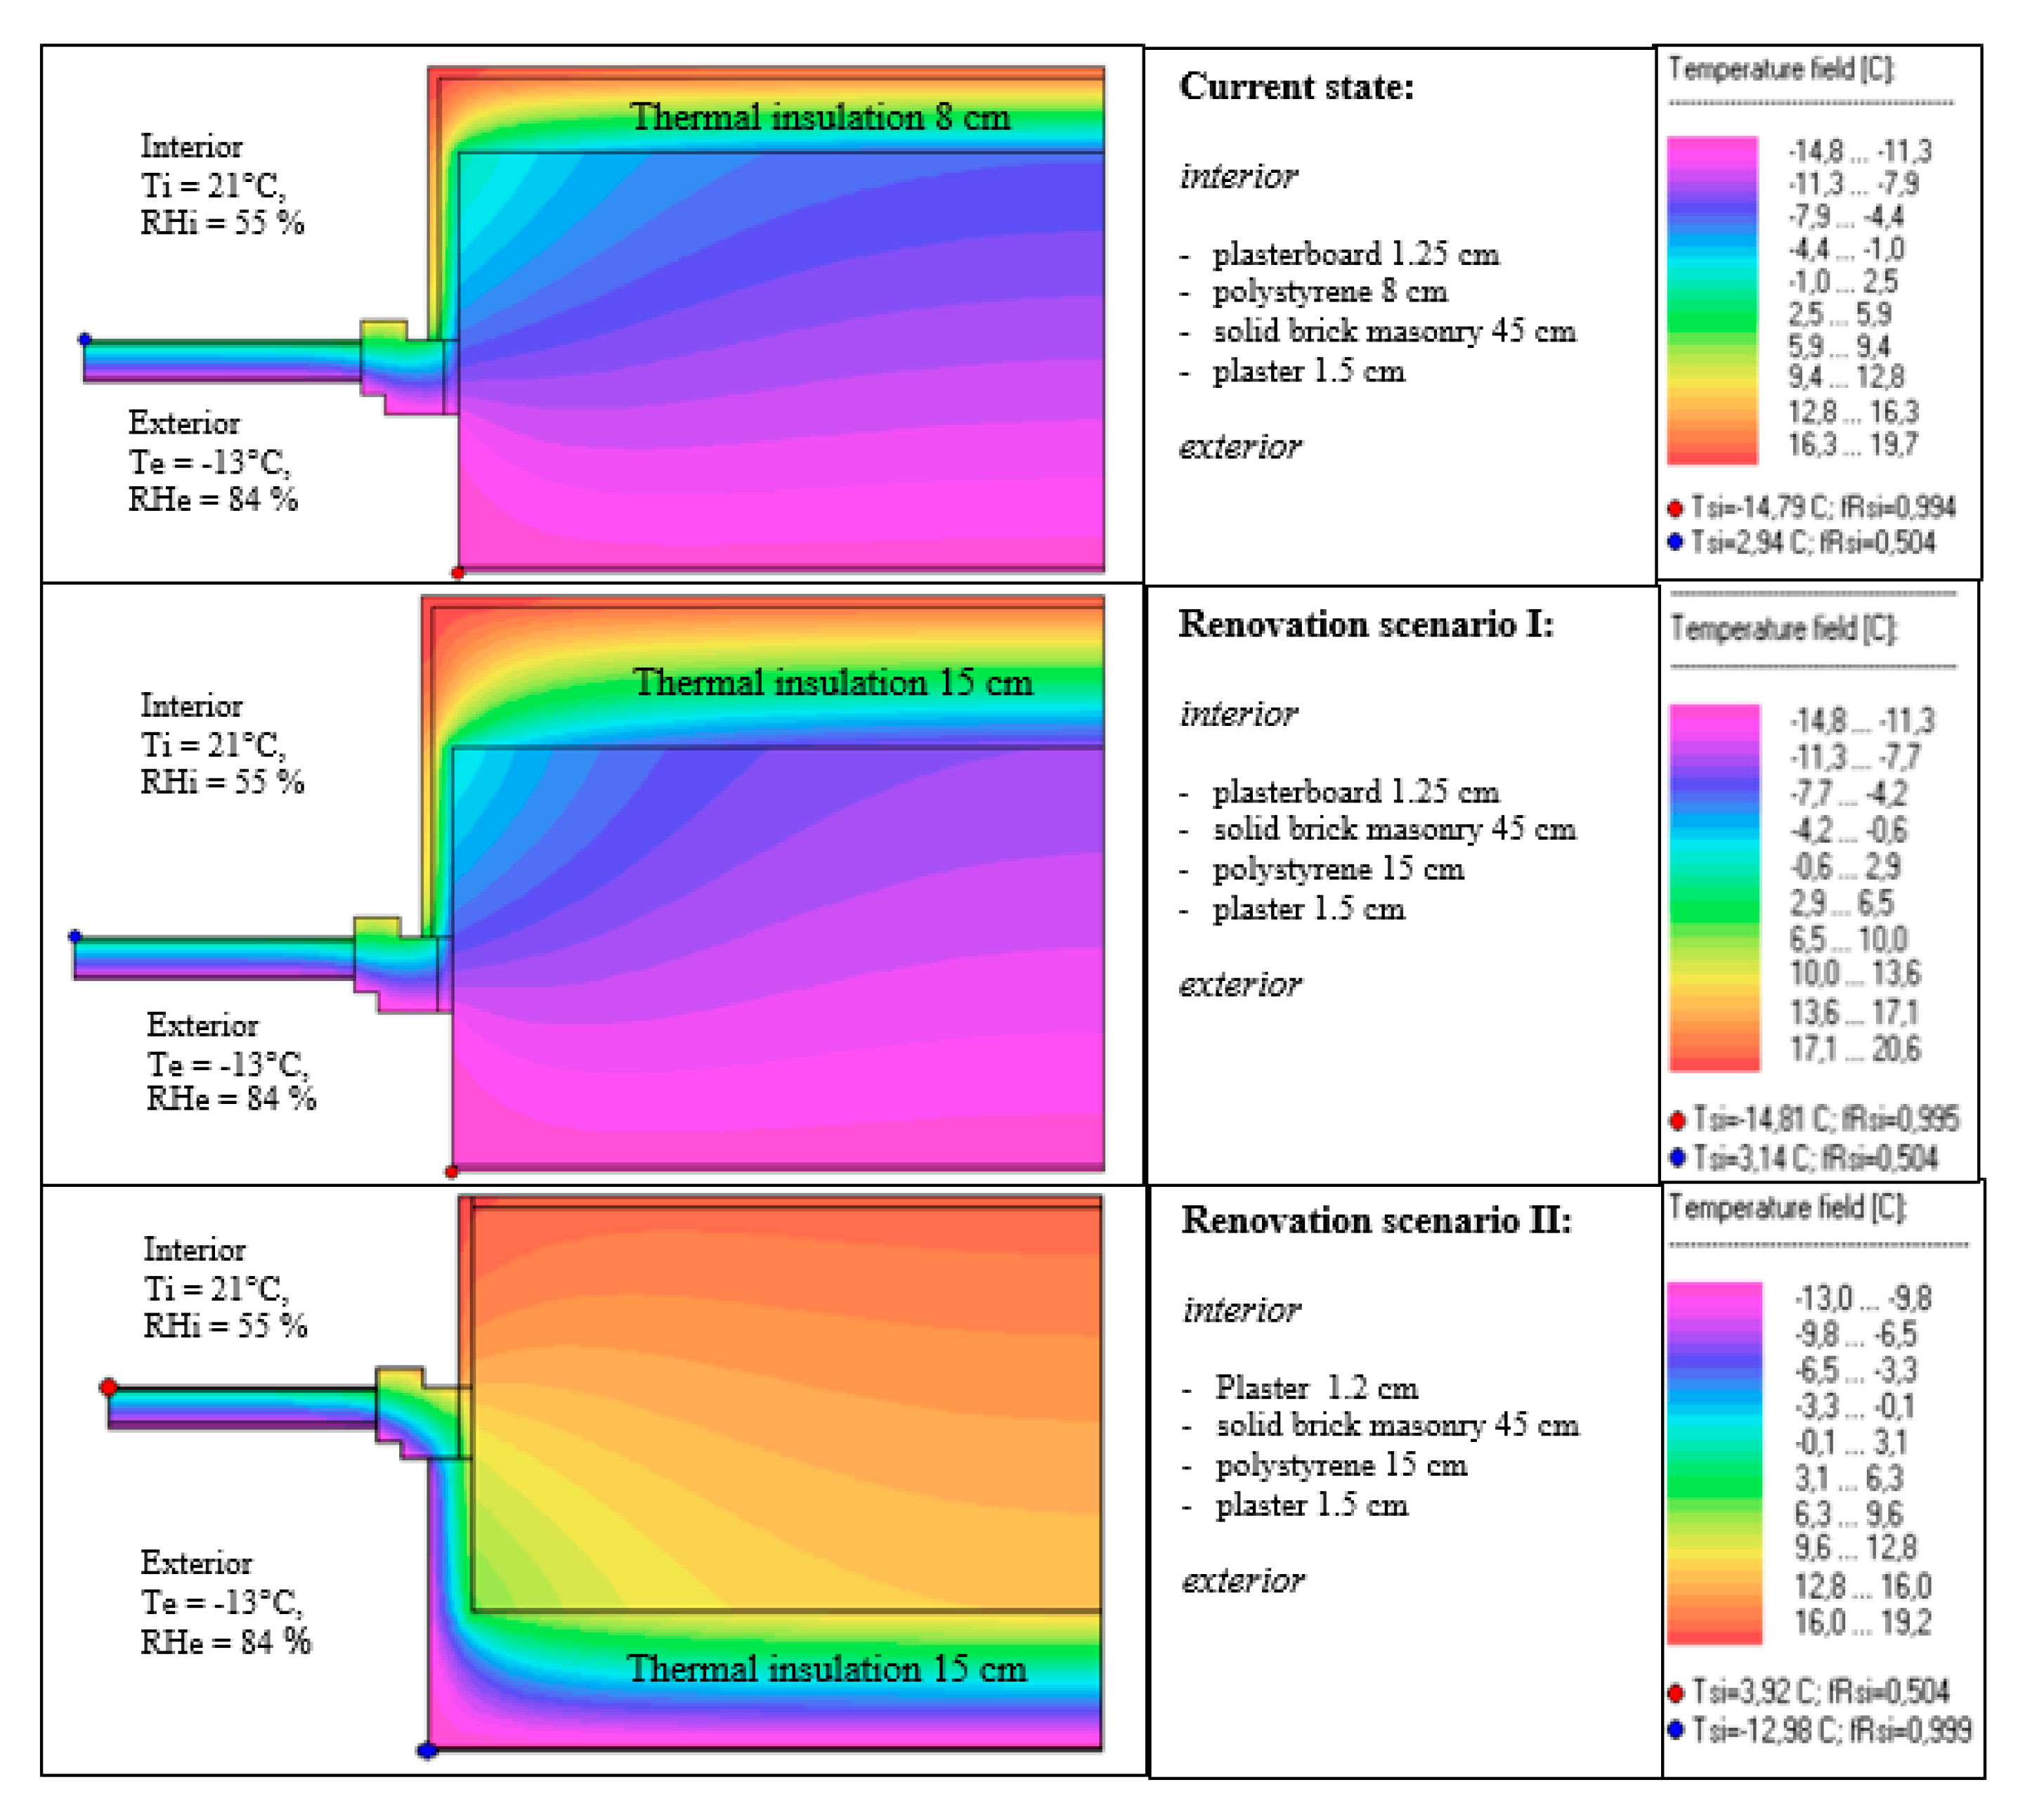
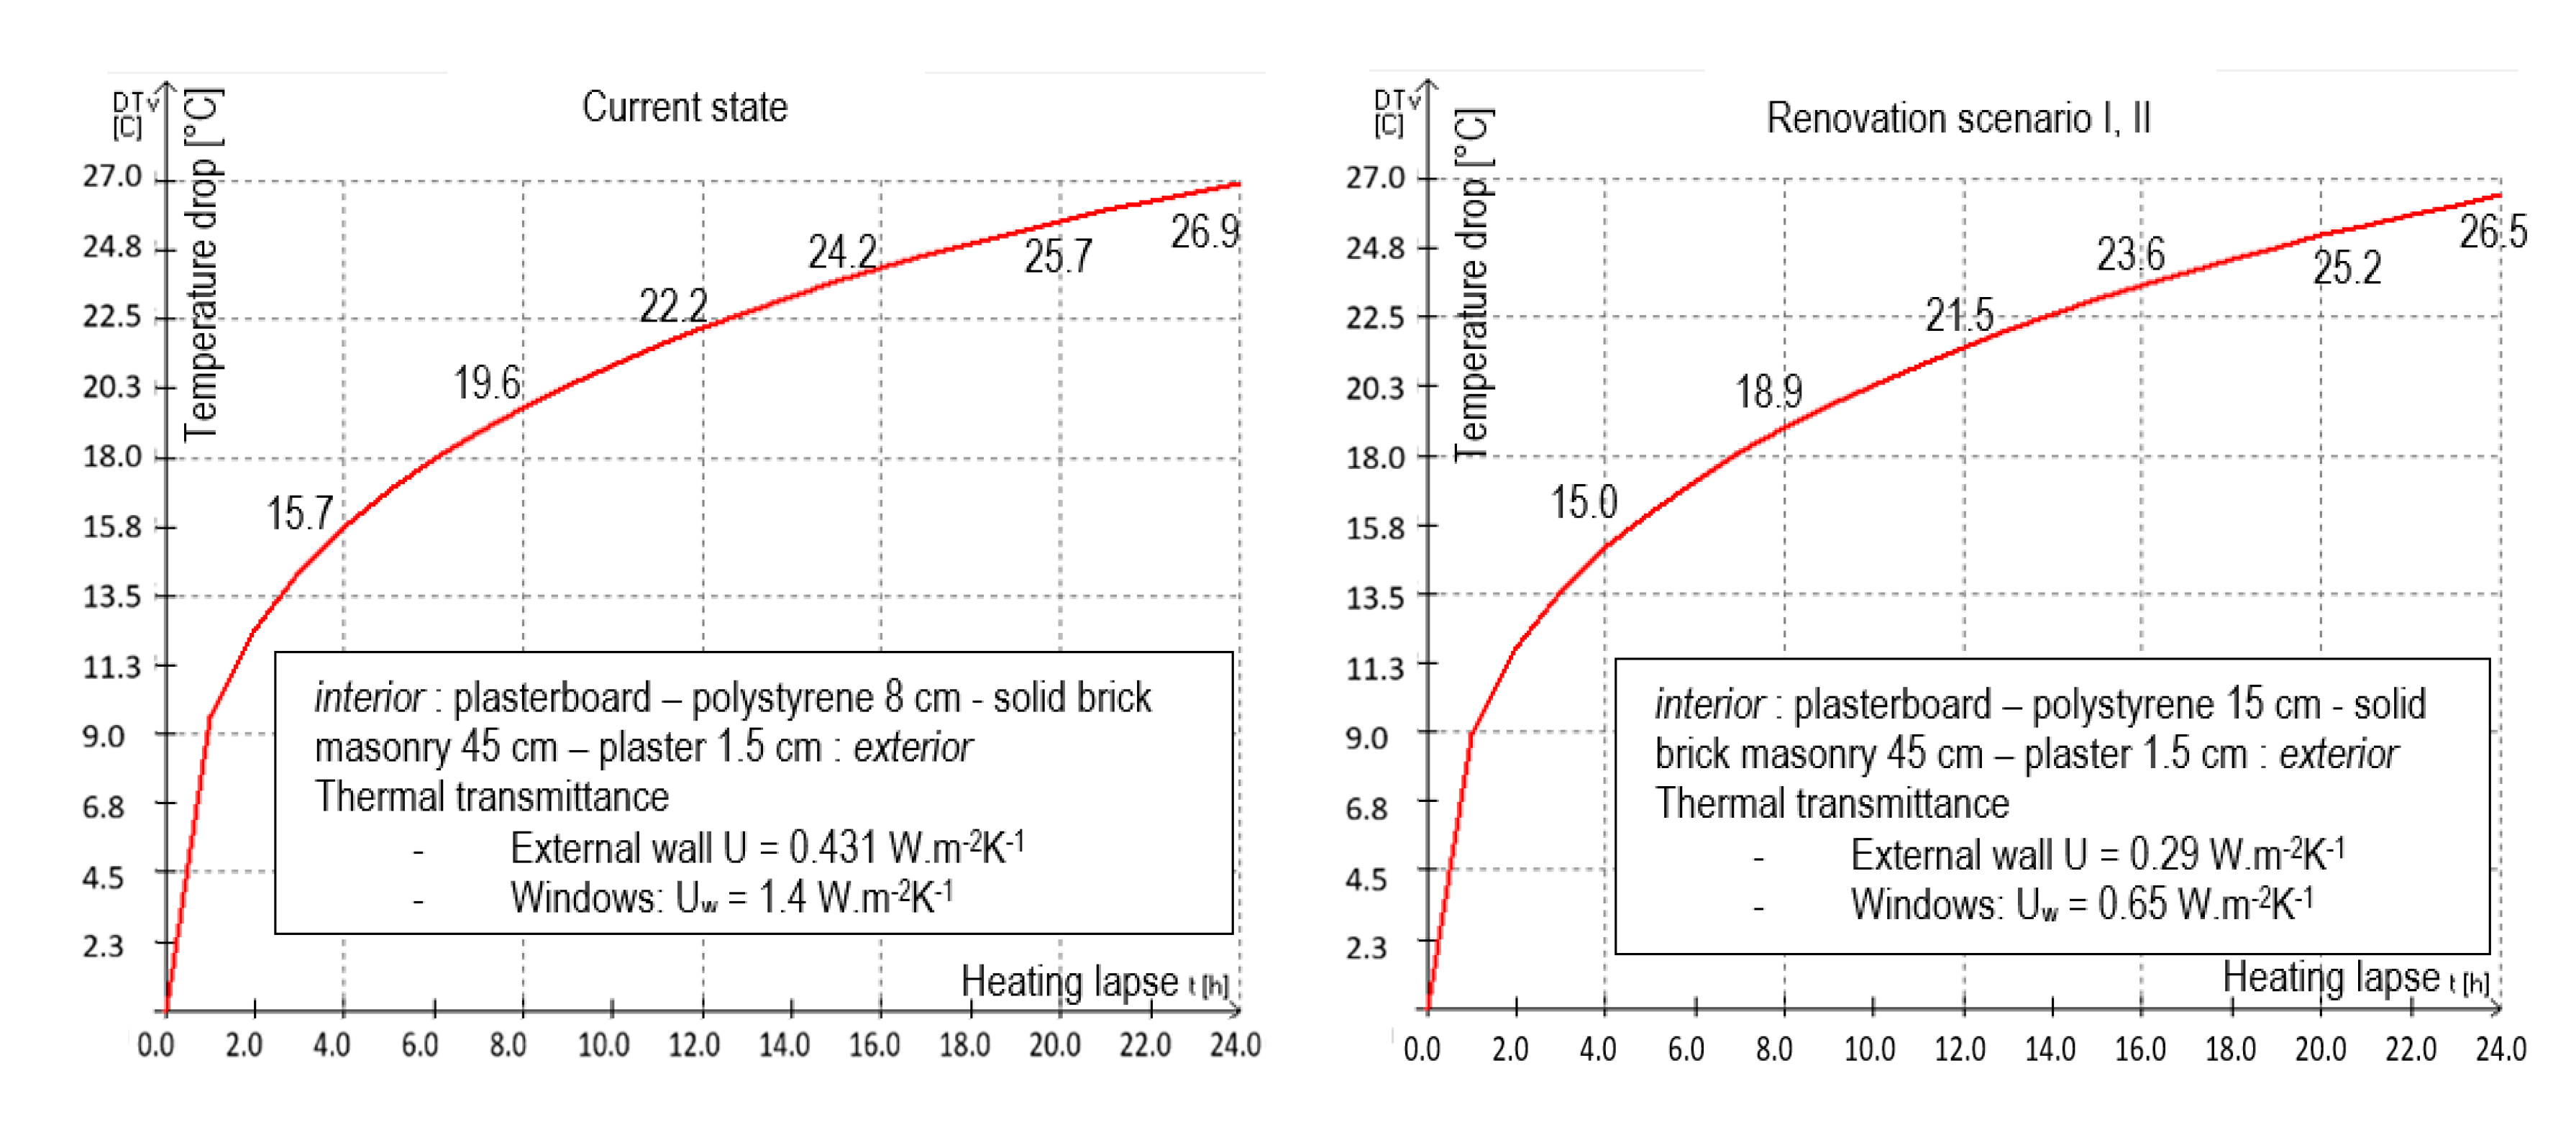
2.2.1. Thermal Evaluation

The thermal study was focused on the building facade and its influence on indoor climate. The external wall thermal transmittance and condensation risks were studied. The evaluation was carried out for three variations:
  • current state: wall with 8 cm of thermal insulation on the interior side;
  • renovation scenario I: wall with 15 cm of thermal insulation on the interior side;
  • renovation scenario II: wall with 15 cm of thermal insulation on the exterior surface.
The software Teplo [38] was used for the evaluation. The software is intended for fundamental analyses of building constructions like thermal resistance R (m2KW−1) and U-value (W m−2 K−1) calculations, temperature profiles, interstitial condensation analysis and specification of annual balance of condensed and evaporated amount within building constructions in accordance with standard methodology of ISO 6946 and ISO 13788 [39,40] and other standard requirements [41].
Boundary conditions for the thermal evaluation according to [41] are following:
  • design outdoor temperature −13.0 °C, locality—GPS: 50.655668 N, 14.724856 E;
  • design indoor air temperature 21.0 °C (classroom);
  • design relative humidity of outdoor air 84.0%;
  • design relative humidity of indoor air 55%.
Two-dimensional temperature distribution of the wall details at window jambs in the current state and design variations with internal and external thermal insulation were simulated using the software Area [38]. The software is dedicated to complex thermal analyses of building construction details for specification of potential thermal bridges in two dimensional stationary heat transfer and water vapour diffusion simulations in accordance with standard methodology of ISO 10211 [42].
A study of the influence of the renovated facade on indoor thermal stability was performed [41,43]. The thermal stability was selected as an indicator of indoor thermal climate. Thermal stability of the classroom was simulated for winter and summer season conditions using the software Stabilita [38]. The internal temperature drop during a heating lapse in winter and summer indoor temperature rise were calculated. The goal of the evaluation is to compare influence of windows on the indoor thermal environment.

2.2.2. Daylight Evaluation

Natural light influences indoor climate and wellbeing. Especially in educational buildings, visual comfort is crucial. Daylight positively affects students’ alertness and health [44]. Reviews of the importance of daylighting in schools [45,46] show relationships between the occupants’ responses and natural lighting. The positive impact of daylight in classrooms was proven [47,48]. Daylighting in educational buildings has been a topical task of professional projects [49,50,51]. Extensive surveys of US schools in different climate conditions were performed [52]. The EU programme [53] promotes daylight integration for high performance indoor environment in schools. These activities are in agreement with the main principles of sustainable development [54,55] and architectural design strategies [56,57,58,59] as well as standard recommendations [60,61,62].

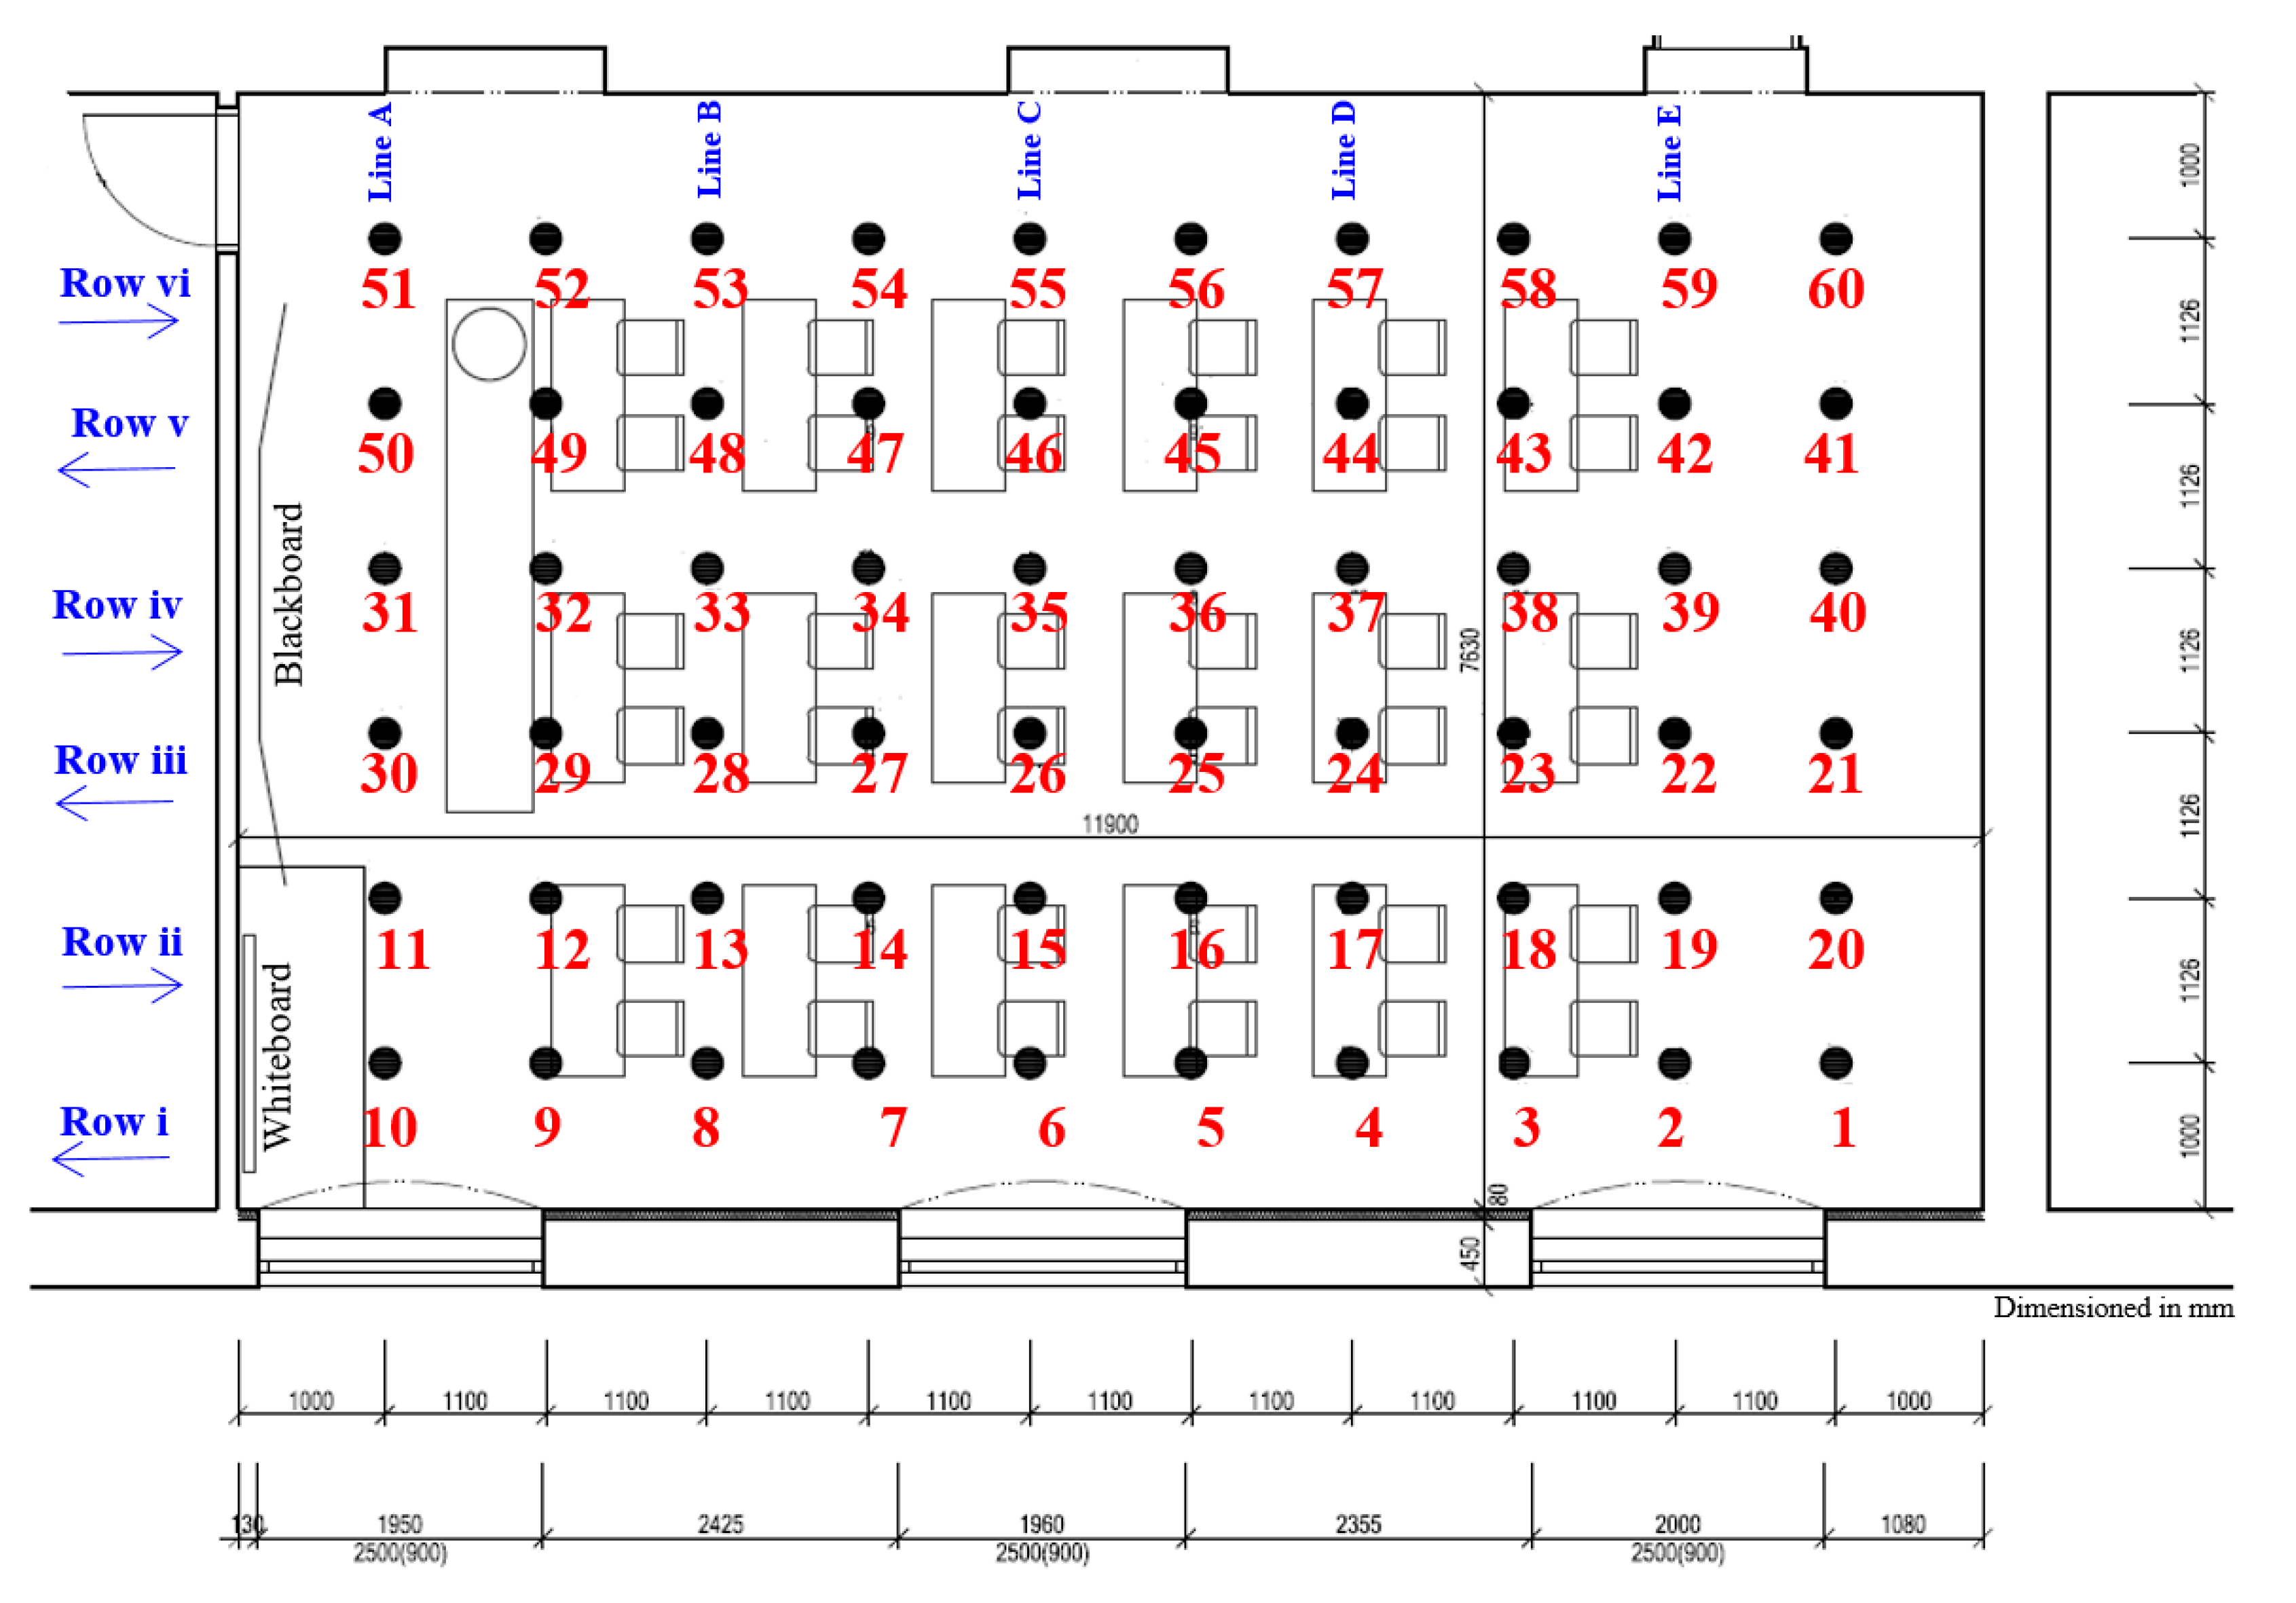
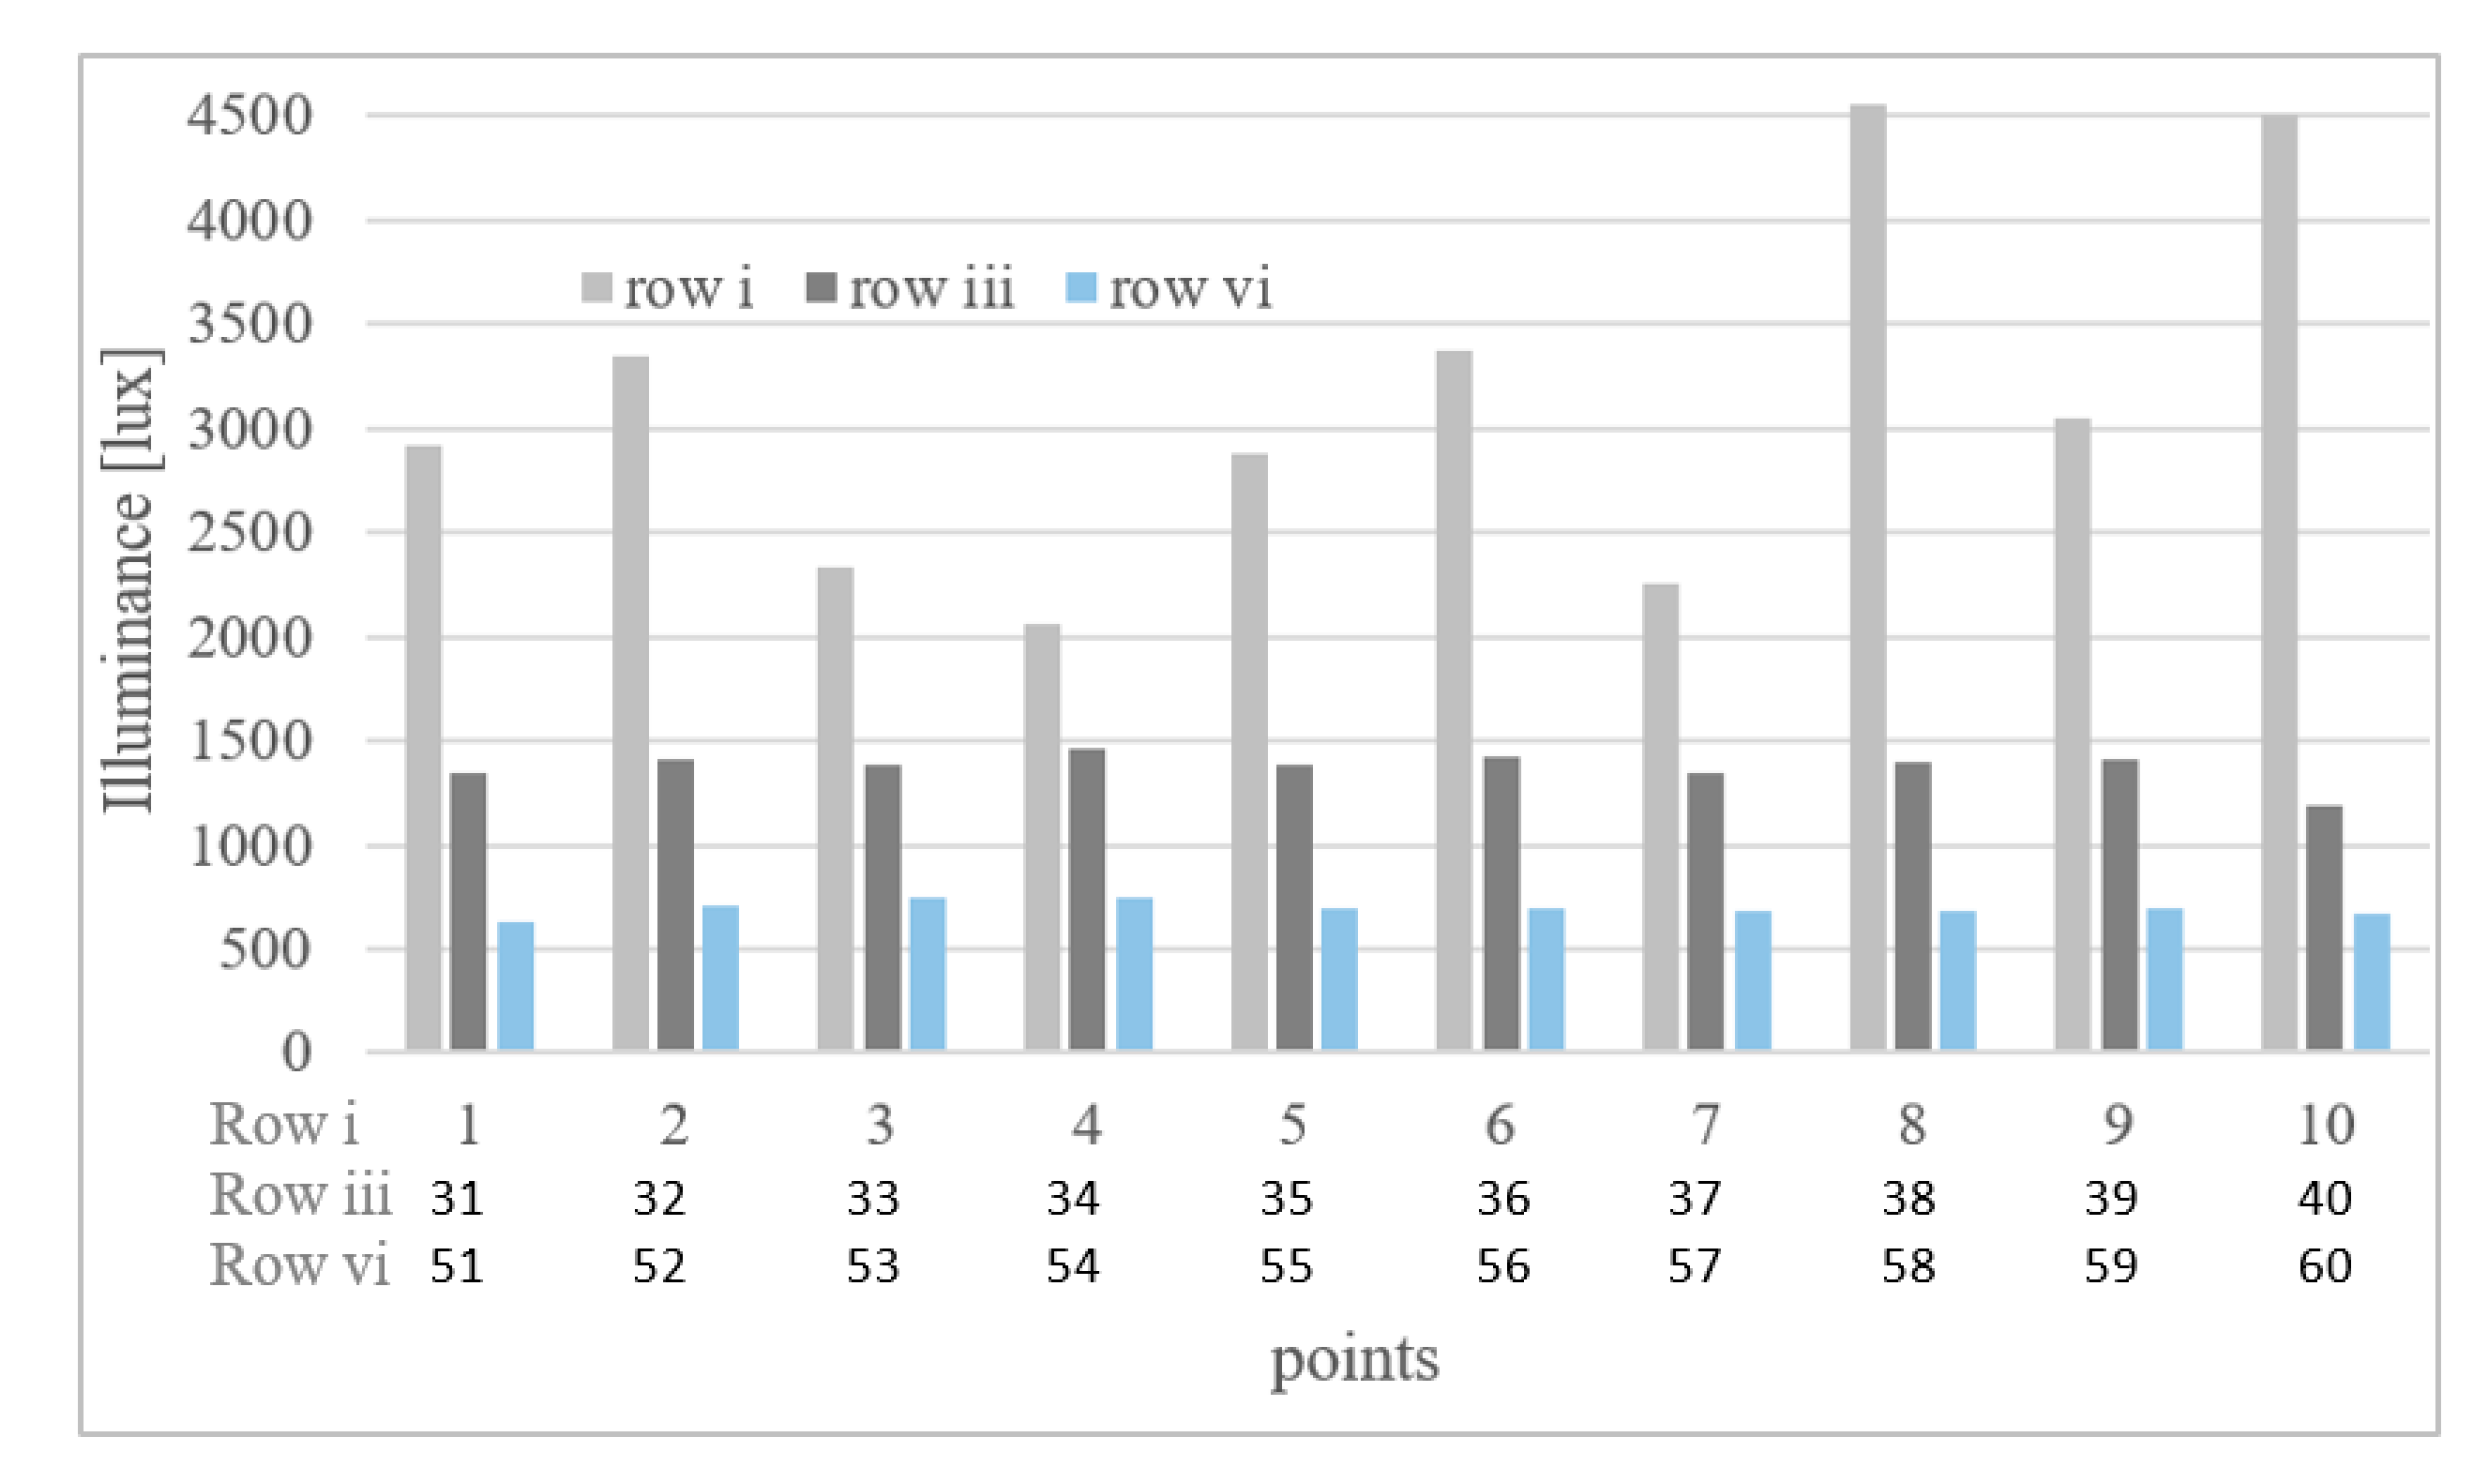
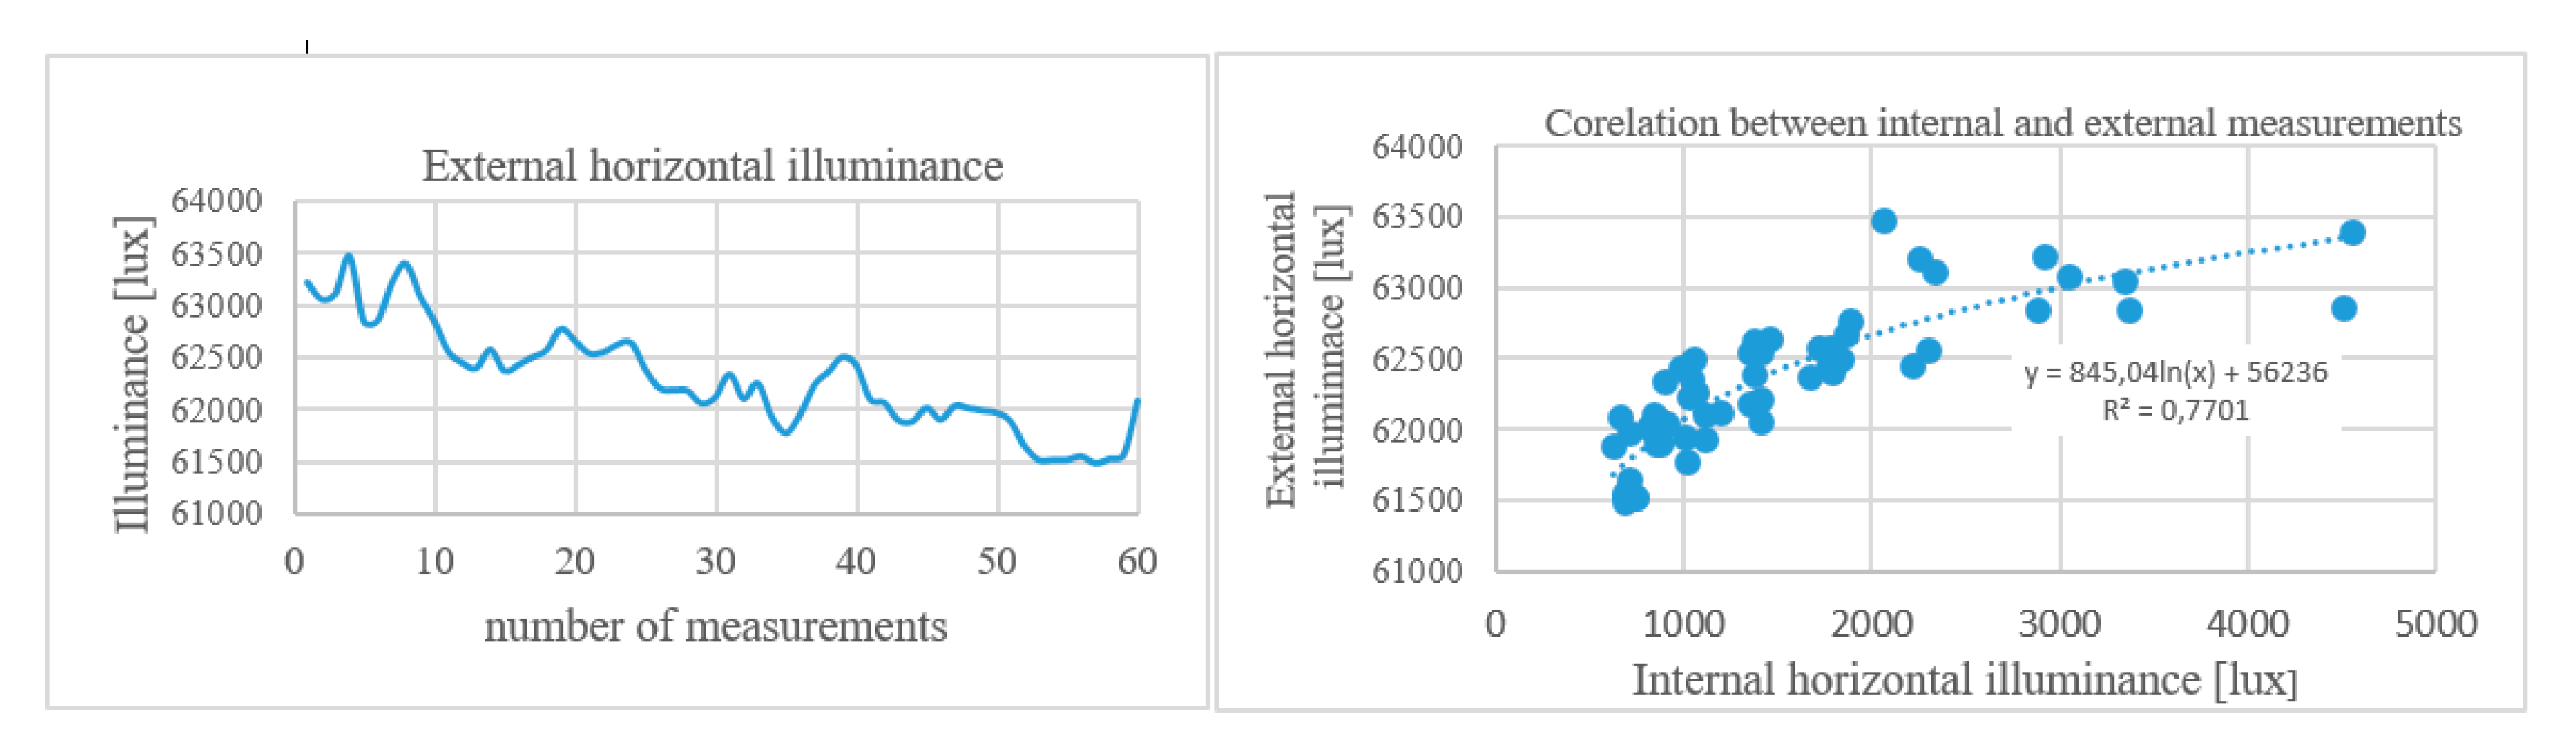
Daylight Measurements

Daylight illuminance was monitored in the classroom. The intention was to study the classroom visual environment under the most characteristic daylight conditions throughout the year. The measurement time was limited due to the accessibility schedule into the classroom. Measurements were performed without pupils’ occupancy over weekends in March 2017.
The classroom is a spacious place of floor area 11.9 × 7.63 m and clearance height 4 m. It has three big windows, of width about 2 m and height 2.5 m (Figure 3 and Figure 4). The daylight measurements were taken for a set of sixty points on a working plane. The plane is located 0.85 m over the classroom floor level (Figure 4). The set of points is positioned in distance of 1 m around the room perimeter. Spacing of the points is 1.10 m by 1.126 m. Simultaneously with the interior measurements, the external illuminance was monitored on unshaded horizontal plane outdoors. Sky luminance was also studied.
The daylight illuminance was measured using two calibrated illuminance meters Testo 545 (calibration 2017). One illuminance meter was taken for interior measurements and the second device measured external horizontal illuminance. Laser rangefinder Bosch GLM 50 C Professional was used to set points on the working plane. Tripods were also used to stabilize the illuminance meter at the required height. The external illuminance sensor was positioned on the roof. The measuring instruments were synchronized. Outdoor and indoor illuminance values were measured at the same time. The illuminance data processing was carried out in MS Excel and Statistica software [63].
Furthermore, monitoring of the surface luminance was taken in the classroom visual field. Luminance Meter LS-100 Konica Minolta is used for measurements.

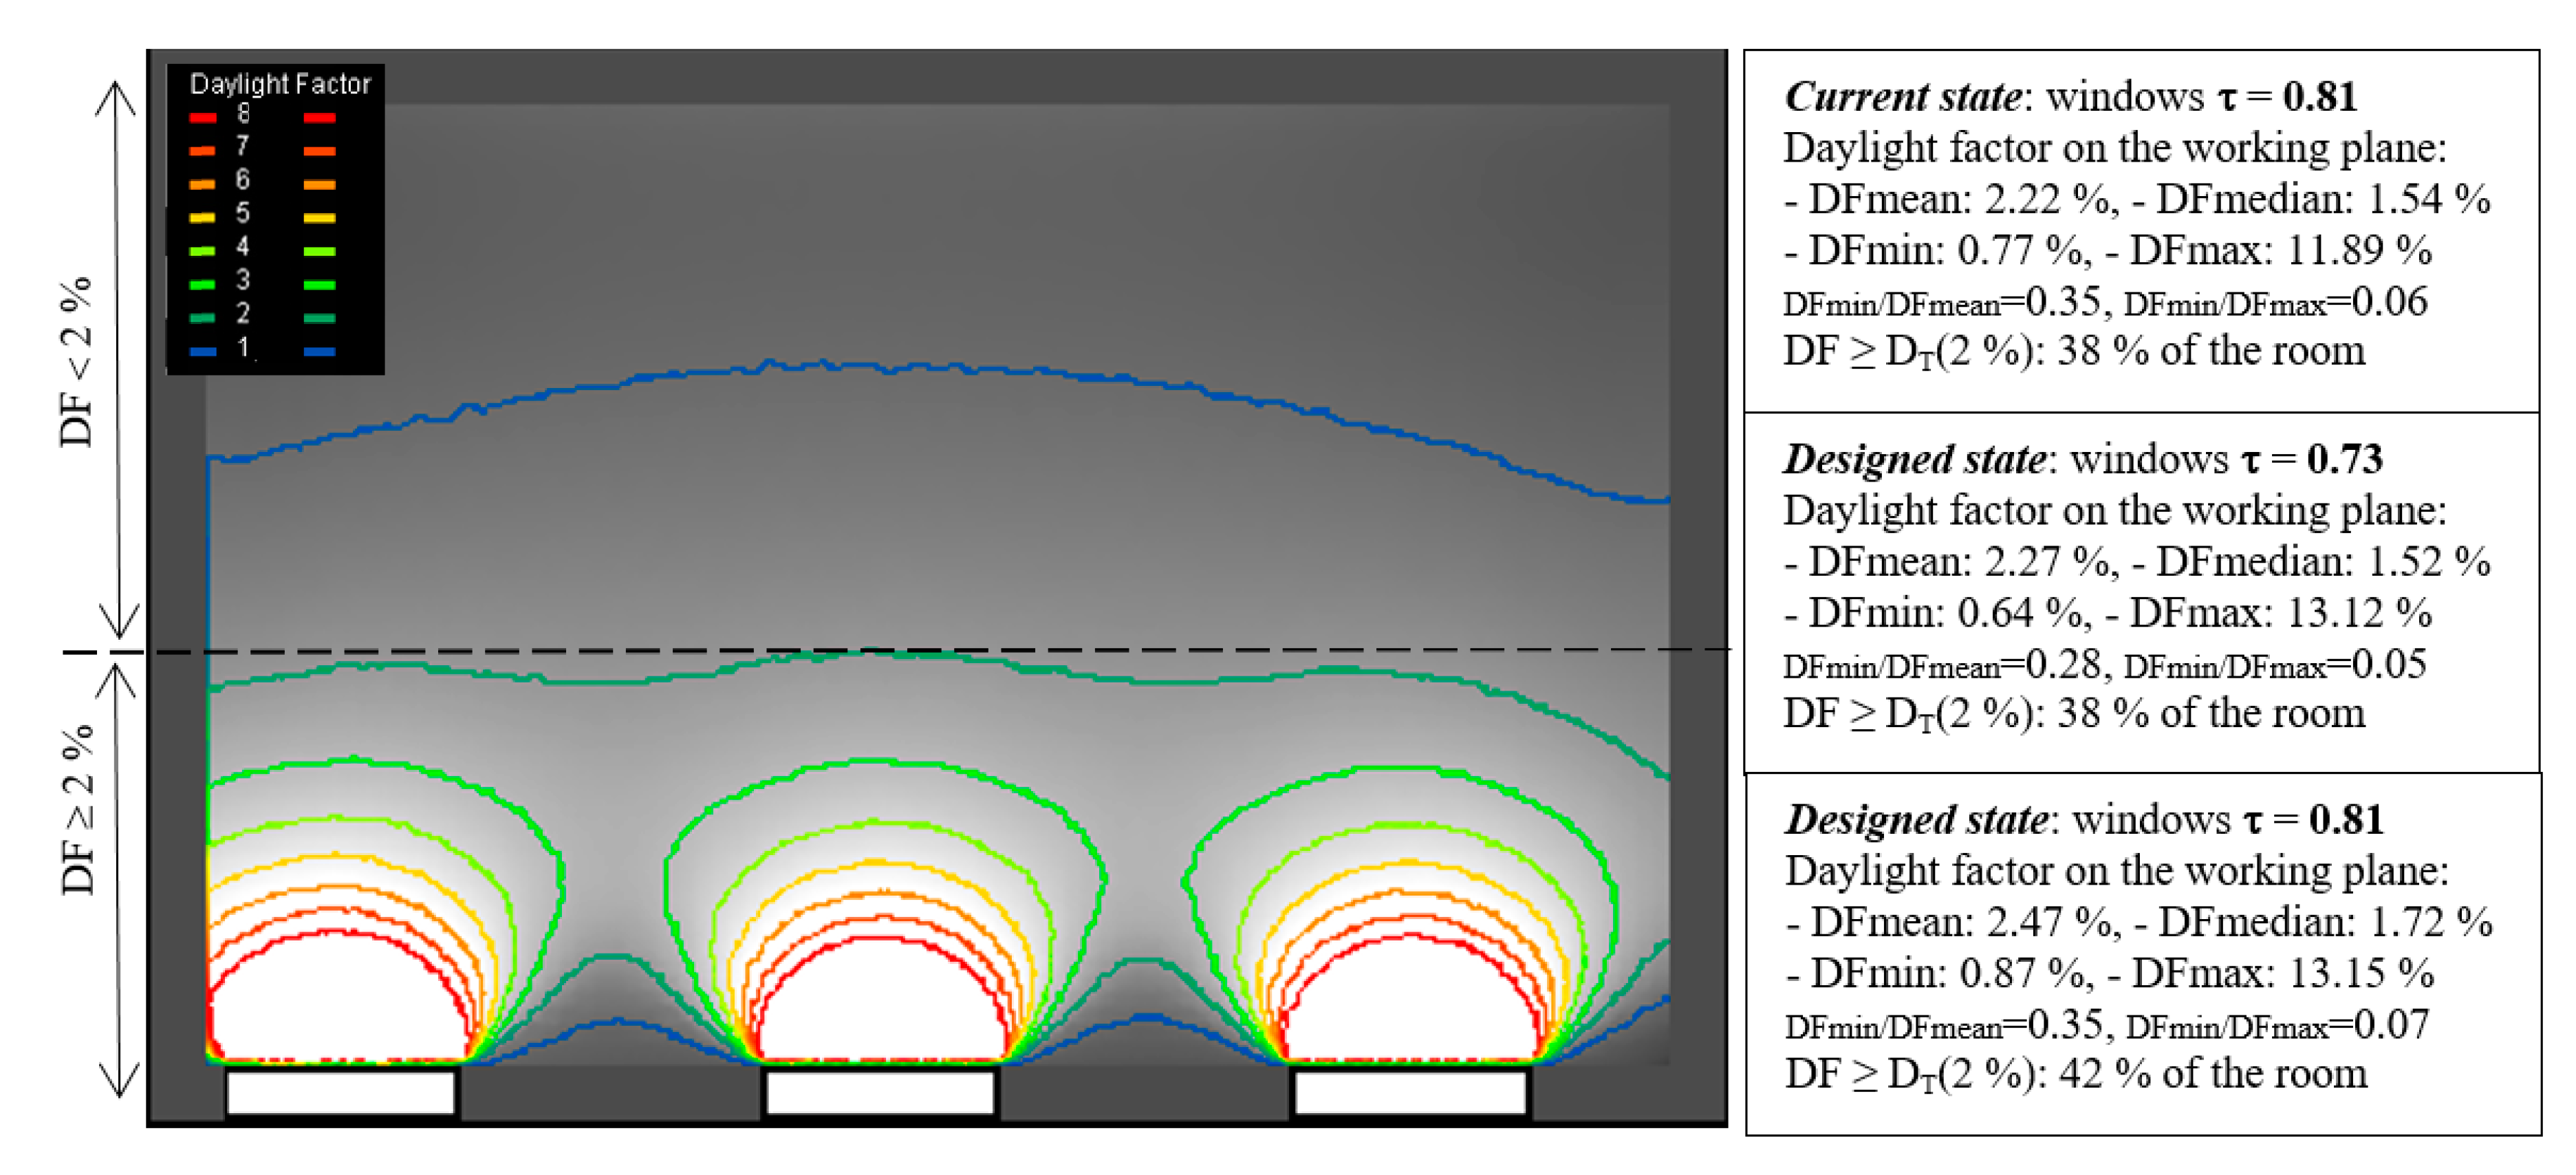
Daylight Simulations

The classroom visual environment was also studied on the basis of daylight simulations. The current state daylighting is compared with designed variations. The design state is represented by renovation scenario II with two variations of window glazing (double or triple glass units). Daylight simulations were run in software Daylight Visualizer [64] for the following parameters:
  • light reflectance ρ [-] of the classroom surfaces in current state (resp. designed state): floor finishing 0.35 (resp. 0.5), wall surfaces 0.7 (resp. 0.9), ceiling 0.84 (resp. 0.9).
  • window glass light transmittance τ [-]: double glazed units 0.81, triple glazed units 0.73.
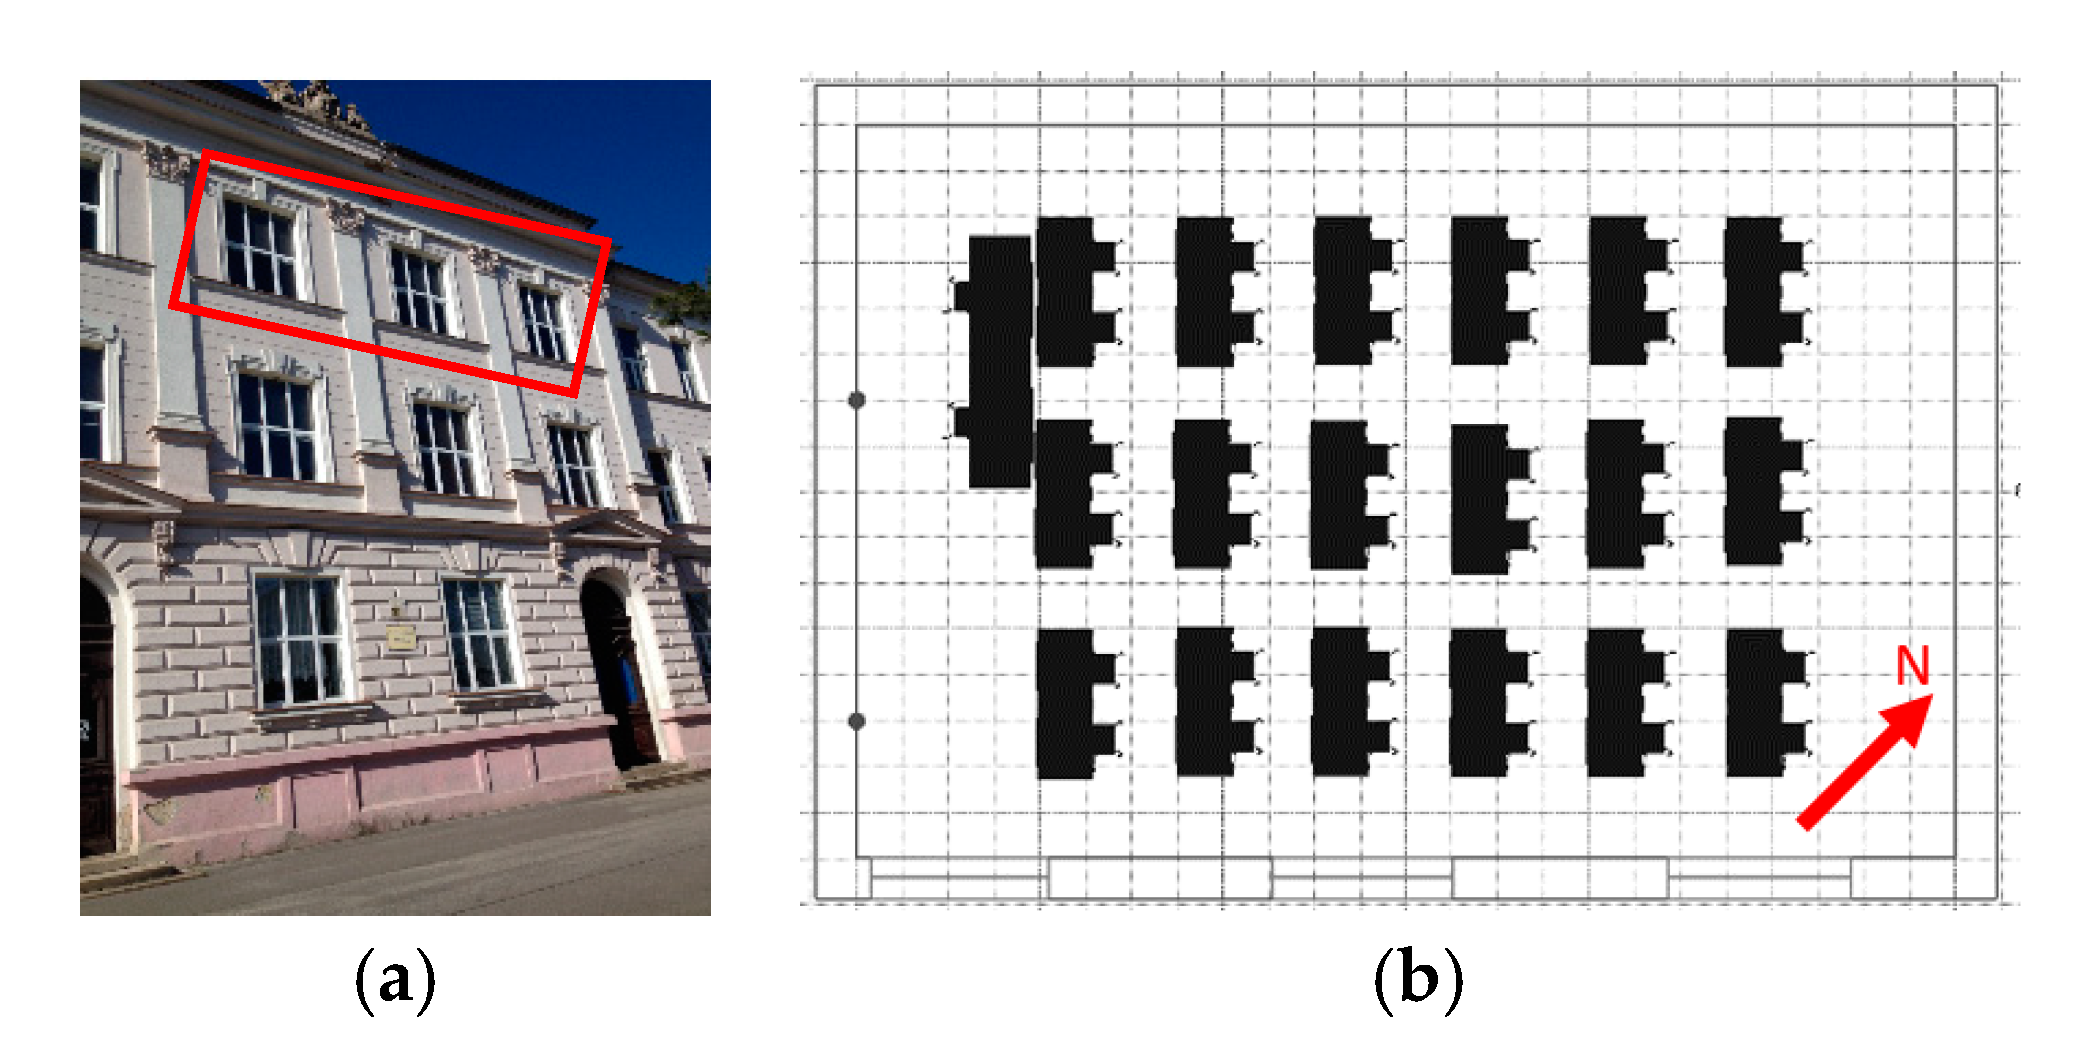
  • the south-east orientation of the classroom windows (Figure 5).
Daylight simulations were run for an annual balance of internal horizontal illuminance under two sky models [65]:
  • CIE clear sky model to simulate sunlight conditions.
  • CIE overcast sky model for consideration of the most unfavourable daylight situation.
The balance was simulated for the 21st day of every month and daytime 12:00.
Finally, the classroom daylighting was also simulated for designed variations and compared with standard requirements according to EN 17037 [61] as follows:
  • Daylight illuminance simulated for the clear sky model on 21st June, at 12:00 was compared with target illuminance 300 lux.
  • Daylight factor simulation for the overcast sky model was compared with target daylight factor DT = 2%.

3. Results

The above mentioned energy auditing evaluation achieved notable results for the analysis of the school buildings efficiency. Outputs of indoor thermal and daylight evaluations in the selected representative of school classrooms show potential problems in the current state and give an overview about some renovation scenarios.

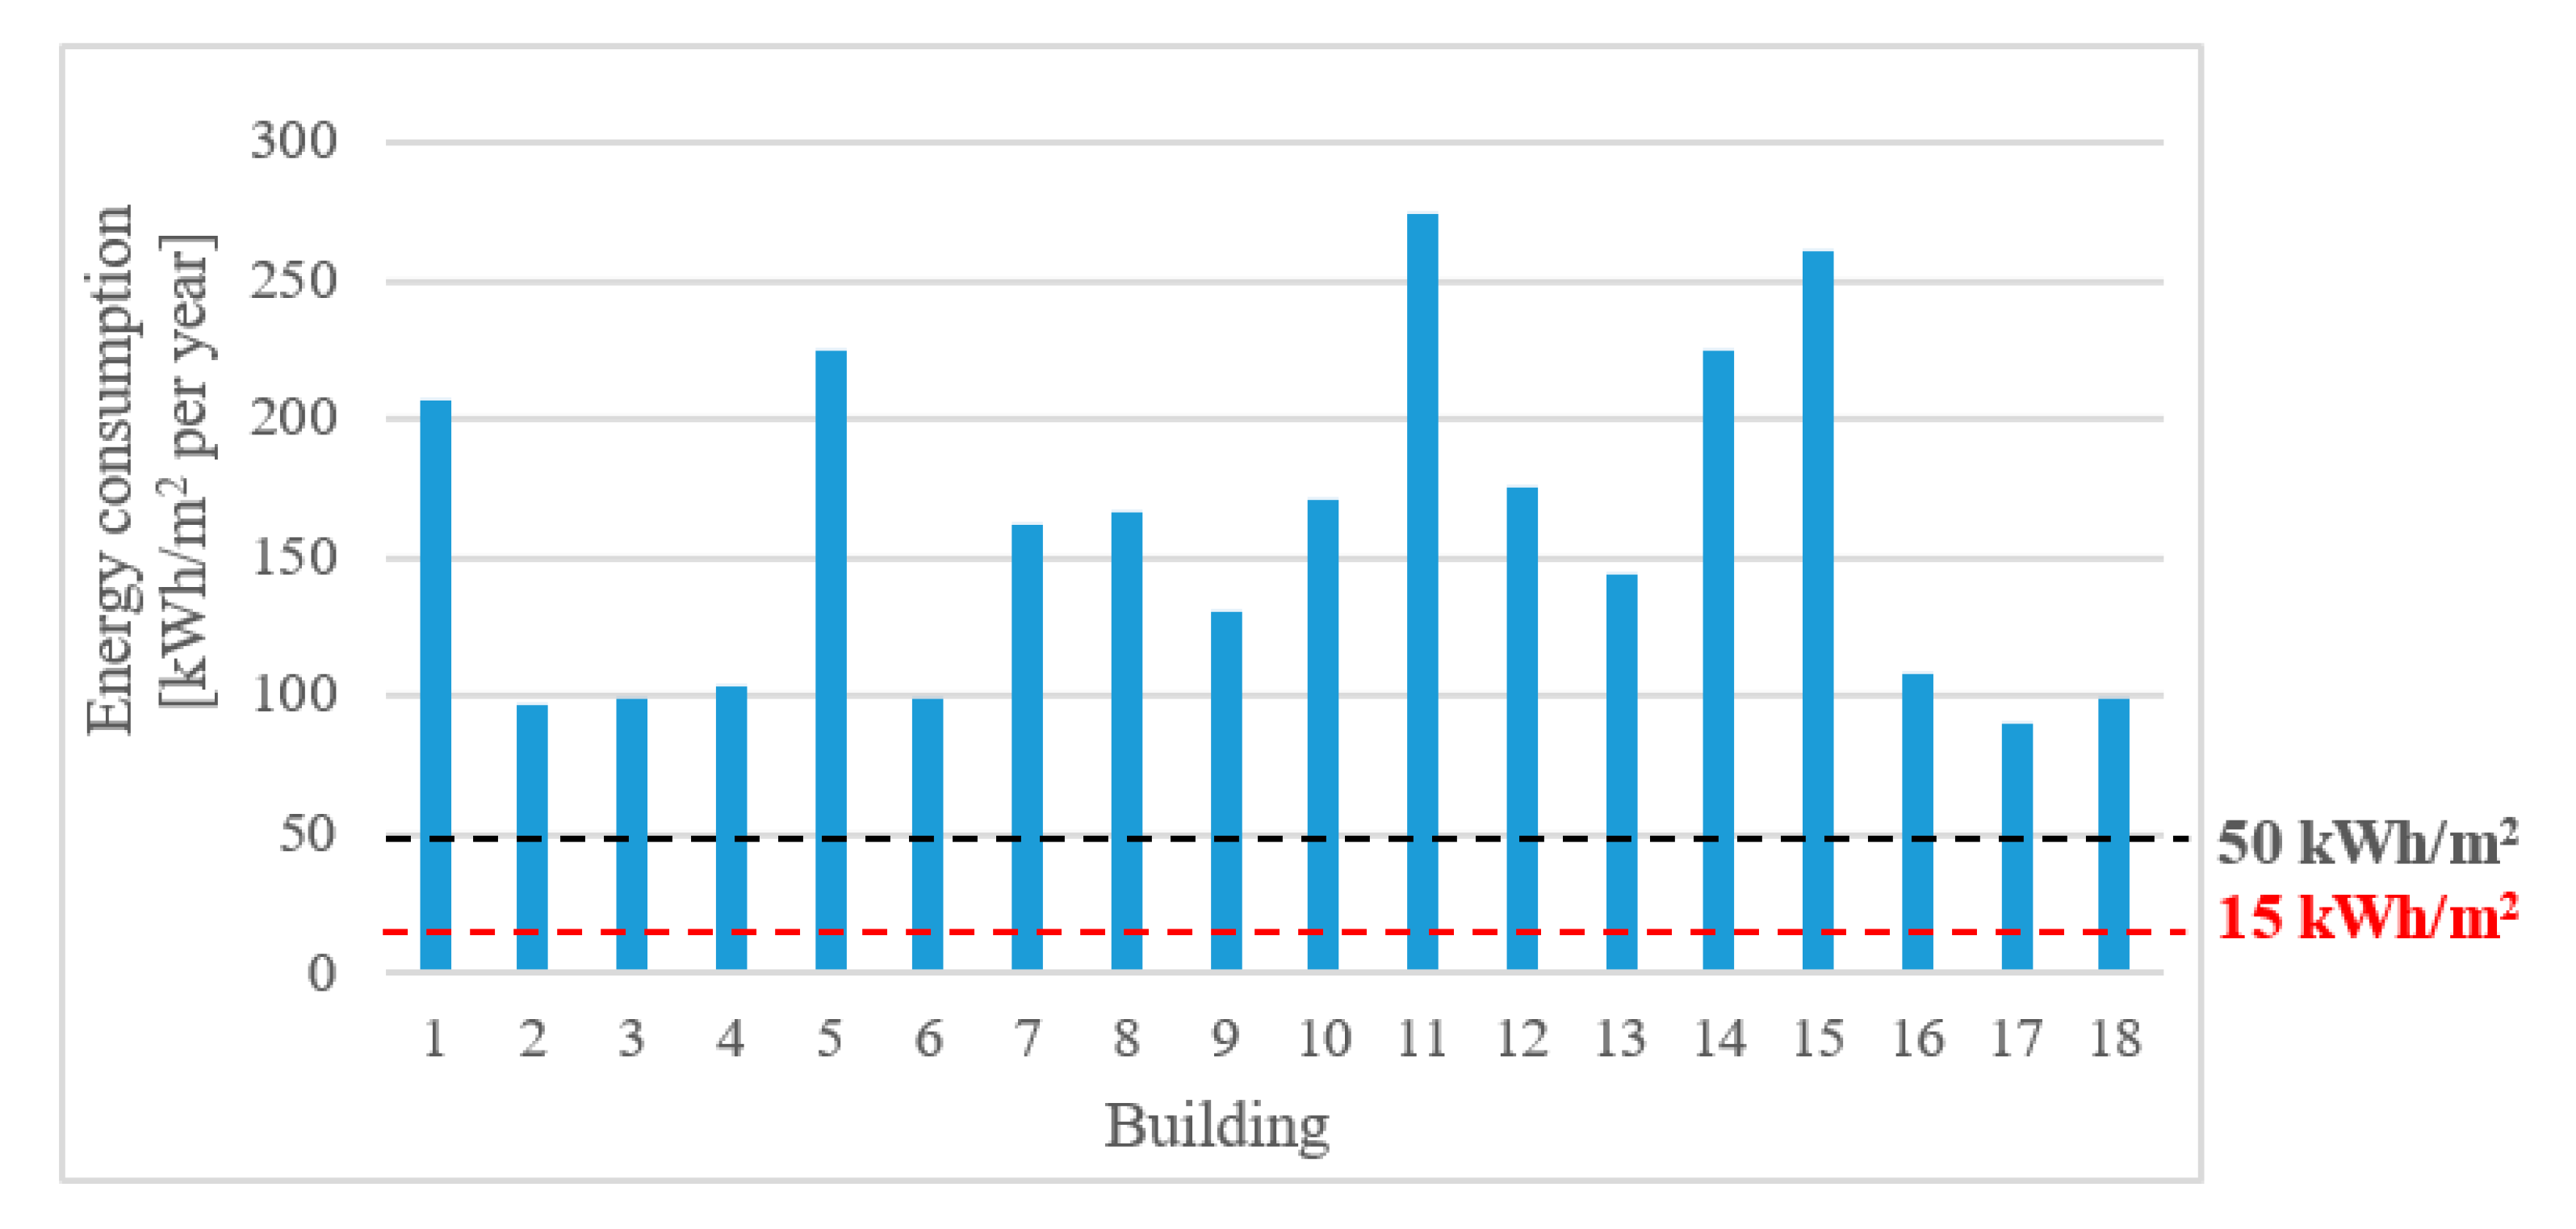
3.1. Results of the Energy Audits Analysis

The analysis of selected school buildings energy audits gives an overview about their envelopes and their influence on heat losses. Total heat transmission and ventilation losses of buildings vary from 61.1 kW to 424.5 kW. Total annual energy consumption in the schools is between 265 and 3305 GJ per year. Percentage of heat transmission losses of their building envelopes are following:
  • 23.6% to 57.0% of external walls (U = 0.57 to 1.83 W m−2 K−1).
  • 18.3% to 36.0% of roofs (U = 0.36 to 1.50 W m−2 K−1).
  • 17.4% to 55.3% of windows (U = 2.30 to 3.50 W m−2 K−1), external doors (U = 3.50 to 6.50 W m−2 K−1).
The annual consumption of energy in dependence of the building volume is between 23.7 and 64.7 kWh.m−3 per year and consumption of energy for heating and domestic hot water vary from 19.8 to 61.7 kWh.m−3 per year. The heating energy consumption is quite high in the school buildings compared to demands for low energy buildings (less than 50 kWh/m2 per year) and passive houses (less than 15 kWh/m2 per year) [5] (Figure 6).

3.2. Results of the Thermal Evaluation

Results of the external wall hygro-thermal evaluation are presented in Figure 7. The current wall (U = 0.43 W m−2 K−1) and renovation scenarios (U = 0.29 W m−2 K−1) with internal and external thermal insulation were studied. The figure shows schemes of vapour pressure distribution within the wall and specification of potential condensation regions. An annual balance of condensed/evaporated amount inside of the wall is summarized in graphs. It is clear that the interstitial condensation is fully eliminated in the wall with external thermal insulation (renovation scenario II).
Simulation outputs of two-dimensional temperature distribution of the window jamb details in the current state and in the two renovation scenarios are shown in Figure 8. It is obvious that the variation of the wall with external thermal insulation represents better temperature distribution and more convenient design solution.
Thermal stability of the classroom was evaluated for winter and summer season conditions. The indoor temperature drop during a 24 h heating lapse in winter does not vary significantly when comparing the existing state and two renovation scenarios (Figure 9). It is because of the relatively small facade area compared to the big volume of the classroom. Three large windows of southeast orientation represent massive solar gains and indoor temperature rise in summer seasons (Table 2). It could bring about overheating problems during intensive solar shining periods. Solar gains can affect indoor visual discomfort. For this reason, daylighting in the classroom was also evaluated for clear sky conditions.

3.3. Daylight Study Resultss

The classroom daylighting was analysed for illuminance and luminance measured data and daylight simulation outputs.

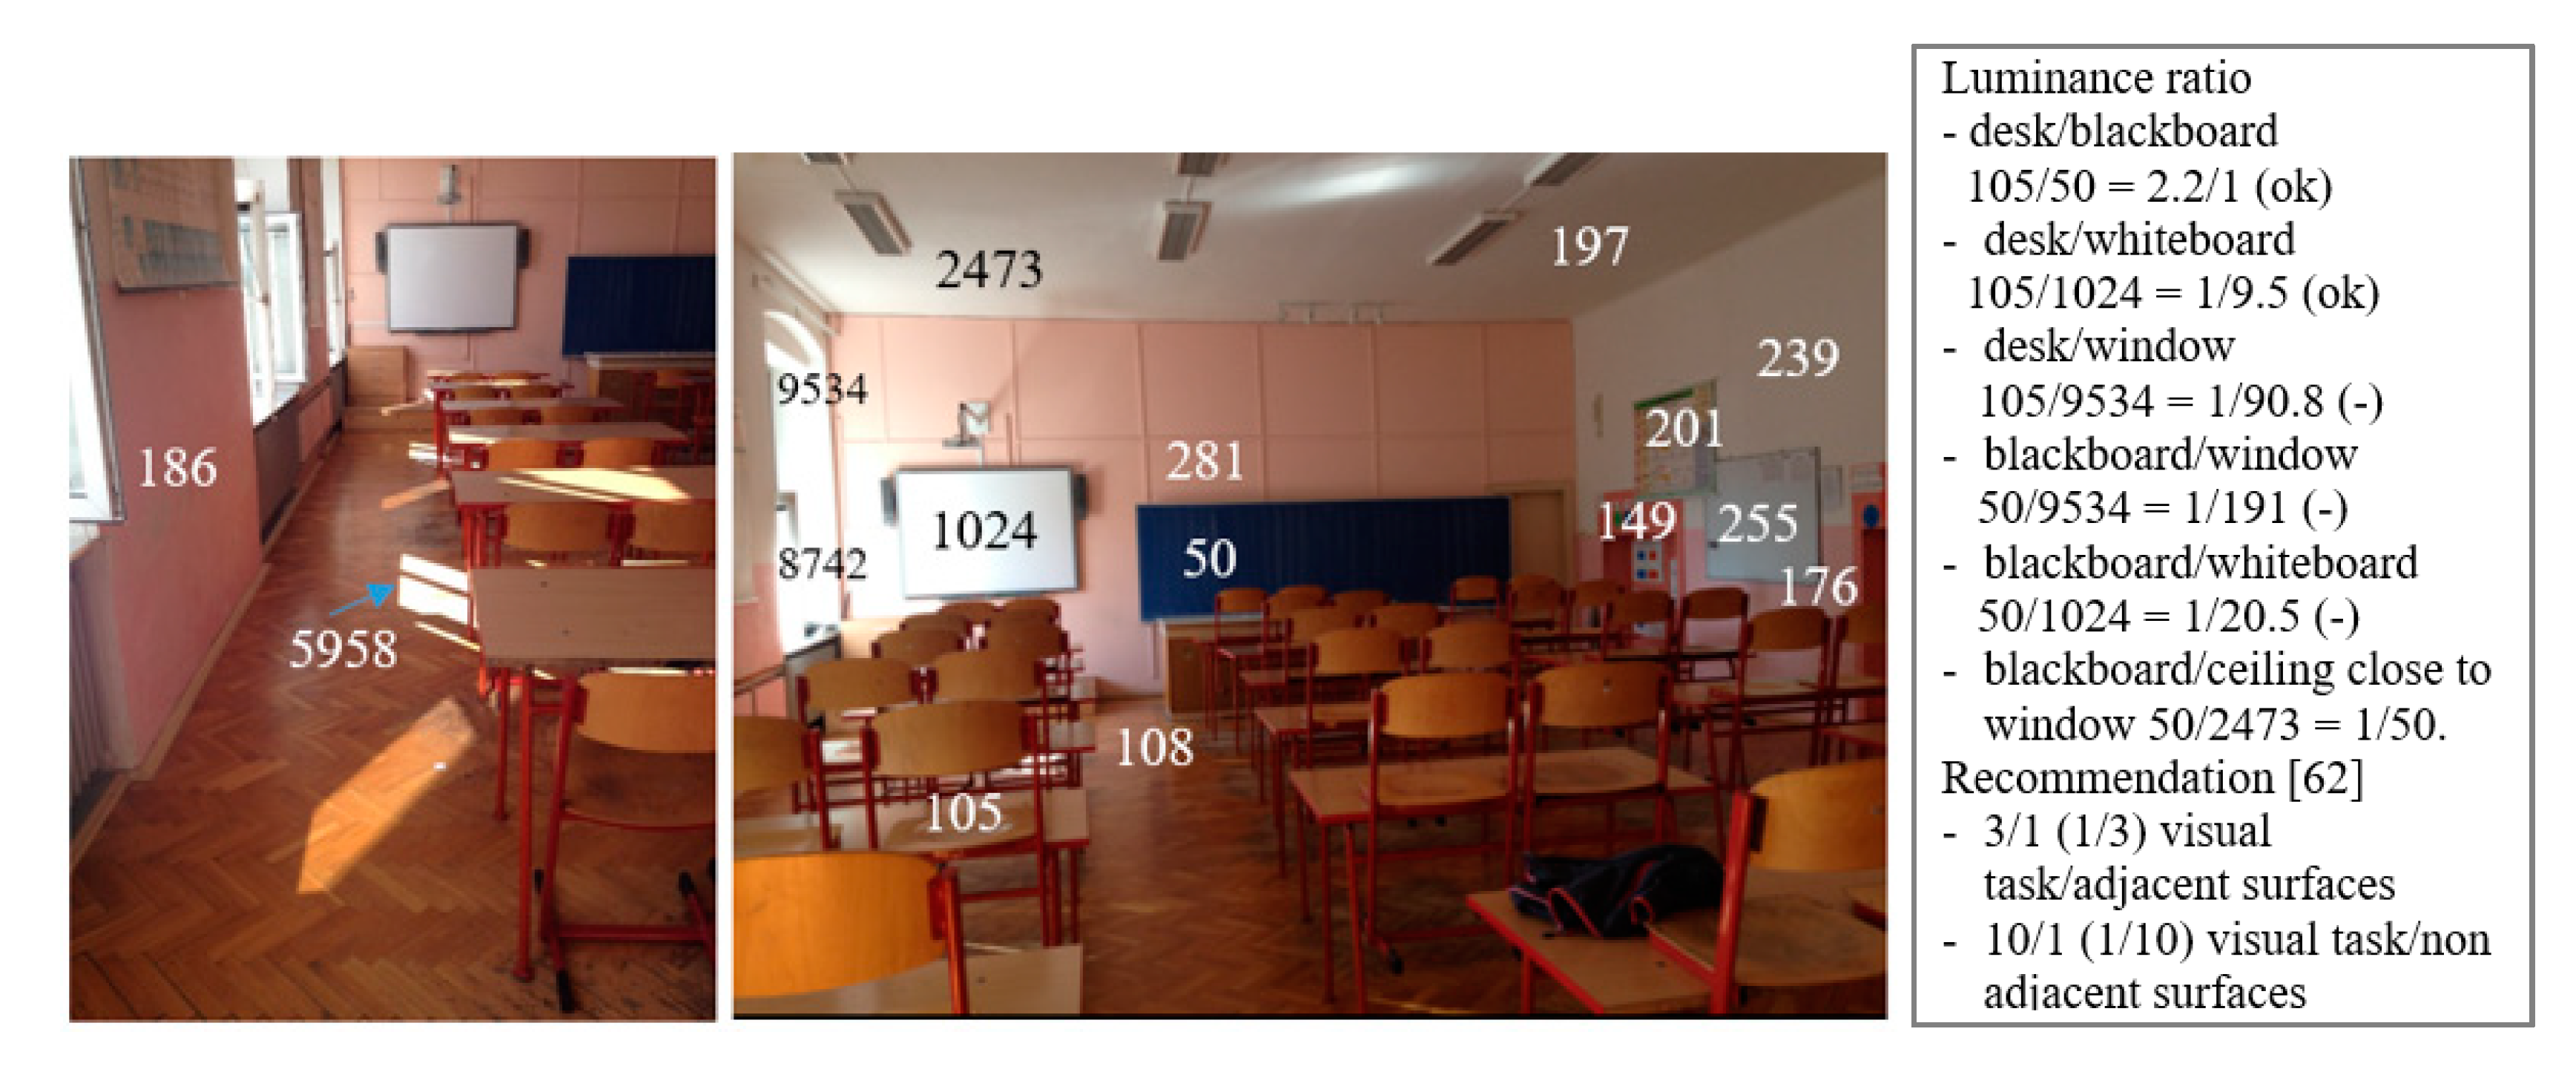
3.3.1. Measured Data Analysis

Data from illuminance measurements on the horizontal working plane in the classroom (from Figure 4) are summarized in Figure 10 and Figure 11. The daylight level is reduced with the distance from windows. It is obvious that big differences in illuminance are in Row i close to the window line. The illuminance differences are minimized in the room depth. Higher illuminance values in positions of Line A and B at Row i are influenced due to the glossy whiteboard surface located near the big window (Figure 3). It is also obvious from Figure 11, where illuminance is intensified at points 8, 9 and 10 of Row i. Illuminance at points 2, 6 and 10 is increased because of windows positions. Illuminance difference between window/wall positions is reduced in the room depth—Rows iii to vi.
The internal daylight illuminance measurement was carried out for simultaneous external horizontal illuminance monitoring (Figure 12). Sky luminance was also controlled during the illuminance measurement time. The luminance data recorded for four different directions (1 to 4) and elevation angles 0°, 15°, 45° and 90° are summarized in Table 3.
Results of the luminance distribution monitored in the classroom are shown in Figure 13. Sunny sky conditions were selected for the monitoring. The classroom windows are often affected by intensive solar radiation. It is clear that surfaces with significantly different luminance in the visual field of the classroom desks cause visual discomfort. Luminance distribution varies from 50 cd/m2 of the blackboard to window glass luminance 9534 cd/m2. The ratio of minimal/maximal luminance values is then 1:191, which is not in agreement with visual comfort recommendation for max 1:10 ratio [62]. Extremely high luminance ratio results in glare problems. Shading blinds must be activated on the classroom windows (Figure 3). However full shading activation could minimise indoor daylighting. An installation of efficient shading systems is recommended for dynamic reduction in solar transmittance during intensive solar shining periods.

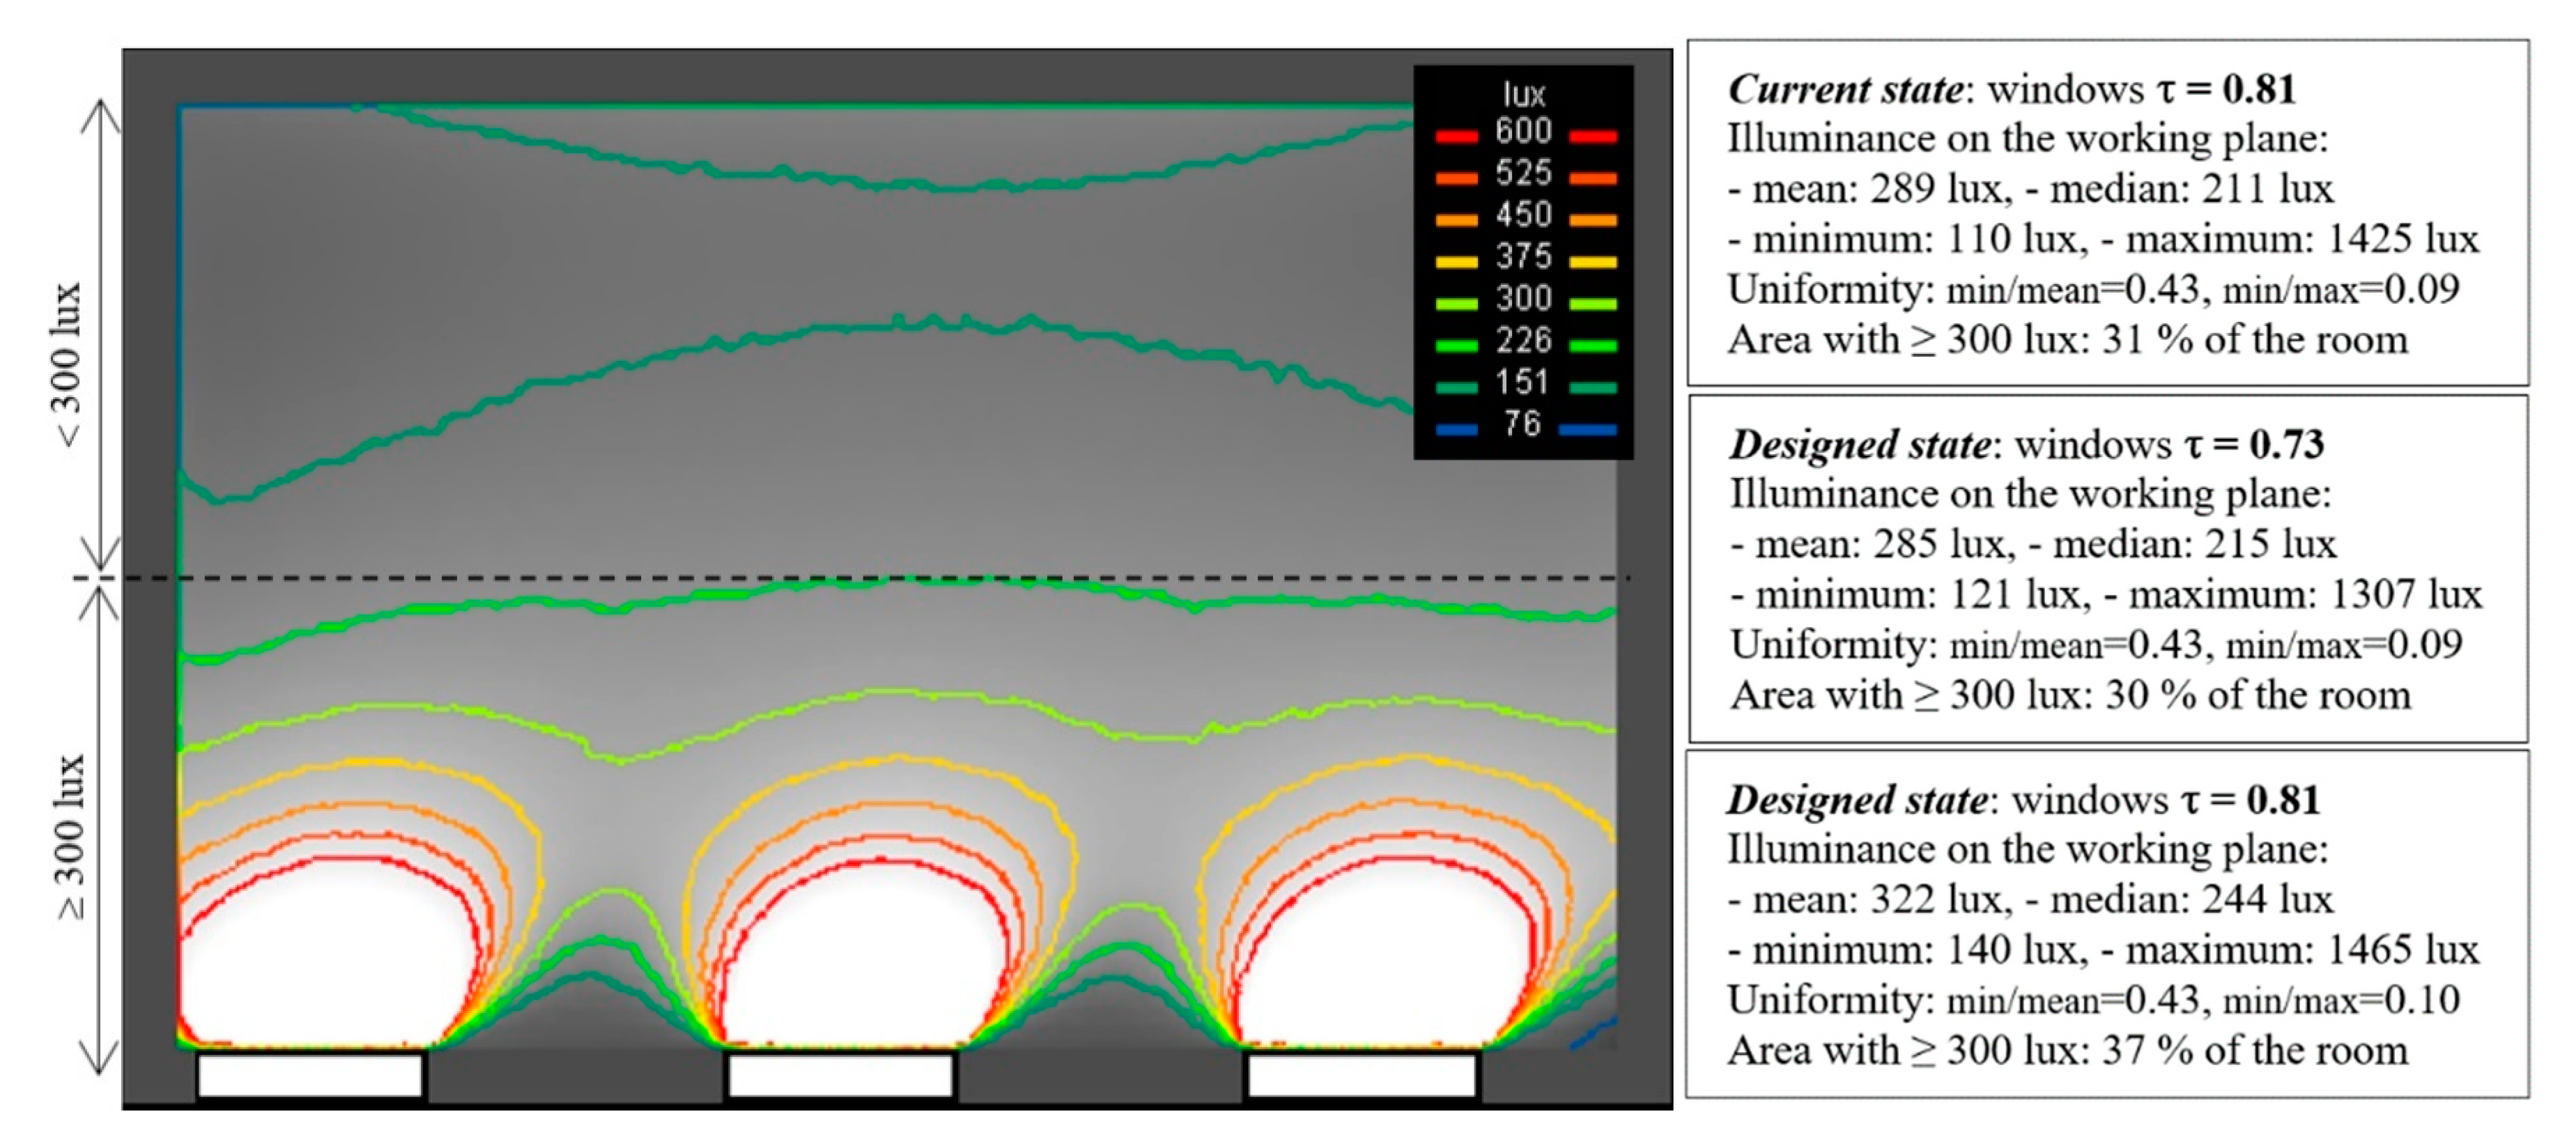
3.3.2. Daylight Simulation Outputs

The annual balance of the classroom illuminance on the working plane shows monthly mean, median, minimum and maximum values calculated for 21st day of every month and daytime 12:00 under clear and overcast sky conditions (Figure 14). Illuminance can be increased more than 300 lux in the case of clear sky compared to cloudy sky conditions.
Illuminance [lux] level on the horizontal working plane is shown in colour iso-lines in Figure 15 for the clear sky simulation on 21st June at 12:00. Mean, median, minimum and maximum illuminance and uniformity values in the current and designed state of the classroom (renovated scenario II with two variations of window glazing transmittance) are compared with standard target values [61,62] for desks min 500 lux and desk surroundings min 300 lux. Despite high illuminance levels, a part of the classroom does not comply with target illuminances.
Daylight factor DF [%] distribution on the working plane was also simulated for the CIE overcast sky conditions. The daylight factor was controlled with a target daylight factor in accordance with EN 17037 [61]. The target daylight factor DT = 2% is specified for target indoor illuminance 300 lux and external diffuse horizontal illuminance 14,900 lux (locality Prague, Czech Republic). Minimum 50% of the classroom working plane should have daylight level at least adequate to the target daylight factor [61]. However, the daylight factor simulations show that the side lit classroom is too large to comply with the mentioned standard requirements (Figure 16).

4. Discussion

The analysis of heating energy demands in existing old school buildings shows the importance of renovations for their energy efficiency. Indoor comfort demands are fundamental for schools and they have even priority over energy saving requirements. The thermal and daylight evaluation results show that renovation improvements could be sometimes counter-productive from the indoor comfort point of view. The facade renovation with additional thermal insulation system and new windows reduces heat transmission losses but also solar gains and daylighting. Building envelopes can be affected by interstitial condensation, particularly constructions that are insulated from the interior side (Figure 6). The renovation scenario of the brick wall with external thermal insulation appears to be the most convenient design solution (Figure 7 and Figure 8).
Simulation outputs of the temperature drop during the winter heating lapse show that the part of the insulated facade has not desired effect on indoor thermal stability of the such voluminous classroom (Figure 9). Results display that better thermal insulation quality of windows have not significant influence on the winter thermal stability. Solar gains through big glazed areas cause potential overheating problems during intensive solar shining periods, especially in summer seasons (Table 2).
Windows are key elements influencing indoor climate comfort. The simulations show that the classroom windows are not of great importance for heating energy reduction. However, they are relevant to cooling needs, which is in agreement with design principles [32,33]. It indicates priority of design optimisation of window glazing/shading parameters in dependence on their size, position and orientation with regards to the indoor environment [59].
Window solar gains also influence indoor visual comfort. Daylight illuminance level was controlled in the classroom (Figure 4). Daylight measurements display that the big southeast-oriented glazed areas inflict uneven daylight distribution (Figure 10, Figure 11 and Figure 12). It is also obvious from increased luminance rates in the classroom visual field (Figure 13). Noticeable variations of interior luminance cause visual discomfort. For example, surfaces in the visual field between the desk and the blackboard. In addition, the positioning of the white glossy board near the window and next to the blackboard is not convenient (Figure 3 and Figure 13). Application of grey boards would be a more reasonable solution in this case.
Daylight simulations show that despite big windows, the voluminous classroom is not properly daylit. The design variation, with additional facade insulation and triple glazed windows, represents daylight level reduction compared to the current room daylighting (Figure 15 and Figure 16) (designed state, τ = 0.73). Activation of shading blinds could also cause discomfort (Figure 3). Special shadings that transmit diffusive skylight and reflect direct solar radiation [66] can be recommended for schools. Application of light guiding systems and anidolic ceilings [67] could bring better daylight uniformity in large classrooms.

5. Conclusions

Existing school premises represent massive potentials for energy savings. The studied school buildings were renovated in several stages and time periods. However, in many cases, they do not perform the desired energy efficiency. Renovations of old buildings are often limited to partial improvements. Nevertheless, the holistic approach towards a comfortable and energy efficient indoor environment appears to be the most convenient strategy, especially for school buildings renovation. This strategy is in agreement with temporary trends of sustainable buildings development. Complex retrofits focused on building envelopes and their window/shading systems together with the installation of efficient technical systems for heating, ventilation, cooling and artificial lighting could bring desirable effects.

Author Contributions

Conceptualization and data analysis, P.M., J.M.; supervision, M.N. All authors have read and agreed to the published version of the manuscript.

Funding

This research received no external funding. The APC was funded by the Institute of Building Structures, Faculty of Civil Engineering, Brno University of Technology.

Acknowledgments

This article has been worked out under the project No. LO1408 “AdMaS UP—Advanced Materials, Structures and Technologies”, supported by Ministry of Education, Youth and Sports of the Czech Republic under the “National Sustainability Programme I”. School energy audits were used with permission of the State Environmental Fund of the Czech Republic.

Conflicts of Interest

Authors declare no conflict of interest.

References

  1. Directive (EU) 2018/844 of the European Parliament and of the Council of 30 May 2018. Amending Directive 2010/31/EU on the Energy Performance of Buildings and Directive 2012/27/EU on Energy Efficiency. Available online: https://eur-lex.europa.eu/legal-content/EN/TXT/?toc=OJ%3AL%3A2018%3A156%3ATOC&uri=uriserv%3AOJ.L_.2018.156.01.0075.01.ENG (accessed on 15 January 2020).
  2. Energy Transition of the EU Building Stock. Available online: https://www.openexp.eu/sites/default/files/publication/files/Reports/energy_transition_of_the_eu_building_stock_full_report.pdf (accessed on 15 January 2020).
  3. Pérez-Lombard, L.; Ortiz, J.; Pout, C. A review on buildings energy consumption information. Energy Build. 2008, 40, 394–398. [Google Scholar] [CrossRef]
  4. Butala, V.; Novak, P. Energy consumption and potential energy savings in old school buildings. Energy Build. 1999, 29, 241–246. [Google Scholar] [CrossRef]
  5. Mahdavi, A.; Doppelbauer, E. A performance comparison of passive and low-energy buildings. Energy Build. 2010, 42, 1314–1319. [Google Scholar] [CrossRef]
  6. Mihai, M.; Tanasiev, V.; Dinca, C.; Badea, A.; Vidu, R. Passive house analysis in terms of energy performance. Energy Build. 2017, 144, 74–86. [Google Scholar] [CrossRef]
  7. Gohardani, N.; Björk, F. Sustainable refurbishment in building technology. Smart Sustain. Built Environ. 2012, 1, 241–252. [Google Scholar] [CrossRef]
  8. Leung, B.C.-M. Greening existing buildings [GEB] strategies. Energy Rep. 2018, 4, 159–206. [Google Scholar] [CrossRef]
  9. Zimmermann, M. School Building Renovation for Sustainable Second Life, in IEA ECBCS Annex 50 Prefabricated Systems for Low Energy Renovation of Residential Buildings. Building Renovation Case Studies, Empa, Duebendorf. 2011. Available online: https://annex53.iea-ebc.org/Data/publications/EBC_Annex_50_Documented_CaseStudies.pdf (accessed on 14 January 2020).
  10. Erhorn-Kluttig, H.; Mørck, O. Energy-Efficient Renovation of Educational Buildings, PEB Exchange, Programme on Educational Building 2005/9. OECD Publishing. Available online: https://ideas.repec.org/p/oec/eduaaa/2005-9-en.html (accessed on 17 January 2020).
  11. Burman, B.; Kimpian, J.; Mumovic, J. Building Schools for the Future: Lessons Learned from Performance Evaluations of Five Secondary Schools and Academies in England. Front. Built Environ. 2018. Available online: https://www.frontiersin.org/articles/10.3389/fbuil.2018.00022/full (accessed on 17 January 2020).
  12. Advanced Energy Design Guide for K-12 School Buildings. Achieving 50% Energy Savings toward a Net Zero Energy Building. American Society of Heating, Refrigerating and Air-Conditioning Engineers. 2011. Available online: file:///D:/Downloads/Energy_Design_Guide_for_Schools_k_12_LEE.pdf (accessed on 14 January 2020).
  13. Schools. Carbon Trust. 2012. Available online: https://www.carbontrust.com/media/39232/ctv019_schools.pdf (accessed on 14 January 2020).
  14. School of the Future. Towards Zero Emission with High Performance Indoor Environment. EU 7th Framework Programme—EeB-ENERGY, Project Number: 260102. The Project Final Report. Available online: http://www.ectp.org/fileadmin/user_upload/documents/E2B/School_of_the_future/1_School_of_the_Future_Final_public_report.pdf (accessed on 7 May 2020).
  15. Raatikainen, M.; Skön, J.; Leiviskă, K.; Kolehmainen, M. Intelligent analysis of energy consumption in school buildings. Appl. Energy 2016, 165, 416–429. [Google Scholar] [CrossRef]
  16. Erhorn, H.; Mroz, T.; Mørck, O.; Schmidt, F.; Schoff, L.; Thomsen, K.L. The Energy Concept Adviser—A tool to improve energy efficiency in educational buildings. Energy Build. 2008, 40, 419–428. [Google Scholar] [CrossRef]
  17. Hong, S.; Paterson, G.; Mumovic, D.; Steadman, P. Improved benchmarking comparability for energy consumption in schools. Build. Res. Inf. 2014, 42, 47–61. [Google Scholar] [CrossRef]
  18. Agdas, D.; Srinivasan, R.S.; Frost, K.; Masters, K.J. Energy use assessment of educational buildings: Toward a campus-wide sustainable energy policy. Sustain. Cities Soc. 2015, 17, 15–21. [Google Scholar] [CrossRef] [Green Version]
  19. Najjar, M.K. Integrating parametric analysis with building information modelling to improve energy performance of construction projects. Energies 2019, 12, 1515. [Google Scholar] [CrossRef] [Green Version]
  20. Becker, R.; Goldberger, I.; Paciuk, M. Improving energy performance of school buildings while ensuring indoor air quality ventilation. Build. Environ. 2007, 42, 3261–3276. [Google Scholar] [CrossRef]
  21. Ascione, F.; Bianco, N.; De Masi, R.F.; Mauro, G.M.; Vanoli, G.P. Energy retrofit of educational buildings: Transient energy simulations, model calibration and multi-objective optimization towards nearly zero-energy performance. Energy Build. 2017, 144, 303–319. [Google Scholar] [CrossRef]
  22. Zomorodian, Z.S.; Tahsildoost, M.; Hafezi, M. Thermal comfort in educational buildings: A review article. Renew. Sustain. Energy Rev. 2016, 59, 895–906. [Google Scholar] [CrossRef]
  23. Barbhuiya, S.; Barbhuiya, S. Thermal comfort and energy consumption in a UK educational building. Build. Environ. 2013, 68, 1–11. [Google Scholar] [CrossRef]
  24. Wang, Y.; Kuckelkorn, J.; Zhao, F.; Liu, D.; Kirschbauma, A.; Zhange, J. Evaluation on classroom thermal comfort and energy performance of passive school building by optimizing HVAC control systems. Build. Environ. 2015, 89, 86–106. [Google Scholar] [CrossRef]
  25. Chatzidiakou, E.; Mumovic, D.; Summerfield, A.J.; Altamirano, H.M. Indoor air quality in London schools. Part 1: Performance in use. Intelligent Buildings International, Taylor & Francis, Special Issue: Designing Intelligent School Buildings: What do We Know. Intell. Bulid. Int. 2015, 7, 101–129. Available online: http://www.tandfonline.com/doi/abs/10.1080/17508975.2014.918870#.VSlx-txfWHg (accessed on 12 May 2020).
  26. Manfren, M.; Nastasi, B.; Piana, E.; Tronchin, L. On the link between energy performance of building and thermal comfort: An example. AIP Conf. Proc. 2019, 2123, 020066. [Google Scholar] [CrossRef]
  27. Gelfand, L.; Freed, E.C. Sustainable School Architecture: Design for Elementary and Secondary Schools; John Wiley & Sons: Hoboken, NJ, USA, 2010. [Google Scholar]
  28. Gonzalo, R.; Habermann, K.J. Energy-Efficient Architecture: Basics for Planning and Construction; Birkhäuser: Basel, Switzerland, 2002. [Google Scholar]
  29. Jaffe, S.B.; Fleming, R.; Karlen, M.; Roberts, S.H. Sustainable Design Basics; John Willey and Sons: Hoboken, NJ, USA, 2020. [Google Scholar]
  30. Dubey, K.; Dodonov, A. Mapping of Existing Technologies to Enhance Energy Efficiency in Buildings in the UNECE Region, Joint Task Force on Energy Efficiency Standards in Buildings; United Nations Economic Commission for Europe: Geneva, Switzerland, 2018; Available online: https://www.unece.org/fileadmin/DAM/hlm/Meetings/2018/10_03_Geneva/1_Study_on_Mapping_of_EE_technologies_v2.pdf (accessed on 29 April 2020).
  31. Windows—Making It Clear: Energy, Daylight and Thermal Comfort (NF78). National House Building Council (NHBC) Foundation, 2017. Available online: https://www.buildup.eu/en/practices/publications/windows-making-it-clear-energy-daylight-and-thermal-comfort-nf78-0 (accessed on 29 April 2020).
  32. Persson, M.L.; Roos, A.; Wall, M. Influence of window size on the energy balance of low energy houses. Energy Build. 2006, 38, 181–188. [Google Scholar] [CrossRef]
  33. Ochoa, C.E.; Aries, M.B.C.; Loenen, E.J.; Hensen, J.L.M. Considerations on design optimization criteria for windows providing low energy consumption and high visual comfort. Appl. Energy 2012, 95, 238–245. [Google Scholar] [CrossRef] [Green Version]
  34. Wierzbicka, A.; Pedersen, E.; Persson, R.; Nordquist, B.; Stålne, K.; Gao, C.; Harderup, L.E.; Borell, J.; Caltenco, H.; Ness, B.; et al. Healthy indoor environments: The need for a holistic approach. Int. J. Environ. Res. Public Health 2018, 15, 1874. [Google Scholar] [CrossRef] [PubMed] [Green Version]
  35. Wang, Y.; Du, J.; Kuckelhorn, J.M.; Kirschbaum, A.; Gu, X.; Li, D. Identifying the feasibility of establishing a passive house school in central Europe: An energy performance and carbon emissions monitoring study in Germany. Renew. Sustain. Energy Rev. 2019, 113, 109256. [Google Scholar] [CrossRef]
  36. Energy Audits of School Buildings, Archive of the State Environmental Fund of the Czech Republic, Prague. Available online: https://www.sfzp.cz/en/ (accessed on 21 April 2020).
  37. Primary School Mirova, Mimon, 2015, Mimon. Available online: http://zsamsmirova.cz/ (accessed on 16 January 2020).
  38. Svoboda, Z. Thermal Assessment Software, CVUT Prague. Available online: http://kcad.cz/cz/stavebni-fyzika/tepelna-technika/ (accessed on 12 January 2020).
  39. ISO 6946:2017 Building Components and Building Elements—Thermal Resistance and Thermal Transmittance—Calculation Methods; ISO: Geneva, Switzerland, 2017.
  40. ISO 13788:2012 Hygrothermal Performance of Building Components and Building Elements—Internal Surface Temperature to Avoid Critical Surface Humidity and Interstitial Condensation—Calculation Methods; ISO: Geneva, Switzerland, 2012.
  41. ČSN 730540 Thermal Protection of Buildings (Tepelná Ochrana Budov). Available online: https://www.buildup.eu/en/practices/publications/czech-republic-standard-csn-73-0540-thermal-protection-buildings (accessed on 12 May 2020).
  42. ISO 10211:2017 Thermal Bridges in Building Construction—Heat Flows and Surface Temperatures—Detailed Calculations; ISO: Geneva, Switzerland, 2017.
  43. Šála, J. Interpretation of Provisions of the Czech Standard ČSN 73 0540 Thermal Protection of Buildings for Residential Wooden Houses and Design Recommended Practice. Prague, CZ. 2007. Available online: https://www.competitionline.com/upload/downloads/16xx/1673_3028045_Interpretation_of_thermal_standards.pdf (accessed on 29 April 2020).
  44. Shishegar, N.; Boubekri, M. Natural light and productivity: Analyzing the impacts of daylighting on students’ and workers’ health and allertness. Int. J. Adv. Chem. Eng. Biol. Sci. 2016, 3, 72–77. Available online: https://iicbe.org/upload/4635AE0416104.pdf (accessed on 12 May 2020).
  45. Wu, W.; Ng, E. A review of the development of daylighting in schools. Light. Res. Technol. 2003, 35, 111–125. [Google Scholar] [CrossRef] [Green Version]
  46. Nocera, F.; Faro, A.L.; Constanzo, V.; Raciti, C. Daylight Performance of Classrooms in a Mediterranean School Heritage Building. Sustainability 2018, 10, 3705. [Google Scholar] [CrossRef] [Green Version]
  47. Küller, R.; Ballal, S.; Laike, T.; Mikellides, B.; Tonello, G. The impact of light and colour on psychological mood: A cross-cultural study of indoor work environments. Ergon. Des. 2006, 49, 1496–1507. [Google Scholar] [CrossRef]
  48. Küller, R.; Lindsten, C. Health and behaviour of children in classrooms with and without windows. J. Environ. Psychol. 1992, 12, 305–317. [Google Scholar] [CrossRef]
  49. Pellegrino, A.; Cammarano, S.; Savio, V. Daylighting for Green schools: A resource for indoor quality and energy efficiency in educational environments. Energy Procedia 2015, 78, 3162–3167. [Google Scholar] [CrossRef] [Green Version]
  50. Maesano, C.; Annesi-Maesano, I. Impact of lighting on school performance in European classrooms. In Proceedings of the CLIMA 2013—the 12th REHVA World Congress, Aalborg, Denmark, 22–25 May 2016; pp. 1–14. [Google Scholar]
  51. Costanzo, V.; Evola, G.; Marletta, L. A review of daylighting strategies in schools: State of the art and expected future trends. Buildings 2017, 7, 41. [Google Scholar] [CrossRef] [Green Version]
  52. Heschong, L.; Wright, R.L.; Okura, S. Daylighting impacts on human performance in school. J. Illum. Eng. Soc. 2013, 31, 101–114. [Google Scholar] [CrossRef]
  53. Renew School. Available online: https://www.renew-school.eu/en/about/ (accessed on 15 January 2020).
  54. Energy Efficiency. IEA, 2018. Available online: https://www.iea.org/efficiency2018/ (accessed on 16 January 2020).
  55. Guzowski, M. Daylighting for Sustainable Design; McGraw-Hill: Hoboken, NJ, USA, 2000. [Google Scholar]
  56. Houck, F. A novel approach on assessing daylight access in schools. Procedia Econ. Financ. 2015, 21, 40–47. [Google Scholar] [CrossRef]
  57. Piderit, M.B.; Labarca, C.Y. Methodology for assessing daylighting design strategies in classroom with a climate-based method. Sustainability 2015, 7, 880–897. [Google Scholar] [CrossRef] [Green Version]
  58. Bellia, L.; Pedace, A.; Barbato, G. Lighting in educational environments: An example of a complete analysis of the effects of daylight and electric light on occupants. Build. Environ. 2013, 68, 50–65. [Google Scholar] [CrossRef]
  59. Zomorodian, Z.S.; Korsavi, S.S.; Tahsildoost, M. The effect of window configuration on daylight performance in classrooms: A field and simulation study. Int. J. Arch. Urban Plan. 2016, 26, 15–24. Available online: https://www.researchgate.net/publication/305026369_The_effect_of_window_configuration_on_daylight_performance_in_classrooms_A_field_and_simulation_study#fullTextFileContent (accessed on 12 May 2020).
  60. IESNA Lighting Handbook. Illuminating Engineering Society of North America, 9th ed.; IESNA: New York, NY, USA, 2000. [Google Scholar]
  61. BS EN 17037:2018 Daylight in Buildings; BSI: London, UK, 2018.
  62. EN 12464-1. Light and Lighting—Lighting of Work Places—Part 1: Indoor Work Places; CEN (European Committee for Standardization: Brussels, Belgium, 2011. [Google Scholar]
  63. Statistica Software. Available online: http://www.statsoft.com/Products/STATISTICA-Features (accessed on 10 October 2019).
  64. Daylight Visualizer, Velux. Available online: https://www.velux.com/article/2016/daylight-visualizer (accessed on 10 October 2019).
  65. ISO 15469:2004 Spatial Distribution of Daylight—CIE Standard General Sky; ISO: Geneva, Switzerland, 2004.
  66. Mandalaki, M.; Tsoutsos, T. Solar Shading Systems: Design, Performance and Integrated Photovoltaics; Springer Briefs in Energy; Springer: Berlin, Germany, 2019. [Google Scholar] [CrossRef]
  67. Scartezzini, J.-L.; Courret, G. Anidolic daylighting systems. Sol. Energy 2002, 73, 123–135. [Google Scholar] [CrossRef]
Figure 1. Map with localities of the studied school buildings 1 to 18, (map: https://geology.com/world/czech-republic-satellite-image.shtml).
Energies 13 02489 g001
Figure 2. Historical building of primary school, locality Mimoň, CZ [37].
Energies 13 02489 g002
Figure 3. View into the classroom [37].
Energies 13 02489 g003
Figure 4. Plan of the classroom with points 1 to 60 on the working plane (0.85 m over the floor).
Energies 13 02489 g004
Figure 5. Orientation of windows in the daylight model. (a) Photograph of a part of the school building facade (the classroom windows are on the 2nd floor). (b) Geometric model of the classroom (Daylight Visualizer).
Energies 13 02489 g005
Figure 6. Comparison of heating energy consumption in studied school buildings 1 to 18.
Energies 13 02489 g006
Figure 7. Vapour pressure distribution within the external wall and annual balance of condensation/evaporation rate according to ISO 13788 [40].
Energies 13 02489 g007
Figure 8. Temperature distribution of the external wall detail at the window jamb.
Energies 13 02489 g008
Figure 9. Results of assessment of the classroom thermal stability in winter.
Energies 13 02489 g009
Figure 10. Classroom daylight illuminance—dependence on distance from windows.
Energies 13 02489 g010
Figure 11. Daylight illuminance: window line (row i), middle (row iii), room depth (row vi).
Energies 13 02489 g011
Figure 12. External horizontal illuminance measurements.
Energies 13 02489 g012
Figure 13. Classroom surfaces luminance [cdm−2].
Energies 13 02489 g013
Figure 14. Annual balance of the classroom illuminance for clear and overcast sky conditions.
Energies 13 02489 g014
Figure 15. Working plane daylight illuminance, CIE clear sky (21st June, 12:00).
Energies 13 02489 g015
Figure 16. Daylight factor simulation outputs for the CIE overcast sky model.
Energies 13 02489 g016
Table 1. Buildings location, geometry and heat losses.
Building Year of Construction (Renovation)LocalityBuilding Geometry Building Envelope
Altitude [m]Latitude Longitude [°]Aver. Winter Temperature [°C]Building Volume [m3]Gross Floor Area/Heated Volume [m−1]Heat Loss [kW]Average U Value [W m−2 K−1]
11900
(2000)
24849.763969 N 17.180405 E4.132640.63900.907
2195021049.456479 N 17.450230 E3.923,2780.40373.11.27
3199427249.038646 N 17.814872 E3.919,2550.4303.61.136
4193127249.038646 N 17.814872 E3.934480.4761.10.954
5189033449.458565 N 18.056868 E3.819380.57450.10.97
6198430449.6819311 N 18.3673219 E3.723,9550.454341.087
7194933649.712716 N 13.204605 E3.634910.4388.71.23
8197838749.443259 N 13.248114 E3.714710.8561.10.95
9193752049.7161561 N
13.9473069 E
3.571630.471020.90
10193044049.4248869 N
13.8817589 E
3.711,4270.503276.51.05
11198822550.289161 N
14.824512 E
3.852880.4099.40.82
12196018848.9.07468 N 16.775371 E4.541400.4882.61.18
13192945050.129276 N 16.499965 E3.666700.40160.61.21
14196717949.059797 N 17.495850 E3.633260.46781.33
15198067549.908449 N 17.211115 E3.141310.681301.02
161887
(1962)
37849.303454 N
14.158029 E
3.721,7770.37380.61.1
17198033449.820923 N 18.262524 E3.622,4230.25424.50.76
181894
(2014)
28050.655668 N, 14.724856 E2.917,2440.243960.72
Table 2. Results of assessment of the classroom thermal stability in summer.
Current StateRenovated Scenario I, II
Total solar transmittance of window g = 0.65Total solar transmittance of window g = 0.53
Solar gains 2141.64 WSolar gains 1746.26 W
Heat gain through facade4857.30 WHeat gain through façade 3961.7
Heat ventilation loss Heat ventilation loss
(for ventilation rate 0.5 h−1)−32.78 W(for ventilation rate 0.5 h−1)−32.78 W
Total heat gain6966.16 WTotal heat gain5675.24 W
Max. indoor temperature rise per day16.5 °CMax. indoor temperature rise per day14.7 °C
Table 3. Sky luminance data (4th March 2017).
Luminance [cd/m2]LhorizonL15°L45°Lzenith
timeElevation Angle 15°45°90°
11:45direction 1192389083371716
direction 2961490633931727
direction 31897163411432065
direction 45437297821481880
12:50direction 14883720414221514
direction 21081206610701333
direction 3824230917521244
direction 411872578111299

