Article

Impact of Climate Change on Wave Energy Resource in the Mediterranean Coast of Morocco

1
Laboratori d’Enginyeria Marítima, Universitat Politècnica de Catalunya BarcelonaTech, Jordi Girona 1–3, Mòdul D1, Campus Nord, 08034 Barcelona, Catalonia, Spain
2
Centre Internacional d’Investigació dels Recursos Costaners (CIIRC), Jordi Girona 1–3, Mòdul D1, Campus Nord, 08034 Barcelona, Catalonia, Spain
3
Dipartimento Scienze e Tecnologie Biologiche e Ambientali (DiSTeBA), University of Salento, 73100 Lecce, Italy
4
EuroMediterranean Center on Climate Change (CMCC), 73100 Lecce, Italy
*
Author to whom correspondence should be addressed.
Energies 2020, 13(11), 2993; https://doi.org/10.3390/en13112993
Submission received: 13 May 2020 / Revised: 4 June 2020 / Accepted: 6 June 2020 / Published: 10 June 2020
(This article belongs to the Special Issue Impact of Climate Change on Wave Energy Resources)

Abstract

:
The increasing demand for energy and the impacts generated by CO2 emissions make it necessary to harness all possible renewable sources of energy, like wave power. Nevertheless, climate change may generate significant variations in the amount of wave energy available in a certain area. The aim of this paper is to study potential changes in the wave energy resource in the Mediterranean coast of Morocco due to climate change. To do this, wave datasets obtained by four institutes during the Coordinated Regional Climate Downscaling Experiment in the Mediterranean Region (Med-CORDEX) project are used. The future conditions correspond to the RCP4.5 and RCP8.5 scenarios from the Fifth Assessment Report of the Intergovernmental Panel on Climate Change. The results show that projected future wave power is very similar to that of the present considering the whole area, although at some specific points there are slight changes that are more evident for the RCP8.5 scenario. Another remarkable result of this study is the significant increase of the temporal variability of wave power in future scenarios, in particular for RCP8.5. This will be detrimental for the deployment of wave energy converters in this area since their energy output will be more unevenly distributed over time, thus decreasing their efficiency.

1. Introduction

Energy demand is continuously growing due to the increase in population and economic activity. At the same time, the use of traditional energy sources increases the emissions of greenhouse gases that contribute to climate change. In emergent countries without reserves of fossil fuels, such as Morocco, the combination of both factors makes it extremely necessary to promote the development of renewable energy sources to reduce the carbon footprint and their dependence on the import of energy and commodities.
Bearing this in mind, Morocco has undertaken an ambitious program to reduce its reliance on conventional energy sources [1]. As shown in several studies, the country has a high potential for developing renewable energies, in particular solar [2,3] and wind [4,5] energy, which at present represent 6.5% and 11.2% of the total installed power in the country [6]. Other renewable sources such as hydropower, biomass and geothermal are also expected to increase their participation in Morocco’s energy mix [1]. As a result of this program, the participation of thermal sources (coal, fuel, gas) in the country electric energy mix decreased from 90% in 2012 [7] to 66.1% in 2018 [6].
Another potential source of energy that may contribute to reducing fossil fuel dependence and greenhouse emissions is wave energy. In the next decades, significant advances in wave energy conversion are expected [8] and a large number of researchers are working in this field. Their research is focused on two lines: the design and development of wave energy converters (WECs) and the mapping of the available wave energy [9], since the assessment of wave energy potential is essential to select suitable locations for wave farms [10,11].
Research on wave energy focuses on areas with large energy potential, so that many wave resource assessment studies were carried out in the areas with higher wave energy flux, such as the Atlantic [12,13,14,15,16,17,18,19,20,21,22,23,24,25,26] and the Pacific [27,28,29,30,31,32]. Nevertheless, higher wave energy is usually associated to extreme events, entailing greater costs for device maintenance and serious engineering challenges to guarantee WEC survival [33]. In calmer seas, with less energy available, many technical issues related to harsher environmental conditions could be more easily solved, and the quantity of wave energy harvested could still be economically viable [33]. For this reason, several studies assessed wave energy in less energetic areas, particularly in the Mediterranean Sea [9,33,34,35,36,37,38,39,40,41,42,43,44,45,46,47].
To accurately predict the long-term wave energy resource and WEC output in a certain area, it is necessary to take into account the temporal variation of wave features due to natural variability and climate change [48]. Although a number of studies analyzed the long-term evolution of the wave energy resource [26,29,41,49,50,51,52,53,54,55], only a few have addressed the impacts of climate change on it [48,56,57,58,59,60].
The aim of this paper is to assess the wave power resource in the Mediterranean coast of Morocco. The assessment is made for present and future conditions, taking into account the effects of climate change by considering the wave projections of four institutes under two of the scenarios (RCP4.5 and RCP8.5) adopted by the Intergovernmental Panel on Climate Change (IPCC) in its Fifth Assessment Report (AR5) [61]. In addition, by providing an idea of the wave energy potential of that area, this analysis allows estimation on how it will have changed by the end of the century. An analysis of the economic impact or the commercial viability of WEC deployment in this area is out of the scope of this paper.
The manuscript is structured as follows. Section 2 describes the study area, data and methodology used. The wave power resource in the study area is determined in Section 3 for present conditions, whereas Section 4 focuses on the resource estimation under future scenarios. In Section 5, the results are discussed and the main conclusions presented.

2. Materials and Methods

2.1. Study Area

Morocco is a country located in the northwest (NW) of Africa, with coasts on both the Atlantic Ocean and the Mediterranean Sea. Its Mediterranean coast is part of the Western Mediterranean Sea and extends over 540 km from the Gibraltar Strait to the border with Algeria (Figure 1).
The present climate in the Mediterranean basin is dominated by extratropical cyclones, especially during winter [62,63], combined with depressions generated either in northwestern Europe or in the Atlantic Ocean [64]. Large spatial and seasonal climate variability is produced by many subregional and mesoscale effects [65]. During summer, the Mediterranean is also exposed to tropical systems [66] due to its location between arid regions in the south and humid mountains in the north, while spring and autumn are considered to be transitional periods between winter and summer [66].
Due to these features, the Moroccan Mediterranean coast shows a strong cyclogenetic character [67,68,69]. However, waves have relatively small amplitudes, with 90% of the significant wave heights (Hs) being smaller than 1.5 m and only 5% exceeding 3 m [70]. The highest waves, reaching up to 5.5 m [71], are from the east (E) and east–northeast (ENE). The most usual wave periods range from 5 to 6 s [70], reaching between 7 and 11 s during storms [72]. Along the coast, the most frequent directions are E and northeast (NE) [70] although, at some points, waves from west–northwest (WNW) and west (W) also become significant [72].
Regarding the future climate, the exact evolution of atmospheric patterns due to climate change is hard to predict because of the coexistence of many interacting processes [73]. Nevertheless, many studies project wind intensification over northern Europe and weaker wind in southern Europe and the Mediterranean [62,74,75]. As a consequence, most studies suggest a reduction in the number of Mediterranean cyclones [73], although there is no consensus on whether the frequency of intense cyclones will increase or decrease [66,76]. This expected reduction of the number of future storms in the Mediterranean will lead to a general decrease of wave heights, especially during winter, while in summer an opposite trend is projected [73].

2.2. Data Used

The most common approach to project future wave conditions under climate change is dynamic downscaling, which consists of using numerical models for waves forced by winds supplied by global circulation models (GCMs) and regional atmospheric circulation models (RCMs). Examples of such an approach are at global [77,78,79,80,81,82,83,84] and regional scales [73,85,86,87,88,89].
This study uses the wave outputs obtained from four climate models provided by the Centro Euro-Mediterraneo sui Cambiamenti Climatici (CMCC, Italy), the Centre National de Recherches Météorologiques (CNMR, France), the Goethe-Universität Frankfurt am Main (GUF, Germany) and the Laboratoire de Météorologie Dynamique (LMD France), as part of the numerical simulations produced within the Coordinated Regional Climate Downscaling Experiment in the Mediterranean Region Med-CORDEX project [90]. These simulations consider the new Representative Concentration Pathways (RCPs) adopted by the Intergovernmental Panel on Climate Change (IPCC) for its Fifth Assessment Report [91]. These pathways describe different future climates depending on the evolution of greenhouse gases emissions during the 21st century, and are named with a number that indicates the radiative forcing (i.e., the difference between incoming and outgoing energy in the atmosphere) in 2100, expressed in W/m2. The two scenarios selected are one intermediate (RCP4.5) and one pessimistic (RCP8.5). The first one assumes emissions reaching a peak in 2040 and then declining, attaining a radiative forcing of 4.5 W/m2 in 2100. On the contrary, in the RCP8.5 scenario the emissions rise throughout all the century, reaching a radiative forcing of 8.5 W/m2 in 2100.
The datasets used herein consist of 20-year-long time series of wave parameters (Hs, peak period Tp and wave direction θ) on a three-hour basis describing the present (1986–2005) and the future (2081–2100) climates for the two analyzed scenarios (RCP4.5 and RCP8.5). Each dataset is named with the acronym of the corresponding institute. These time periods were selected because they are the same used by the IPCC in its Fifth Assessment Report (AR5), and they fit the goal of the paper for comparing possible modifications in the wave power resource between present and future conditions based on IPCC scenarios.
For this study, the wave power is assessed at 14 grid points covering the Moroccan Mediterranean coast, as shown in Figure 1; the geographical coordinates, water depth and distance to the coast for each point are indicated in Table 1.

2.3. Methods

As shown in Table 1, the points used to carry out the study are located in water depths greater than 100 m, so it is assumed that they are located in deep water. Although for the longest wave periods this condition is not fulfilled, the number of wave data involved is small (<5% in the worst case) and the error incurred by assuming this condition is small compared to the inherent errors associated to the use of numerical model data. Therefore, to assess the theoretical wave power, the following deep-water expression is used:
P = ρ g 2 64 π H s 2 T e = 0.491 H s 2 T e
where P is the wave power (kW/m), Hs is the significant wave height, Te is the energy period, ρ is the seawater density (taken as 1025 kg/m3) and g is the acceleration of gravity.
The energy period can be obtained from the spectral moments of order 0 (m0) and −1 (m−1) as follows:
T e = m 1 m 0
However, as indicated by Cornett [92], wave data are often given in terms of significant wave height Hs and either mean period Tz or peak period Tp, but not energy period Te. Most of the times this period must be obtained from other variables if, as in this case, the spectral moments are unknown. In terms of the peak period, one way to estimate it is:
T e = α T p
where α is a coefficient whose value depends on the wave spectrum features (0.86 for a Pierson–Moskowitz (PM) spectrum and increasing towards 1 with decreasing spectral width) [92]. Taking into account that mixed sea states prevail in this area (combination of sea and swell waves) [73], wave spectra are rather wide [73]. Nevertheless, since the Mediterranean Sea is a closed basin, the fetches are limited and the fully developed sea states of the PM spectrum cannot be reached. Therefore, as suggested by [92], amongst others, a value of Te = 0.9Tp is selected to determine the wave energy resource.
Taking into account Equations (1) and (3), and using all the datasets indicated in Section 2.2, the 20-year-long time series of wave energy resource at each point of Figure 1 is obtained for the present and future (two scenarios). Moreover, by considering the wave direction, the directional distribution of wave power is calculated for whole datasets. This distribution is of particular interest when the wave energy is going to be harvested using nonpoint absorber devices.
The temporal variability of the total wave energy at different time scales is also very important when assessing the energy resource, since it usually varies significantly throughout the year and, taking it into account, is fundamental for evaluating the performance of wave energy converters. As pointed out by several authors [93], an estimate based only on mean annual values may result in wrong decision making. When selecting the location for WEC installation, sites with a more regular time distribution of the wave energy flux are preferable to those with very irregular and unsteady wave conditions, since they are more reliable and efficient for electricity production.
To assess the temporal variability of the wave energy at a specific location, the coefficients proposed by [92] are used: the seasonal variability index (SV) and the monthly variability index (MV). SV is defined as
S V = P s 1 P s 4 P y e a r
where PS1 is the average wave power for the highest-energy season, PS4 is the average wave power for the lowest-energy season and Pyear is the average annual wave power. The greater the value of SV, the larger the seasonal variability of the wave power.
On the other hand, MV is defined as
M V = P M 1 P M 12 P y e a r
where PM1 is the average wave power for the highest-energy month and PM12 is the average wave power for the lowest-energy month. Both indices are also assessed at each point and for all the available datasets.

3. Results for the Present Situation

In this section, the average annual wave power at each point, as well as its directional distribution and temporal variability, are assessed for the four available datasets.

3.1. Wave Power

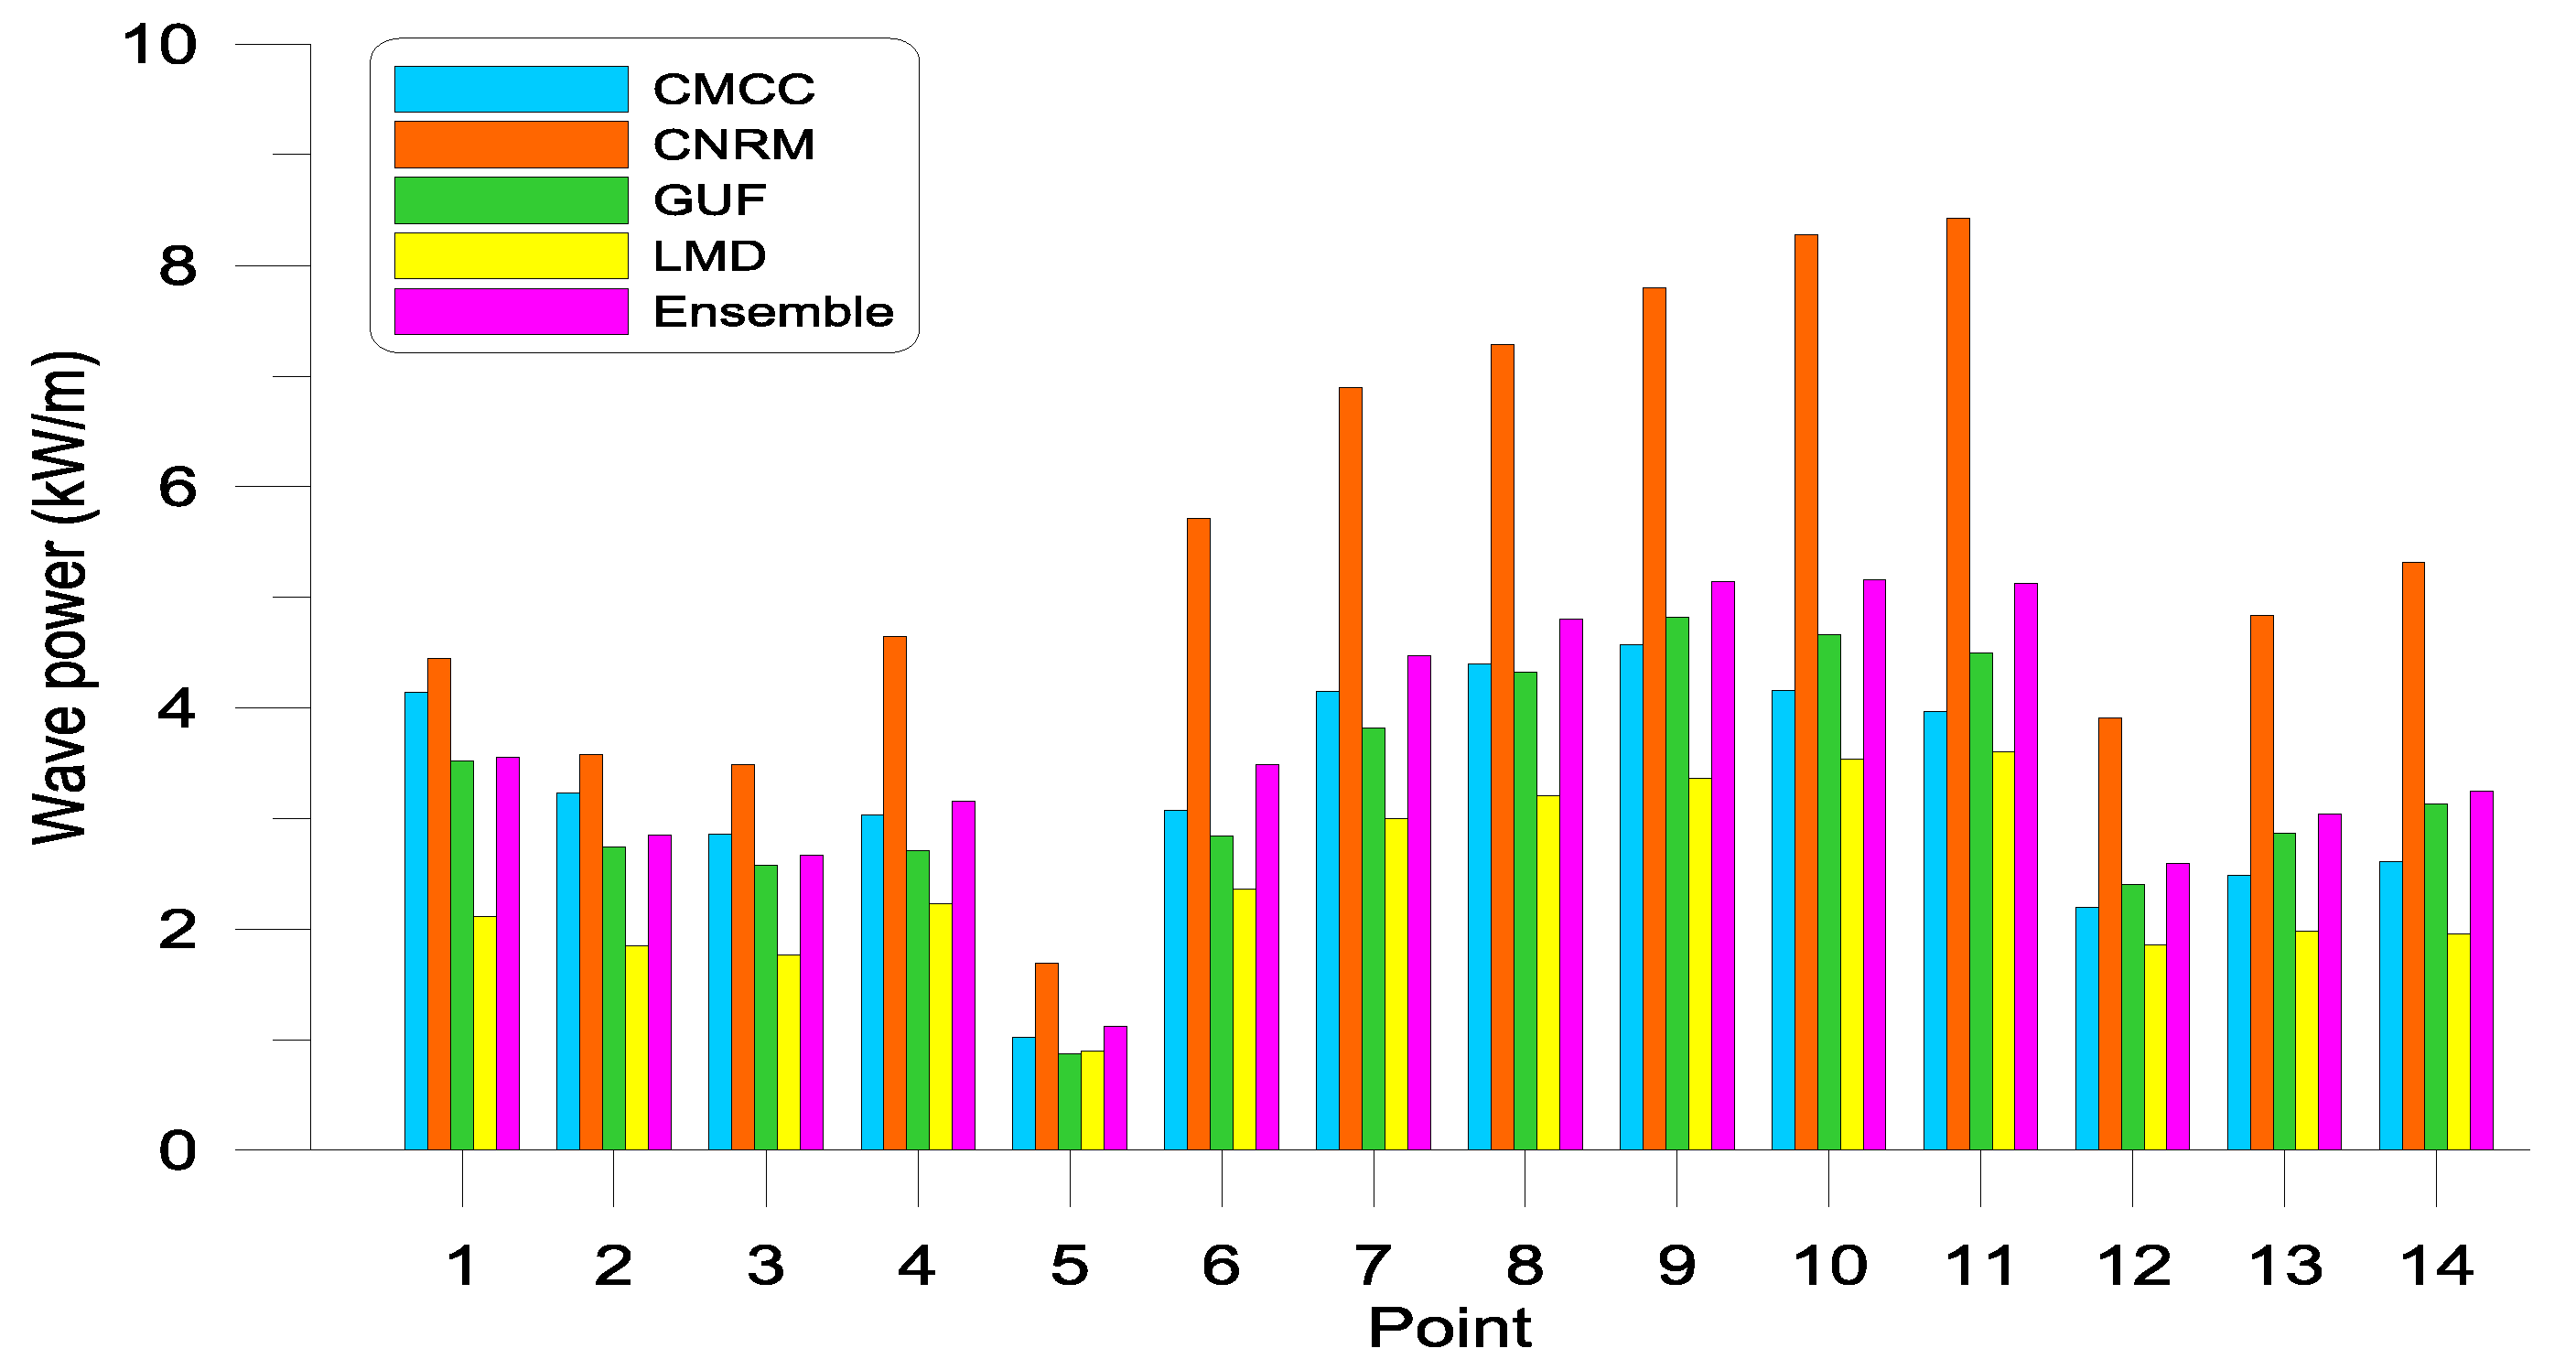
Figure 2 shows the average wave power at each point under present conditions. The results presented correspond to the four datasets used, as well as the ensemble (average) values.
The values obtained for wave energy power are in the range of those estimated in other studies [38,41,46], in particular for CMCC, GUF and the multimodel ensemble. On the contrary, the CNRM data greatly overpredict wave power (except in the western part of the study area), while LMD data slightly underpredict it. With respect to the spatial distribution, the most energetic points are those located in the central stretch of the study area (P7 to P11) with mean wave power greater than 4.4 kW/m, and up to 5 kW/m for the ensemble. In the western part of the analyzed coast (points P1 to P6), the obtained values are smaller (between 2.7 and 3.6 kW/m for the ensemble), with the exception of P5 that only has 1.1 kW/m. In the easternmost zone (P12 to P14), the wave power is comparable to that of the western part (between 2.6 and 3.3 kW/m for the ensemble). Although there is a remarkable uncertainty due to the intermodel variability, the four models follow similar patterns at all points.

3.2. Directional Average Wave Power

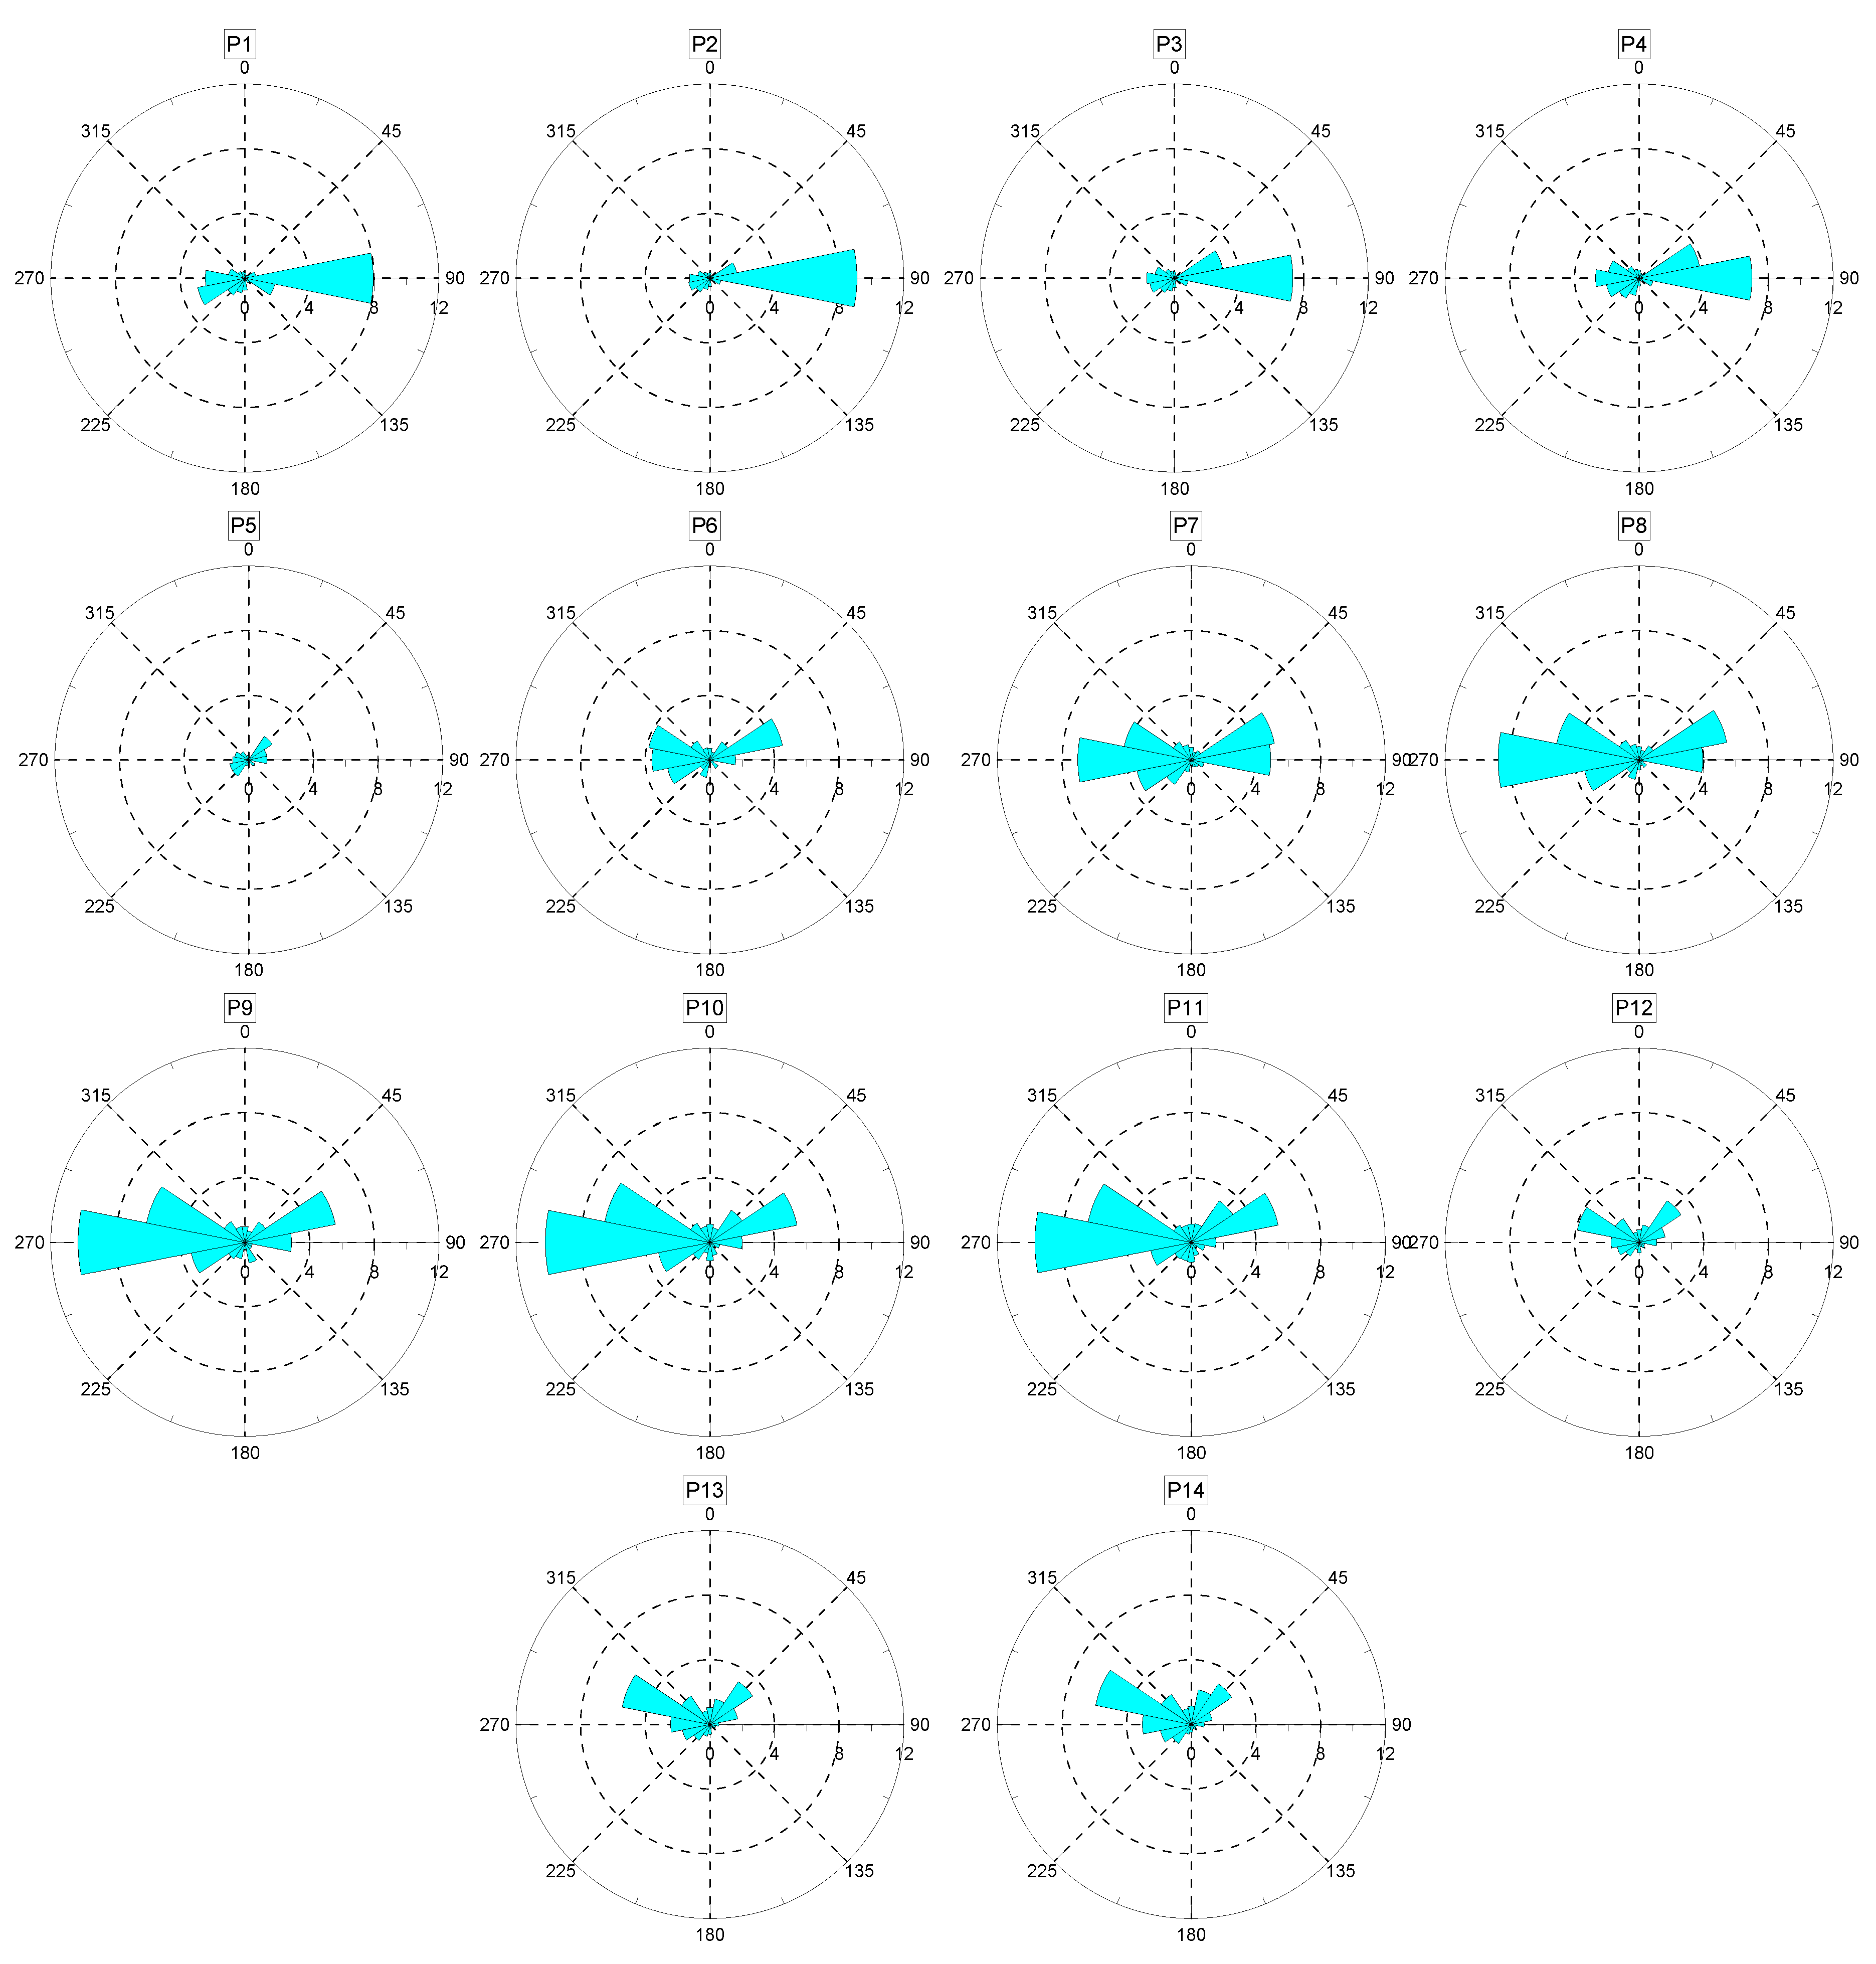
Besides the total wave power available at a certain point, it is important to know its directional distribution because this may condition the type of WECs that can be used. This distribution has been obtained for the multimodel ensemble by averaging the wave energy of the four models in each direction. The results for present wave conditions are shown in Figure 3. At the points located in the western area (P1 to P4), the most energetic waves come from the E, whereas, when moving towards the east, waves coming from W and WNW become more important, being the prevailing directions at almost all the points. At the same time, waves from the E turn to ENE (points P8 to P11) or NE (points P12 to P14).
In summary, in the study area almost all the energy is presently concentrated in two directional sectors: the first is from E to NE and the second is from west–southwest (WSW) to WNW.

3.3. Temporal Variability

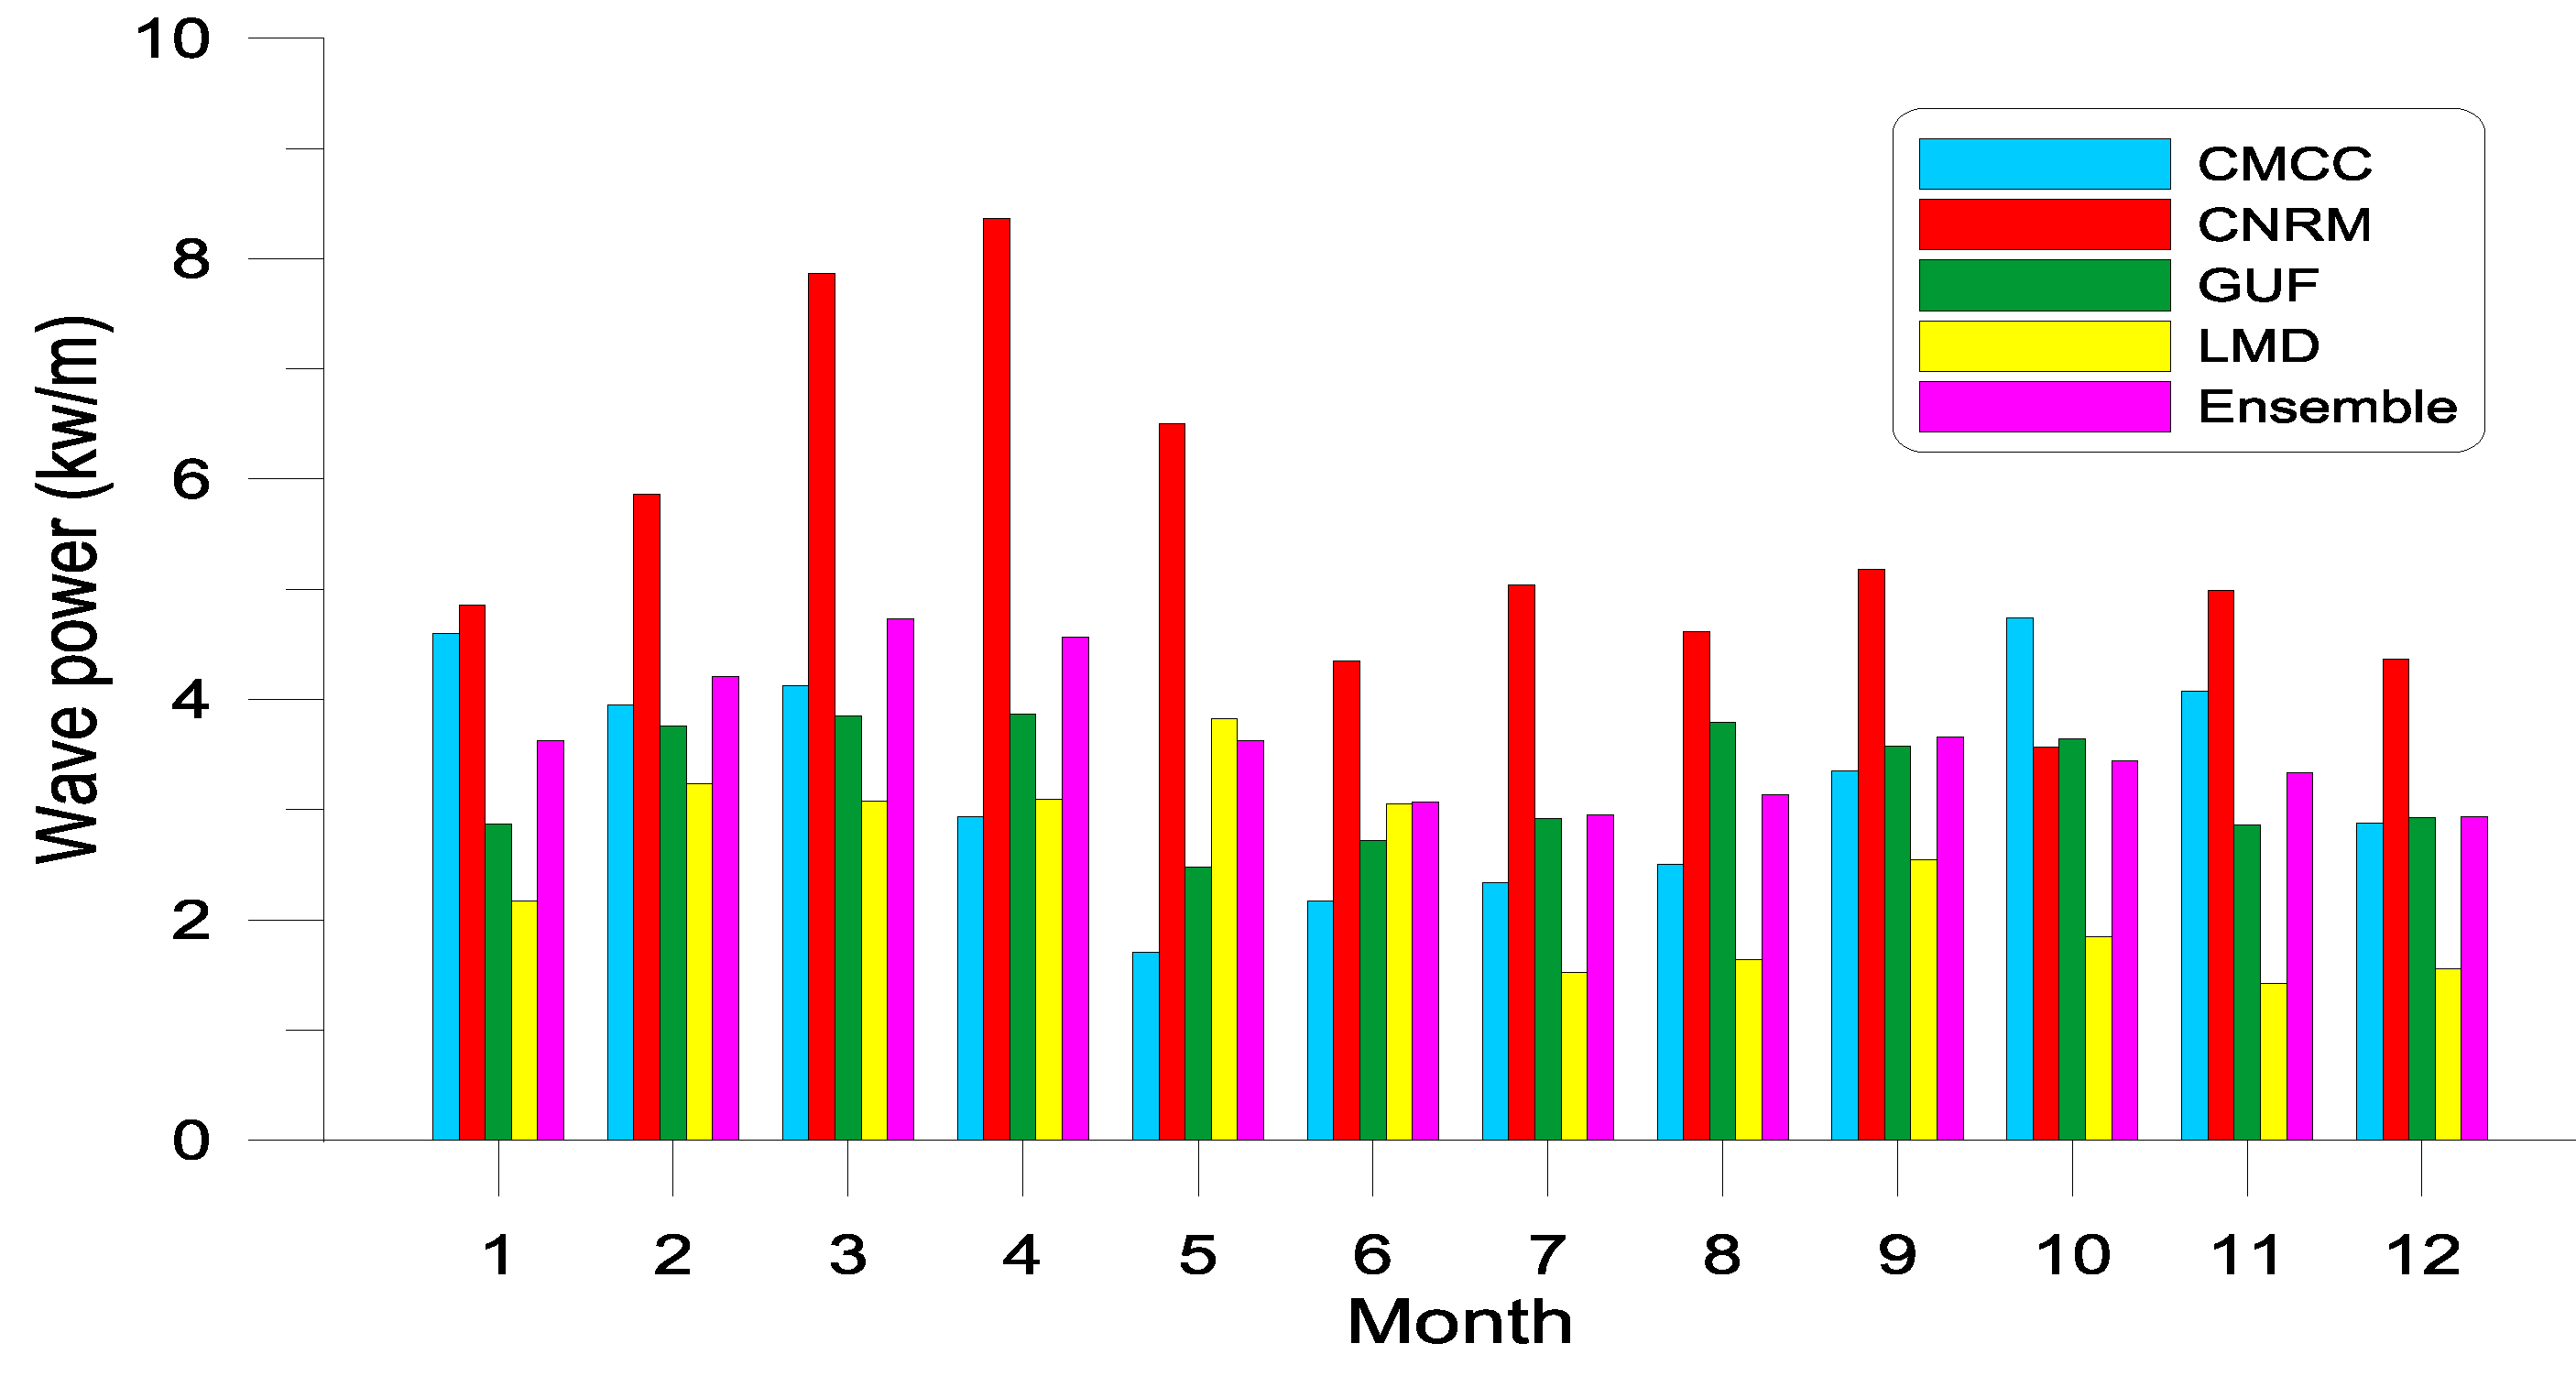
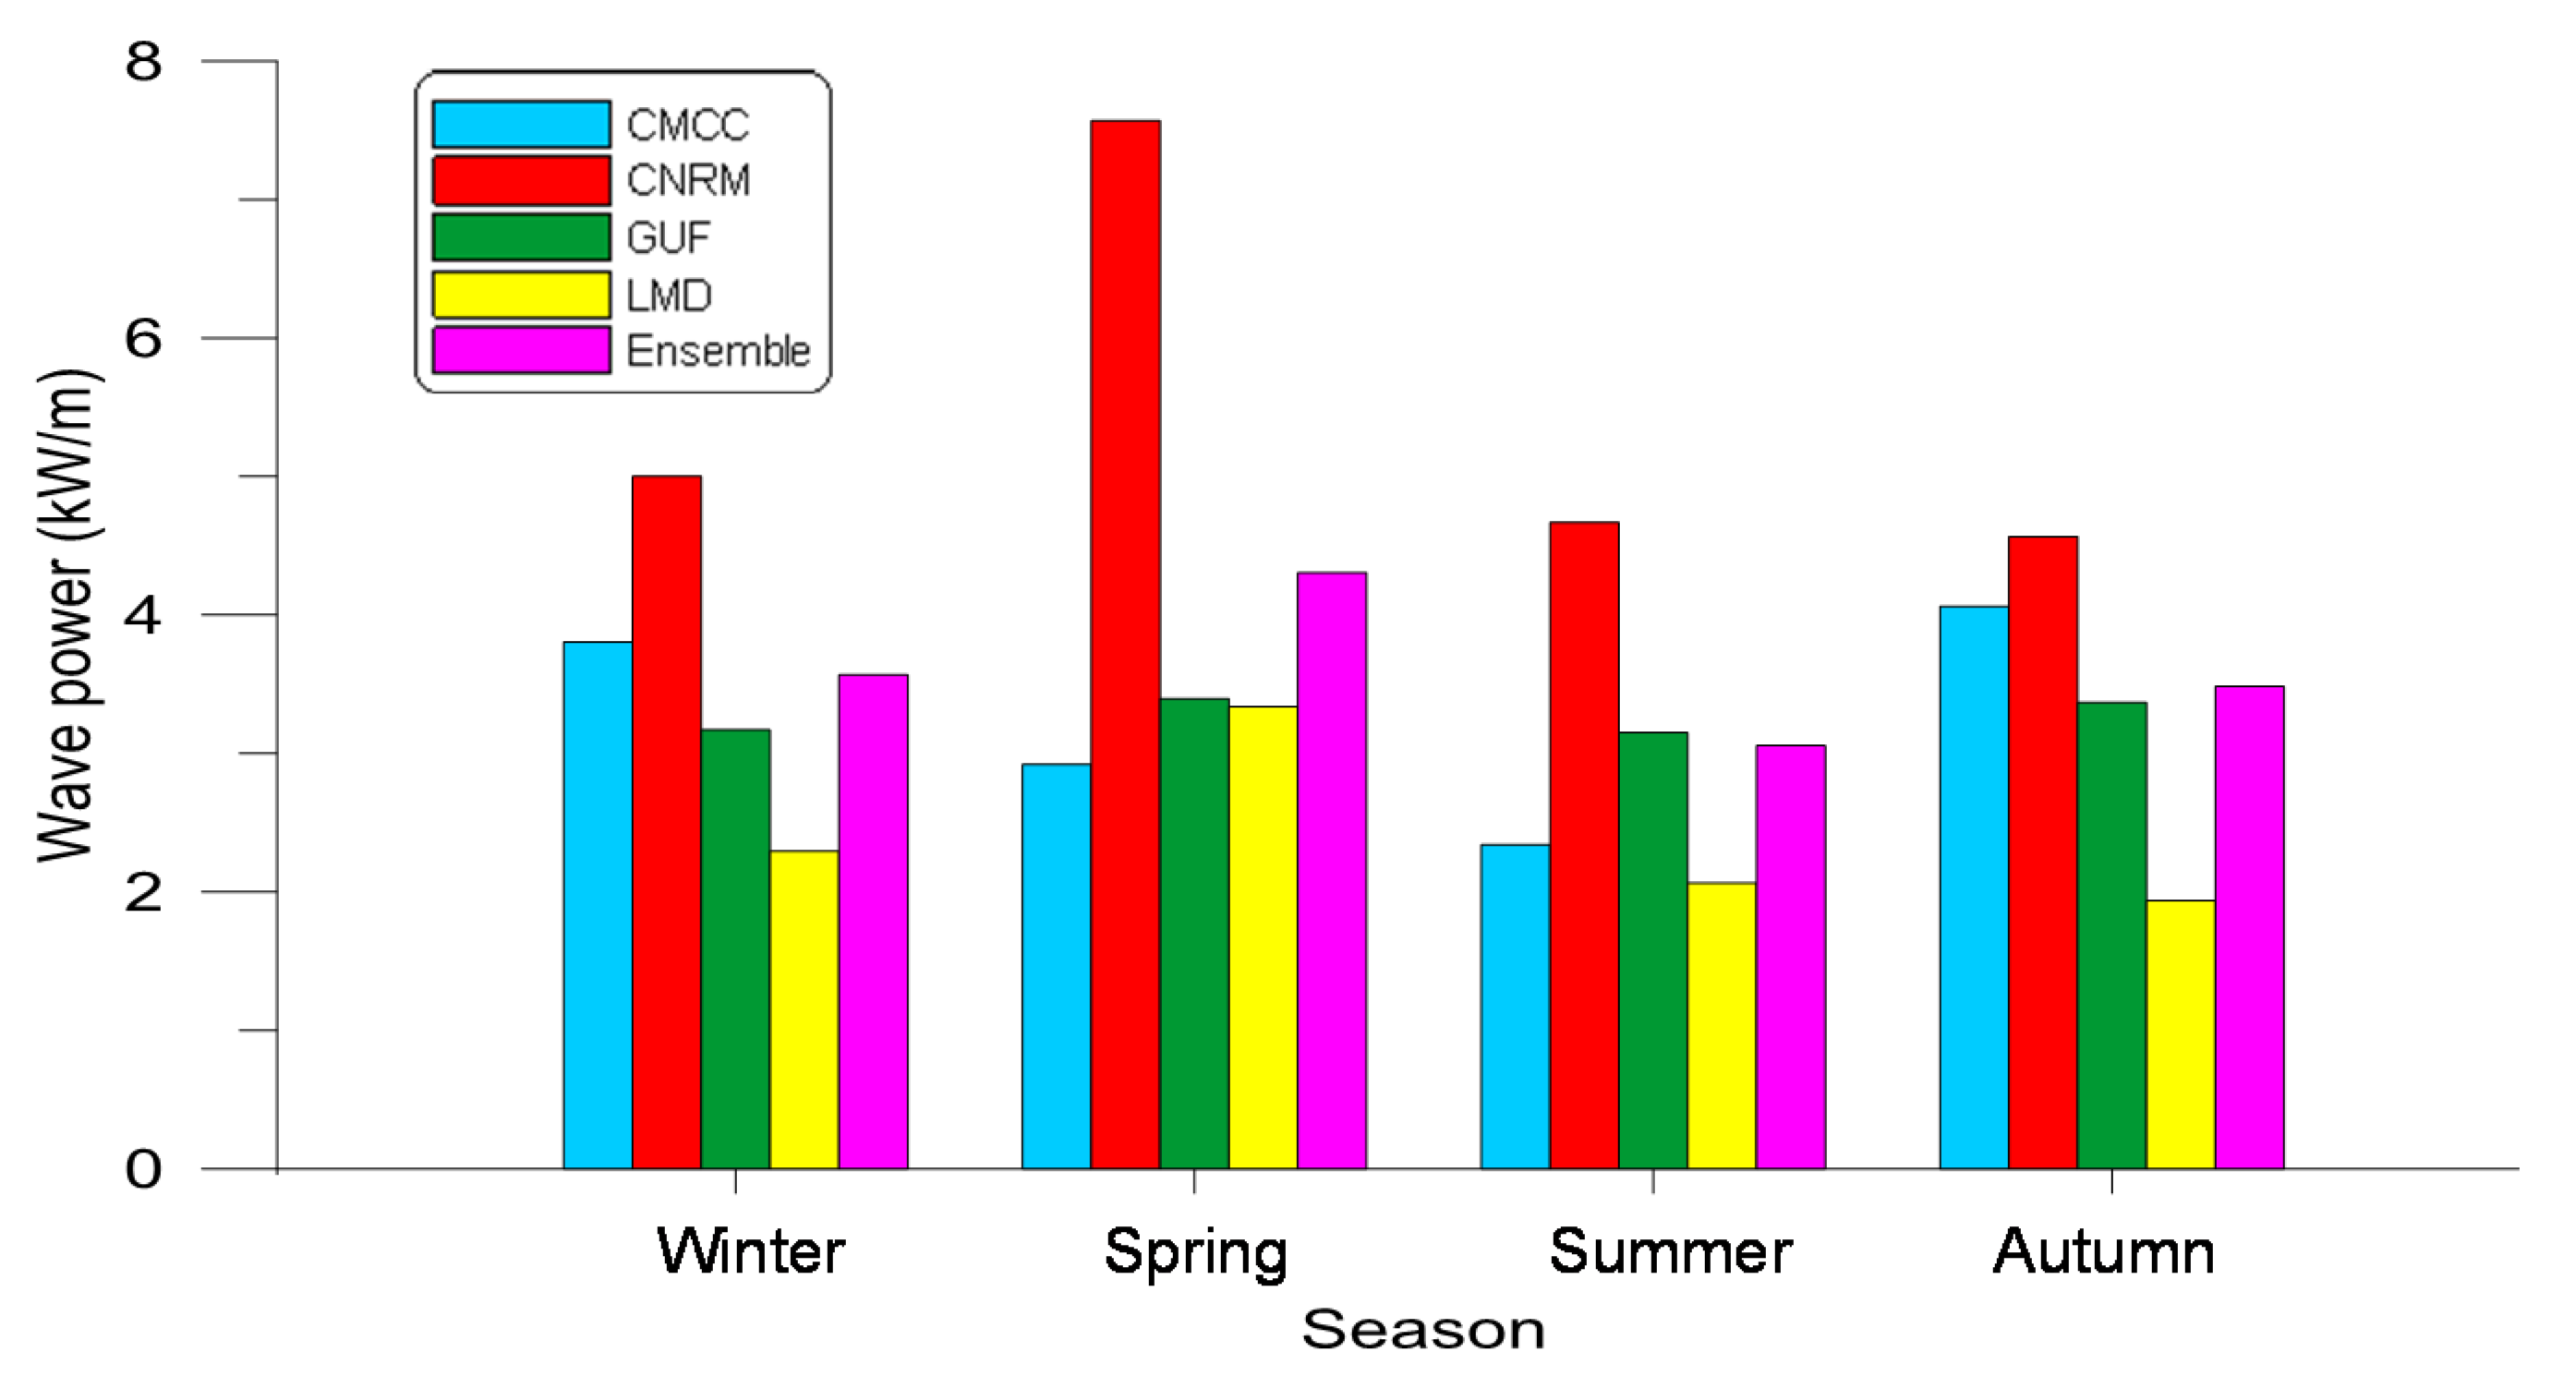
Figure 4 shows the monthly variability of present wave power, while Figure 5 illustrates its seasonal distribution. As in the case of the annual wave power, there is a large intermodel variability, with the four models showing a different temporal distribution of wave power. The results from the CMCC model are compatible with those observed in other Mediterranean regions, with winter and autumn being the most energetic seasons, and summer the mildest period. On the contrary, the other three models show that the most energetic season is spring. Another remarkable feature of the model results is that wave energy is more evenly distributed throughout the year, with smaller differences than expected between seasons. Thus, the wave power ratio between the most energetic and the less energetic seasons is smaller than 2, while in other areas of this region it can reach up to 7.4 [59]. Considering the intermodel ensemble, about 30% of the wave power in the area corresponds to spring, 25% to winter, 24% to autumn and 21% to summer. These values represent a contrast with those found in other areas of the Mediterranean (e.g., [37]), where the seasonal distribution of wave power shows a larger variability.
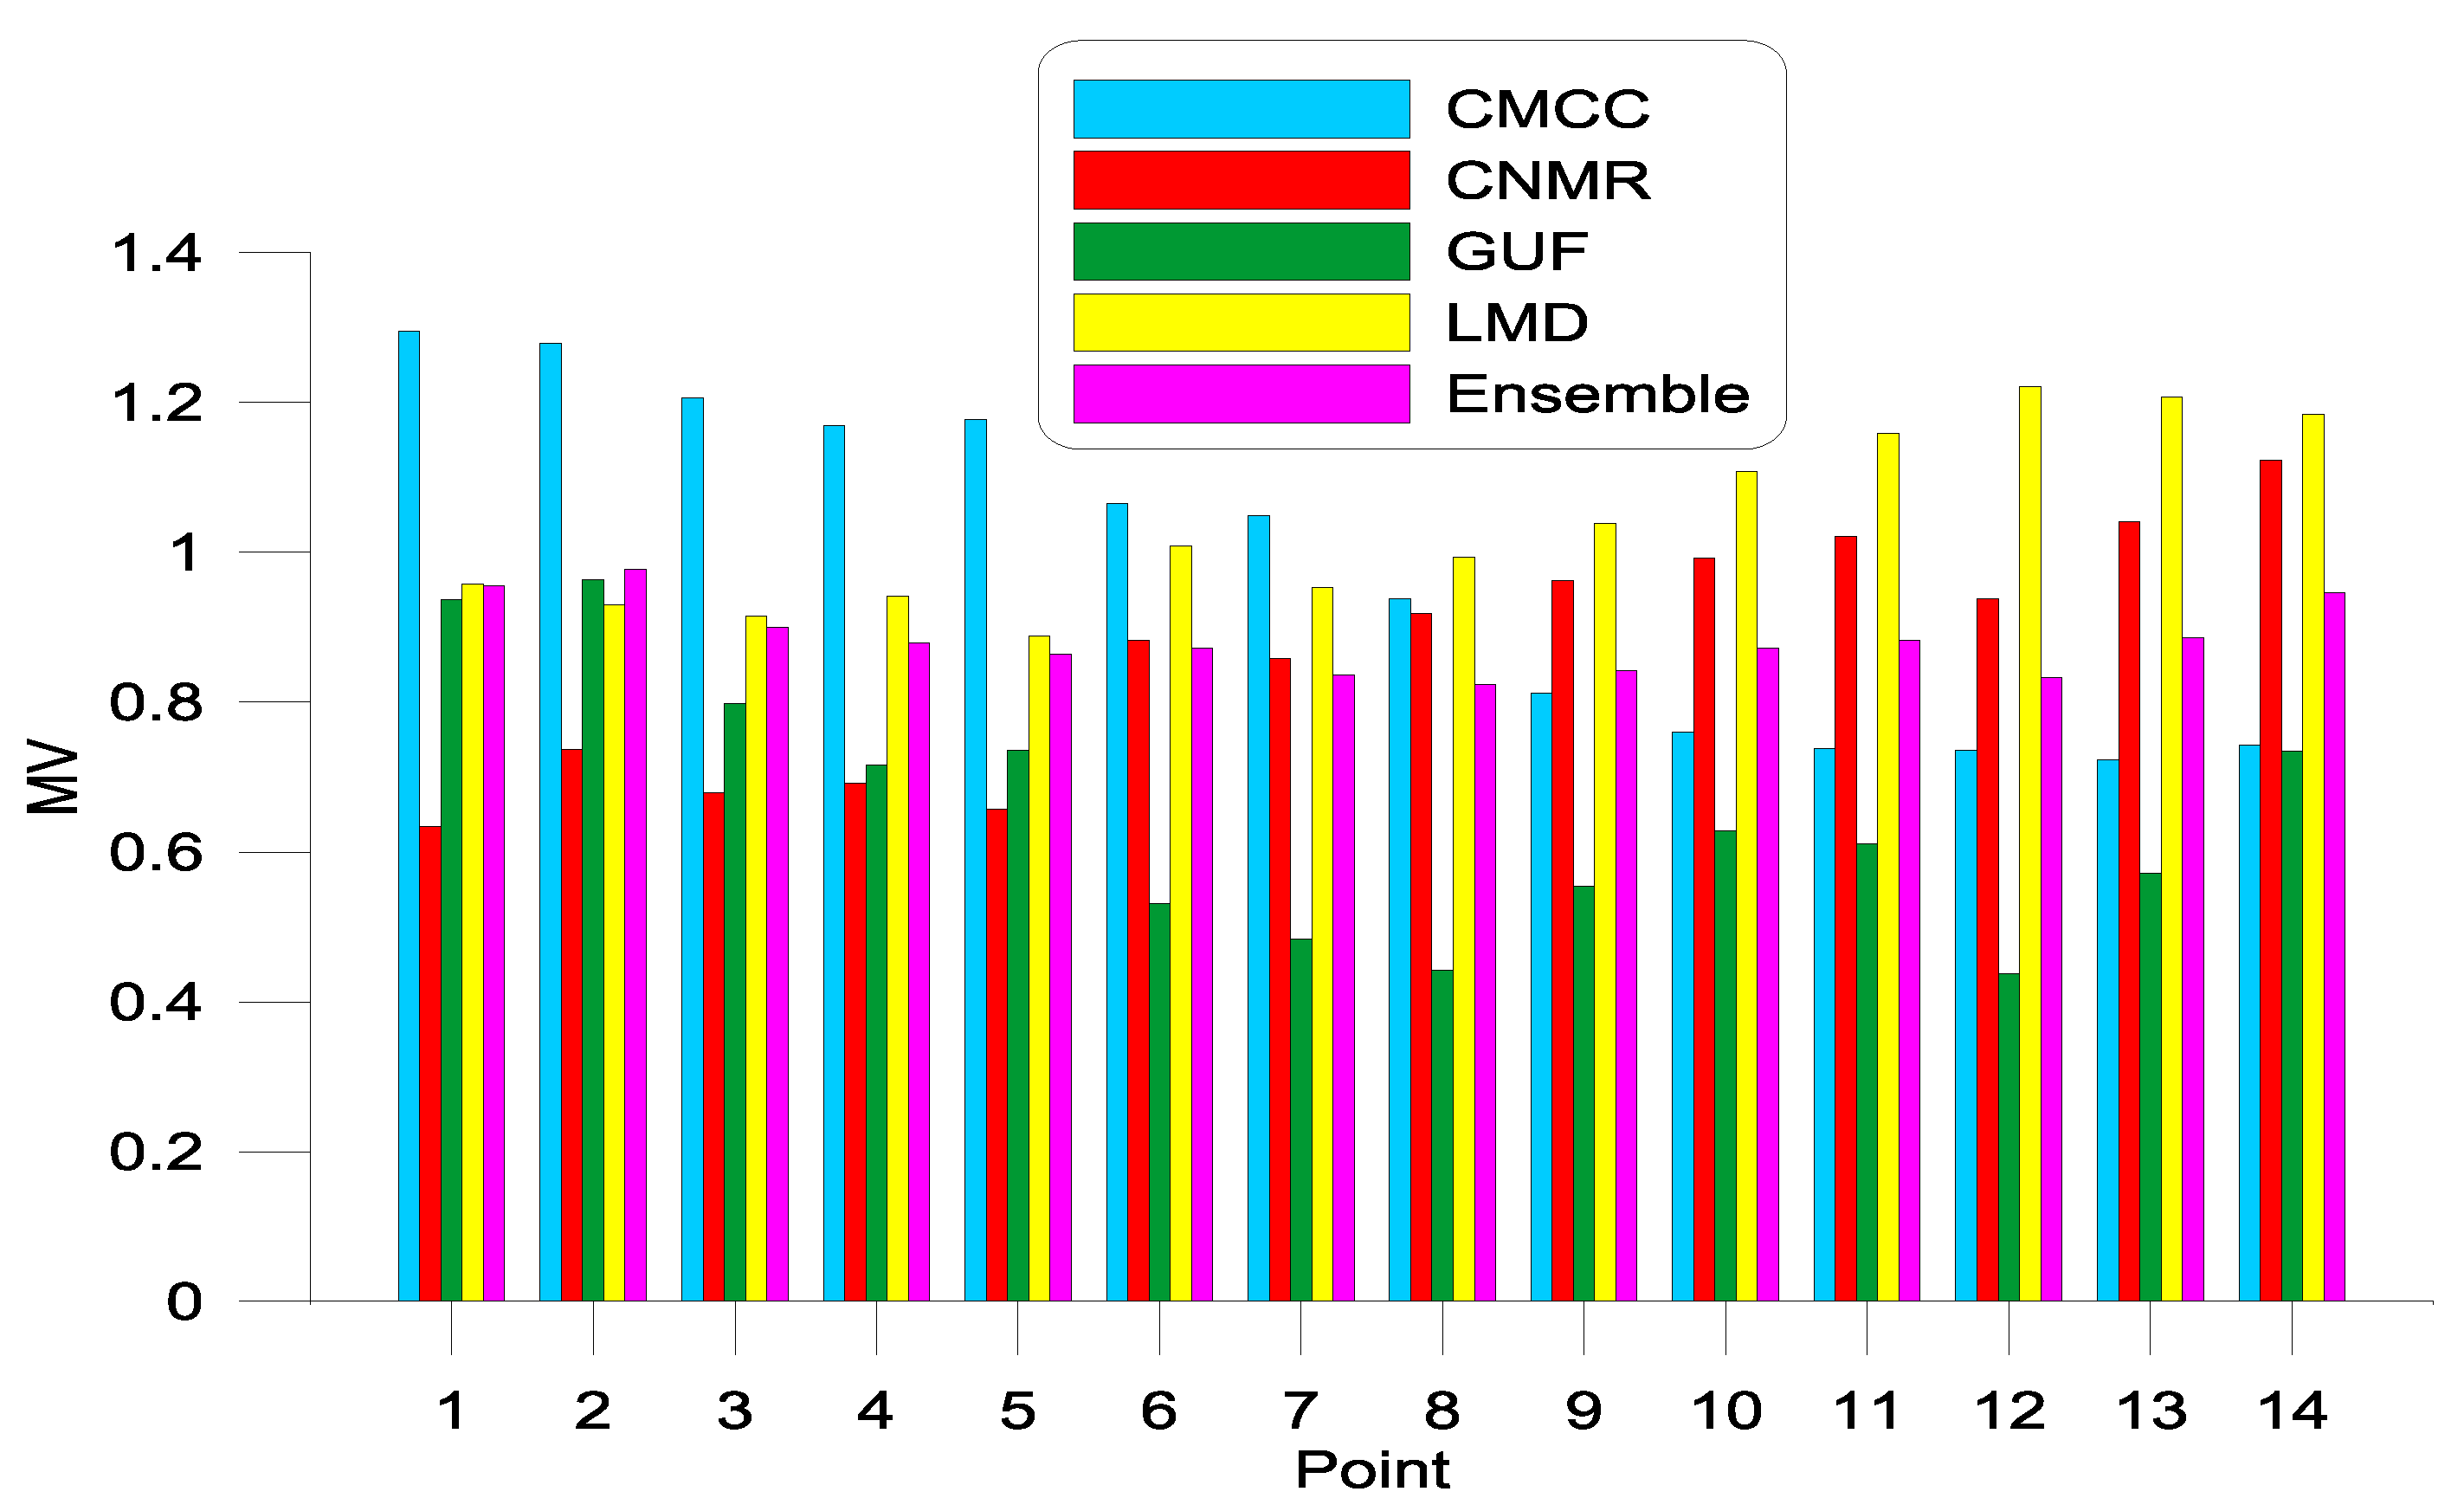
The more uniform distribution of wave power throughout the year is also observed in Figure 6 and Figure 7, in which the coefficients MV and SV that measure the monthly and seasonal power variability are shown. Although there are differences among the four models, most of the values of MV (Figure 6) are smaller than one, except for the CMCC model in the western part of the study area and the LMD and CNMR models in the easternmost stretch. The values of the ensemble are also smaller than one at all locations, indicating that the monthly variability of the wave power in this area is relatively moderate under present conditions. This is beneficial for the potential deployment of WECs, since their energy output would be more regular throughout the year, as confirmed also by the SV values (Figure 7) that are smaller than 0.85 for all points and models, and smaller than 0.6 at all points for the intermodel ensemble. Therefore, although the wave power potential of this area is relatively modest, its small temporal variability due to its uniform monthly and seasonal distribution favors its consideration for wave power harvesting.

4. Climate Change Effects on Wave Power

4.1. Wave Parameters

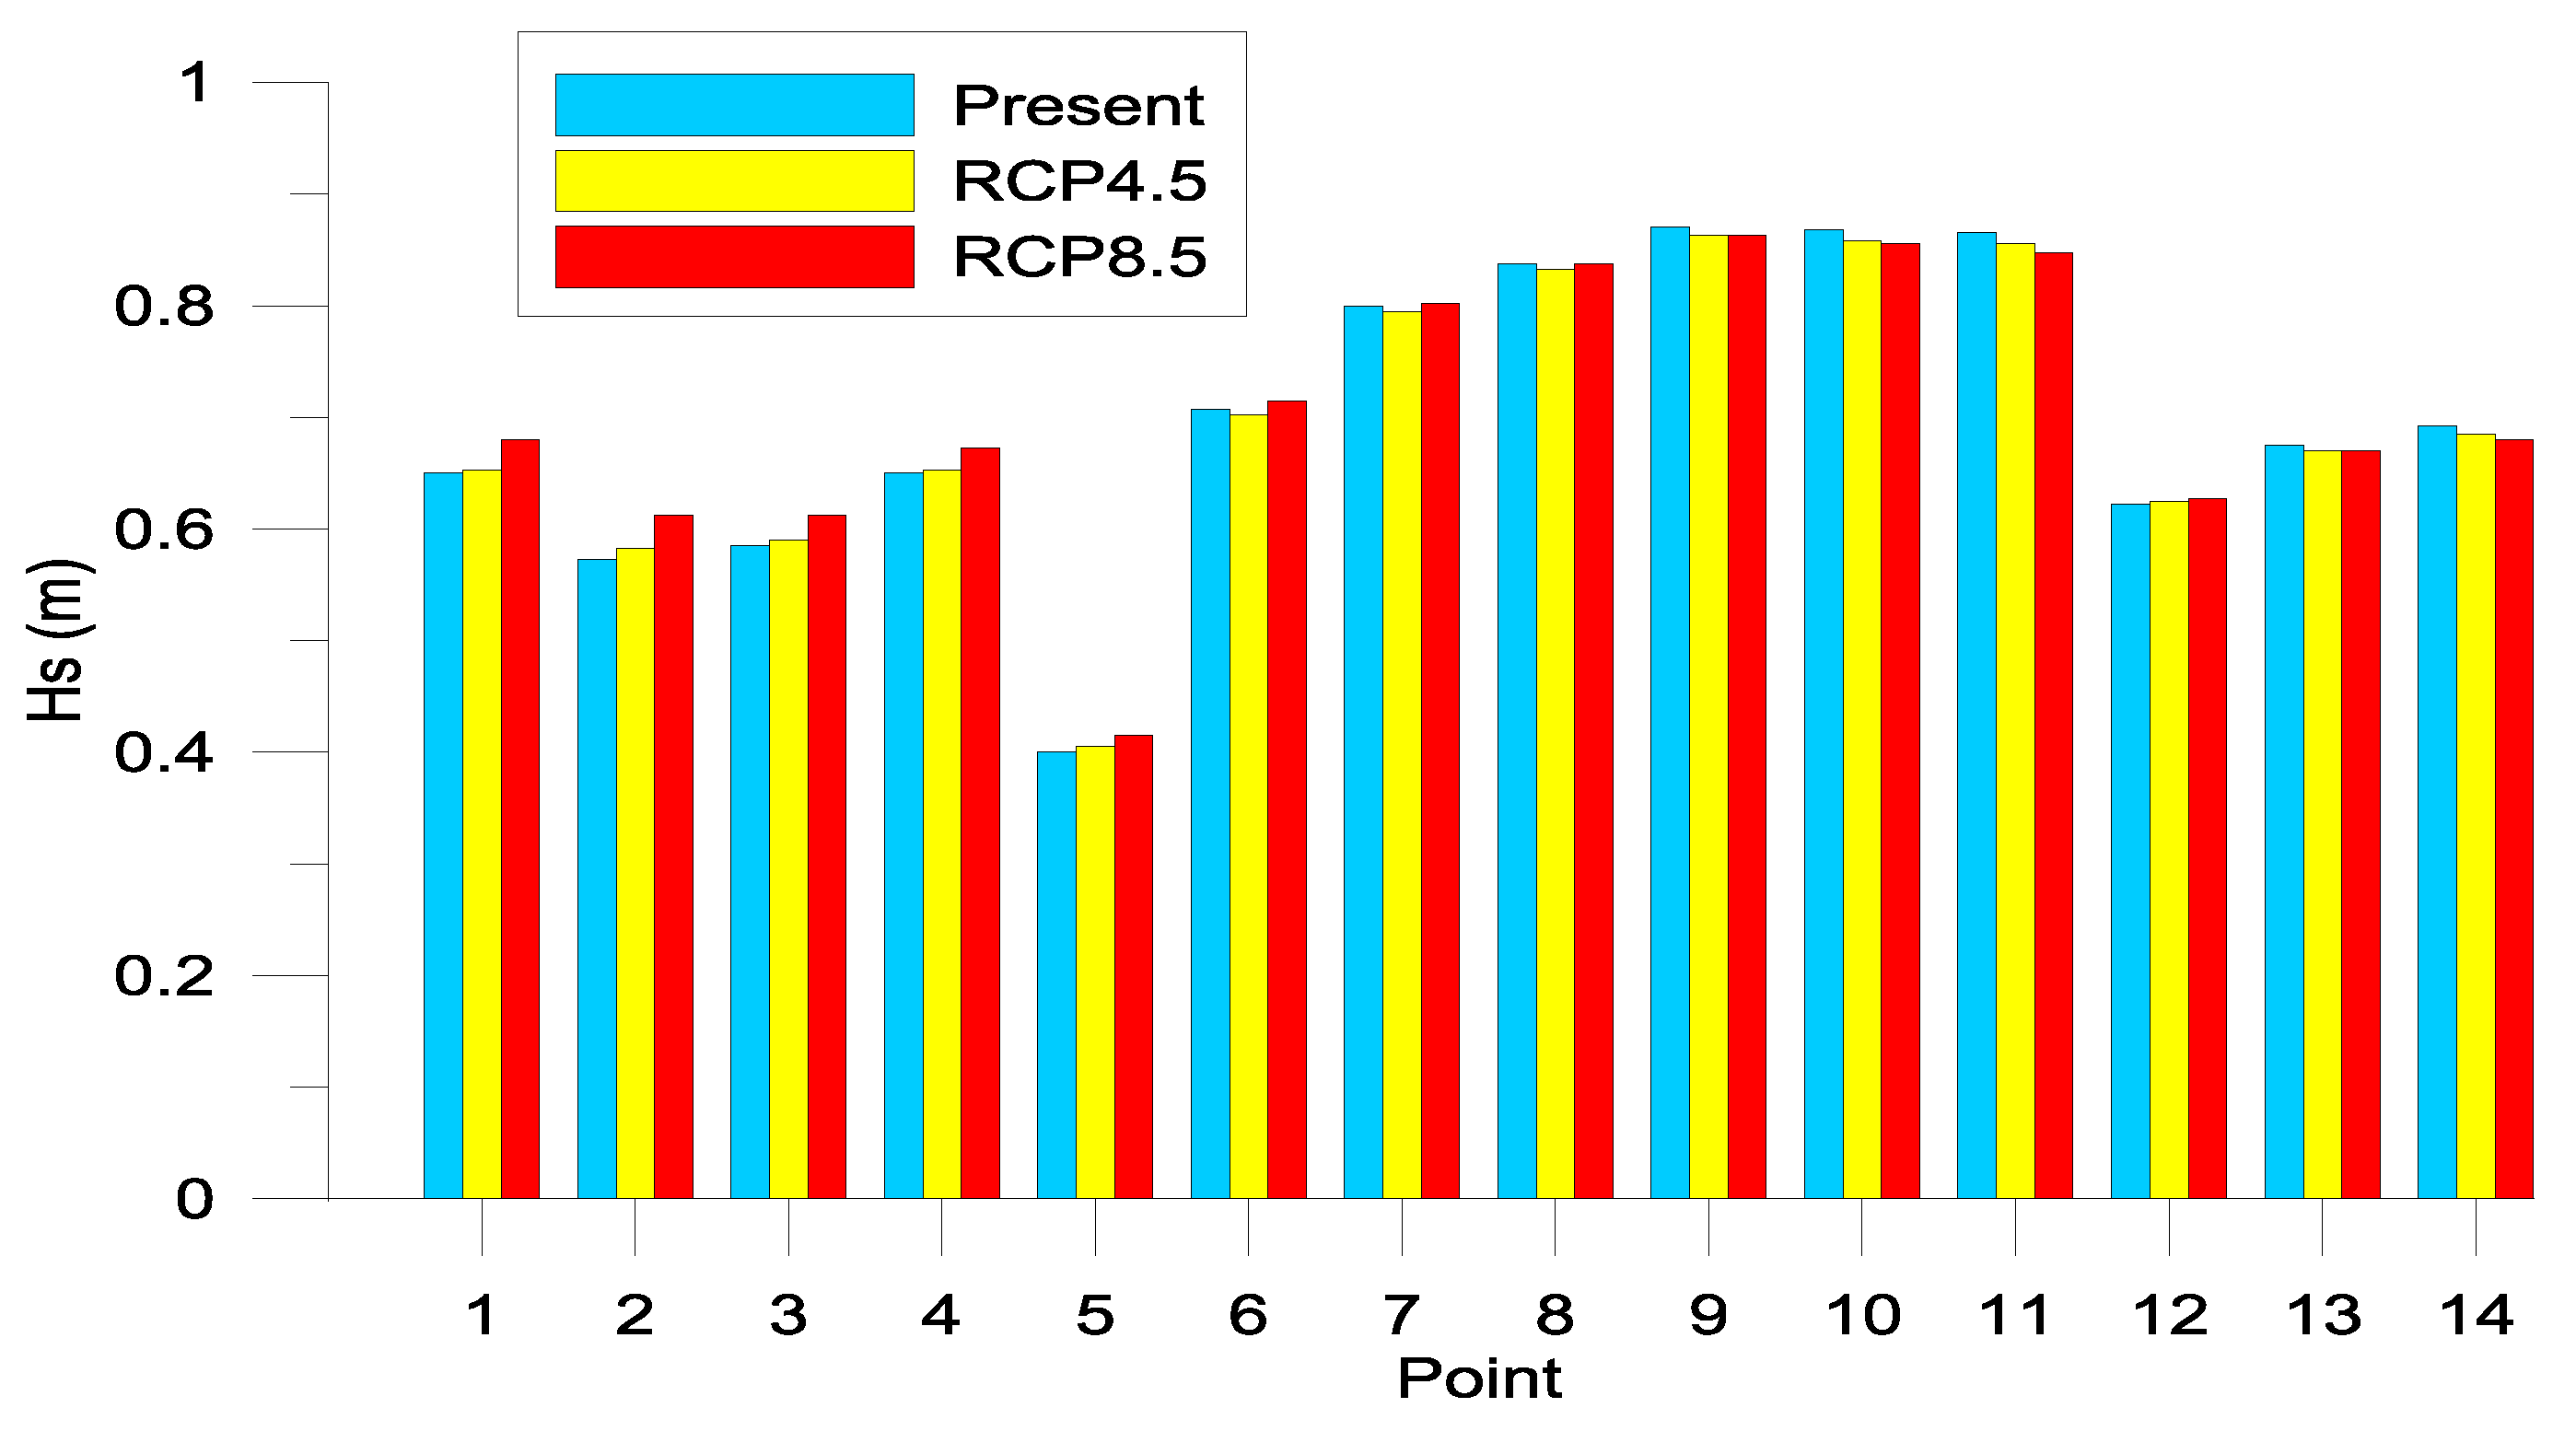
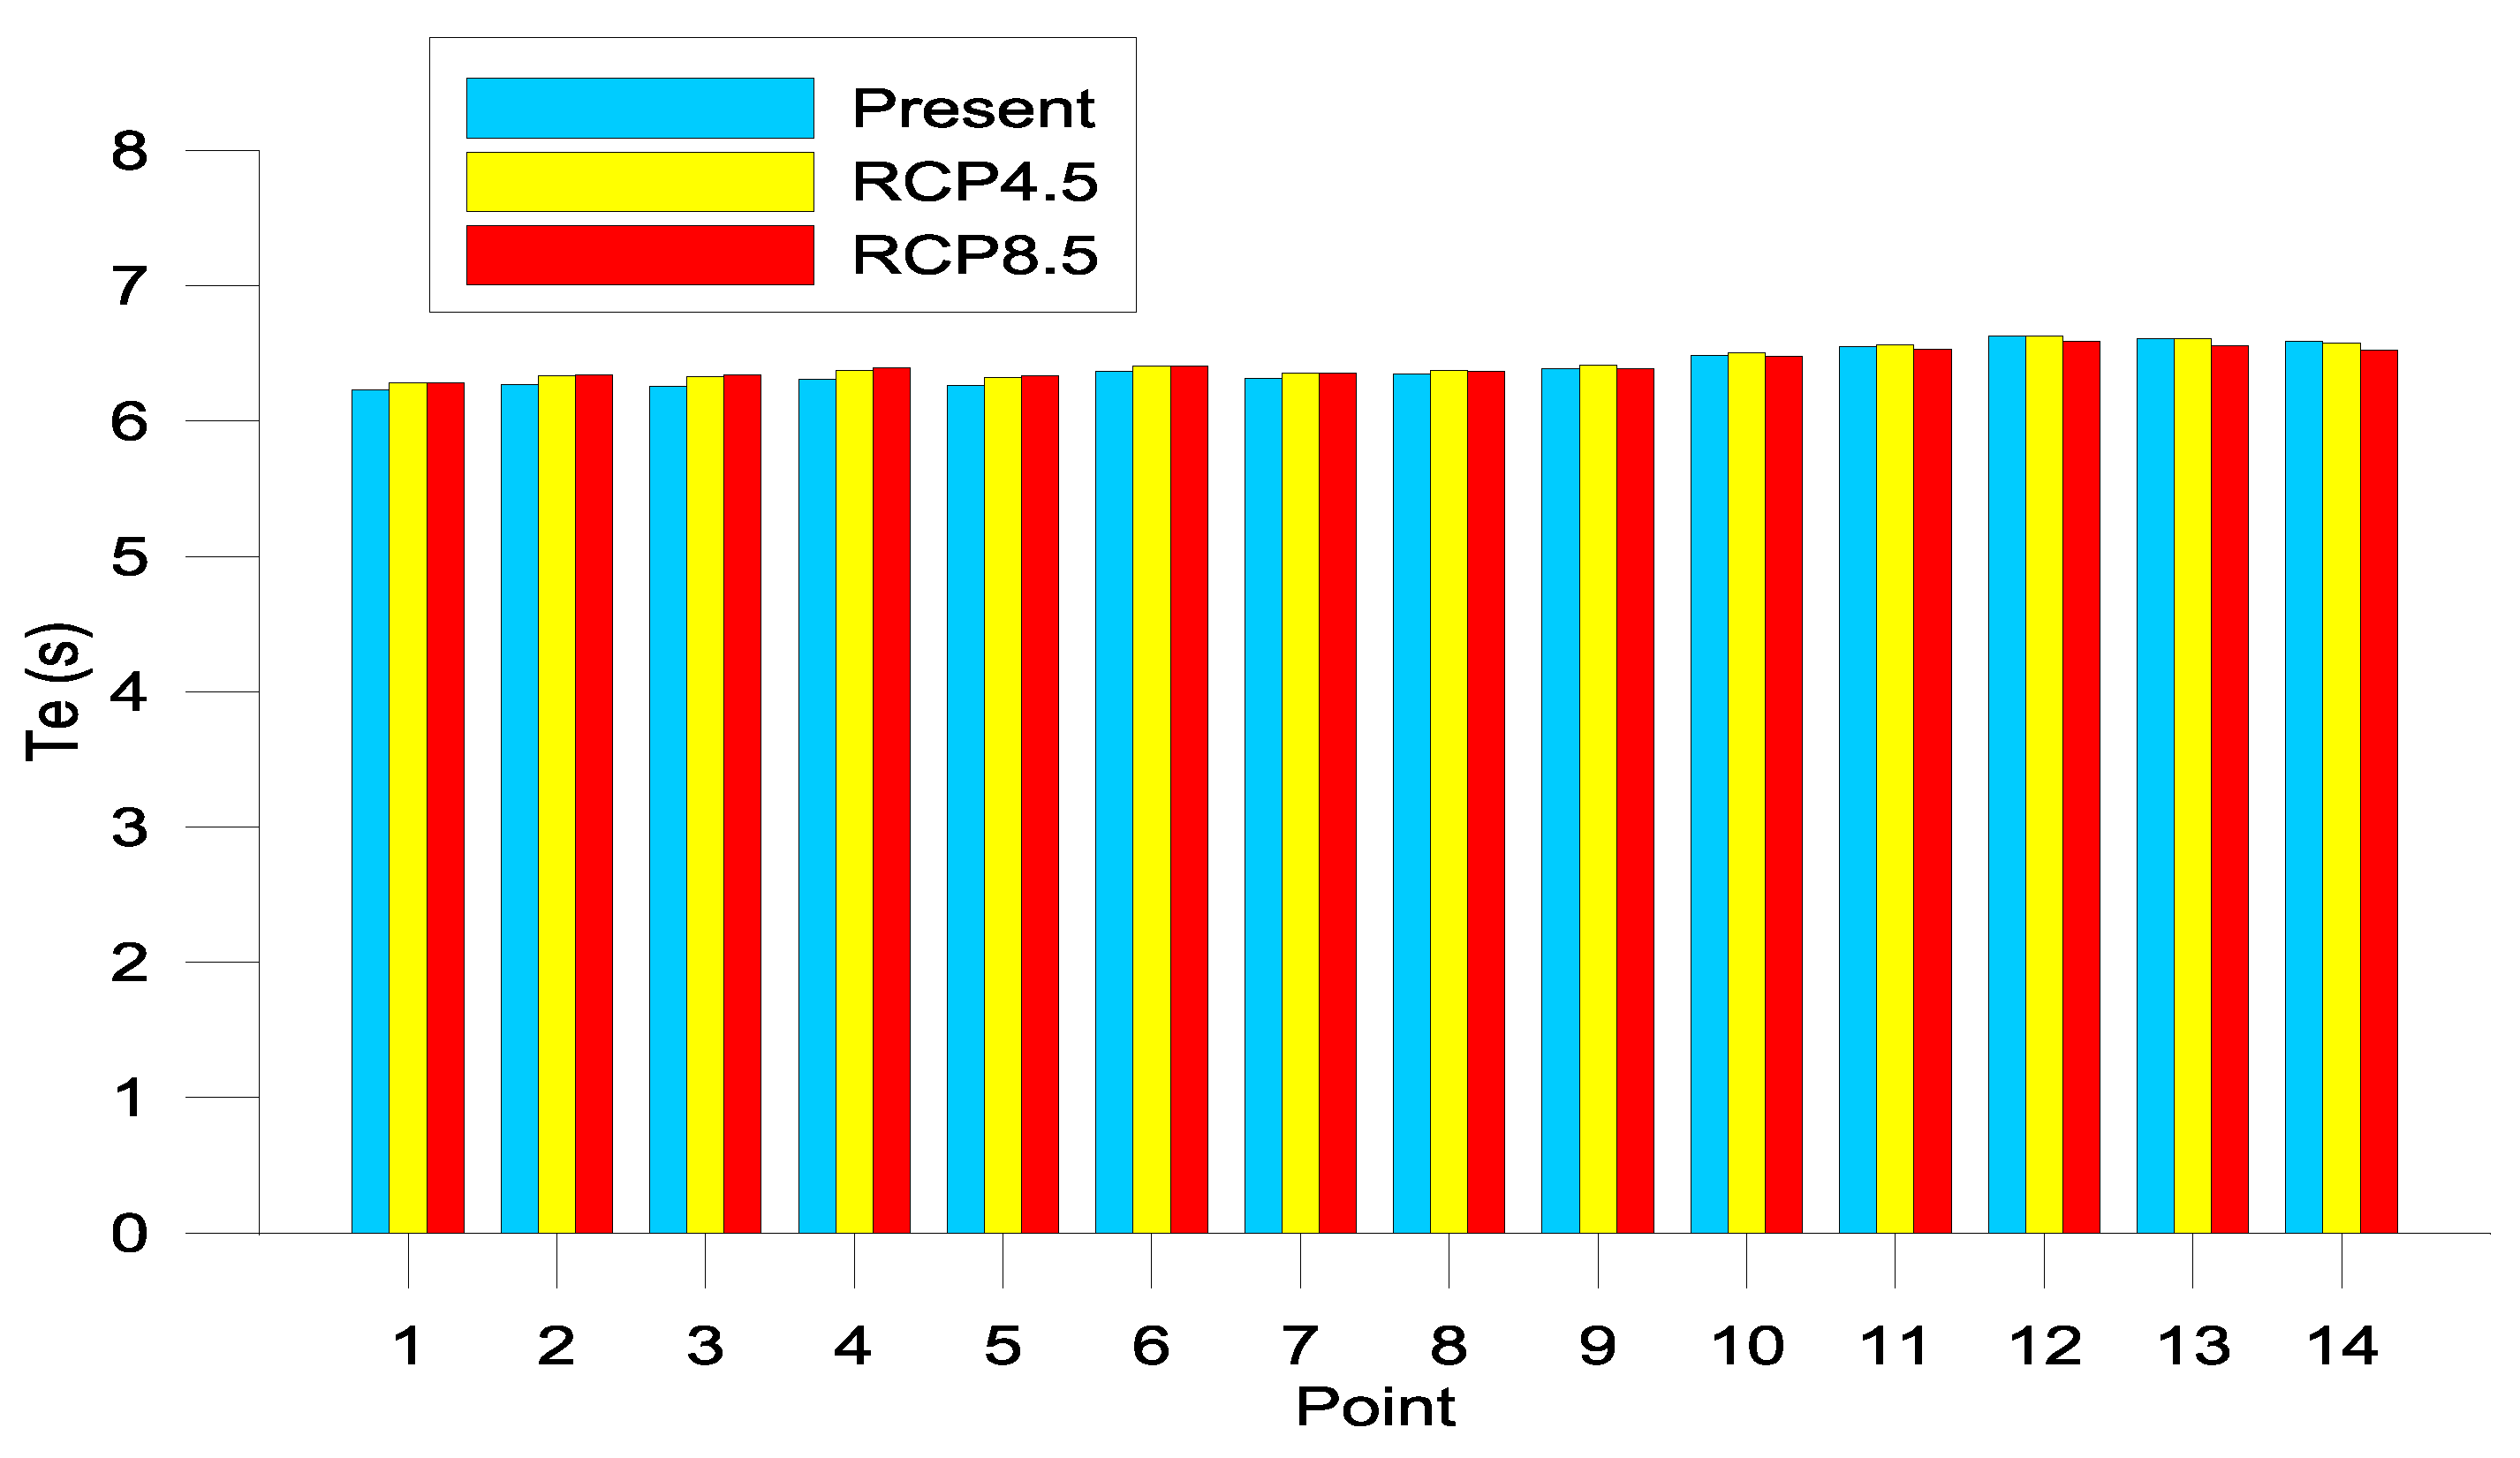
Figure 8 and Figure 9 compare respectively the multimodel ensemble mean significant wave heights (Hs) and mean energy periods (Te) under present conditions and both future scenarios (RCP4.5 and RCP8.5). In the case of Hs (Figure 8), scenario RCP4.5 shows slight variations (between −1.2% and 1.7%) with increases being located in the western part of the study area. In the case of scenario RCP8.5, the model ensemble projects greater variations of the average Hs, with increases (between 0.3% and 7%) also in the western part of the studied domain and decreases (between 0.9% and 2%) in the eastern part.
In the case of Te (Figure 9), the projected future average values are very similar to those of the present conditions. Thus, in scenario RCP4.5, these periods vary between −0.2% and 1.2%, and in scenario RCP8.5, between −1% and 1.4%. Taking into account the results shown in Figure 8 and Figure 9, it is evident that future modifications in wave power will be mainly due to changes in wave height rather than wave period.

4.2. Wave Power

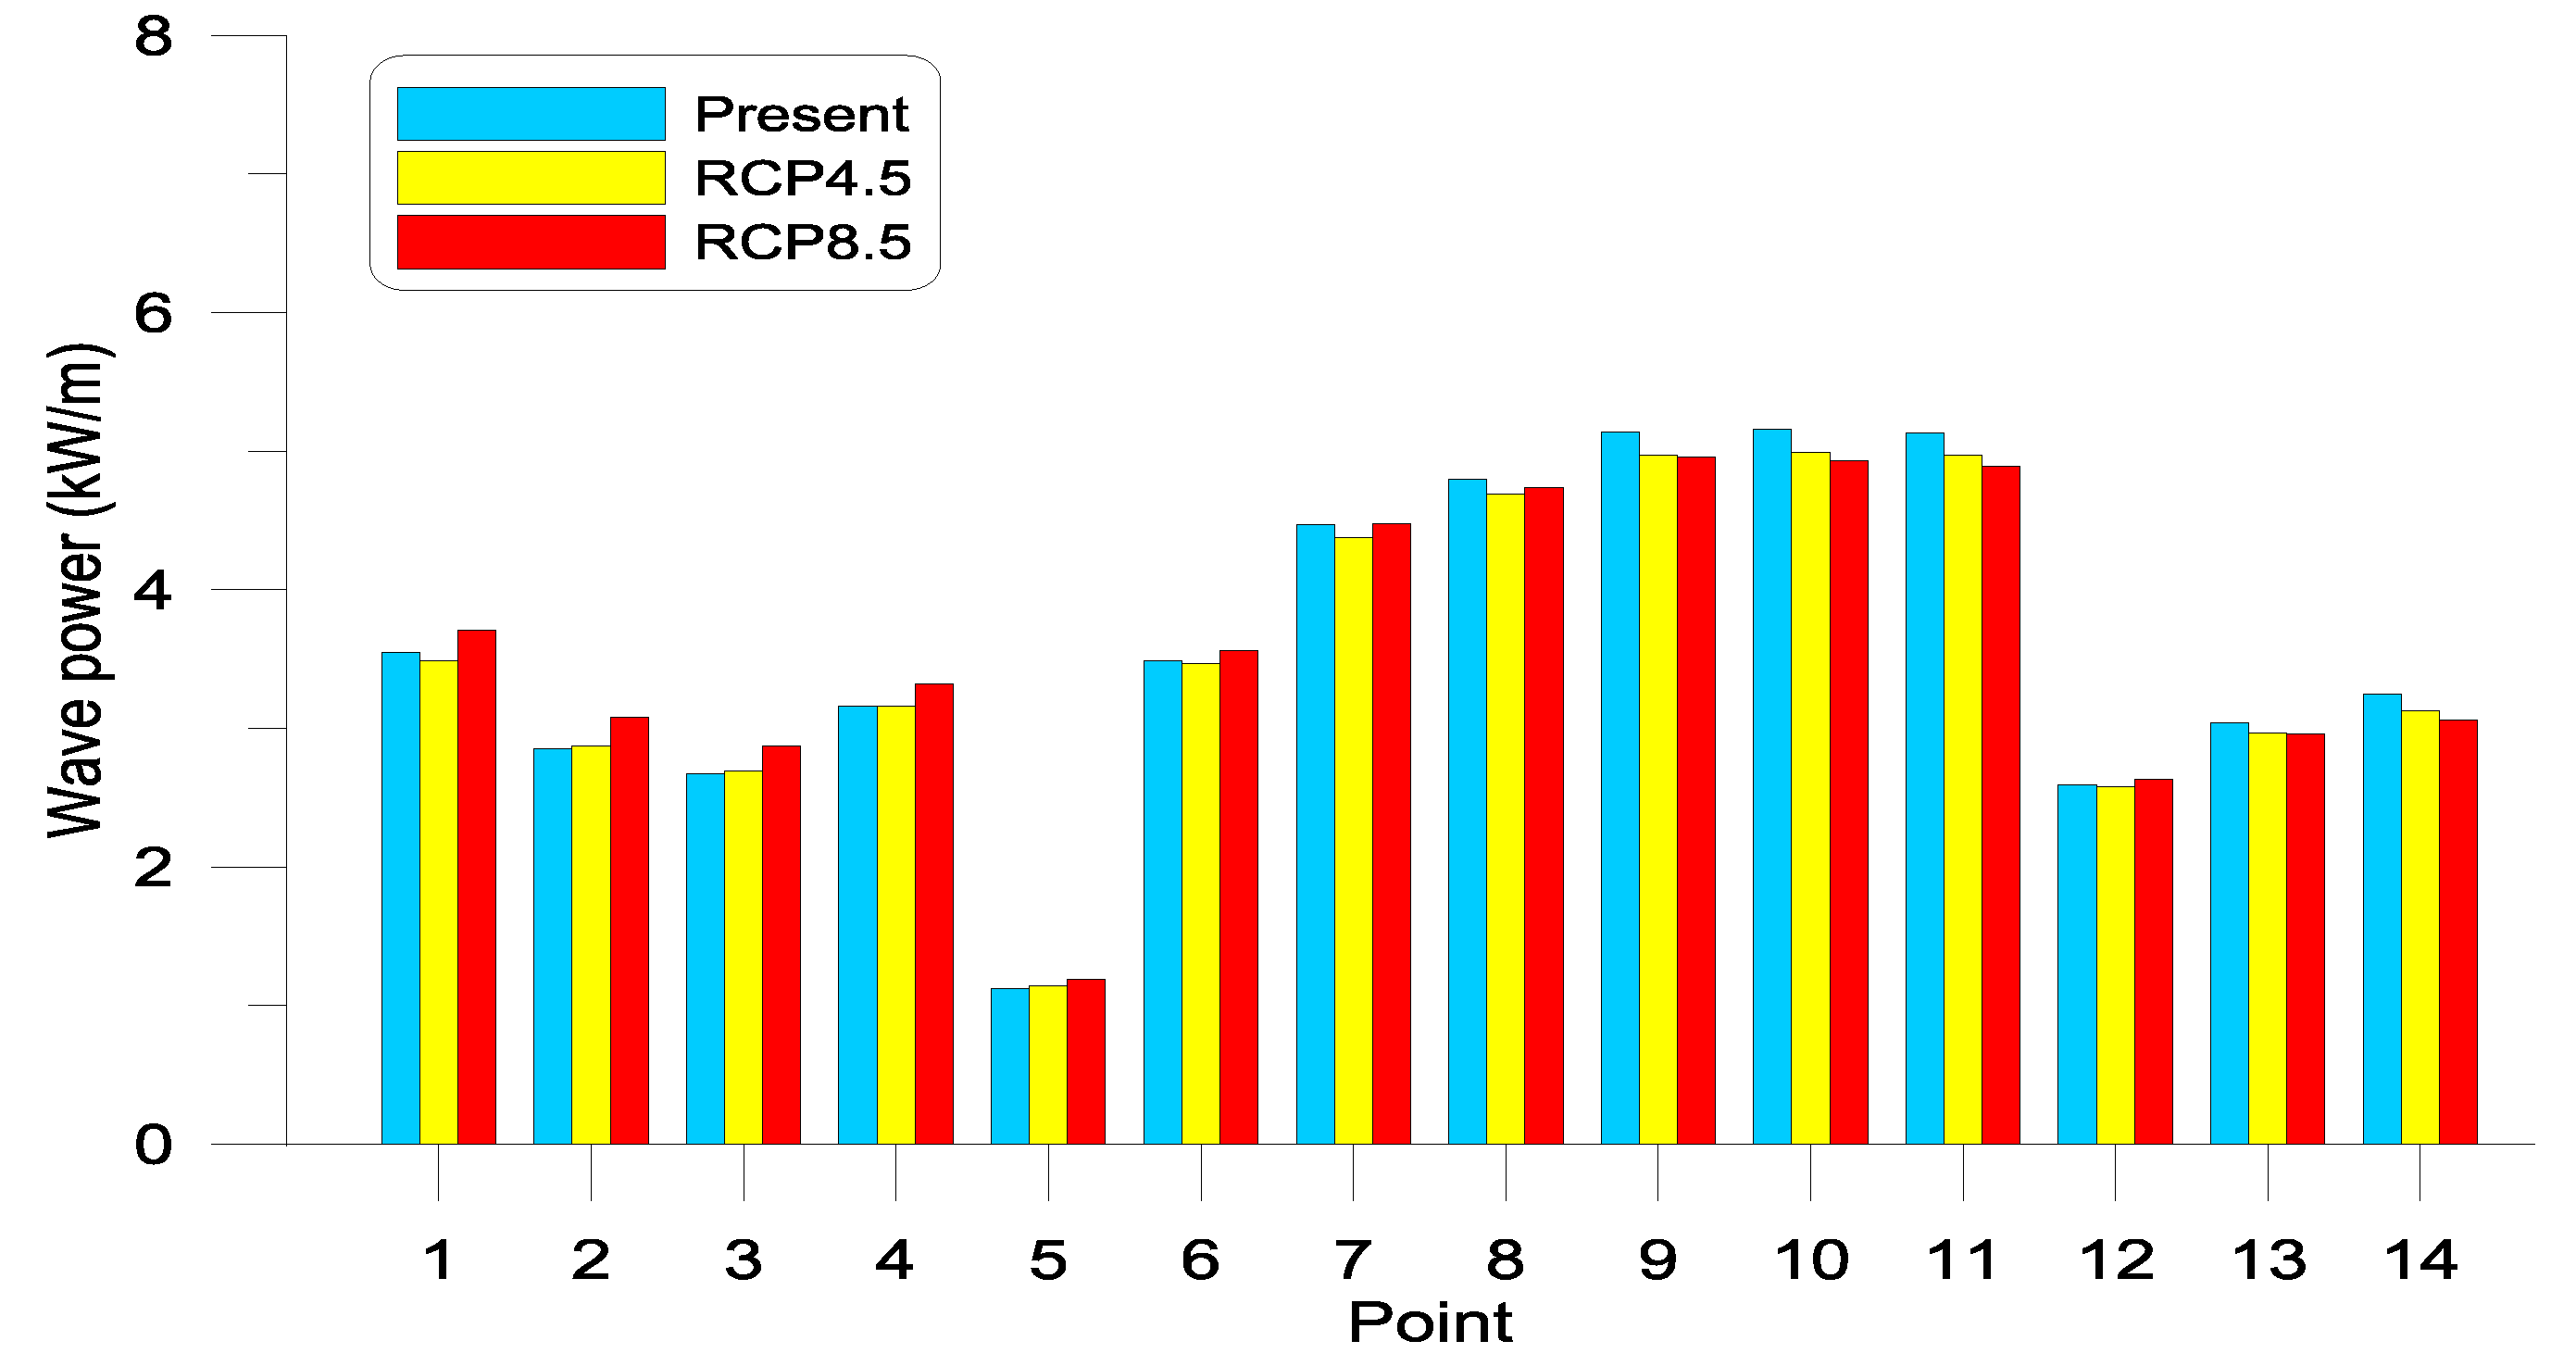
Figure 10 compares the multimodel ensemble wave power under present conditions and both future scenarios (RCP4.5 and RCP8.5), while Table 2 presents the corresponding numerical values and the percentage of variation. This percentage was calculated as the difference between the wave power in future scenarios and at present, and divided by the latter. Positive values reflect future increases of wave power, while negative values indicate future decreases.
As mentioned in the preceding section, present conditions indicate moderate wave energy potential, ranging from 1.12 to 5.16 kW/m, which are similar to values found by other authors in this area. The most energetic zone is concentrated in the central stretch of the study area (points P7 to P11). For future climate conditions, scenario RCP4.5 shows a slight decrease (between −0.4% and −3.9%) of the wave resource at 10 points, particularly in the central and eastern parts of the studied domain. At the other four points (P2 to P5) there is a slight increase of the wave power (between 0.4% and 2%). For the RCP4.5 scenario, the model ensemble projects an average decrease of 1.8% of the present wave power, considering the whole studied area (average of the wave energy at all points).
In the case of scenario RCP8.5, the study area shows two behaviors. In the western part (points P1 to P7) the intermodel ensemble projects an increase of wave power in the future, with variations between 0.3% and 7.9%; on the contrary, in the eastern part, future wave power projections indicate a reduction between 1.2% and 6.1%, except at point P12, where an increase of 1.5% is obtained. The average wave power of the 14 points for this scenario gives practically the same value as the average wave power of the 14 points for present conditions (with a difference of −0.1%).
Although the mean wave power projected under present conditions (3.60 kW/m) and both future scenarios (3.54 kW/m for RCP4.5 and 3.59 kW/m for RCP8.5) is relatively modest, if all the wave power could be harvested in the entire Mediterranean coast of Morocco, this would entail a total available power of 1944 MW under present conditions, 1911 MV in scenario RCP4.5 and 1938 MW in scenario RCP8.5.
Concerning the directional distribution of the wave power, model results do not show significant changes in the future scenarios; for this reason the results are not plotted.

4.3. Temporal Variability

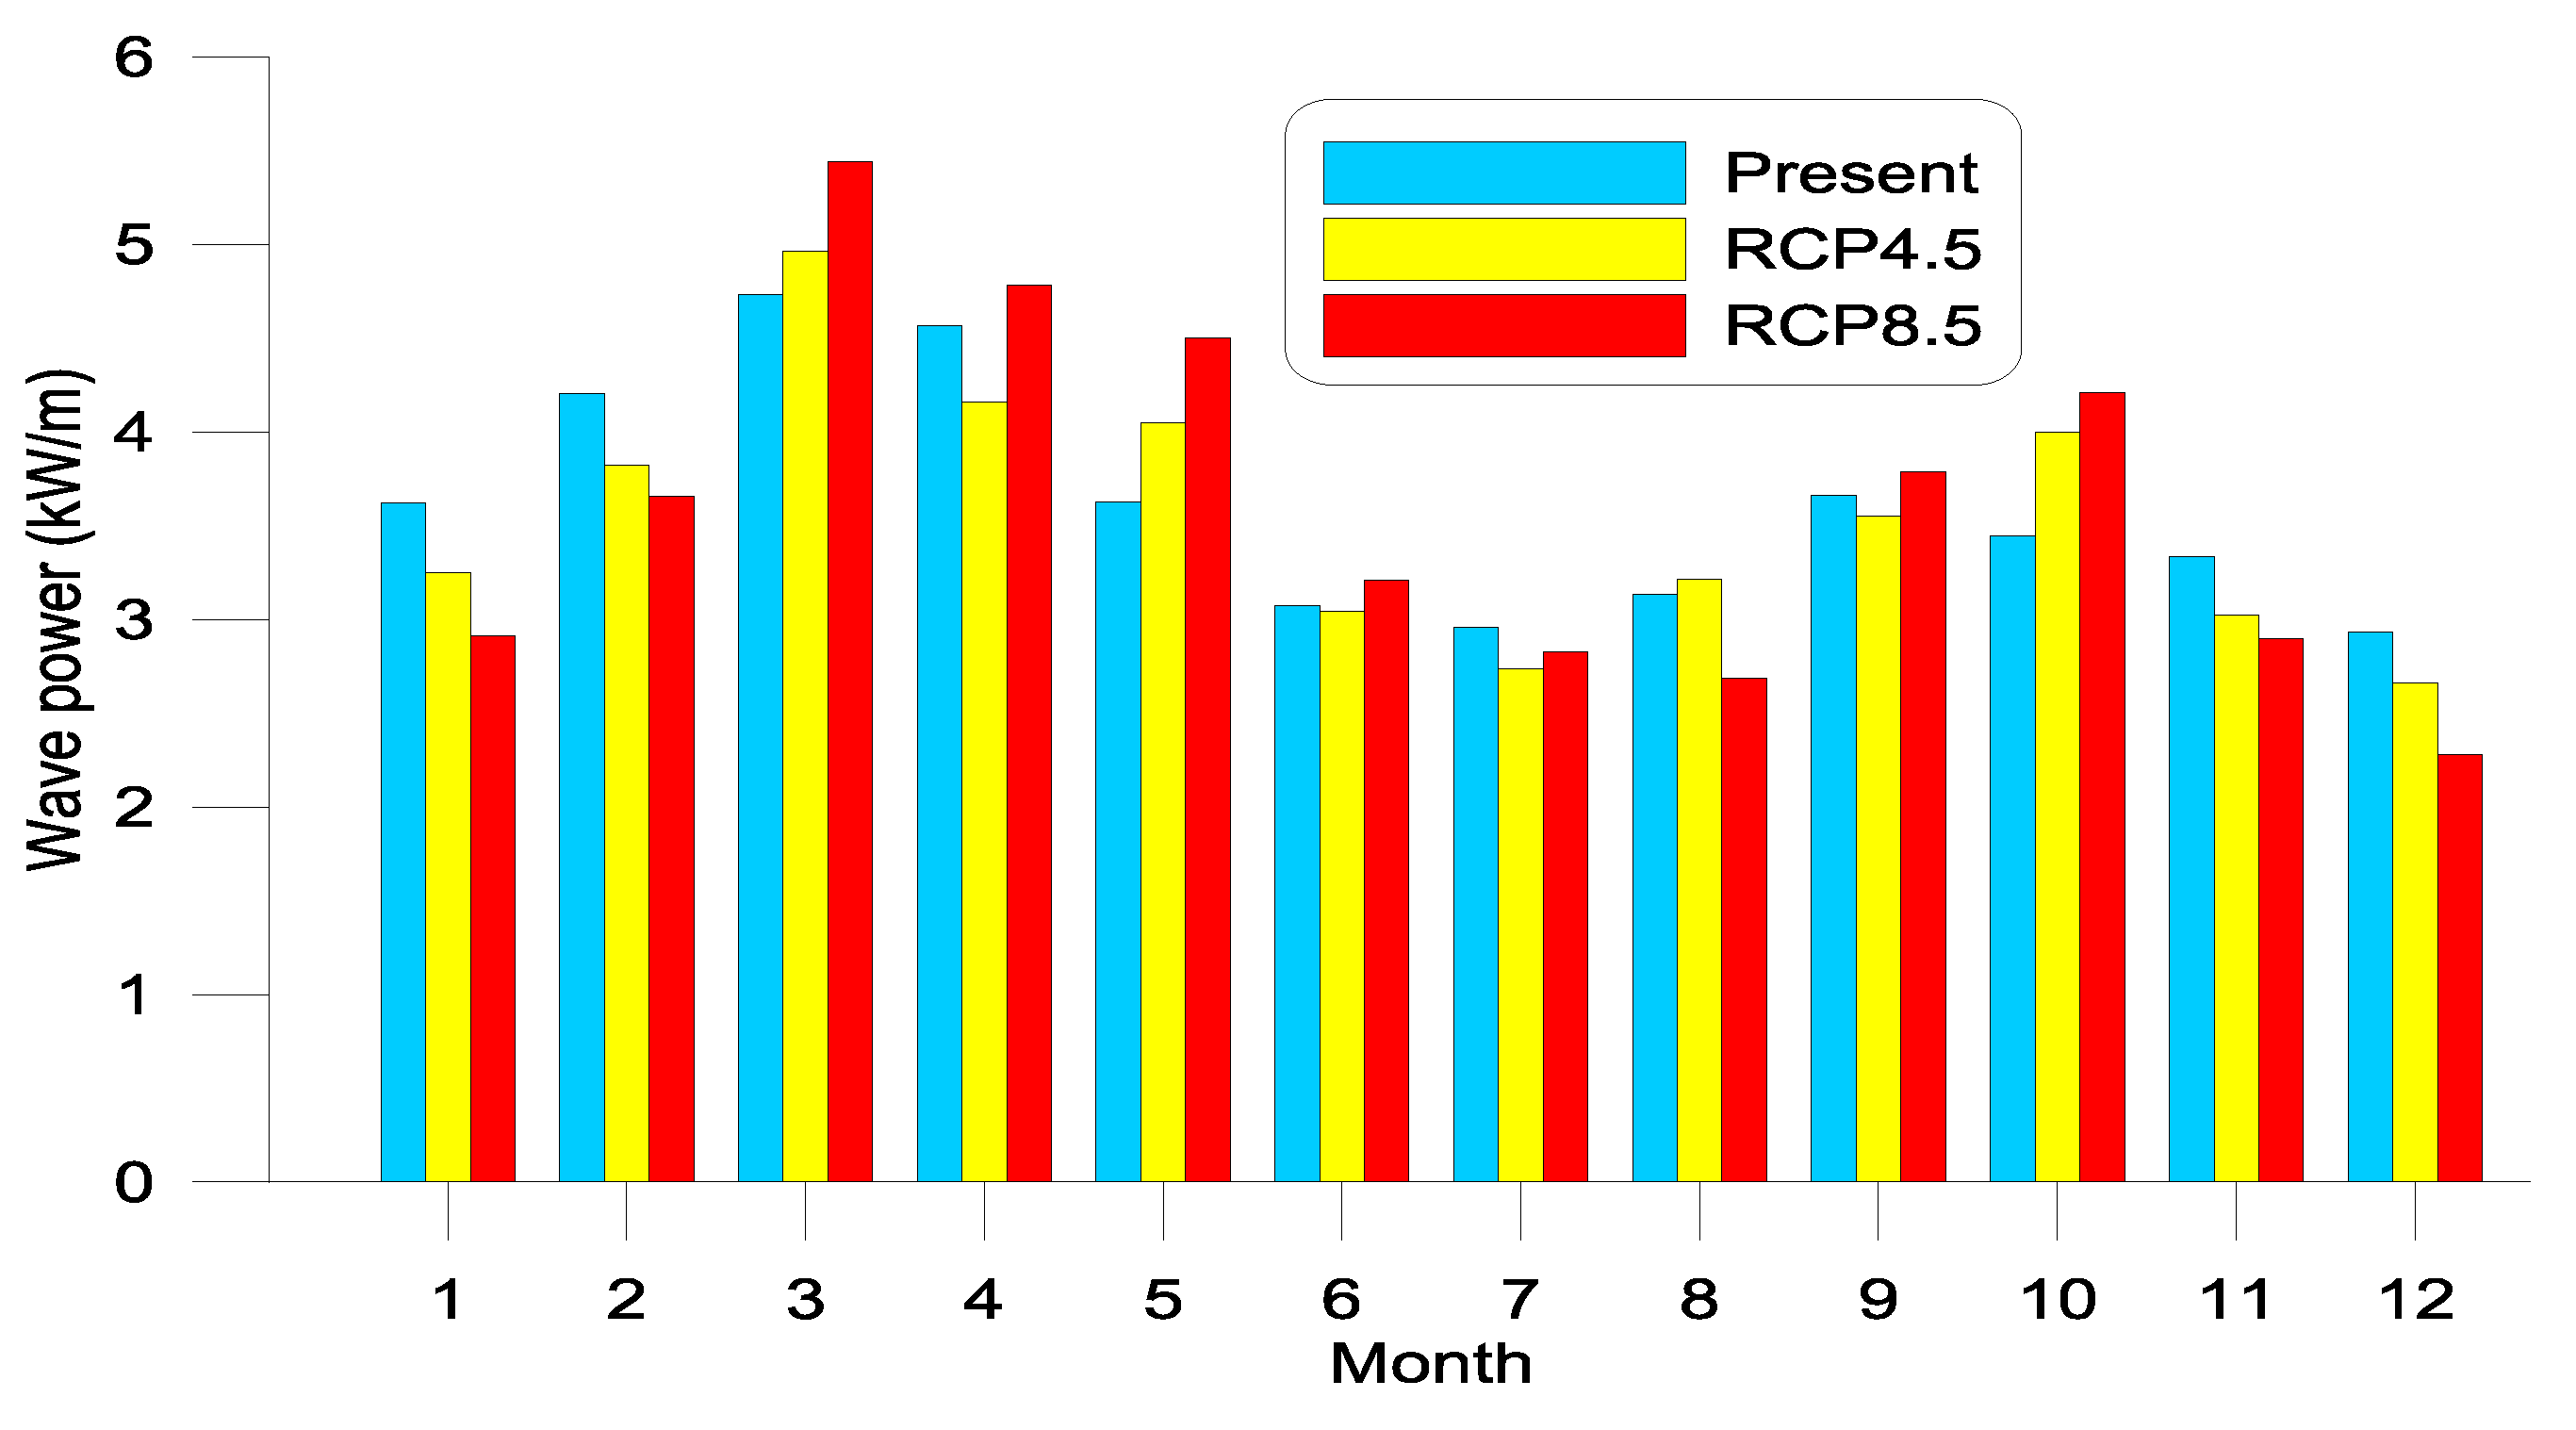
The evolution of the temporal variability in future scenarios with respect to the present situation is plotted in Figure 11 and Figure 12, where the mean wave power (intermodel ensemble and averaged over all the points) for each month and season is presented. In addition, in Table 3 and Table 4, this monthly and seasonal variation of the wave power is summarized, indicating the magnitude of the changes.
For scenario RCP4.5, the monthly wave power in the study area (Figure 11 and Table 3) is between 1% and 10.3% smaller for eight out of twelve months, while it increases between 2.5% and 16% for March, May, August and October. For scenario RCP8.5, the changes of the monthly wave power are generally greater, with larger wave power during six months and smaller power during the other six. There is a noticeable decrease of wave power for all winter months (between −13% and −22.3%), November (−13.1%) and part of the summer (July and August, between −4.3% to −14.3%), whereas the monthly wave power increases from March to June (between 4.5% and 24%), September (3.4%) and October (22.1%).
Analyzing the seasonal changes (Figure 12 and Table 4), for the RCP4.5 scenario the multiensemble average shows a slight increase in the spring and autumn wave power (up to 2%), a slight reduction in summer (−1.8%) and a larger decrease in winter (−9.6%). For scenario RCP8.5, the changes follow the same pattern but are clearly magnified, with values that are around twice those for the RCP4.5 scenario, except for spring, when the variation in wave power rises from +2% to +14%. The significant decrease forecasted for winter is consistent with the projections of other studies [59,73].
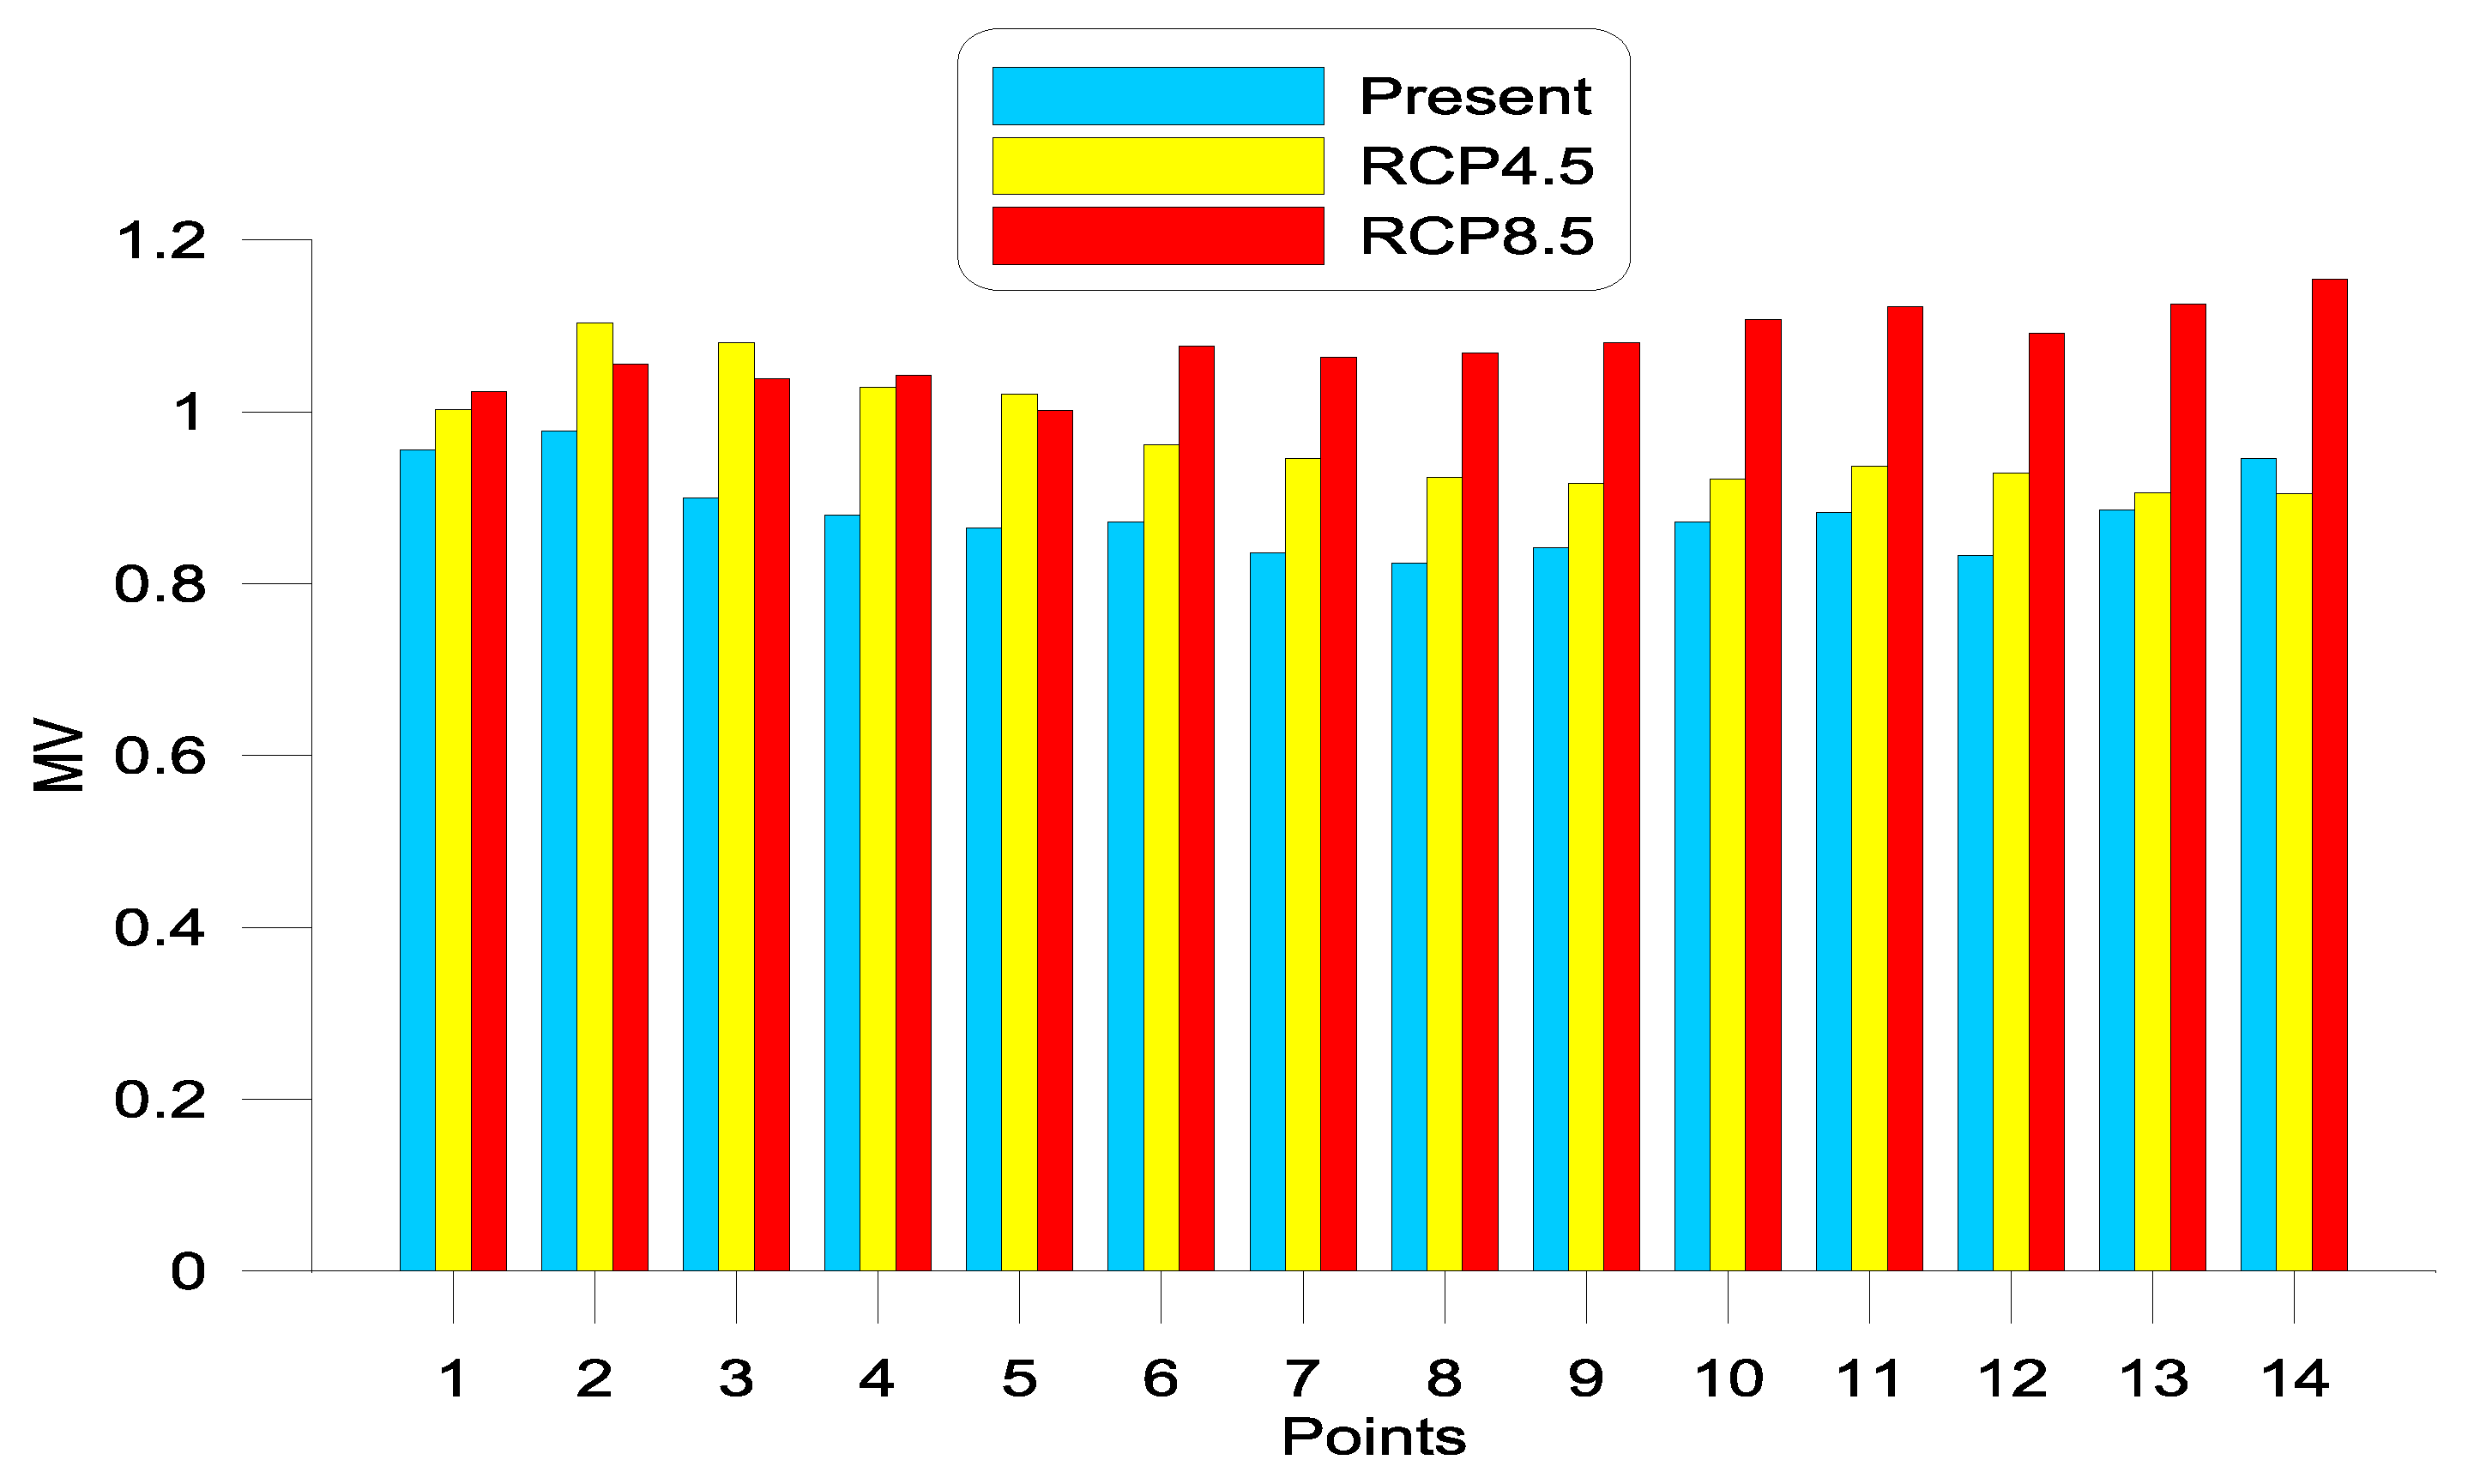
These changes in the distribution of wave energy by months and seasons are transferred to the variability coefficients MV and SV, as shown in Figure 13 and Figure 14, in which their present and future values for the 14 points are plotted. Figure 13 shows how MV values for the RCP4.5 scenario are greater than those for the present situation, in particular in the western part of the study area (increases between 10% and 20% at points P2 to P8), while in the eastern area the increases are smaller, with even a slight reduction of the MV value at the easternmost point (P14) for this scenario.
On the contrary, for scenario RCP8.5, the increase of MV values is greater than for scenario RCP4.5 (except at points P2, P3 and P5) and, in particular, in the eastern part of the study area. At points P3 to P14, the increase of MV values with respect to the present ones ranges between 15% and 31%. Nevertheless, although this means a significant increase of the monthly variability of wave power, the maximum values of MV are smaller than 1.15, indicating that the monthly variability is moderate, even in the worst scenario.
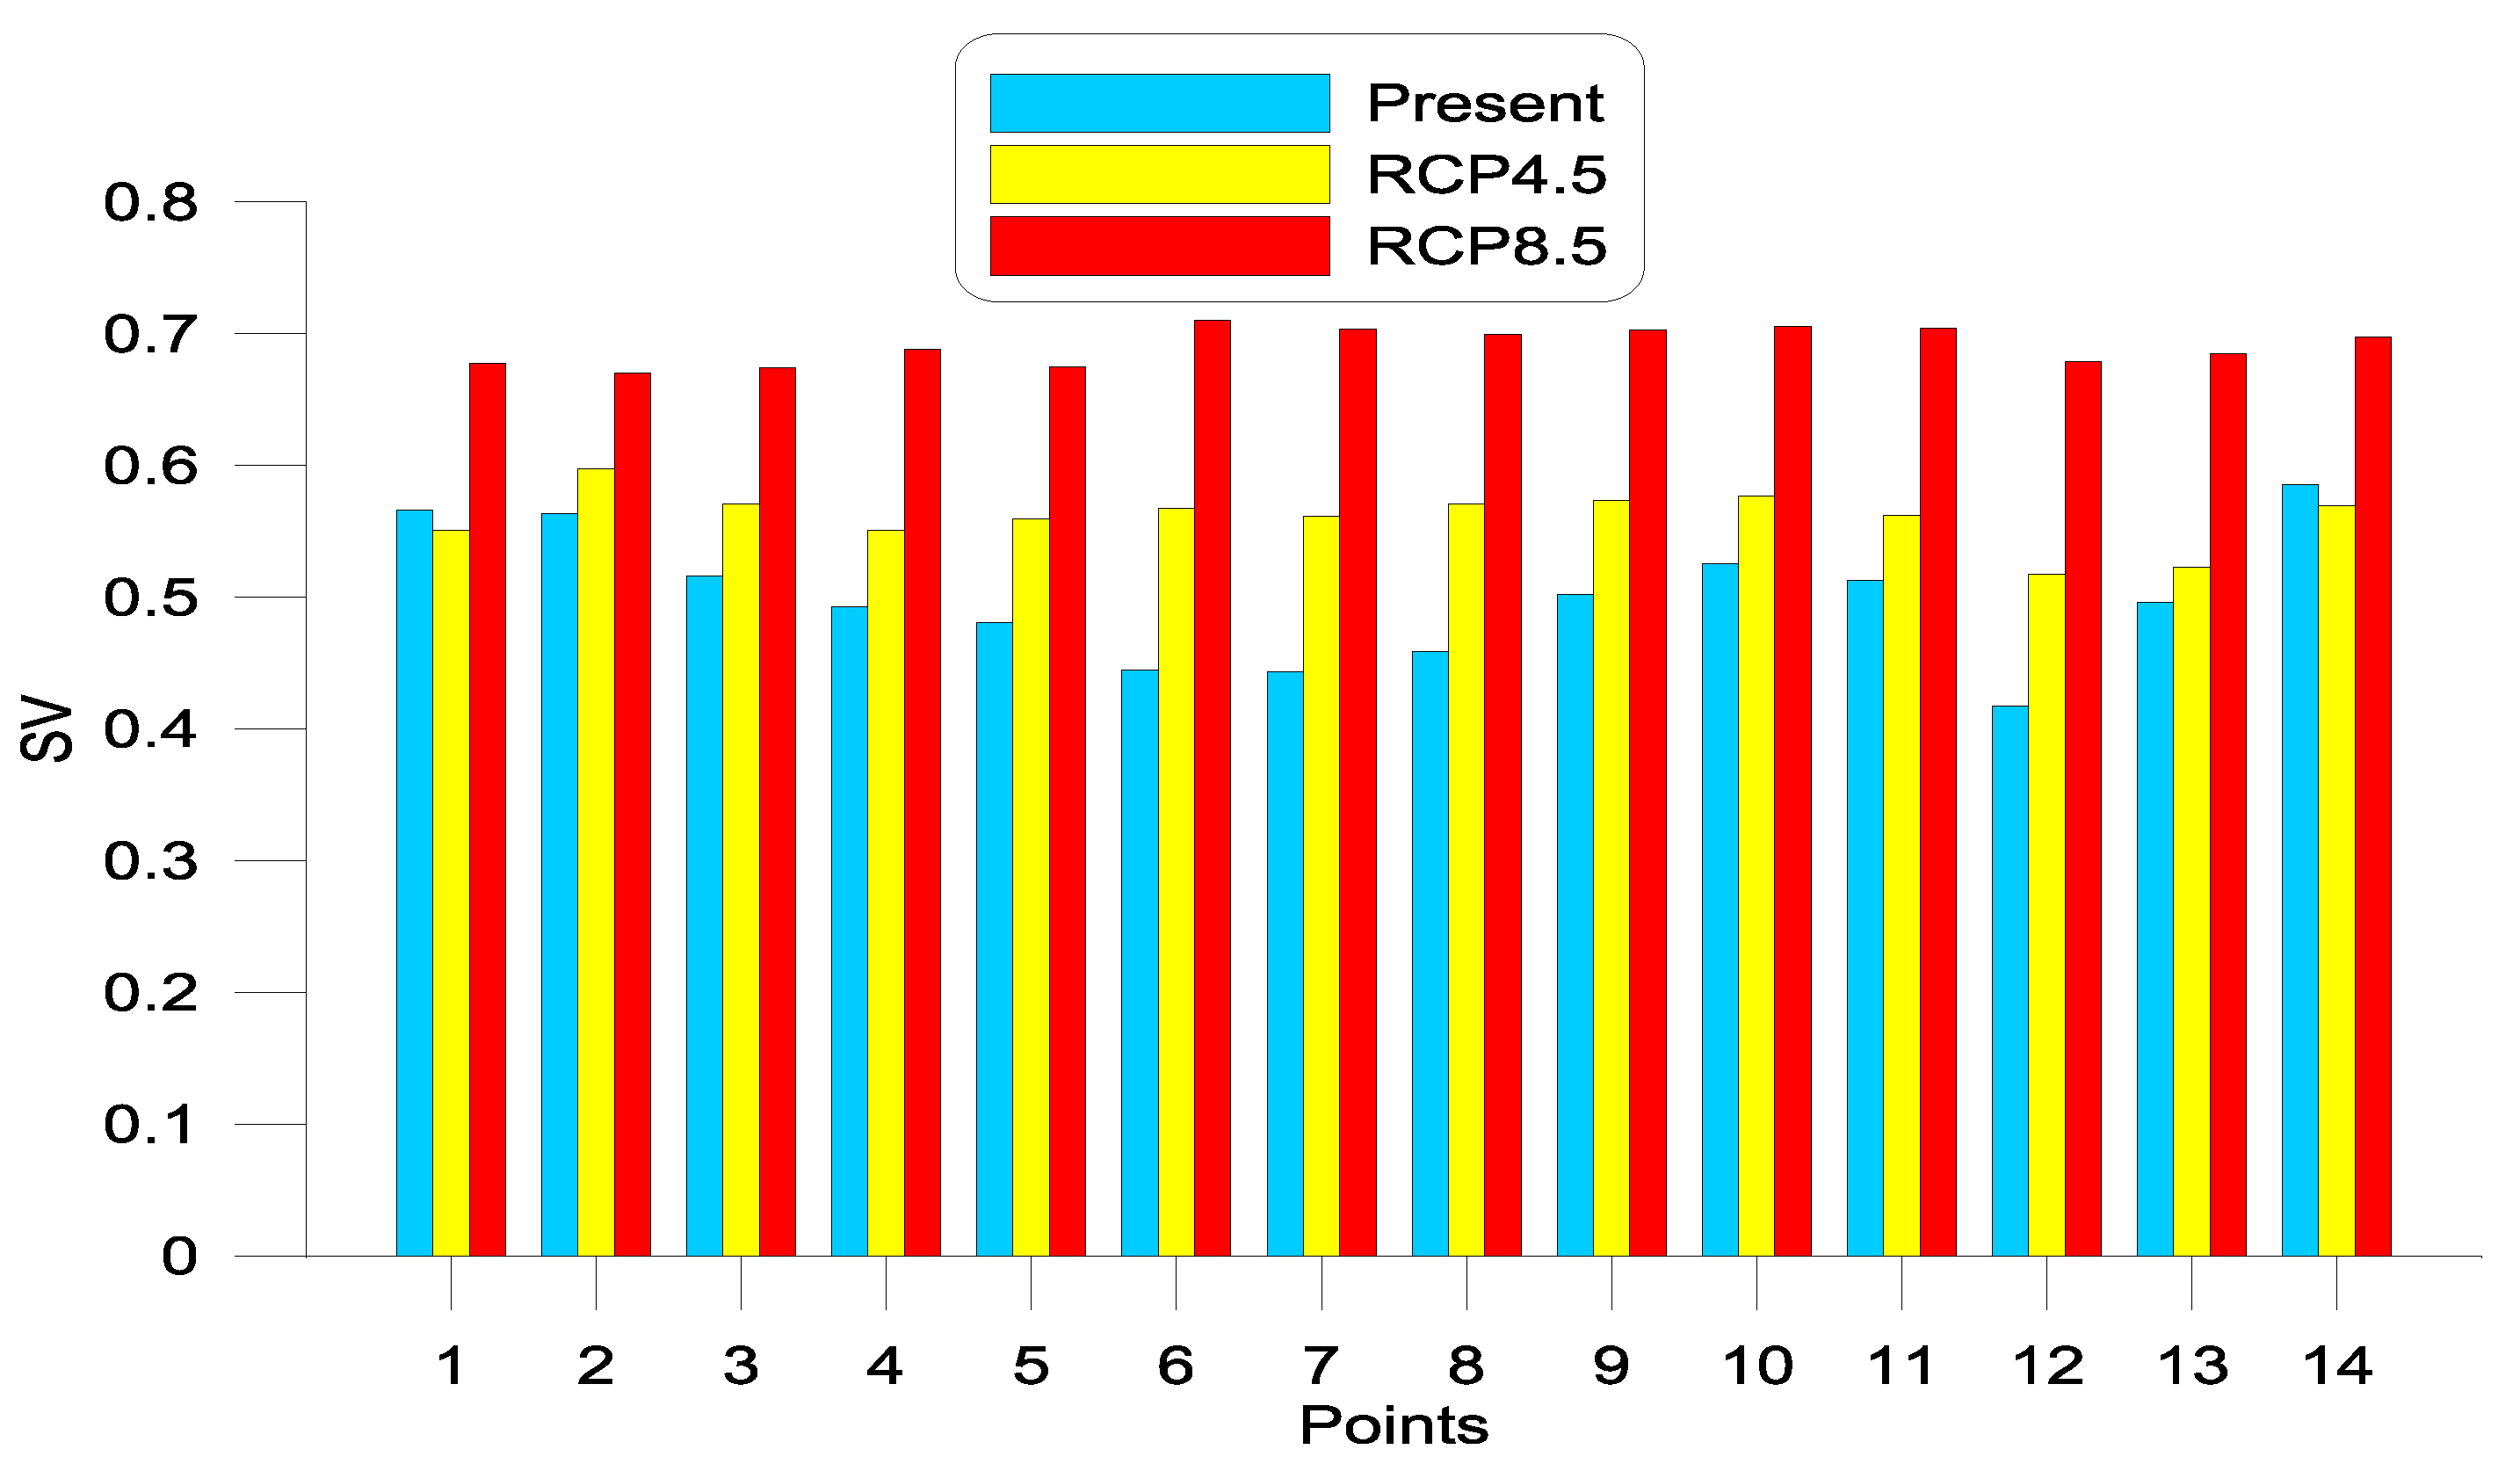
Concerning the SV index (Figure 14), in the RCP4.5 scenario it increases at all points except at both ends, which show a slight decrease (around 3%). The increases are particularly significant in the central part of the studied stretch (points P5 to P9) and in P12, with variations between 14% and 28%, although the maximum value of SV for this scenario is 0.6, indicating a low seasonal variability.
As for MV, the changes in the SV values are larger for the RCP8.5 scenario revealing great variations with respect to present values. The increases range between 19% and 63%, indicating a larger seasonal variability. In any case, the maximum value of SV is 0.71, which denotes a reduced variability of wave power throughout the seasons.
A test of hypothesis was carried out for both parameters MV and SV with a level of significance α = 0.05. In both cases and for both scenarios the null hypothesis was rejected, indicating that these changes are statistically significant.
Therefore, the intra-annual variability of wave power will increase significantly in the future, in particular for the RCP8.5 scenario. Nevertheless, since in the present situation the distribution of wave power throughout the year is fairly regular, such variability will be limited and considerably smaller than in other areas of the Mediterranean Sea, which present a strong seasonal character.

5. Summary and Conclusions

In this paper, the potential wave power in the Mediterranean coast of Morocco was assessed for present (period 1986–2005) and future (2081–2100) conditions, considering two climate change scenarios (RCP4.5 and RCP8.5). The aim was to assess how this resource will be modified by climate change. For this, wave datasets from four European institutes generated during the Med-CORDEX project, and fourteen grid points located along the Moroccan Mediterranean coast were used.
The multimodel ensemble projects that the total amount of available wave power in the area will be very similar in the future, with a slight decrease for scenario RCP4.5 (−1.8%) and practically unchanged for RCP8.5 (−0.1%). Although the spatial distribution of the energy will have a similar pattern, with the central part of the study area (points P7 to P11) being the most energetic, the variations will have a different sign in different sections of this coast. In the western part, the wave power will increase for both scenarios (up to 2% for RCP4.5 and up to 8% for RCP8.5), while in the eastern part, it will decrease (up to −4% for RCP4.5 and up to −6% for RCP8.5). One remarkable feature of these changes is that the most energetic points currently will experience the greatest reductions in wave power in both future scenarios.
Concerning the directional distribution of the energy, it is mainly concentrated in two sectors, the first comprising directions between NE and E and the second between WSW to WNW. The projections suggest that the directional distribution of wave power will be practically the same in the future for both scenarios.
Concerning the seasonal distribution of wave power, the multimodel ensemble shows a future increase in spring and autumn, limited in RCP4.5 (less than 2%) but significant in RCP8.5 (14% and 4.5%, respectively). On the contrary, a decrease of wave power is projected for summer (−1.8% in RCP4.5 and −4.9% in RCP8.5), and also for winter a remarkable reduction of wave power is calculated (−9.6% in RCP4.5 and −18% in RCP8.5).
These changes in the seasonal distribution of the wave power are also reflected in a consistent increase of the temporal variability, with greater values for coefficients SV and MV due to the increase of wave power in the most energetic season (spring) and its decrease in the less energetic season (summer). Irrespective of the increase of these indices, their magnitudes indicate a fairly even distribution of the wave energy throughout the year under future conditions.
Therefore, the Moroccan Mediterranean coast offers a modest wave energy potential, which will not experience large changes in magnitude in the future due to climate change, and although the intra-annual variability of the resource will increase, it will not be as large as in other areas of the Mediterranean Sea. This will allow extracting wave energy in an efficient way and without significant changes during this century, assuming that the cost–benefit ratio of WECs will be reduced in the future, making WEC deployment economically profitable.

Author Contributions

Conceptualization, J.P.S., M.M. and C.M.; methodology, J.P.S., R.C. and M.M.; software, R.C., P.L. and L.M.; validation, P.L. and L.M.; formal analysis, J.P.S., M.M. and C.M.; investigation, J.P.S., R.C., M.M. and C.M; resources, R.C. M.M. and C.M.; data curation, R.C., P.L. and L.M.; writing—original draft preparation, J.P.S.; writing—review and editing, J.P.S., M.M. and P.L.; visualization, J.P.S. and R.C.; supervision, J.P.S. and M.M.; project administration, J.P.S. and C.M. All authors have read and agreed to the published version of the manuscript.

Funding

This research received no external funding.

Acknowledgments

The authors acknowledge the CMCC (Centro Euro-Mediterraneo sui Cambiamenti Climatici, Italy), CNRM (Centre National de Recherches Météorologiques, France), GUF (Goethe-Universität Frankfurt am Main, Germany) and LMD (Laboratoire de Météorologie Dynamique, France) for generating the datasets used in this study. The support of the Secretaria d’Universitats i Recerca del Departament d’Economia i Coneixement de la Generalitat de Catalunya (Ref 2014SGR1253) is also acknowledged.

Conflicts of Interest

The authors declare no conflict of interest.

References

  1. Kousksou, T.; Allouhi, A.; Belattar, M.; Jamil, A.; El Rhafiki, T.; Arid, A.; Zeraouli, Y. Renewable energy potential and national policy directions for sustainable development in Morocco. Renew. Sustain. Energy Rev. 2015, 47, 46–57. [Google Scholar] [CrossRef]
  2. Zeroual, A.; Ankrim, M.; Wilkinson, A.J. Stochastic modelling of daily global solar radiation measured in Marrakesh, Morocco. Renew. Energy 1995, 6, 787–793. [Google Scholar] [CrossRef]
  3. Ouammi, A.; Zejli, D.; Dagdougui, H.; Benchrifa, R. Artificial neural network analysis of Moroccan solar potential. Renew. Sustain Energy Rev. 2012, 16, 4876–4889. [Google Scholar] [CrossRef]
  4. Nfaoui, H.; Essiarab, H.; Sayigh, A.A.M. A stochastic Markov chain model for simulating wind speed time series at Tangiers, Morocco. Renew. Energy 2004, 29, 1407–1418. [Google Scholar] [CrossRef]
  5. Ouammi, A.; Sacile, R.; Zejli, D.; Mimet, A.; Benchrifa, R. Sustainability of a wind power plant: Application to different Moroccan sites. Energy 2010, 35, 4226–4236. [Google Scholar] [CrossRef]
  6. ICEX. Energías Renovables en Marruecos; Technical Report; ICEX, Ministerio de Economía y Competitividad: Madrid, Spain, 2019.
  7. ICEX. El Mercado de las Energías Renovables en Marruecos; Technical Report; ICEX, Ministerio de Economía y Competitividad: Madrid, Spain, 2014.
  8. Lenee-Bluhm, P.; Paasch, R.; Özkan-Haller, H.T. Characterizing the wave energy resource of the US Pacific Northwest. Renew. Energy 2011, 36, 2106–2119. [Google Scholar] [CrossRef]
  9. Franzitta, V.; Catrini, P.; Curto, D. Wave energy assessment along Sicilian coastline, based on DEIM point absorber. Energies 2017, 10, 376. [Google Scholar] [CrossRef] [Green Version]
  10. Franzitta, V.; Curto, D. Sustainability of the renewable energy extraction close to the Mediterranean Islands. Energies 2017, 10, 283. [Google Scholar] [CrossRef] [Green Version]
  11. Farkas, A.; Degiuli, N.; Martić, I. Assessment of the offshore wave energy potential in the Croatian part of the Adriatic Sea and comparison with wind energy potential. Energies 2019, 12, 2357. [Google Scholar] [CrossRef] [Green Version]
  12. Iglesias, G.; Carballo, R. Wave energy potential along the Death Coast (Spain). Energy 2009, 34, 1963–1975. [Google Scholar] [CrossRef]
  13. Iglesias, G.; Carballo, R. Wave energy resource in the Estaca de Bares area (Spain). Renew. Energy 2010, 35, 1574–1584. [Google Scholar] [CrossRef]
  14. Iglesias, G.; Carballo, R. Wave power for La Isla Bonita. Energy 2010, 35, 513–521. [Google Scholar] [CrossRef]
  15. Iglesias, G.; Carballo, R. Wave resource in El Hierro—An island towards energy self-sufficiency. Renew. Energy 2011, 36, 689–698. [Google Scholar] [CrossRef]
  16. Rusu, E.; Guedes Soares, C. Wave energy pattern around the Madeira Islands. Energy 2012, 45, 771–785. [Google Scholar] [CrossRef]
  17. Rusu, L.; Guedes Soares, C. Wave energy assessments in the Azores Islands. Renew. Energy 2012, 45, 183–196. [Google Scholar] [CrossRef]
  18. Sierra, J.P.; González-Marco, D.; Sospedra, J.; Gironella, X.; Mösso, C.; Sánchez-Arcilla, A. Wave energy resource assessment in Lanzarote (Spain). Renew. Energy 2013, 55, 480–489. [Google Scholar] [CrossRef]
  19. Gonçalves, M.; Martinho, P.; Guedes Soares, C. Assessment of wave energy in the Canary Islands. Renew. Energy 2014, 68, 774–784. [Google Scholar] [CrossRef]
  20. Mota, P.; Pinto, J.P. Wave energy potential along the western Portuguese coast. Renew. Energy 2014, 71, 8–17. [Google Scholar] [CrossRef]
  21. Pastor, J.; Dou, Y.Q.; Liu, Y.C. Wave resource energy analysis for use in wave energy conversion. In Proceedings of the Industrial Energy Technology Conference, New Orleans, LA, USA, 20–23 May 2014. [Google Scholar]
  22. Venugopal, V.; Nemalidinne, R. Wave resource assessment for Scottish waters using a large scale North Atlantic spectral wave model. Renew. Energy 2015, 76, 503–525. [Google Scholar] [CrossRef] [Green Version]
  23. Guillou, N. Evaluation of wave energy potential in the Sea of Iroise with two spectral models. Ocean. Eng. 2015, 106, 141–151. [Google Scholar] [CrossRef]
  24. Sierra, J.P.; Martín, C.; Mösso, C.; Mestres, M.; Jebbad, R. Wave energy potential along the Atlantic coast de Morocco. Renew. Energy 2016, 96, 20–32. [Google Scholar] [CrossRef]
  25. Pastor, J.; Liu, Y. Wave climate resource analysis based on a revised gamma spectrum for wave energy conversion technology. Sustainability 2016, 8, 1321. [Google Scholar] [CrossRef] [Green Version]
  26. Sierra, J.P.; White, A.; Mösso, C.; Mestres, M. Assessment of the intra-annual and inter-annual variability of the wave energy resource in the Bay of Biscay (France). Energy 2017, 141, 853–868. [Google Scholar] [CrossRef] [Green Version]
  27. López, M.; Veigas, M.; Iglesias, G. On the wave energy resource of Peru. Energy Convers. Manag. 2015, 90, 34–40. [Google Scholar] [CrossRef]
  28. Mediavilla, D.G.; Sepúlveda, H.H. Nearshore assessment of wave energy resources in central Chile (2009–2010). Renew. Energy 2016, 90, 136–144. [Google Scholar] [CrossRef]
  29. Morim, J.; Cartwright, N.; Etemad-Shahidi, A.; Strauss, D.; Hemer, M. Wave energy resource assessment along the southeast coast of Australia on the basis of a 31-year hindcast. Appl. Energy 2016, 184, 276–297. [Google Scholar] [CrossRef]
  30. Hemer, M.A.; Zieger, S.; Durrant, T.; O’Grady, J.; Hoeke, R.K.; McInnes, K.L.; Rosebrock, U. A revised assessment of Australia’s national wave energy resource. Renew. Energy 2017, 114, 85–107. [Google Scholar] [CrossRef]
  31. Lucero, F.; Catalán, P.A.; Ossandón, Á.; Beyá, J.; Puelma, A.; Zamorano, L. Wave energy assessment in the central-south coast of Chile. Renew. Energy 2017, 114, 120–131. [Google Scholar] [CrossRef]
  32. Quitoras, M.R.D.; Abundo, M.L.S.; Danao, L.A.M. A techno-economic assessment of wave energy resources in the Philippines. Renew. Sustain. Energy Rev. 2018, 88, 68–81. [Google Scholar] [CrossRef]
  33. Liberti, L.; Carillo, A.; Sannino, G. Wave energy resource assessment in the Mediterranean, the Italian perspective. Renew. Energy 2013, 50, 938–949. [Google Scholar] [CrossRef]
  34. Vicinanza, D.; Cappietti, L.; Ferrante, V.; Contestabile, P. Estimation of the wave energy in the Italian offshore. J. Coast. Res. 2011, 64, 613–617. [Google Scholar]
  35. Vicinanza, D.; Contestabile, P.; Ferrante, V. Wave energy potential in the north-west of Sardinia (Italy). Renew. Energy 2013, 50, 506–521. [Google Scholar] [CrossRef]
  36. Bozzi, S.; Archetti, R.; Passoni, G. Wave electricity production in Italian offshore: A preliminary investigation. Renew. Energy 2014, 62, 407–416. [Google Scholar] [CrossRef]
  37. Sierra, J.P.; Mösso, C.; González-Marco, D. Wave energy resource assessment in Menorca (Spain). Renew. Energy 2014, 71, 51–60. [Google Scholar] [CrossRef]
  38. Arena, F.; Laface, V.; Malara, G.; Romolo, A.; Viviano, A.; Fiamma, V.; Sannino, G.; Carillo, A. Wave climate analysis for the design of wave energy harvesters in the Mediterranean Sea. Renew. Energy 2015, 77, 125–141. [Google Scholar] [CrossRef]
  39. Iuppa, C.; Cavallaro, L.; Vicinanza, D.; Foti, E. Investigation of suitable sites for Wave Energy Converters around Sicily (Italy). Ocean Sci. 2015, 12, 543–557. [Google Scholar] [CrossRef] [Green Version]
  40. Monteforte, M.; Re, C.L.; Ferreri, G.B. Wave energy assessment in Sicily (Italy). Renew. Energy 2015, 78, 276–287. [Google Scholar] [CrossRef]
  41. Besio, G.; Mentaschi, L.; Mazzino, A. Wave energy resource assessment in the Mediterranean Sea on the basis of a 35-year hindcast. Energy 2016, 94, 50–63. [Google Scholar] [CrossRef]
  42. Vannucchi, V.; Cappietti, L. Wave energy assessment and performance estimation of state of the art wave energy converters in Italian hotspots. Sustainability 2016, 8, 1300. [Google Scholar] [CrossRef] [Green Version]
  43. Franzitta, V.; Curto, D.; Milone, D.; Rao, D. Assessment of renewable sources for the energy consumption in Malta in the Mediterranean Sea. Energies 2016, 9, 1034. [Google Scholar] [CrossRef] [Green Version]
  44. Lavidas, G.; Venugopal, V. Wave energy resource evaluation and characterization for the Libyan Sea. Int. J. Mar. Energy 2017, 18, 1–14. [Google Scholar] [CrossRef] [Green Version]
  45. Lavidas, G.; Venugopal, V. A 35 year high-resolution wave atlas for nearshore energy production and economics at the Aegean Sea. Renew. Energy 2017, 103, 401–417. [Google Scholar] [CrossRef] [Green Version]
  46. Soukissian, T.; Denaxa, D.; Karathanasi, F.; Prospathopoulos, A.; Sarantakos, K.; Iona, A.; Georgantas, K.; Mavrakos, S. Marine Renewable Energy in the Mediterranean Sea: Status and Perspectives. Energies 2017, 10, 1512. [Google Scholar] [CrossRef] [Green Version]
  47. Lavidas, G.; Venugopal, V. Energy Production Benefits by Wind and Wave Energies for the Autonomous System of Crete. Energies 2018, 11, 2741. [Google Scholar] [CrossRef] [Green Version]
  48. Reeve, D.E.; Chen, Y.; Pan, S.; Magar, V.; Simmonds, D.J.; Zacharioudaki, A. An investigation of the impacts of climate change on wave energy generation: The Wave Hub, Cornwall, UK. Renew. Energy 2011, 36, 2404–2413. [Google Scholar] [CrossRef] [Green Version]
  49. Young, I.; Zieger, S.; Babanin, A.V. Global trends in wind speed and wave height. Science 2011, 332, 451–455. [Google Scholar] [CrossRef] [PubMed]
  50. Zheng, C.W.; Li, C.Y. Variation of the wave energy and significant wave height in the China Sea and adjacent waters. Renew. Sustain. Energy Rev. 2015, 43, 381–387. [Google Scholar] [CrossRef]
  51. Ulazia, A.; Penalba, M.; Ibarra-Berastegi, G.; Saenz, J. Wave energy trends over the Bay of Biscay and the consequences for wave energy converters. Energy 2017, 141, 624–634. [Google Scholar] [CrossRef]
  52. Zheng, C.W.; Wang, Q.; Li, C.Y. An overview of medium- to long-term predictions of global wave energy resources. Renew. Sustain. Energy Rev. 2017, 79, 1492–1502. [Google Scholar] [CrossRef]
  53. Ulazia, A.; Penalba, M.; Rabanal, A.; Ibarra-Berastegi, G.; Ringwood, J.; Saenz, J. Historical evolution of the wave resource and energy production off the Chilean Coast over the 20th Century. Energies 2018, 11, 2289. [Google Scholar] [CrossRef] [Green Version]
  54. Gonçalves, M.; Martinho, P.; Guedes Soares, C. A 33-year hindcast on wave energy assessment in the western French coast. Energy 2018, 165, 790–801. [Google Scholar] [CrossRef]
  55. Penalba, M.; Ulazia, A.; Saenz, J.; Ringwood, J. Impact of long-term resource variations on wave energy Farms: The Icelandic case. Energy 2020, 192, 116609. [Google Scholar] [CrossRef]
  56. Harrison, G.P.; Wallace, A.R. Sensitivity of wave energy to climate change. IEEE Trans. Energy Convers. 2005, 20, 870–877. [Google Scholar] [CrossRef] [Green Version]
  57. Mackay, E.B.L.; Bahaj, A.S.; Chellenor, P.G. Uncertainty in wave energy resource assessment. Part 1: Historic data. Renew. Energy 2010, 35, 1792–1808. [Google Scholar] [CrossRef]
  58. Mackay, E.B.L.; Bahaj, A.S.; Chellenor, P.G. Uncertainty in wave energy resource assessment. Part 2: Variability and predictability. Renew. Energy 2010, 35, 1809–1819. [Google Scholar] [CrossRef]
  59. Sierra, J.P.; Casas-Prat, M.; Campins, E. Impact of climate change on wave energy resource: The case of Menorca (Spain). Renew. Energy 2017, 101, 275–285. [Google Scholar] [CrossRef]
  60. Saprykina, Y.; Kuznetsov, S. Analysis of the variability of wave energy due to climate changes on the example of the Black Sea. Energies 2018, 11, 2020. [Google Scholar] [CrossRef] [Green Version]
  61. Church, J.A.; Clark, P.U.; Cazenave, A.; Gregory, J.M.; Jevrejeva, S.; Levermann, A.; Merrifield, M.A.; Milne, G.A.; Nerem, R.S. Sea level change. In Climate Change 2013: The Physical Science Basis; Contribution of Working Group I to the Fifth Assessment Report of the Intergovernmental Panel on Climate Change; Stocker, T.F., Qin, D., Plattner, G.-K., Tignor, M., Allen, S.K., Boschung, J., Nauels, A., Xia, Y., Bex, V., Midgley, P.M., Eds.; Cambridge University Press: Cambridge, UK; New York, NY, USA, 2013. [Google Scholar]
  62. Ulbrich, U.; Leckebusch, G.C.; Pinto, J.G. Extra-tropical cyclones in the present and future climate: A review. Theor. Appl. Climatol. 2009, 96, 117–131. [Google Scholar] [CrossRef] [Green Version]
  63. Bengtsson, L.; Hodges, K.I.; Keenlyside, N. Will extratropical storms intensify in a warmer climate? J. Clim. 2009, 22, 2276–2301. [Google Scholar] [CrossRef] [Green Version]
  64. Maheras, P.; Flocas, H.A.; Patrikas, I.; Anagnostopoulou, C.A. 40 year objective climatology of surface ciclones in the Mediterranean region: Spatial and temporal distribution. Int. J. Climatol. 2001, 21, 109–130. [Google Scholar] [CrossRef]
  65. Campins, J.; Genovés, A.; Picornell, M.A.; Jansà, A. Climatology of Mediterranean cyclones using the ERA-40 dataset. Int. J. Climatol. 2011, 31, 1596–1614. [Google Scholar] [CrossRef] [Green Version]
  66. Lionello, P.; Dalan, F.; Elvini, E. Cyclones in the Mediterranean region: The present and the doubled CO2 climate scenarios. Clim. Res. 2002, 22, 147–159. [Google Scholar] [CrossRef]
  67. Campins, J.; Jansà, A.; Genovés, A. Three-dimensional structure of western Mediterranean cyclones. Int. J. Climatol. 2006, 26, 323–343. [Google Scholar] [CrossRef] [Green Version]
  68. Lionello, P.; Bhend, J.; Buzzi, A.; Della-Marta, P.; Krichak, S.; Jansa, A.; Maheras, P.; Sanna, A.; Trigo, I.; Trigo, R. Cyclones in the Mediterranean region: Climatology and effects on the environment. In Mediterranean Climate Variability; Lionello, P., Malanotte-Rizzoli, P., Boscolo, R., Eds.; Elsevier Science: Amsterdam, The Netherlands, 2006; pp. 325–372. [Google Scholar]
  69. Raji, O.; Dezileau, L.; Von Grafenstein, U.; Niazi, S.; Snoussi, M.; Martinez, P. Extreme seas events during the last millennium in the northeast of Morocco. Nat. Hazards Earth Syst. Sci. 2015, 15, 203–211. [Google Scholar] [CrossRef] [Green Version]
  70. El Mrini, A.; Anthony, E.J.; Maanan, M.; Taaouati, M.; Nachite, D. Beach-dune degradation in a Mediterranean context of strong development pressures, and the missing integrated management perspective. Ocean Coast. Manag. 2012, 69, 299–306. [Google Scholar] [CrossRef]
  71. Anfuso, G.; Martinez del Pozo, A.; Nachite, D.; Benavente, J.; Macias, A. Morphological characteristics and medium-term evolution of the beaches between Ceuta and Cabo Negro (Morocco). Environ. Geol. 2007, 52, 933–946. [Google Scholar] [CrossRef]
  72. Raji, O.; Niazi, S.; Snoussi, M.; Dezileau, L.; Khouakhi, A. Vulnerability assessment of a lagoon to sea level rise and stor events: Nador lagoon (NE Morocco). J. Coast. Res. 2013, 65, 802–807. [Google Scholar] [CrossRef]
  73. Casas-Prat, M.; Sierra, J.P. Projected future wave climate in the NW Mediterranean Sea. J. Geophys. Res. Oceans 2013, 118, 3548–3568. [Google Scholar] [CrossRef]
  74. Lionello, P.; Boldrin, U.; Giorgi, F. Future changes in cyclone climatology over Europe as inferred from a regional climate simulation. Clim. Dyn. 2008, 30, 657–671. [Google Scholar] [CrossRef]
  75. Donat, M.G.; Leckebusch, G.C.; Wild, S.; Ulbrich, U. Future changes in European winter storm losses and extreme wind speeds inferred from GCM and RCM multi-model simulations. Nat. Hazards Earth Syst. Sci. 2011, 11, 1351–1370. [Google Scholar] [CrossRef]
  76. Pinto, J.G.; Ulbrich, U.; Leckebusch, G.C.; Spangehl, T.; Zacharias, S. Changes in storm track and cyclone activity in three SRES ensemble experiments with the ECHAM5/MPI-OM1 GCM. Clim. Dyn. 2009, 29, 195–210. [Google Scholar] [CrossRef]
  77. Mori, N.; Yasuda, T.; Mase, H.; Tom, T.; Oku, Y. Projection of extreme wave climate change under global warming. Hydrol. Res. Lett. 2010, 4, 15–19. [Google Scholar] [CrossRef] [Green Version]
  78. Dobrynin, M.; Murawsky, J.; Yang, S. Evolution of the global wind wave climate in CMIP5 experiments. Geophys. Res. Lett. 2012, 39, 1–6. [Google Scholar] [CrossRef]
  79. Fan, Y.; Lin, S.J.; Held, I.M.; Yu, Z.; Tolman, H.L. Global ocean surface wave simulation using a coupled atmospheric-wave model. J. Clim. 2012, 26, 6233–8288. [Google Scholar] [CrossRef]
  80. Semedo, A.; Weisse, R.; Behrens, A.; Sterl, A.; Bengtsson, L.; Gunther, H. Projection of global wave climate change toward the end of the twenty-first century. Bull. Am. Meterol. Soc. 2013, 26, 8269–8288. [Google Scholar] [CrossRef] [Green Version]
  81. Hemer, M.A.; Fan, Y.; Mori, N.; Semedo, A.; Wang, X.L. Projected change in wave climate from a multi-model ensemble. Nat. Clim. Chang. 2013, 3, 471–476. [Google Scholar] [CrossRef]
  82. Wang, X.L.; Feng, Y.; Swail, V.R. Changes in global ocean wave heights as projected using multimodel CMIP5 simulations. Geophys. Res. Lett. 2014, 41, 1026–1034. [Google Scholar] [CrossRef]
  83. Hemer, M.A.; Trenham, C. Evaluation of a CMIP5 derived dynamical global wind wave climate model ensemble. Ocean Model. 2016, 103, 190–223. [Google Scholar] [CrossRef] [Green Version]
  84. Casas-Prat, M.; Wang, X.L.; Swart, N. CMIP5-based global wave climate projections including the entire Artic Ocean. Ocean Model. 2018, 123, 66–85. [Google Scholar] [CrossRef]
  85. Lionello, P.; Cogo, S.; Galati, M.B.; Sanna, A. The Mediterranean surface wave climate inferred from future scenario simulation. Glob. Planet. Chang. 2008, 63, 152–162. [Google Scholar] [CrossRef]
  86. Hemer, M.A.; McInnes, K.L.; Ranasinghe, R. Climate and variability bias adjustment of climate model-derived winds for a southeast Australian dynamical wave model. Ocean Dyn. 2012, 62, 87–104. [Google Scholar] [CrossRef]
  87. Grabemann, I.; Weisse, R. Climate change impact on extreme wave conditions in the North Sea: An ensemble study. Ocean Dyn. 2008, 58, 199–212. [Google Scholar] [CrossRef] [Green Version]
  88. Giorgi, F.; Lionello, P. Climate change projections for the Mediterranean region. Glob. Planet. Chang. 2008, 63, 90–104. [Google Scholar] [CrossRef]
  89. Charles, E.; Idier, D.; Delecluse, P.; Déqué, M.; Cozannet, G. Climate change impact on waves in the Bay of Biscay, France. Ocean Dyn. 2012, 62, 831–848. [Google Scholar] [CrossRef] [Green Version]
  90. Ruti, P.M.; Somot, S.; Giorgi, F.; Dubois, C.; Flaounas, E.; Obermann, A.; Dell’Aquila, A.; Pisacane, G.; Harzallah, A.; Lombardi, E.; et al. Med-Cordex initiative for Mediterranean climate studies. Bull. Am. Meteorol. Soc. 2016, 97, 1187–1208. [Google Scholar] [CrossRef] [Green Version]
  91. Moss, R.H.; Edmonds, J.A.; Hibbard, K.A.; Manning, M.R.; Rose, S.K.; van Vuuren, D.P.; Carter, T.R.; Emori, S.; Kainuma, M.; Kram, T.; et al. The next generation of scenarios for climate change research and assessment. Nature 2010, 463, 747–756. [Google Scholar] [CrossRef] [PubMed]
  92. Cornett, A.M. A global wave energy resource assessment. In Proceedings of the International Offshore and Polar Engineering Conference, Vancouver, BC, Canada, 6–11 July 2008; pp. 318–326. [Google Scholar]
  93. Carballo, R.; Sanchez, M.; Ramos, V.; Fraguela, J.A.; Iglesias, G. Intra-annual wave resource characterization for energy exploitation: A new decision-aid tool. Energy Convers. Manag. 2015, 93, 1–8. [Google Scholar] [CrossRef]
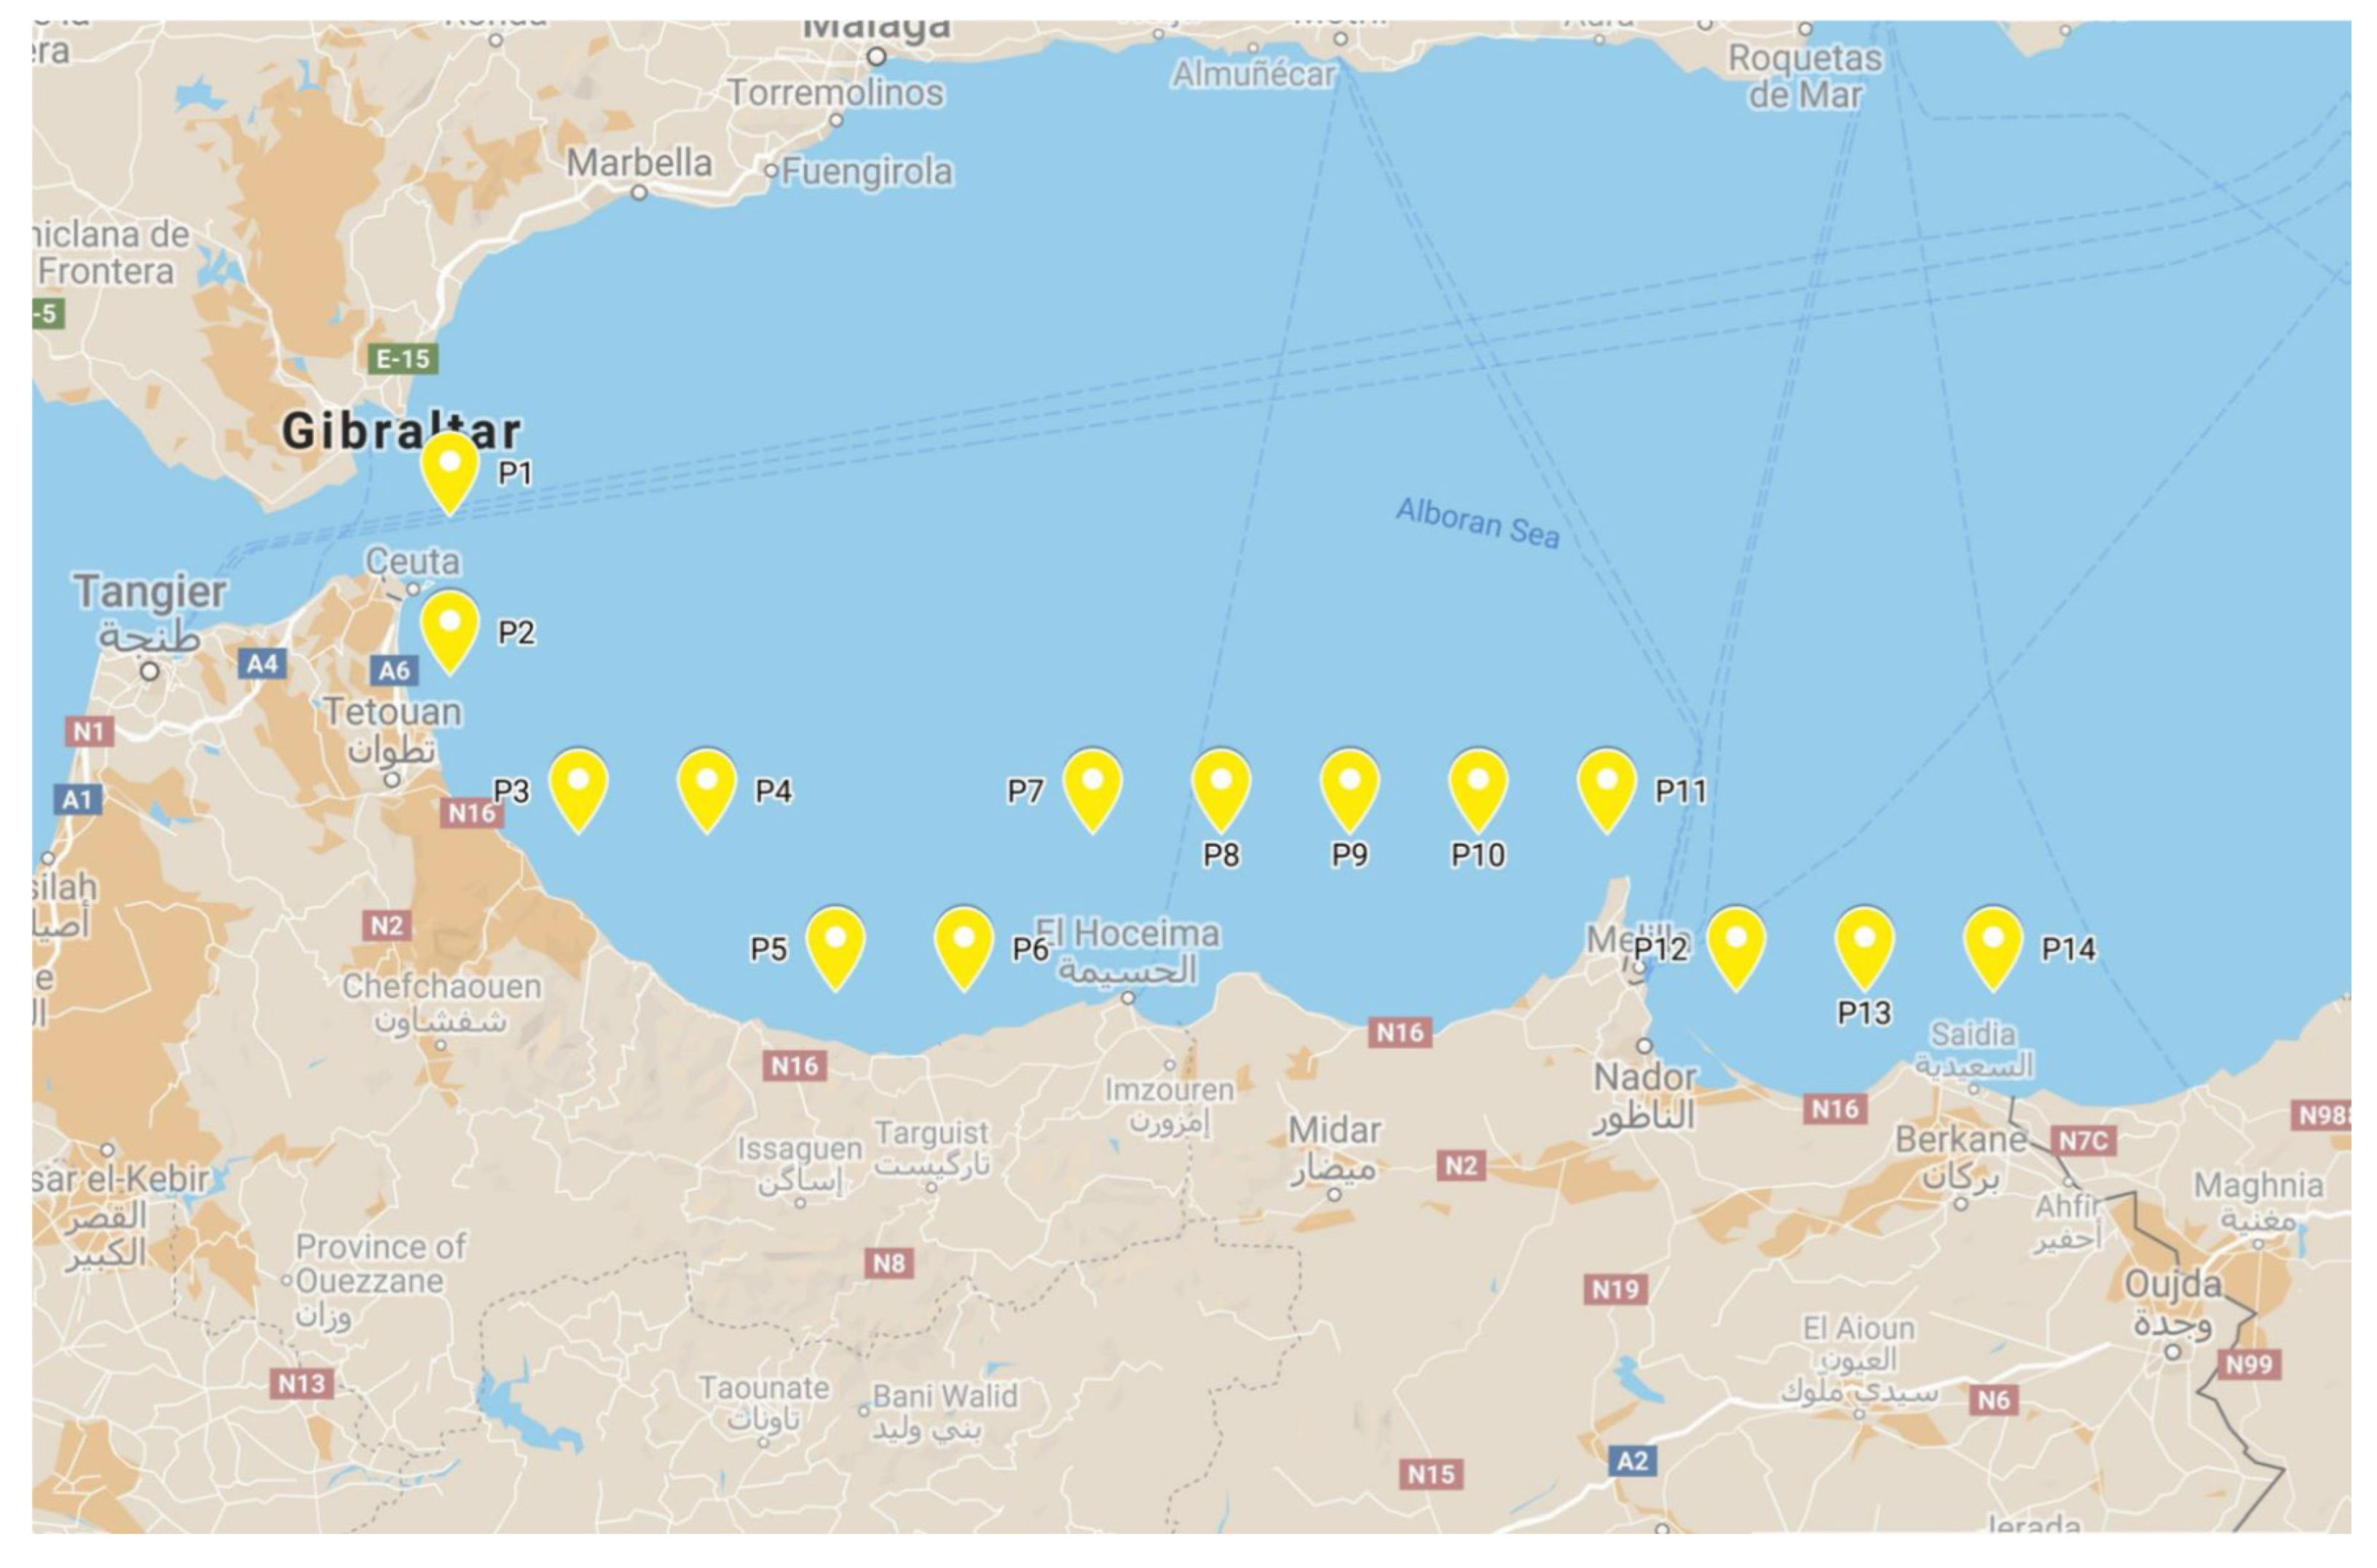
Figure 1. Map of the study area and location of the analyzed points.
Energies 13 02993 g001
Figure 2. Present wave power at the 14 points computed for each model and the multimodel ensemble.
Energies 13 02993 g002
Figure 3. Present directional average power distribution at the study points (multimodel ensemble).
Energies 13 02993 g003
Figure 4. Present average monthly wave power for each data set and the multimodel ensemble. The values correspond to the average of the 14 points.
Energies 13 02993 g004
Figure 5. Present average seasonal wave power for each data set and the multimodel ensemble. The values correspond to the average of the 14 points.
Energies 13 02993 g005
Figure 6. Values of the monthly variability index (MV) coefficient for each data set and the multimodel ensemble (present situation).
Energies 13 02993 g006
Figure 7. Values of the seasonal variability index (SV) coefficient for each data set and the multimodel ensemble (present situation).
Energies 13 02993 g007
Figure 8. Comparison of present and future mean significant wave heights (Hs) (multimodel ensemble).
Energies 13 02993 g008
Figure 9. Comparison of present and future mean energy periods (Te) (multimodel ensemble).
Energies 13 02993 g009
Figure 10. Comparison of present and future wave power (multimodel ensemble).
Energies 13 02993 g010
Figure 11. Comparison of present and future monthly wave power (ensemble). The values correspond to the average of the 14 points.
Energies 13 02993 g011
Figure 12. Comparison of present and future seasonal wave power (ensemble). The values correspond to the average of the 14 points.
Energies 13 02993 g012
Figure 13. Comparison of present and future MV coefficient (ensemble).
Energies 13 02993 g013
Figure 14. Comparison of present and future SV coefficient (ensemble).
Energies 13 02993 g014
Table 1. Main locations, water depths and distances to the coast for the points considered. Note: depths and distances were obtained from nautical charts and therefore approximate values.
PointLongitude (W)Longitude (N)Depth (m)Distance (km)
P15°15′36°00′83011
P25°15′35°45′1807.5
P35°00′35°30′2009.5
P44°45′35°30′42025
P54°30′35°15′1508
P64°15′35°15′2407
P74°00′35°30′29027
P83°45′35°30′32024
P93°30′35°30′70029
P103°15′35°30′60024.5
P113°00′35°30′2007
P122°45′35°15′10010
P132°30′35°15′12013
P142°15′35°15′14015.5
Table 2. Comparison of the average wave power (obtained from the multimodel ensemble) between present and future conditions. The percentages represent the relative variation of wave power under future conditions with respect to present ones.
PointPresent (kW/m)RCP4.5 (kW/m)RCP4.5 Variation (%)RCP8.5 (kW/m)RCP8.5 Variation (%)
P13.563.50−1.73.714.3
P22.852.870.83.087.9
P32.682.700.82.877.2
P43.163.170.43.325.3
P51.121.142.01.206.7
P63.503.47−0.73.572.0
P74.474.39−1.84.480.3
P84.814.69−2.34.75−1.3
P95.144.98−3.24.96−3.4
P105.164.99−3.34.93−4.5
P115.134.97−3.14.89−4.6
P122.592.58−0.42.631.5
P133.052.97−2.42.96−2.9
P143.263.13−3.93.06−6.1
Average3.603.54−1.83.59−0.1
Table 3. Comparison of the average monthly wave power (obtained from the multimodel ensemble and considering all the study area) between present and future conditions. The percentages represent the relative variation of future with respect to present conditions.
MonthPresent (kW/m)RCP4.5 (kW/m)RCP4.5 Variation (%)RCP8.5 (kW/m)RCP8.5 Variation (%)
January3.623.25−10.32.91−19.6
February4.203.83−9.03.66−13.0
March4.734.964.95.4415.0
April4.564.16−8.94.784.7
May3.634.0511.64.5024.0
June3.073.04−1.03.214.5
July2.962.74−7.32.83−4.3
August3.143.222.52.69−14.3
September3.663.55−3.03.793.4
October3.454.0016.04.2122.1
November3.343.02−9.42.90−13.1
December2.932.66−9.32.28−22.3
Table 4. Comparison of the average seasonal wave power (obtained from the multimodel ensemble and considering all the study area) between present and future conditions. The percentages represent the relative variation of future with respect to present conditions.
SeasonPresent (kW/m)RCP4.5 (kW/m)RCP4.5 Variation (%)RCP8.5 (kW/m)RCP8.5 Variation (%)
Winter3.573.23−9.62.93−18.0
Spring4.314.392.04.9114.0
Summer3.063.00−1.82.91−4.9
Autumn3.483.531.43.644.5