Article

Assessing and Mitigating Impacts of Electric Vehicle Harmonic Currents on Distribution Systems

Department of Electrical and Computer Engineering, University of Windsor, Windsor, ON N9B 3P4, Canada
*
Author to whom correspondence should be addressed.
Energies 2020, 13(12), 3257; https://doi.org/10.3390/en13123257
Submission received: 28 April 2020 / Revised: 27 May 2020 / Accepted: 16 June 2020 / Published: 23 June 2020
(This article belongs to the Special Issue Harmonics and Quality of Power)

Abstract

:
Harmonic currents of electric vehicle (EV) chargers could jeopardize the power quality of distribution systems and add to the transformer’s losses, thus degrading its lifetime. This paper assesses and mitigates the impacts of different EV chargers on distribution transformers and the voltage quality of distribution systems. The effect of state-of-charge (SOC) of the EV battery is considered through applying weighted arithmetic mean to accurately assess the impacts of EV harmonic currents on aging and losses of the EV interfacing transformer. The voltage quality of the IEEE 33-bus distribution system, supplying several EV parking lots, is also assessed at different charging levels using a fast-decoupled harmonic power flow. A new optimal harmonic power flow algorithm—that incorporates photovoltaic-based distribution generation units (DGs)—is developed to enhance the voltage quality of distribution systems, and elongate the lifetime of the substation transformer. The effectiveness of the proposed mitigation method is confirmed using the IEEE 33-bus distribution system, hosting several EV charging stations and photovoltaic-based DGs.

1. Introduction

Electrification of automobiles has become a vital component in the propulsion strategies of automakers around the world to lower fuel consumption, reduce climate change caused by greenhouse emissions, and increase energy security through variation of the available energy sources [1]. Electric vehicle (EV) charging systems can provide one of three power levels: Level I, slow charging; Level II, semi-fast charging; and Level III, DC fast charging. Private and public institutions usually use Level II charging that requires a 208 V or 240 V outlet. Since semi-fast and fast charging systems offer an adequate amount of power, it has drawn researchers’ and developers’ interests in the literature.
Due to the nonlinear load nature of battery charging, EVs induce transformer temperature and losses to rise, and thus, the transformer’s lifetime to decrease [2]. The impacts of increased EV demand, including current harmonics, on load loss, temperature, and the aging acceleration factor of a 100-kVA distribution transformer (DT) were presented in [2], and the capability of the power system to safely accommodate the extra EV load was studied. However, the effect of state-of-charge (SOC) on the harmonic spectrum of charging current is neglected. SOC influences the harmonics of charging current, increasing the current distortion throughout the charging cycle [3]. In [4], the harmonic impacts of Level II and Level III chargers on the voltage total harmonic distortion (THD) were studied. However, this study was limited to the buses to which the EV chargers are connected.
The aging acceleration factor and loss-of-life (LOL) of distribution transformers were calculated in [5] for different battery charging profiles. In [6], the impacts of EV and rooftop solar photovoltaics on distribution transformer aging were studied. The distribution-level secondary transformer LOL was obtained in [7] due to EV charging effects, taking into account different charging scenarios such as residential loading and geographical locations. However, in the above studies, losses due to the harmonic currents of EV chargers were ignored.
Harmonics generated by EV charging demand may jeopardize the power quality, reliability, and safety of distribution systems [8]. A stochastic model for EV charging demand impact analysis on distribution systems was presented in [9]. The voltage magnitude profile and voltage imbalance factor for different EV charging cases were calculated in [10], and conclusions were drawn about their compliance with EN50160 [11]. Moreover, voltage droop charging and on-board peak shaving strategies were discussed in that study, and their potential for reducing the adverse effects on the residential grid was noted. A model for EV incorporating its different characteristics was presented in [12] to evaluate the EV effects on distribution systems. This model was used to assess EV effects on peak load demand, voltage deviation, and total power losses at different scenarios. In [13], the impact of dynamic and static fast inductive charging of EVs on distribution systems was studied. The above studies focus on the fundamental component of the charging current and disregard the impacts of EV harmonic currents.
A mitigating technique, consisting of infrastructural upgrades, is proposed in [14] to address the impacts of EV charging on the secondary service voltages and service transformer load demands. This method involves increasing the kVA rating of the service transformer and employing an additional service transformer to reconfigure the secondary circuit. A centralized method is proposed in [15] to co-optimize transformer LOL with EV charging and discharging to minimize the total cost of operations. However, the impacts of the harmonic currents of EV chargers on transformer aging was not studied. Active filters constitute a harmonic compensation tool that is more flexible than passive filters. However, they must be implemented in proximity to nonlinear loads to measure their currents [16]. This presents a challenge since the EV charging loads are spread across the distribution system.
Distributed generation units (DGs) could provide a remedy to the adverse impacts of EV harmonic currents on distribution systems. Among all renewable-based DGs, photovoltaic (PV)-based DGs are the most popular in low-voltage distribution systems because they are safe, clean, produce no noise, and have negligible running and maintenance costs. Harmonic compensation methods for PV-based DGs were developed in [17,18] to mitigate the low- and high-order harmonics of the voltage at the point-of-common-coupling (PCC). However, these methods were limited to local loads. Thus, the harmonic disturbance through the distribution system is not studied. Furthermore, the impacts of EV harmonic currents on the substation transformer are neither investigated nor compensated.
This paper studies the influences of residential EV harmonic currents on the losses and aging of the EV interfacing transformers. The effect of SOC is considered in the harmonic spectrums through applying the weighted arithmetic mean to time-variant harmonic order magnitudes. Including the effect of SOC in the harmonic distribution enhances the accuracy of the harmonic impact assessment on DTs. Furthermore, a decoupled harmonic power flow is employed to assess the harmonic distortion of EV charging stations on distribution systems. The voltage quality is evaluated for the IEEE 33-bus distribution system, supplying commercial EV parking lots through different EV charger levels. An optimal harmonic power flow that incorporates PV-based DGs is proposed to encounter the adverse impacts of EV harmonic currents on distribution systems. As a result, the system’s power quality is enhanced, and the lifetime of the main substation transformer is elongated without the need for costly active power filters.

2. Distribution Transformer Loss Modeling for Harmonic Analysis

Current harmonics produced by EV battery chargers can result in an increased transformer load loss, a rise in temperature, and a decreased lifetime. This section reviews models that are employed to quantify the impacts of EVs on distribution transformers.

2.1. Transformer Loss Modeling

Transformer losses are categorized into no-load loss ( P N L ), and load loss ( P L L ). P L L consists of I 2 R copper loss, and stray loss ( P S T R L ) caused by stray electromagnetic flux. P S T R L is divided into winding eddy-current loss ( P E C ) and stray loss ( P O S L ) in non-winding components due to structural parts, bus bar connections, the clamps, tanks and the core. The excessive temperature rise of the windings draws significant concerns about transformers operating under non-sinusoidal load conditions. The transformer losses are expressed on a per unit (pu) basis, where the base loss is the copper loss at the rated current. The load loss under rated load conditions pu is given by
P L L R p u = 1.0 + P E C R p u + P O S L R p u
where the subscripts ‘R’ and ‘pu’ denote the rated current condition, and a per unit quantity.
P E C R p u under a specific frequency is proportional to the square of the load current and approximately proportional to the frequency squared. Similar to P E C R p u , P O S L R p u is proportional to the square of the load current and the harmonic frequency to the 0.8 power [19]. Harmonic loss factors are essential to determine the transformer capability in supplying non-linear loads, such as EV chargers. Therefore, harmonic loss factors are applied to P E C R p u and P O S L R p u to determine the heating due to harmonic load currents. The harmonic loss factors for winding eddy currents, i.e., F H L , and other stray losses, i.e., F H L S T R , are given by
F H L = h = 1 h m a x I h 2 h 2 h = 1 h m a x I h 2
F H L S T R = h = 1 h m a x I h 2 h 0.8 h = 1 h m a x I h 2
where h m a x is the highest harmonic number, and I h is the ratio of the hth harmonic current to the fundamental current. By incorporating the harmonic loss factors into (1), the transformer load losses under non-linear loads can be obtained:
P L L R p u = I p u 2 ( 1.0 + P E C R p u F H L + P O S L R p u F H L S T R )
where I p u is the root mean square (RMS) load current per unit, i.e., I p u = h = 1 h m a x I h 2 .

2.2. Transformer Temperature Rise Modeling

Thermal stresses arise due to heat in the system introduced by transformer losses resulting from current harmonics. A total of 50% of transformer lifetime reduction is due to thermal tensions produced by non-linear loads [20]. The top-oil-rise over ambient temperature of a transformer, θ T O , is proportional to the total losses to the 0.8 exponents, and is expressed in °C, as follows [21]:
θ T O = θ T O R ( P L L p u + P N L p u P L L R p u + P N L p u ) 0.8
where θ T O R is the top-oil-rise over ambient temperature under rated conditions in degree Celsius (°C), and P N L p u is the no-load loss per unit. The hottest-spot conductor rise over top-oil temperature, θ g , is given in °C by
θ g = θ g R ( 1 + F H L P E C R p u 1 + P E C R p u × I p u 2 ) 0.8
where θ g R is the hottest-spot conductor rise over top-oil temperature under rated conditions in °C. Using the top-oil-rise over ambient temperature and the hottest-spot conductor rise over top-oil temperature, the hottest-spot conductor rise over ambient, θ H , is given in °C by
θ H = θ T O + θ g .

2.3. Transformer Lifetime Modeling

For a given transformer rated at 65 °C average winding rise, its aging acceleration factor ( F A A ) is equal to 1.0 at a reference hottest-spot temperature of 110 °C. This factor is proportional to the hottest-spot temperature and exceeds the value of one for temperatures above 110 °C, indicating that the rate at which transformer insulation aging increases is beyond normal. In [21], F A A is given by
F A A = exp ( 15000 383 15000 θ H + 273 ) .
The normal insulation life ( L i f e n o r m ) at a 65 °C average winding temperature rise system is 20.55 years (180,000 h) at the hottest-spot temperature of 110 °C. Using F A A , the distribution transformer real life, L i f e r e a l , is determined in years by
L i f e r e a l = L i f e n o r m F A A .

3. Impact of EV Harmonic Currents on Distribution Transformers

The impacts of EVs were studied on a sample 1500 kVA DT whose characteristics at the rated condition are given in Table 1 [22]. The assessment was performed by adding the EV demand to the typical daily load curve of the USA in 2011 [2]. With residential EV chargers, EV users typically charge their vehicles during the off-peak load hours from 9:00 p.m. to 4:00 a.m. Two sets of total harmonic distortion values were utilized to estimate the harmonic distortion of a Level I/II single-phase charger and a Level III three-phase charger, as presented in Table 2 and Table 3, respectively [3]. It can be observed that the percentage of harmonic currents increased with the charging time, that is, when the SOC increased.
The effect of the SOC on the EV harmonic currents should be considered to enhance the accuracy of the harmonic estimation. Therefore, the weighted arithmetic mean was computed on the time-changing harmonic values in Table 2 and Table 3 at each harmonic order. The weighted arithmetic average of the harmonic current at the h th harmonic number was calculated using
I ˜ h I ˜ 1 = i = 1 N c ( I h , t i I 1 , t i ) Δ t i i = 1 N c Δ t i × ( 1 + K )
where I 1 , t i and I h , t i are the fundamental and harmonic currents measured at time t i of the charging cycle, respectively; Δ t i denotes the time difference between two harmonic current measurements, i.e., Δ t i = t i t i 1 , and t 0 = 0 . K is a factor used to compensate for the harmonic magnitudes that were not measured in the harmonic distribution. This factor was considered as 5% for Level I/II and 10% for Level III charging.
Two average harmonic spectrums were obtained using (10), for Level I/II and Level III chargers. Figure 1 demonstrates the eddy-current loss, other stray loss, and load loss for Level I/II and Level III chargers, which are denoted by Cases 1 and 2, respectively. In the case of the Level III charger (Case 2), it can be observed that both P E C and P O S L were greater than those of the Level I/II chargers (Case 1). The highest value of P E C rose from 4.50 pu (Case 1) to 4.99 pu (Case 2). At the same loading condition, P O S L slightly increased from 0.45 pu (Case 1) to 0.48 pu (Case 2). Consequently, the load loss values caused by the Level III chargers were greater than the ones due to the Level I/II chargers. The load losses peak reached 6.20 pu and 6.75 pu for Case 1 and Case 2, respectively.
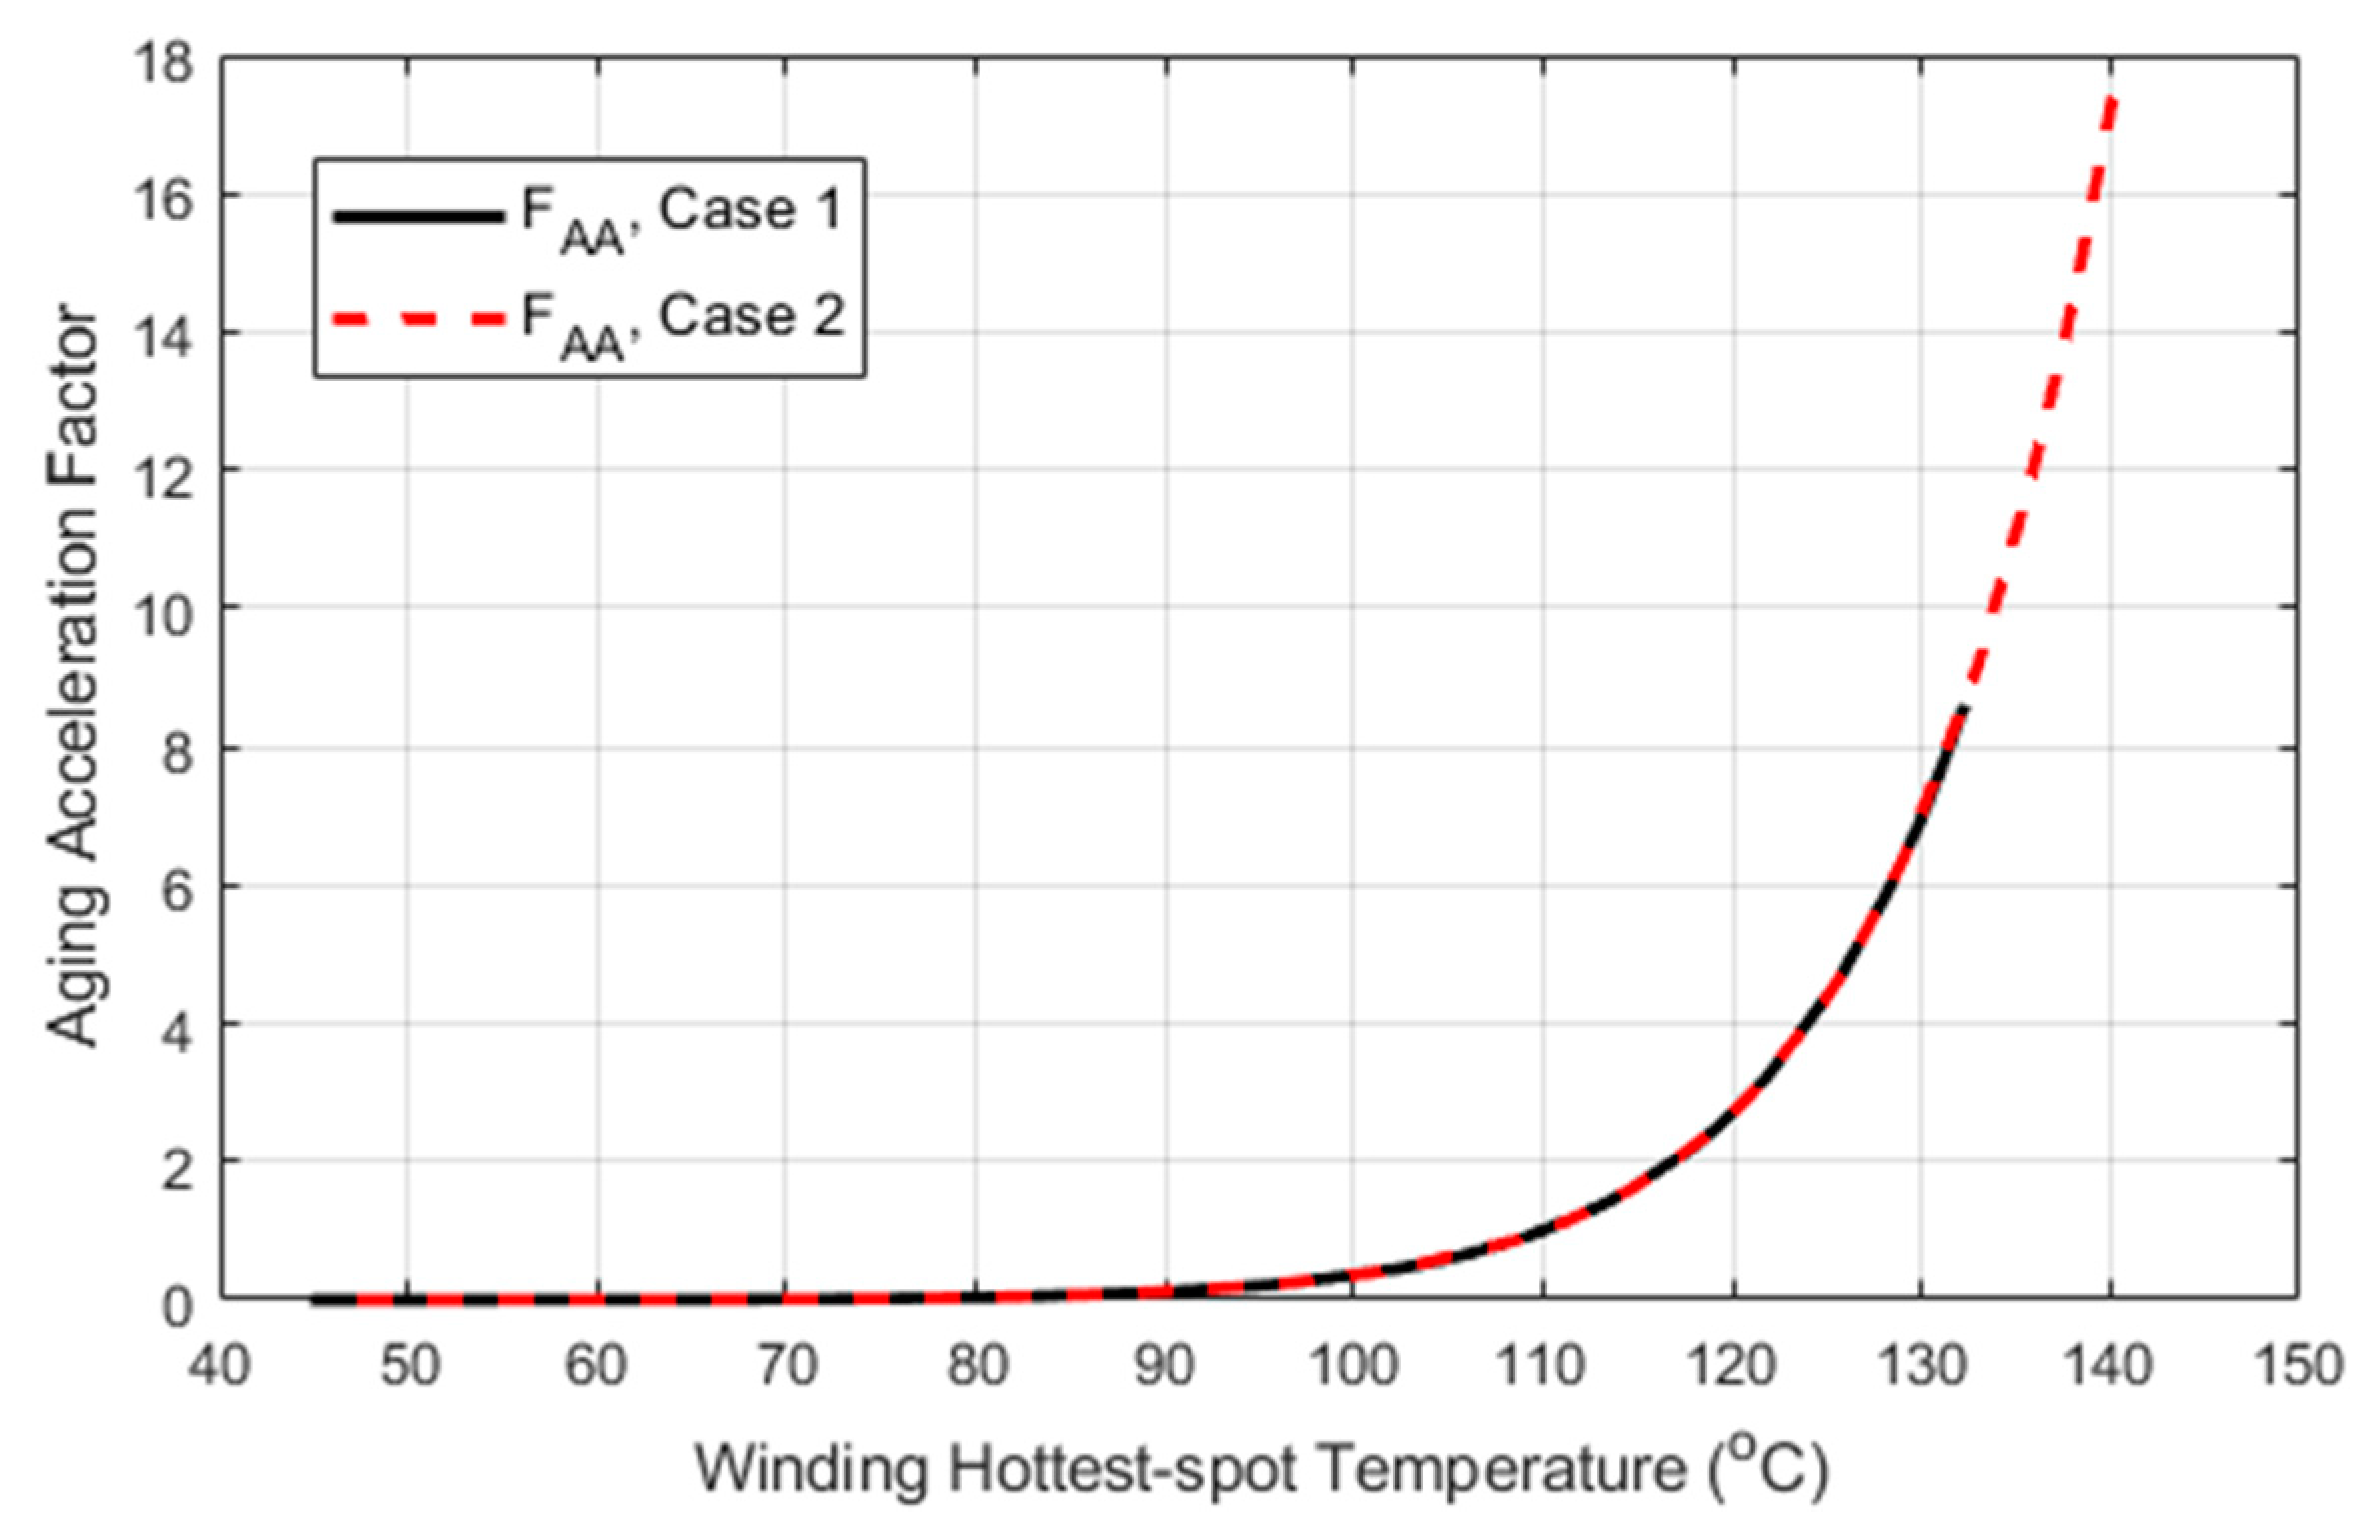
The impact of the thermal stress on the transformer’s lifetime due to power losses was then evaluated by determining the aging acceleration factor, F A A , and the transformer’s real life. Based on the results of Figure 2, the values of F A A were below one when the hottest-spot temperature was lower than the reference temperature (110 °C). The aging acceleration factor increased as the temperature values exceeded the reference temperature, indicating that the rate of transformer insulation aging acceleration is greater than the normal rate at the reference temperature. This factor exceeded one between the period of 9:00 p.m. and 11:30 p.m. in Case 1, reaching a maximum of 8.6 at 9:30 p.m. For the Level III charger, this factor was also above one at midnight. It attained a value of 18.7 at 9:30 p.m. These results indicate that the transformer’s life expectancy is affected and drops below the normal insulation life (i.e., 20.55 years) due to EV charging. The impacts of the harmonic components of Level III charging on the transformer’s loss of life are greater than those of Level I/II charging. The average lifetime of the EV interfacing transformer could drop from 20.55 years to 17.88 and 16.40 years in Case 1 and Case 2, respectively, as indicated in Figure 3.

4. Impact of EV Harmonic Currents on Distribution Transformers

This section investigates the impacts of current harmonics due to EV charging on a distribution system.

4.1. System Description

Figure 4 displays the IEEE 33-bus distribution system under study with EV charging stations and PV-based DGs [23]. Various loads, including residential, commercial, and industrial types with the daily power profiles shown in Figure 5, were connected to the distribution system. The EV power profile Figure 5 describes the uncontrolled charging power profile (i.e., based on first come first serve), which was constructed using data provided by Toronto parking authority (TPA) [24]. EV charging stations were installed at buses 15, 16, 22, and 24. The EV penetration level was taken as 15% of the total system load. Three PV-based DGs were connected to buses 14, 20, and 25. Likewise, the PV penetration level was kept at 15%.

4.2. Harmonic Power Flow Analysis with EV Charging Demand

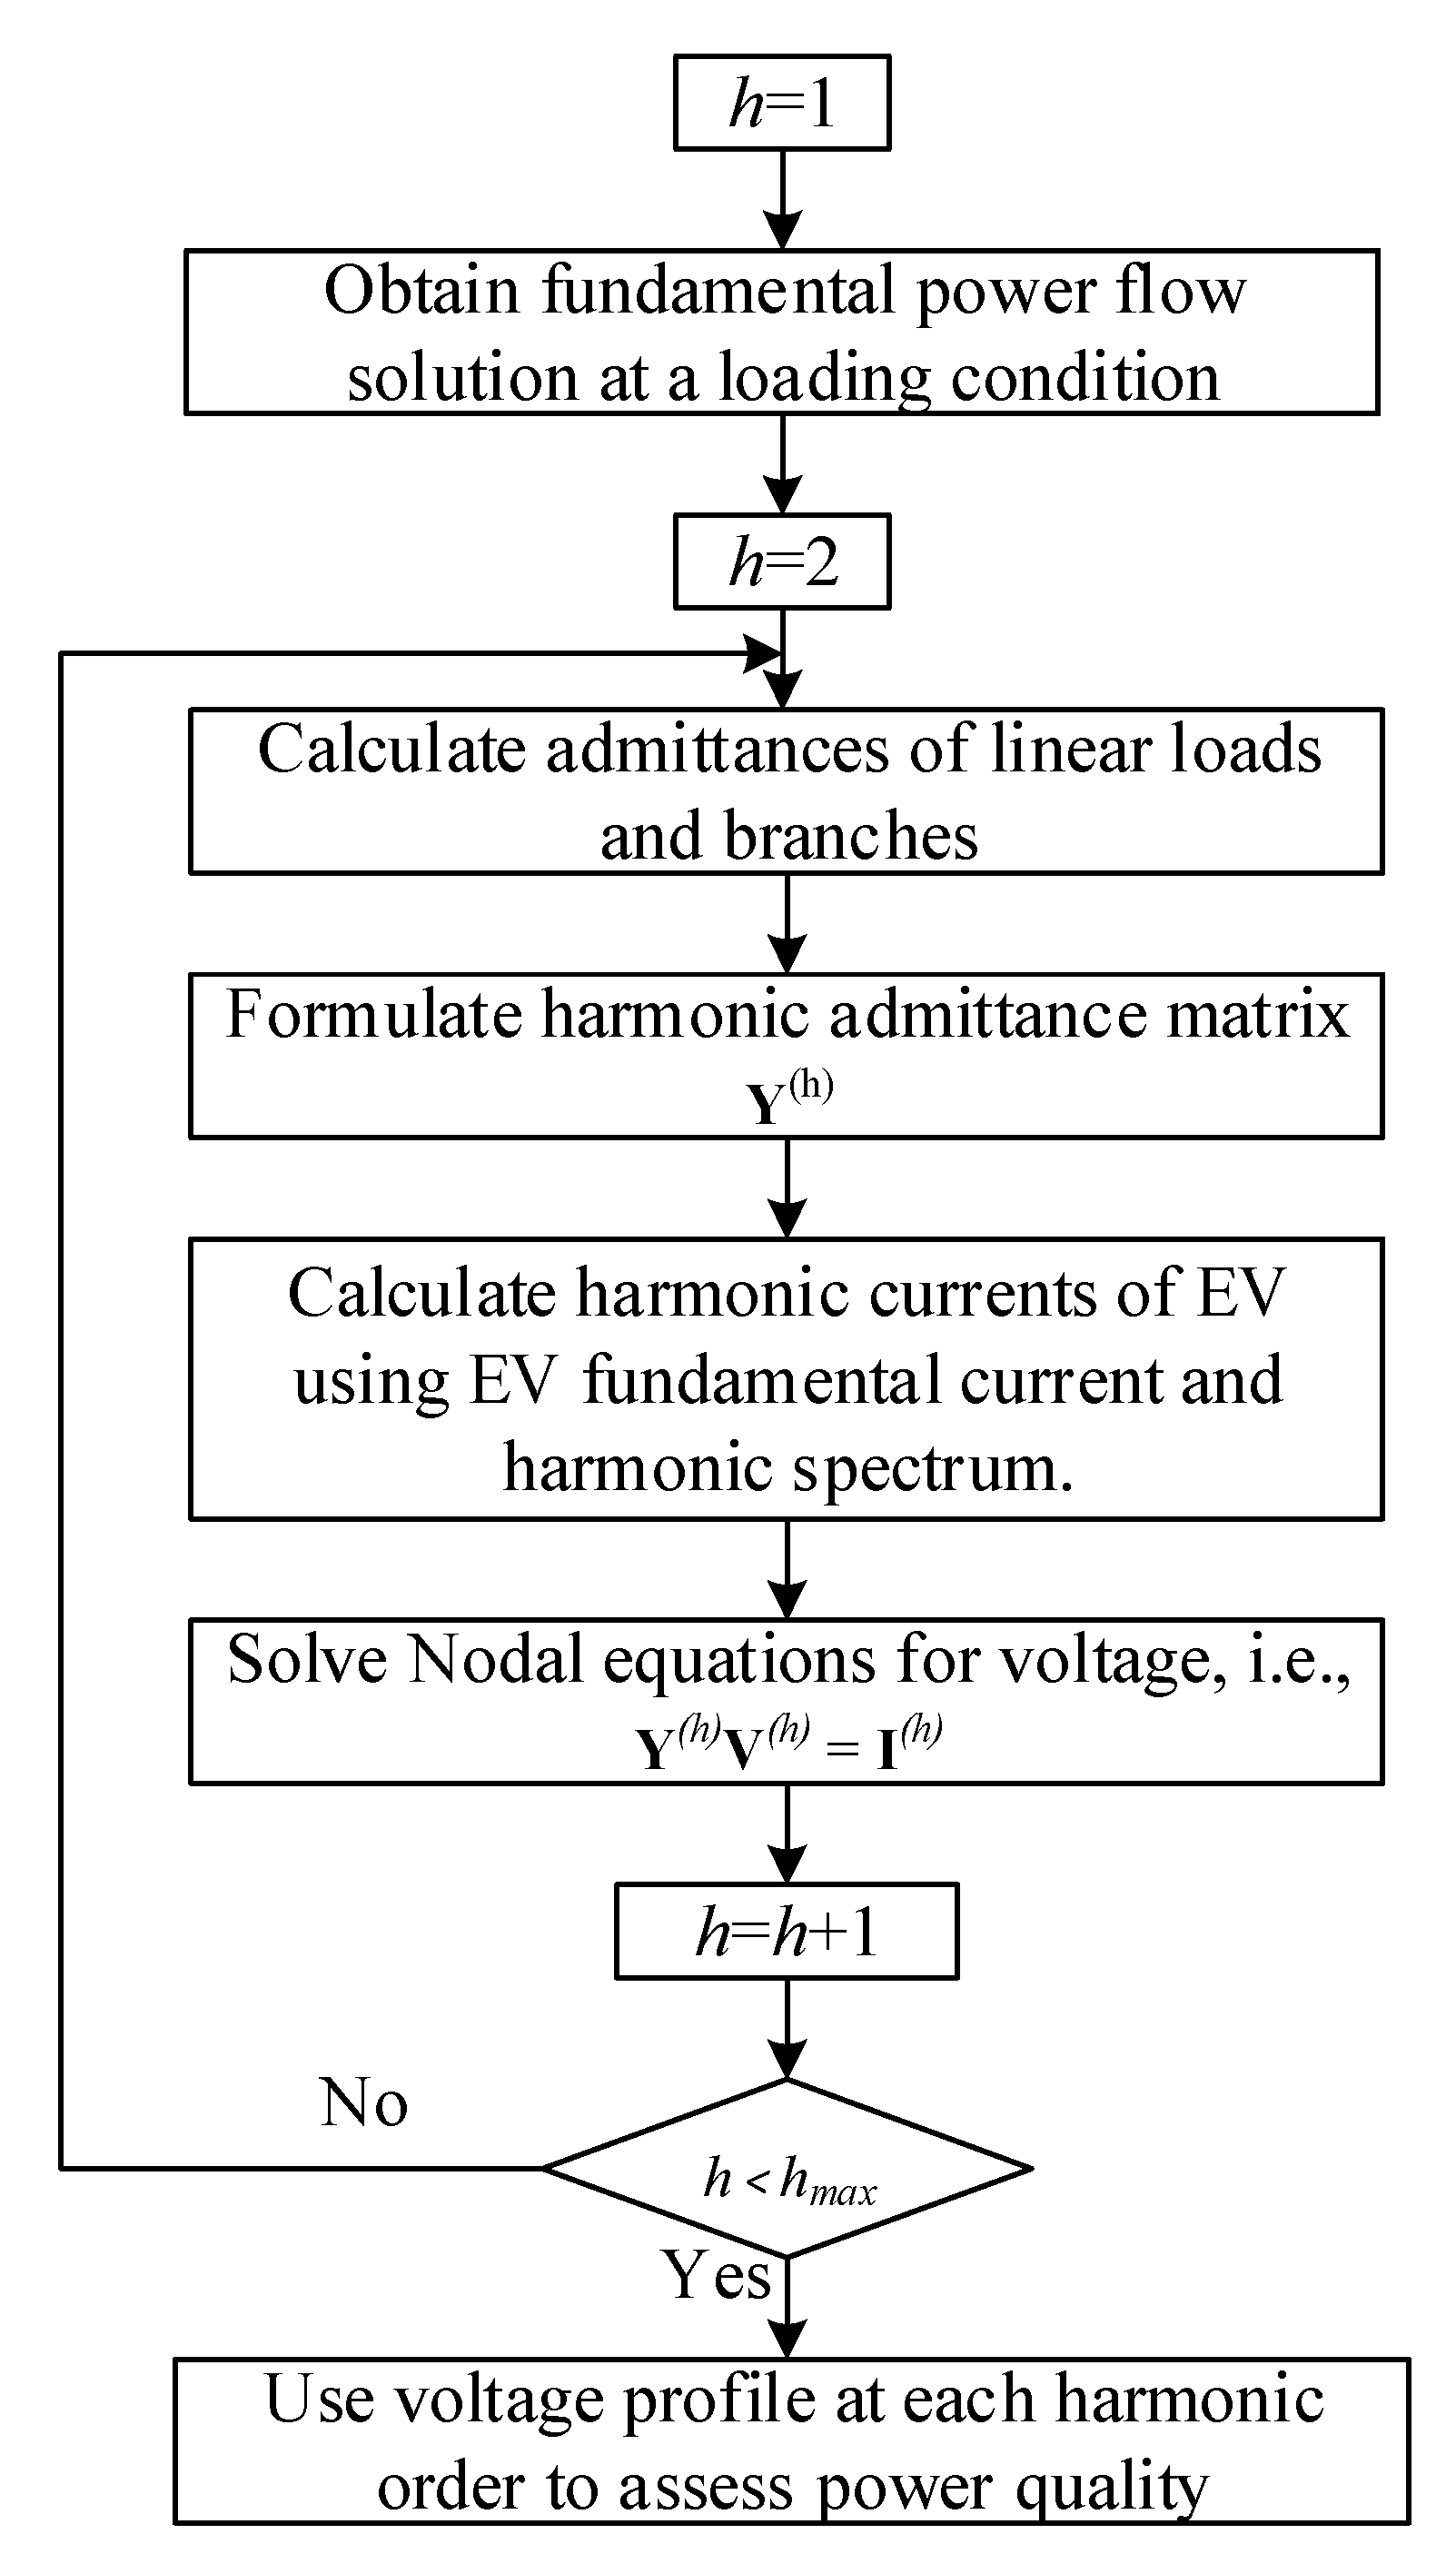
Harmonic power flow is needed to estimate the harmonic distortion in the presence of nonlinear devices such as EV chargers. It is proposed to employ the decoupled harmonic power flow (DHPF) technique to assess the impacts of EV charging on power quality due to its computational efficiency and robust convergence [25]. The procedure of the DHPF is shown in the flow chart of Figure 6. Firstly, the fundamental power flow solution was obtained by solving the following active and reactive power balance equations:
P i = j = 1 N b u s | V i ( 1 ) | | V j ( 1 ) | | γ i j ( 1 ) | cos ( θ i j ( 1 ) δ i ( 1 ) + δ j ( 1 ) )
Q i = j = 1 N b u s | V i ( 1 ) | | V j ( 1 ) | | γ i j ( 1 ) | sin ( θ i j ( 1 ) δ i ( 1 ) + δ j ( 1 ) )
where P i and Q i are the injected active and reactive powers at bus i, respectively; | γ i j ( 1 ) | is the magnitude of the ( i , j ) t h element of the fundamental bus admittance matrix; θ i j ( 1 ) is the angle of γ i j ( 1 ) ; δ i ( 1 ) and δ j ( 1 ) are the angles of the bus voltages V i ( 1 ) and V j ( 1 ) , respectively; and the superscript ‘1’ stands for the fundamental component.
Then, the fundamental power solution was used to calculate the admittances of branches and linear loads at higher-order harmonic frequencies. The harmonic admittance of a linear load connected at a given bus i is presented by its admittance y i ( h ) in (13); and the harmonic admittance of a branch, y i j ( h ) , i.e., connecting buses i and j, is given by (14):
y i ( h ) = P D , i | V i ( 1 ) | 2 j Q D , i h | V i ( 1 ) | 2
y i j ( h ) = 1 r i j + j h x i j
where P D , i and Q D , i are the fundamental active and reactive power demands at bus i, r i j is the branch resistance, and x i j is the fundamental branch reactance. Based on (13) and (14), an admittance matrix Y ( h ) was formulated for each harmonic order h. Y ( h ) was constructed with diagonal elements Y i i ( h ) and off-diagonal elements Y i j ( h ) as given by
Y i i ( h ) = y b i ( h ) + y i ( h ) + j = 1 , j i N b u s y i j ( h )
Y i j ( h ) = Y j i ( h ) = y i j ( h )
where y b i ( h ) denotes the branch shunt susceptance at bus i.
The power electronics circuit configuration of battery charging systems is typically formed by two back-to-back converters: an AC/DC converter and a DC/DC converter. The AC/DC converter rectifies the AC voltage from the grid to a DC voltage and maintains a constant unity power factor. The DC/DC converter controls the delivered power to the battery pack, and the voltage rectification depends on the battery pack’s voltage [24]. Therefore, EV parking lots were modeled as decoupled harmonic current sources. The fundamental EV current at bus i was calculated using
I E V i ( 1 ) = [ P E V i + j Q E V i V i ( 1 ) ] *
where P E V i and Q E V i are the EV active and reactive power charging demands, respectively. Typically, EV parking lots do not participate in voltage regulation, and thus, Q E V i was set at zero. The EV harmonic current I E V i ( 1 ) was calculated using the charger harmonic spectrum, i.e., I ˜ h / I ˜ 1 in (10), as follows:
I E V i ( h ) = ( I ˜ h I ˜ 1 ) × I E V i ( 1 ) .
Lastly, the nodal equations were solved at each harmonic order to obtain the harmonic voltage profile at each bus using
Y ( h ) V ( h ) = I ( h ) .

4.3. Impact Assessment of EV Battery Charging on Voltage Quality

The IEEE 33-bus radial distribution system, shown in Figure 4, was used as a test system. Firstly, the weighted average method was applied using (10) and with a K factor of 5% to obtain the harmonic current spectrum of Level I/II chargers and Level III chargers. The average harmonic current spectrum, along with the fundamental power flow results, was employed in the DHPF to calculate the harmonic voltage at each bus. The total harmonic distortion (THD) for voltage at bus i was calculated using
T H D V i = h = 2 h m a x ( V i ( h ) ) 2 V i ( 1 ) × 100 .
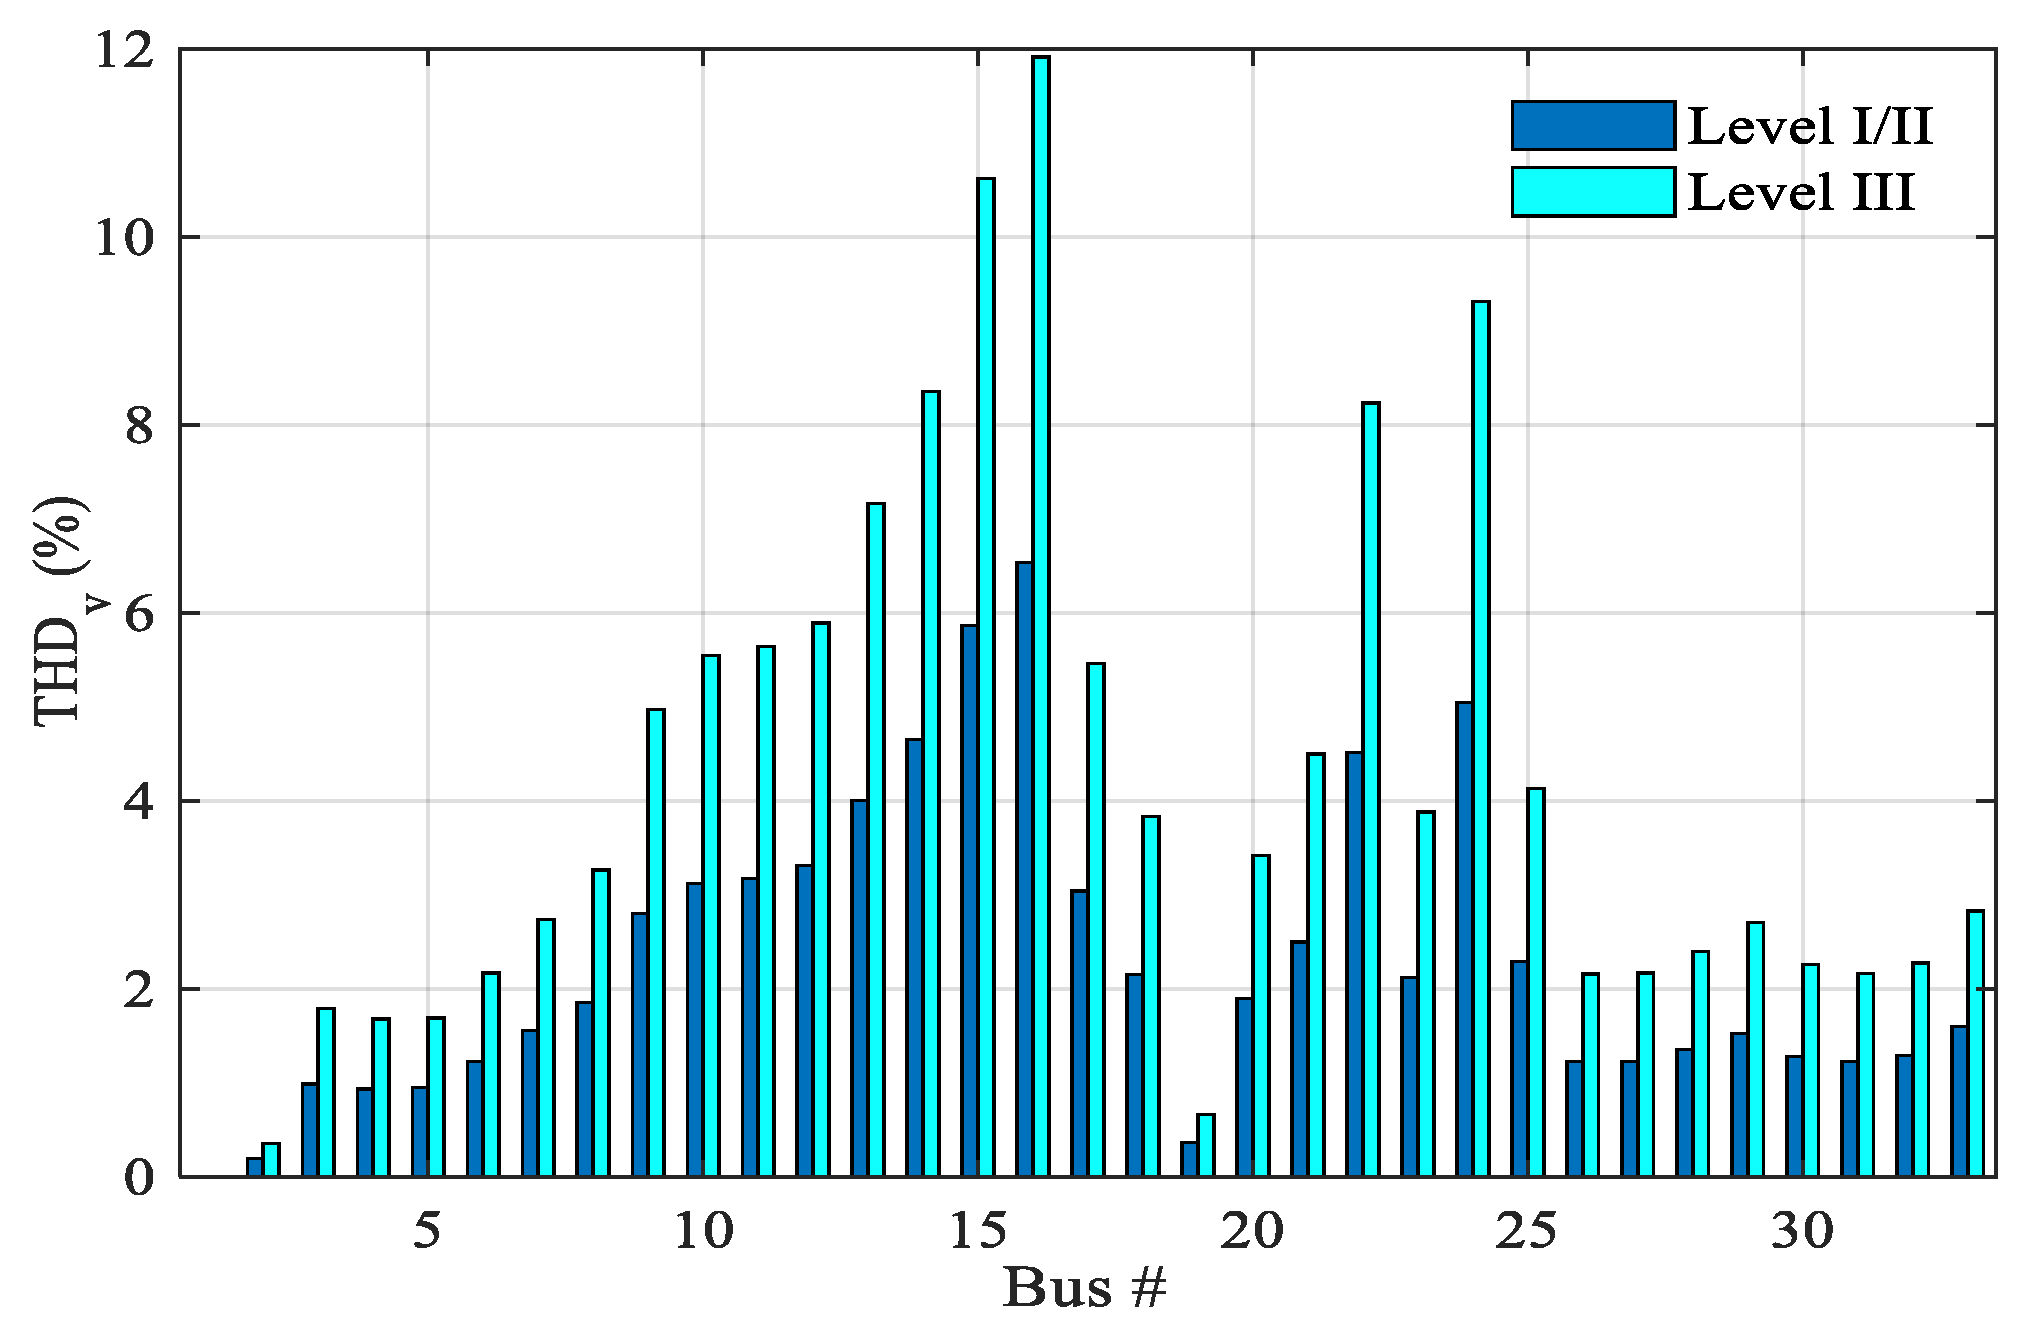
Figure 7 demonstrates the voltage THD at all buses for Level I/II and Level III chargers. The highest voltage THDs occurred at the EV buses. Besides those of EV buses, the voltage THDs of buses 10–14 and 17 violated the 5% standard limit, specified in [26], when using Level III chargers. With regards to Level I/II chargers, the voltage THD exceeded 5% only at buses 15, 16 and 24. These results demonstrate that Level III chargers have higher impacts on the voltage quality as compared to Level I/II chargers.

4.4. Current Total Harmonic Distortion

EV charging can also impact the harmonic current through the distribution system, mainly through the substation transformer, thus increasing its losses and accelerating its aging. The DHPF was applied to calculate the harmonic current through the main substation transformer I s s ( h ) using the harmonic voltages of buses 1 and 2, as follows:
I s s ( h ) = y 12 ( h ) ( V 1 ( h ) V 2 ( h ) ) = Y 12 ( h ) ( V 1 ( h ) V 2 ( h ) )
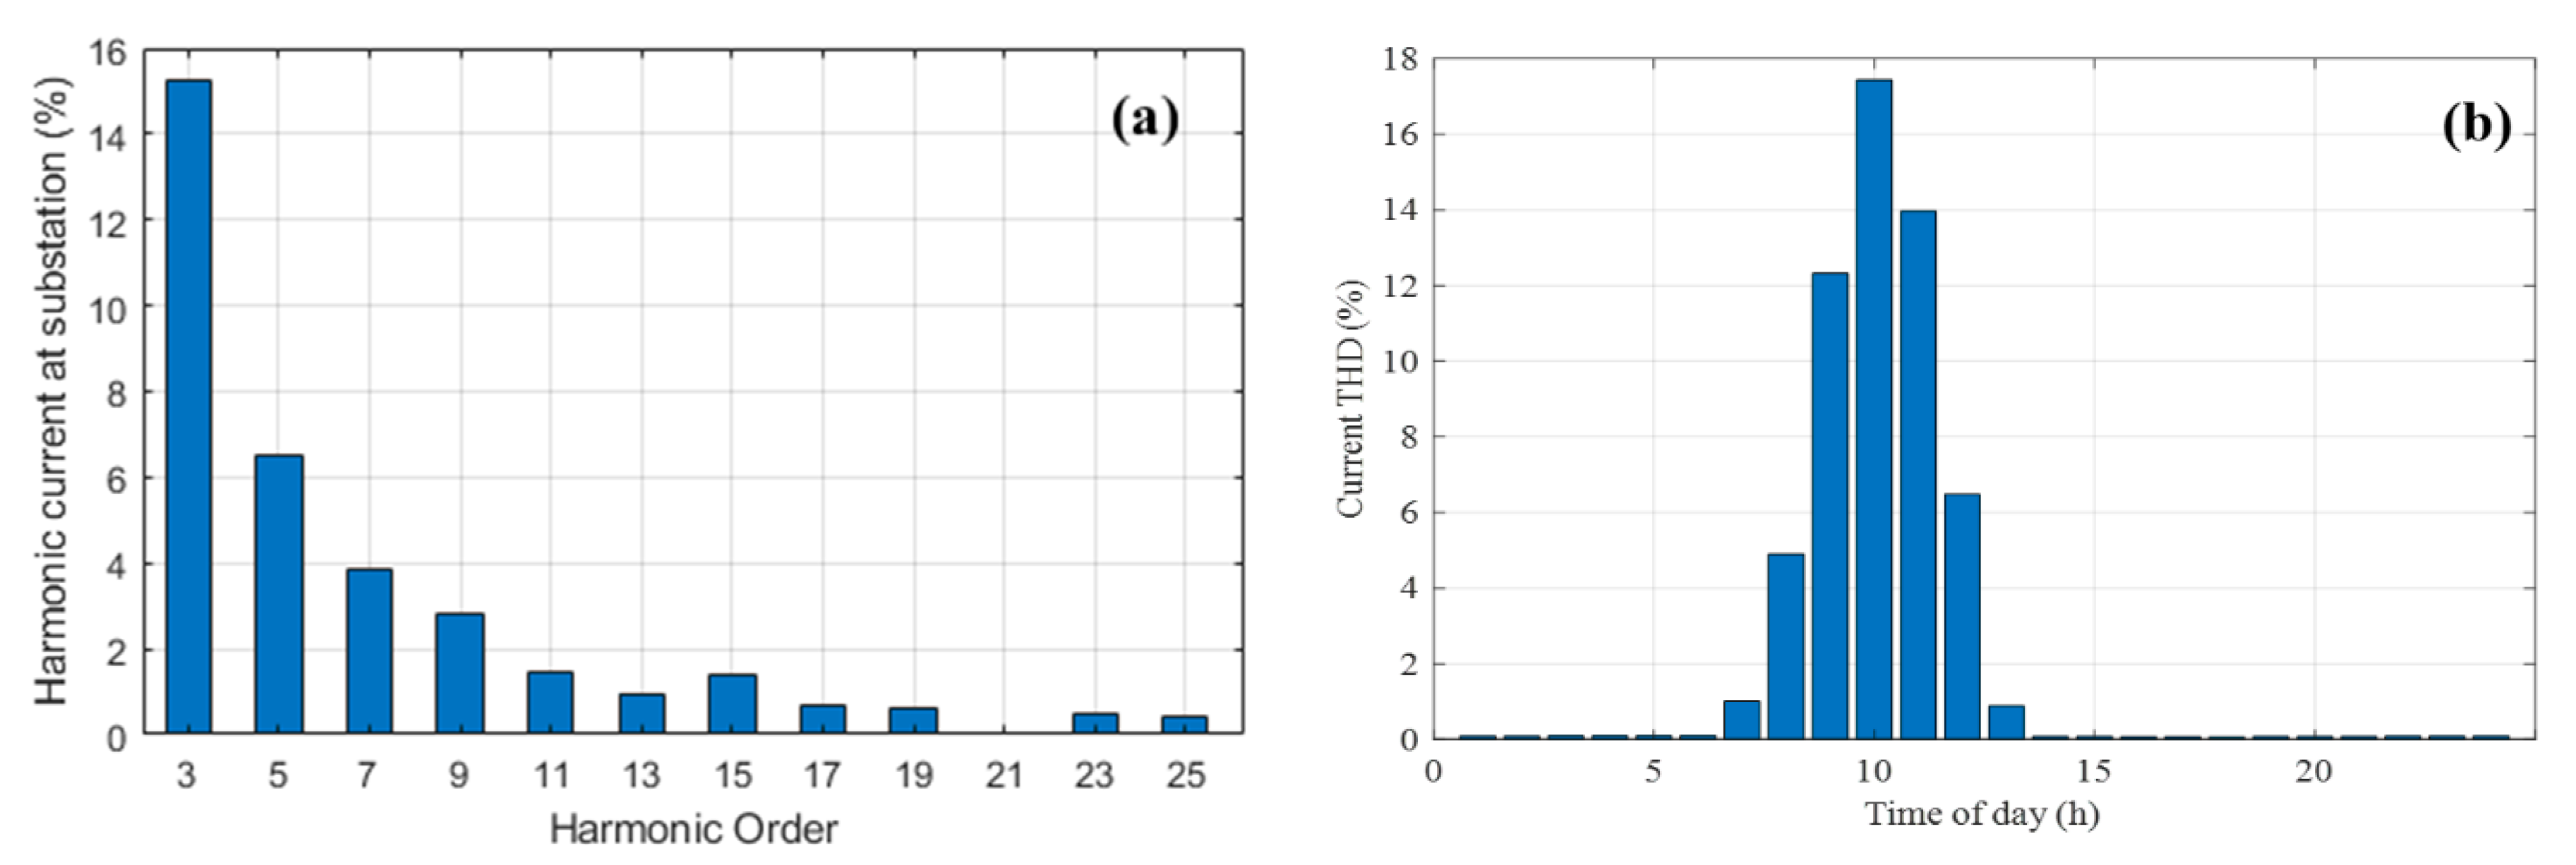
where y i j ( h ) is the admittance of the branch connecting buses 1 and 2 at harmonic order h, which is equal to Y 12 ( h ) in Y ( h ) . Figure 8a illustrates the percentage harmonic currents of I s s ( h ) at 10 a.m. It can be observed that the 3rd harmonic current was the highest among all the orders, reaching a value of 15.27%.
The current THD of I s s ( h ) was then obtained as given by
T H D I s s = h = 2 h m a x ( I s s ( h ) ) 2 I s s ( 1 ) × 100 .
T H D I s s at different times of the day are shown in Figure 8b. In this figure, it can be observed that the current THD was negligible from 1:00 p.m. until 7:00 a.m due to the tiny EV charging demand during that period. At 10:00 a.m., the current disturbance was the highest, reaching a value of 17.4%. This happens when the EV charging demand is at its peak value. Consequently, the total demand distortion (TDD), which is equivalent to the THD at the peak EV charging demand, also occurs at 10:00 a.m. According to the limits set by IEEE Std. 519 [26], the TDD limit for systems rated 120 V through 69 kV is specified as 12%.

5. Proposed Optimal Harmonic Power Flow

To compensate harmonic currents produced by EV charging stations, it is proposed to use PV-based DGs within a centralized control approach. The harmonic spectrums of the PV-based DGs were optimally determined to minimize the harmful impacts of EV on the distribution system, thus enhancing the voltage quality and elongating the lifetime of the substation transformer. The objective function was used to minimize the voltage THD of all buses, ensuring that all buses had a voltage THD lower than the standard limit, i.e., below 5%. Thus, the objective function F T H D v h i g h e s t is given by
F T H D v h i g h e s t = min T H D v h i g h e s t
where T H D v h i g h e s t denotes the highest voltage THD among all buses in the distribution system. This objective function was subject to the following equality and inequality constraints.

5.1. Equality Constraints

5.1.1. Fundamental Power Flow Constraints

The real and reactive power balance constraints at the fundamental frequency for each bus i should satisfy (11) and (12).

5.1.2. Harmonic Power Flow Constraints

At all harmonic orders, the nodal equations that are given by (19) and solved using the DHPF should be satisfied. The proposed centralized controller sets the harmonic currents of PV-based DGs to compensate those of EV charging stations. Therefore, the control variables were the ratios between the PV harmonic currents and the fundamental component, i.e., I P V i ( h ) / I P V i ( 1 ) , where the fundamental current generated by each PV-based DG I P V i ( 1 ) was calculated using
I P V i ( 1 ) = [ P P V i + j Q P V i V i ( 1 ) ] * .
It is worth noting that at the fundamental frequency, PV-based DGs were modeled as constant power sources, where P P V i and Q P V i represented the DG active and reactive powers, respectively. The proposed method does not change the fundamental currents that form PV-DGs and EV chargers because these currents are dictated by the maximum power point tracking method (MPPTs) or the charging pattern adopted by the interfacing converters. The current source model for PV-DGs and nonlinear loads (such as EV chargers) is typically used for optimal harmonic power flow, as in [25,27,28].

5.2. Inequality Constraints

5.2.1. Bus Voltage Limits

The RMS voltage magnitude at every bus i was bounded by
V l o w | V i ( 1 ) | 2 + h = 1 h m a x | V i ( h ) | 2 V u p
where V l o w and V u p are the lower and upper voltage limits, which are equal to 0.95 pu and 1.05 pu, respectively.

5.2.2. Total Harmonic Distortion Limits

The voltage THD value at each bus i was limited by
T H D V i T H D V l i m i t
where T H D V l i m i t is the maximum permissible voltage THD set by the IEEE-519 standards and is equal to 5% [26].

5.2.3. Individual Harmonic Distortion Limits

The individual voltage harmonic distortion at every bus i was limited by the IEEE-519 standard as follows:
I H D V i ( h ) = | V i ( h ) V i ( 1 ) | × 100 I H D V ( h ) , l i m i t
where I H D V ( h ) , l i m i t is the maximum allowable voltage harmonic distortion level at harmonic order h. Similarly, the individual current harmonic distortion at each bus i should be limited, i.e.,
I H D I i ( h ) = | I i ( h ) I i ( 1 ) | × 100 I H D I ( h ) , l i m i t
where I H D I i ( h ) , l i m i t is the maximum allowable current harmonic distortion at the hth order harmonic.

5.2.4. Current Limit Constraints

The feeder capacity limits should be satisfied as given by
0 I i j I i j l i m i t
where I i j l i m i t is feeder capacity limit and is assumed to be equal to twice the feeder current during the peak load; I i j denotes the current of the feeder between buses i and j, and is given by
I i j = | Y i j ( 1 ) | × [ | V i ( 1 ) | 2 + | V j ( 1 ) | 2 2 | V i ( 1 ) | | V j ( 1 ) | cos ( δ j ( 1 ) δ i ( 1 ) ) ] 1 / 2 .
Due to the complexity of the optimal harmonic power flow, a meta-heuristic optimization approach was employed. A genetic algorithm (GA) can solve optimization problems that standard optimization algorithms cannot address with the objective function being discontinuous, non-differentiable, stochastic, or highly non-linear. In this paper, the objective function, i.e., minimizing the highest voltage THD, and some constraints, were highly nonlinear. Therefore, the optimal harmonic power flow problem was solved using a GA. The constraints were calculated based on the nodal equations in (19) and following the procedure in Figure 6. The equality constraints were used to calculate the objective function in (23); thus, they were always satisfied. To satisfy the inequality constraints, penalty factors were added to the objective function, as follows:
F T H D v h i g h e s t = min [ T H D v h i g h e s t + 10 8 × c = 1 n c x c ]
where x c denotes a binary variable that is equal to 1.0 only when constraint c is violated, and n c is the total number of inequality constraints.
It is worth mentioning that the proposed compensation method is based on a centralized approach that runs an optimization program, which can be operated by local distribution companies (LDCs). The LDCs, adopting the proposed method, should dispatch the reference values of the DG harmonic currents (i.e., decision variables) every time the optimization program is solved. Typically, optimal harmonic power flow is solved, and the control signals are dispatched every 10 min to accommodate any changes happening in the demand and generation [24].

5.3. Performance Evaluation

Level III chargers are compensated in this section since they have the worst impact on the distribution system. The optimal harmonic compensation by PV-based DGs was limited to the 9th order harmonic current. Therefore, the number of decision variables (i.e., control signals) was 12—four variables for each DG connected to bus i as given by
X i = [ I P V i ( h ) I P V i ( 1 ) ] ,    h { 3 ,   5 ,   ,   h m a x }
where X i is a decision vector for each PV-based DG. The GA algorithm returned the values of the unknown control variables resulting in minimizing the THD for voltage. These values determined the harmonic spectrum of each PV-based DG. The harmonic spectrum associated with each PV, along with the presence of EVs, resulted in the THD voltage profile at bus 16 presented in Figure 9.
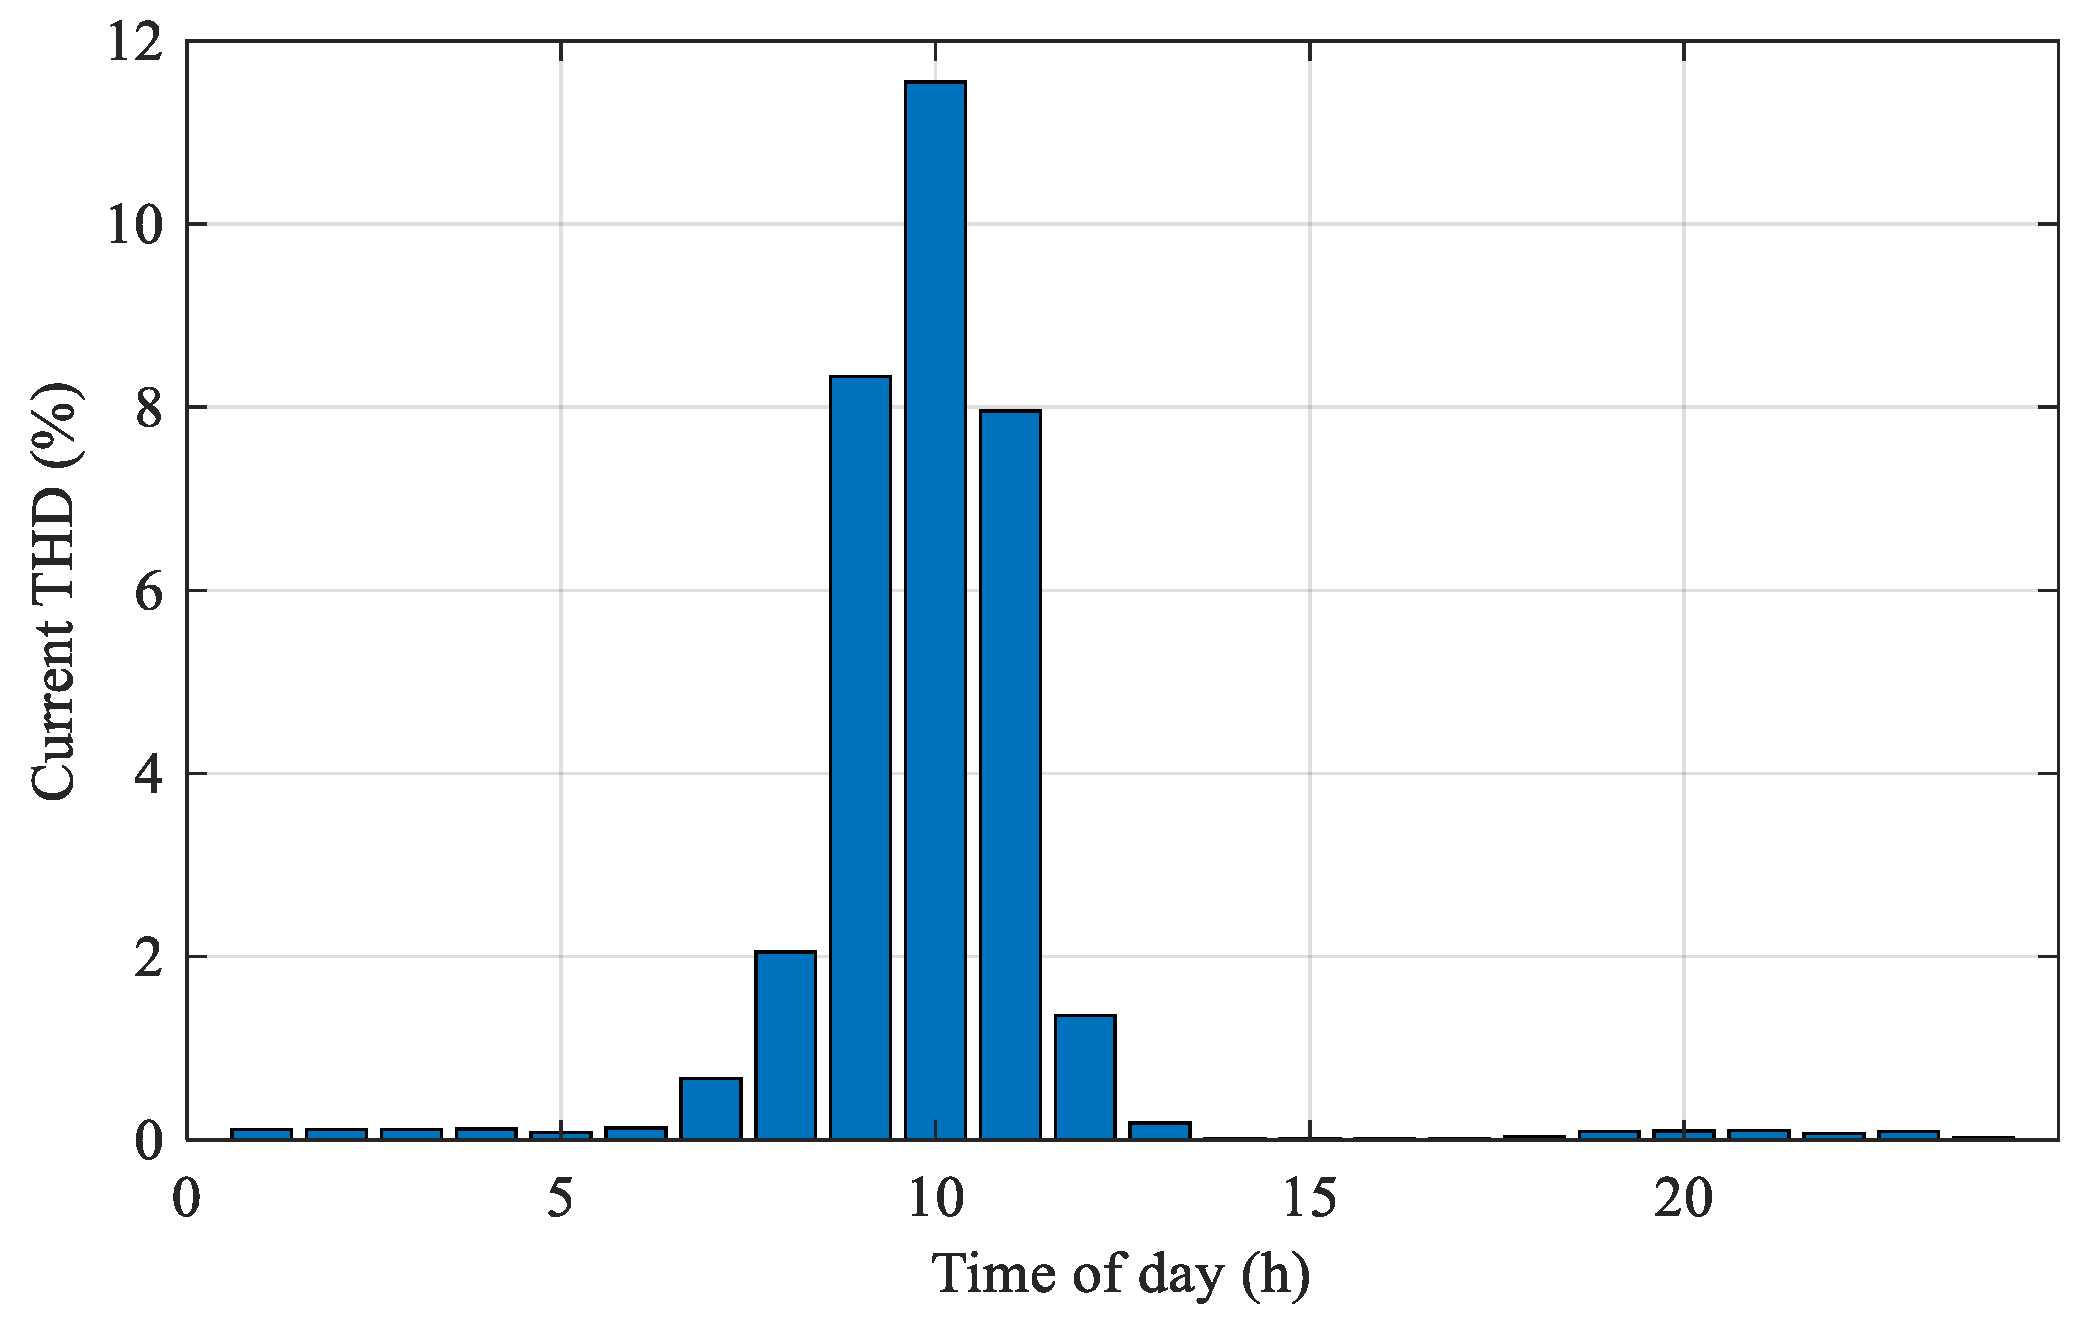
The voltage disturbance values were lower after integrating PV-based DGs. The highest value of THD reached 4.5% at 10:00 a.m. This value remained below the 5% allowable limit set by the standards. At this specific time, the proposed algorithm resulted in a reduction in THD by a factor of 2.89 as opposed to the uncompensated scenario (i.e., demonstrated in Figure 7). A similar response was noted for the current THD, as shown in Figure 10, in which, the maximum current disturbance took place at 10:00 a.m. with a value of 11.6%. This value is below the maximum current THD set in the IEEE standards. The current THD decreased to 7.96% at 11:00 a.m. and fell to 1.4% at noon.
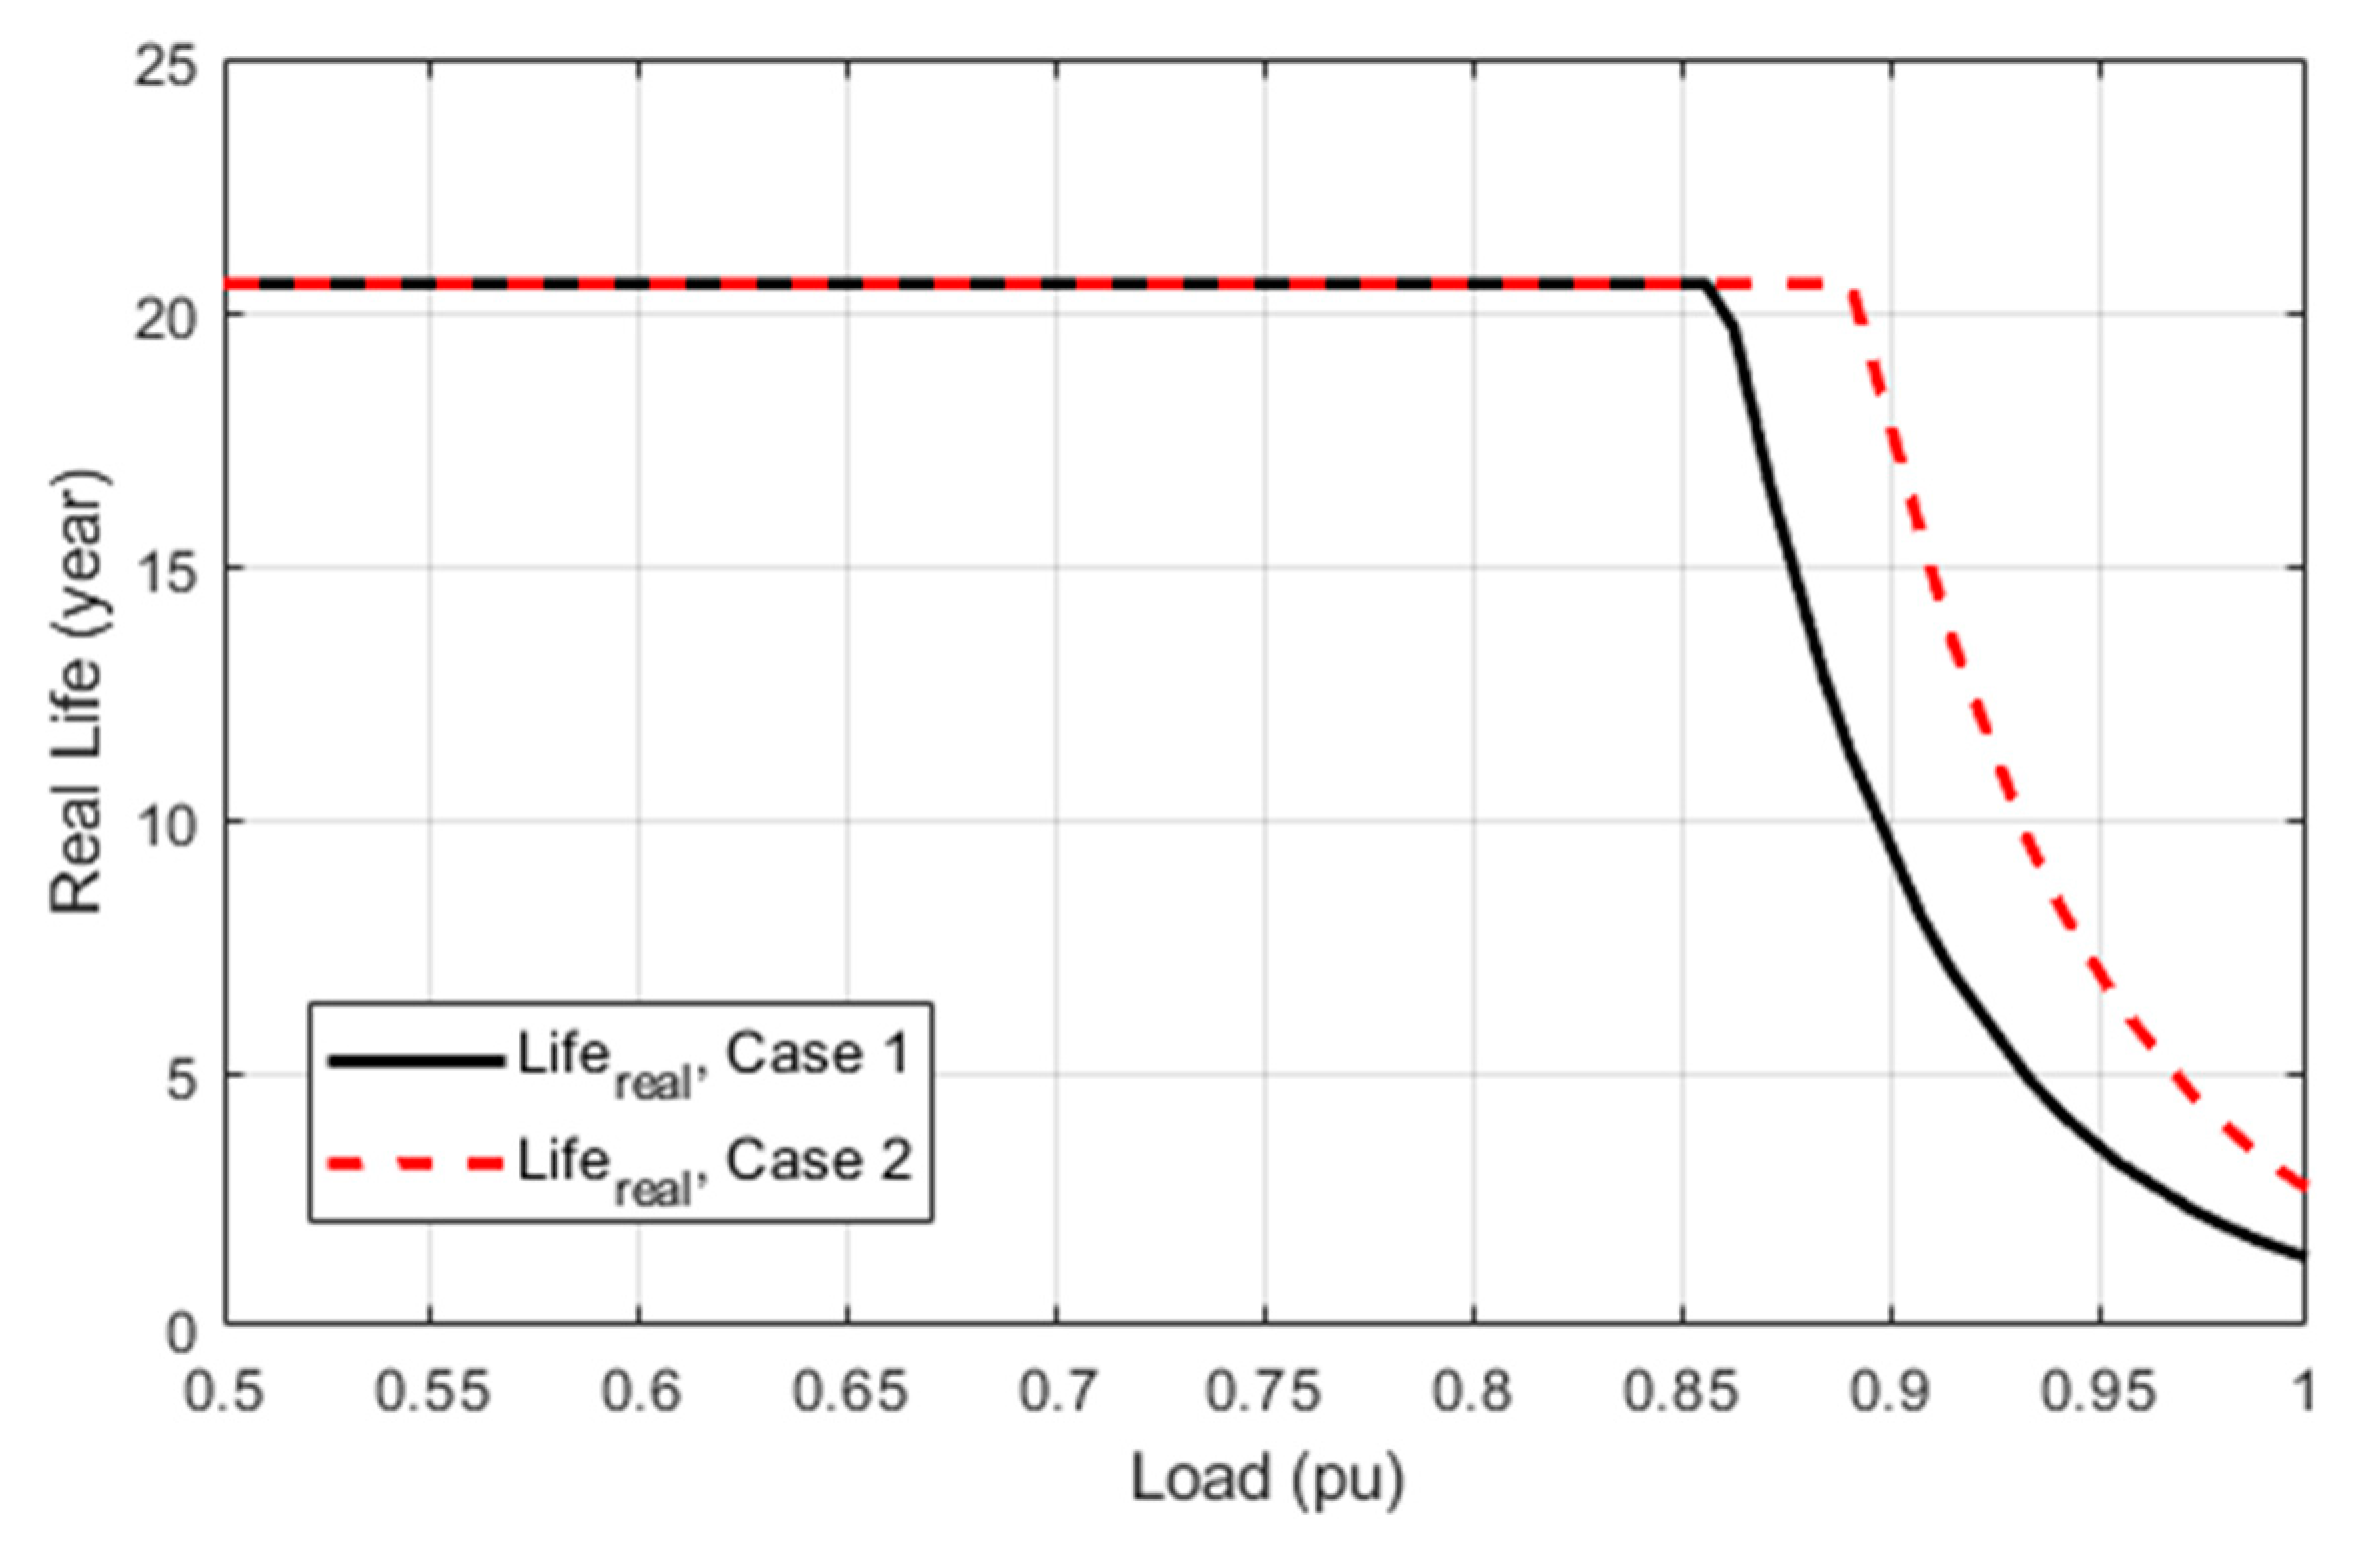
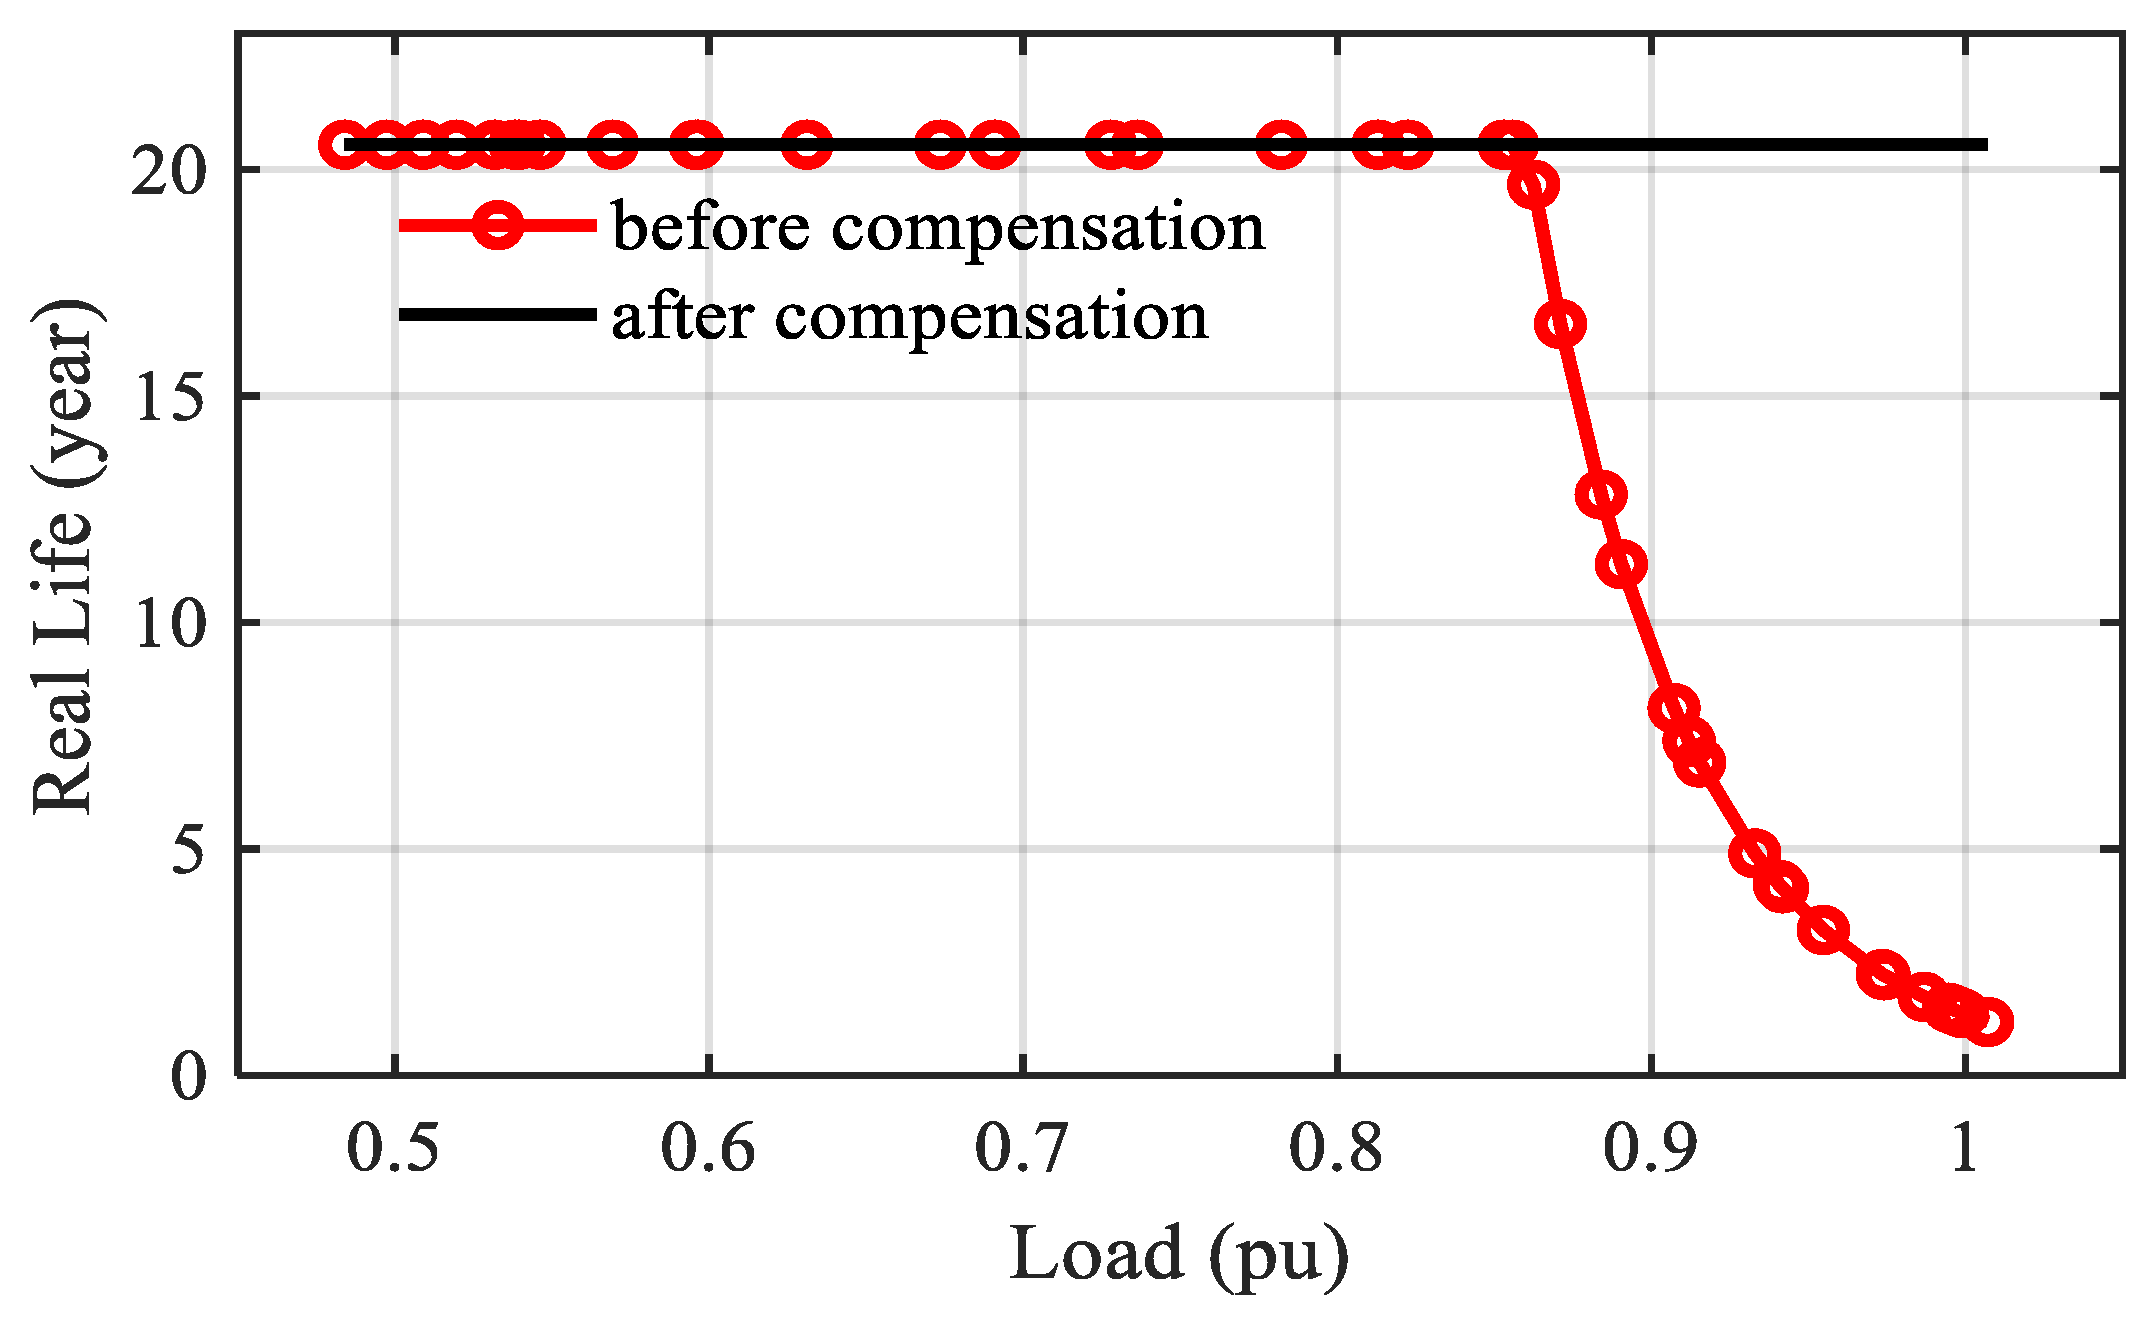
Next, the harmonic current through the substation transformer was obtained using (21) at 10:00 a.m, where the highest voltage THD was minimized. The harmonic currents through the main substation transformer could be reduced using the proposed harmonic power flow. The resultant lifetime of the distribution transformer was obtained and is displayed in Figure 11. Integrating PV-based DGs into the proposed harmonic power flow—by controlling the DG harmonic currents—kept the transformer lifetime intact, i.e., constant at 20.55 years, at all loading conditions. On the other hand, the uncompensated EV harmonics resulted in a significant decrease in the transformer’s lifetime, which was—for instance—below ten years at 90% loading.

6. Conclusions

Impacts of EV battery charging on distribution systems are assessed. The first phase of the assessment is performed at the EV interfacing transformer. A study is conducted involving the current harmonic distribution of various charging levels to understand the impacts associated with the users’ charger choice. Weighted arithmetic mean is applied to consider the effect of the SOC on the harmonic currents of EV chargers. The assessment is then extended to the system level, where case studies are performed on the IEEE 33-bus test system. A DHPF technique is applied to measure the system distortion resulting from EV charging. Optimal harmonic power flow is proposed to determine the optimal dispatch of the harmonic currents from PV-based DGs to mitigate the adverse impacts of EV harmonic currents. As a result, the highest voltage THD does not exceed 5%, which complies with the standard limit. The reduced harmonic current flow through the distribution system could also reduce the harmonic current distortion through the main substation transformer, and thus, reducing its losses and elongating its lifetime.

Author Contributions

Conceptualization, M.A. and N.K.; Methodology, D.A., M.A. and N.K.; Software, D.A.; Validation, D.A.; Analysis, D.A.; Investigation, D.A.; Resources, M.A. and N.K.; Data Curation, D.A.; Writing—Original Draft Preparation, D.A. and M.A.; Writing—Review & Editing, M.A. and D.A.; Visualization, D.A.; Supervision, M.A. and N.K.; Project Administration, M.A. and N.K.; Funding Acquisition, M.A. and N.K. All authors have read and agreed to the published version of the manuscript.

Funding

This research was funded through the Natural Sciences and Engineering Research Council of Canada Discovery Grants (NSERC-DGs) of M.A. and N.K.

Conflicts of Interest

The authors declare no conflict of interest.

References

  1. Li, Y.; Xie, K.; Wang, L.; Xiang, Y. The impact of PHEVs charging and network topology optimization on bulk power system reliability. Electr. Power Syst. Res. 2018, 163, 85–97. [Google Scholar] [CrossRef]
  2. Kazerooni, M.; Kar, N.C. Impact analysis of EV battery charging on the power system distribution transformers. IEEE Int. Electr. Veh. Conf. IEVC 2012. [Google Scholar] [CrossRef]
  3. Bass, R.; Zimmerman, N. Impacts of Electric Vehicle Charging on Electric Power Distribution Systems. Oregon Transp. Res. Educ. Consort. 2013. [Google Scholar] [CrossRef]
  4. di Paolo, M. Analysis of harmonic impact of electric vehicle charging on the electric power grid, based on smart grid regional demonstration project-Los angeles. IEEE Green Energy Smart Syst. Conf. 2018. [Google Scholar] [CrossRef]
  5. Rutherford, M.J.; Yousefzadeh, V. The impact of electric vehicle battery charging on distribution transformers. Conf. Proc.-IEEE Appl. Power Electron. Conf. Expo.-APEC 2011. [Google Scholar] [CrossRef]
  6. Gray, M.K.; Morsi, W.G. On the impact of single-phase plug-in electric vehicles charging and rooftop solar photovoltaic on distribution transformer aging. Electr. Power Syst. Res. 2017. [Google Scholar] [CrossRef]
  7. Argade, S.; Aravinthan, V.; Jewell, W. Probabilistic modeling of EV charging and its impact on distribution transformer loss of life. IEEE Int. Electr. Veh. Conf. IEVC 2012. [Google Scholar] [CrossRef]
  8. Taci, M.S.; Sarul, M.H.; Yildirmaz, G. The effects of the harmonic components upon transformer active losses in case of (non)sinusoidal sources and (non)linear loads. IEEE Int. Conf. Ind. Technol. 2000. [Google Scholar] [CrossRef]
  9. Leou, R.C.; Su, C.L.; Lu, C.N. Stochastic analyses of electric vehicle charging impacts on distribution network. IEEE Trans. Power Syst. 2014, 29, 1055–1063. [Google Scholar] [CrossRef]
  10. Leemput, N.; Geth, F.; van Roy, J.; Delnooz, A.; Buscher, J.; Driesen, J. Impact of electric vehicle on-board single-phase charging strategies on a flemish residential grid. IEEE Trans. Smart Grid 2014, 5, 1815–1822. [Google Scholar] [CrossRef]
  11. Standard EN 50160 Voltage Characteristics in Public Distribution Systems. Available online: http://copperalliance.org.uk/uploads/2018/03/542-standard-en-50160-voltage-characteristics-in.pdf (accessed on 22 July 2019).
  12. Shafiee, S.; Fotuhi-Firuzabad, M.; Rastegar, M. Investigating the impacts of plug-in hybrid electric vehicles on power distribution systems. IEEE Trans. Smart Grid 2013, 4, 1351–1360. [Google Scholar] [CrossRef]
  13. Karakitsios, I.; Karfopoulos, E.; Hatziargyriou, N. Impact of dynamic and static fast inductive charging of electricvehicles on the distribution network. Electr. Power Syst. Res. 2016, 140, 104–115. [Google Scholar] [CrossRef]
  14. Dubey, A.; Santoso, S. Electric Vehicle Charging on Residential Distribution Systems: Impacts and Mitigations. IEEE Access 2015, 3, 1871–1893. [Google Scholar] [CrossRef]
  15. Sarker, M.R.; Olsen, D.J.; Ortega-Vazquez, M.A. Co-Optimization of Distribution Transformer Aging and Energy Arbitrage Using Electric Vehicles. IEEE Trans. Smart Grid 2017, 8, 2712–2722. [Google Scholar] [CrossRef]
  16. Obulesu, Y.P.; Reddy, M.V.; Kusumalatha, Y. A %THD analysis of industrial power distribution systems with active power filter-case studies. Int. J. Electr. Power Energy Syst. 2014, 60, 107–120. [Google Scholar] [CrossRef]
  17. Munir, S.M.; Li, Y.W. Residential distribution system harmonic compensation using PV interfacing inverter. IEEE Trans. Smart Grid 2013, 4, 816–827. [Google Scholar] [CrossRef]
  18. Bighash, E.Z.; Sadeghzadeh, S.M.; Ebrahimzadeh, E.; Blaabjerg, F. Adaptive-harmonic compensation in residential distribution grid by roof-top PV Systems. IEEE J. Emerg. Sel. Top. Power Electron. 2018, 6, 2098–2108. [Google Scholar] [CrossRef]
  19. IEEE. C57.110-2008-IEEE Recommended Practice for Establishing Liquid-Filled and Dry-Type Power and Distribution Transformer Capability When Supplying Nonsinusoidal Load Currents. Available online: https://standards.ieee.org/standard/C57_110-2008.html (accessed on 22 July 2019).
  20. Samesima, M.I.; Resende, J.W.; Araujo, S.C.N. Analysis of transformer loss of life driving nonlinear industrial loads by the finite elements approach. IEEE 2002, 3, 2175–2179. [Google Scholar] [CrossRef]
  21. IEEE. IEEE Std C57.91TM-2011 (Revision of IEEE Std C57.91-1995) Guide for Loading Mineral-Oil-Immersed Transformers and Step-Voltage Regulators; IEEE: Piscataway, NJ, USA, 2012. [Google Scholar]
  22. Said, D.M.; Nor, K.M.; Majid, M.S. Analysis of distribution transformer losses and life expectancy using measured harmonic data. Int. Conf. Harmon. Qual. Power 2010. [Google Scholar] [CrossRef]
  23. Baran, M.F. Network Reconfiguration in Distribution Systems for Loss Reduction and Load Balancing. IEEE Trans. Power Deliv. 1989, 4, 1401–1407. [Google Scholar] [CrossRef]
  24. Azzouz, M.A.; Shaaban, M.F.; El-Saadany, E.F. Real-Time Optimal Voltage Regulation for Distribution Networks Incorporating High Penetration of PEVs. IEEE Trans. Power Syst. 2015, 30, 3234–3245. [Google Scholar] [CrossRef]
  25. Pandi, V.R.; Zeineldin, H.H.; Xiao, W. Determining optimal location and size of distributed generation resources considering harmonic and protection coordination limits. IEEE Trans. Power Syst. 2013, 28, 1245–1254. [Google Scholar] [CrossRef]
  26. Society, E. IEEE Std 519-2014 (Revision of IEEE Std 519-1992), IEEE Recommended Practice and Requirements for Harmonic Control in Electric Power Systems. IEEE Std 519-2014 2014. [Google Scholar] [CrossRef]
  27. Sakar, S.; Balci, M.E.; Aleem, S.H.E.A.; Zobaa, A.F. Integration of large-scale PV plants in non-sinusoidal environments: Considerations on hosting capacity and harmonic distortion limits. In Renewable and Sustainable Energy Reviews; Elsevier Ltd.: Amsterdam, The Netherlands, 2018; Volume 82, pp. 176–186. [Google Scholar] [CrossRef] [Green Version]
  28. HassanzadehFard, H.; Jalilian, A. Optimal sizing and location of renewable energy based DG units in distribution systems considering load growth. Int. J. Electr. Power Energy Syst. 2018, 101, 356–370. [Google Scholar] [CrossRef]
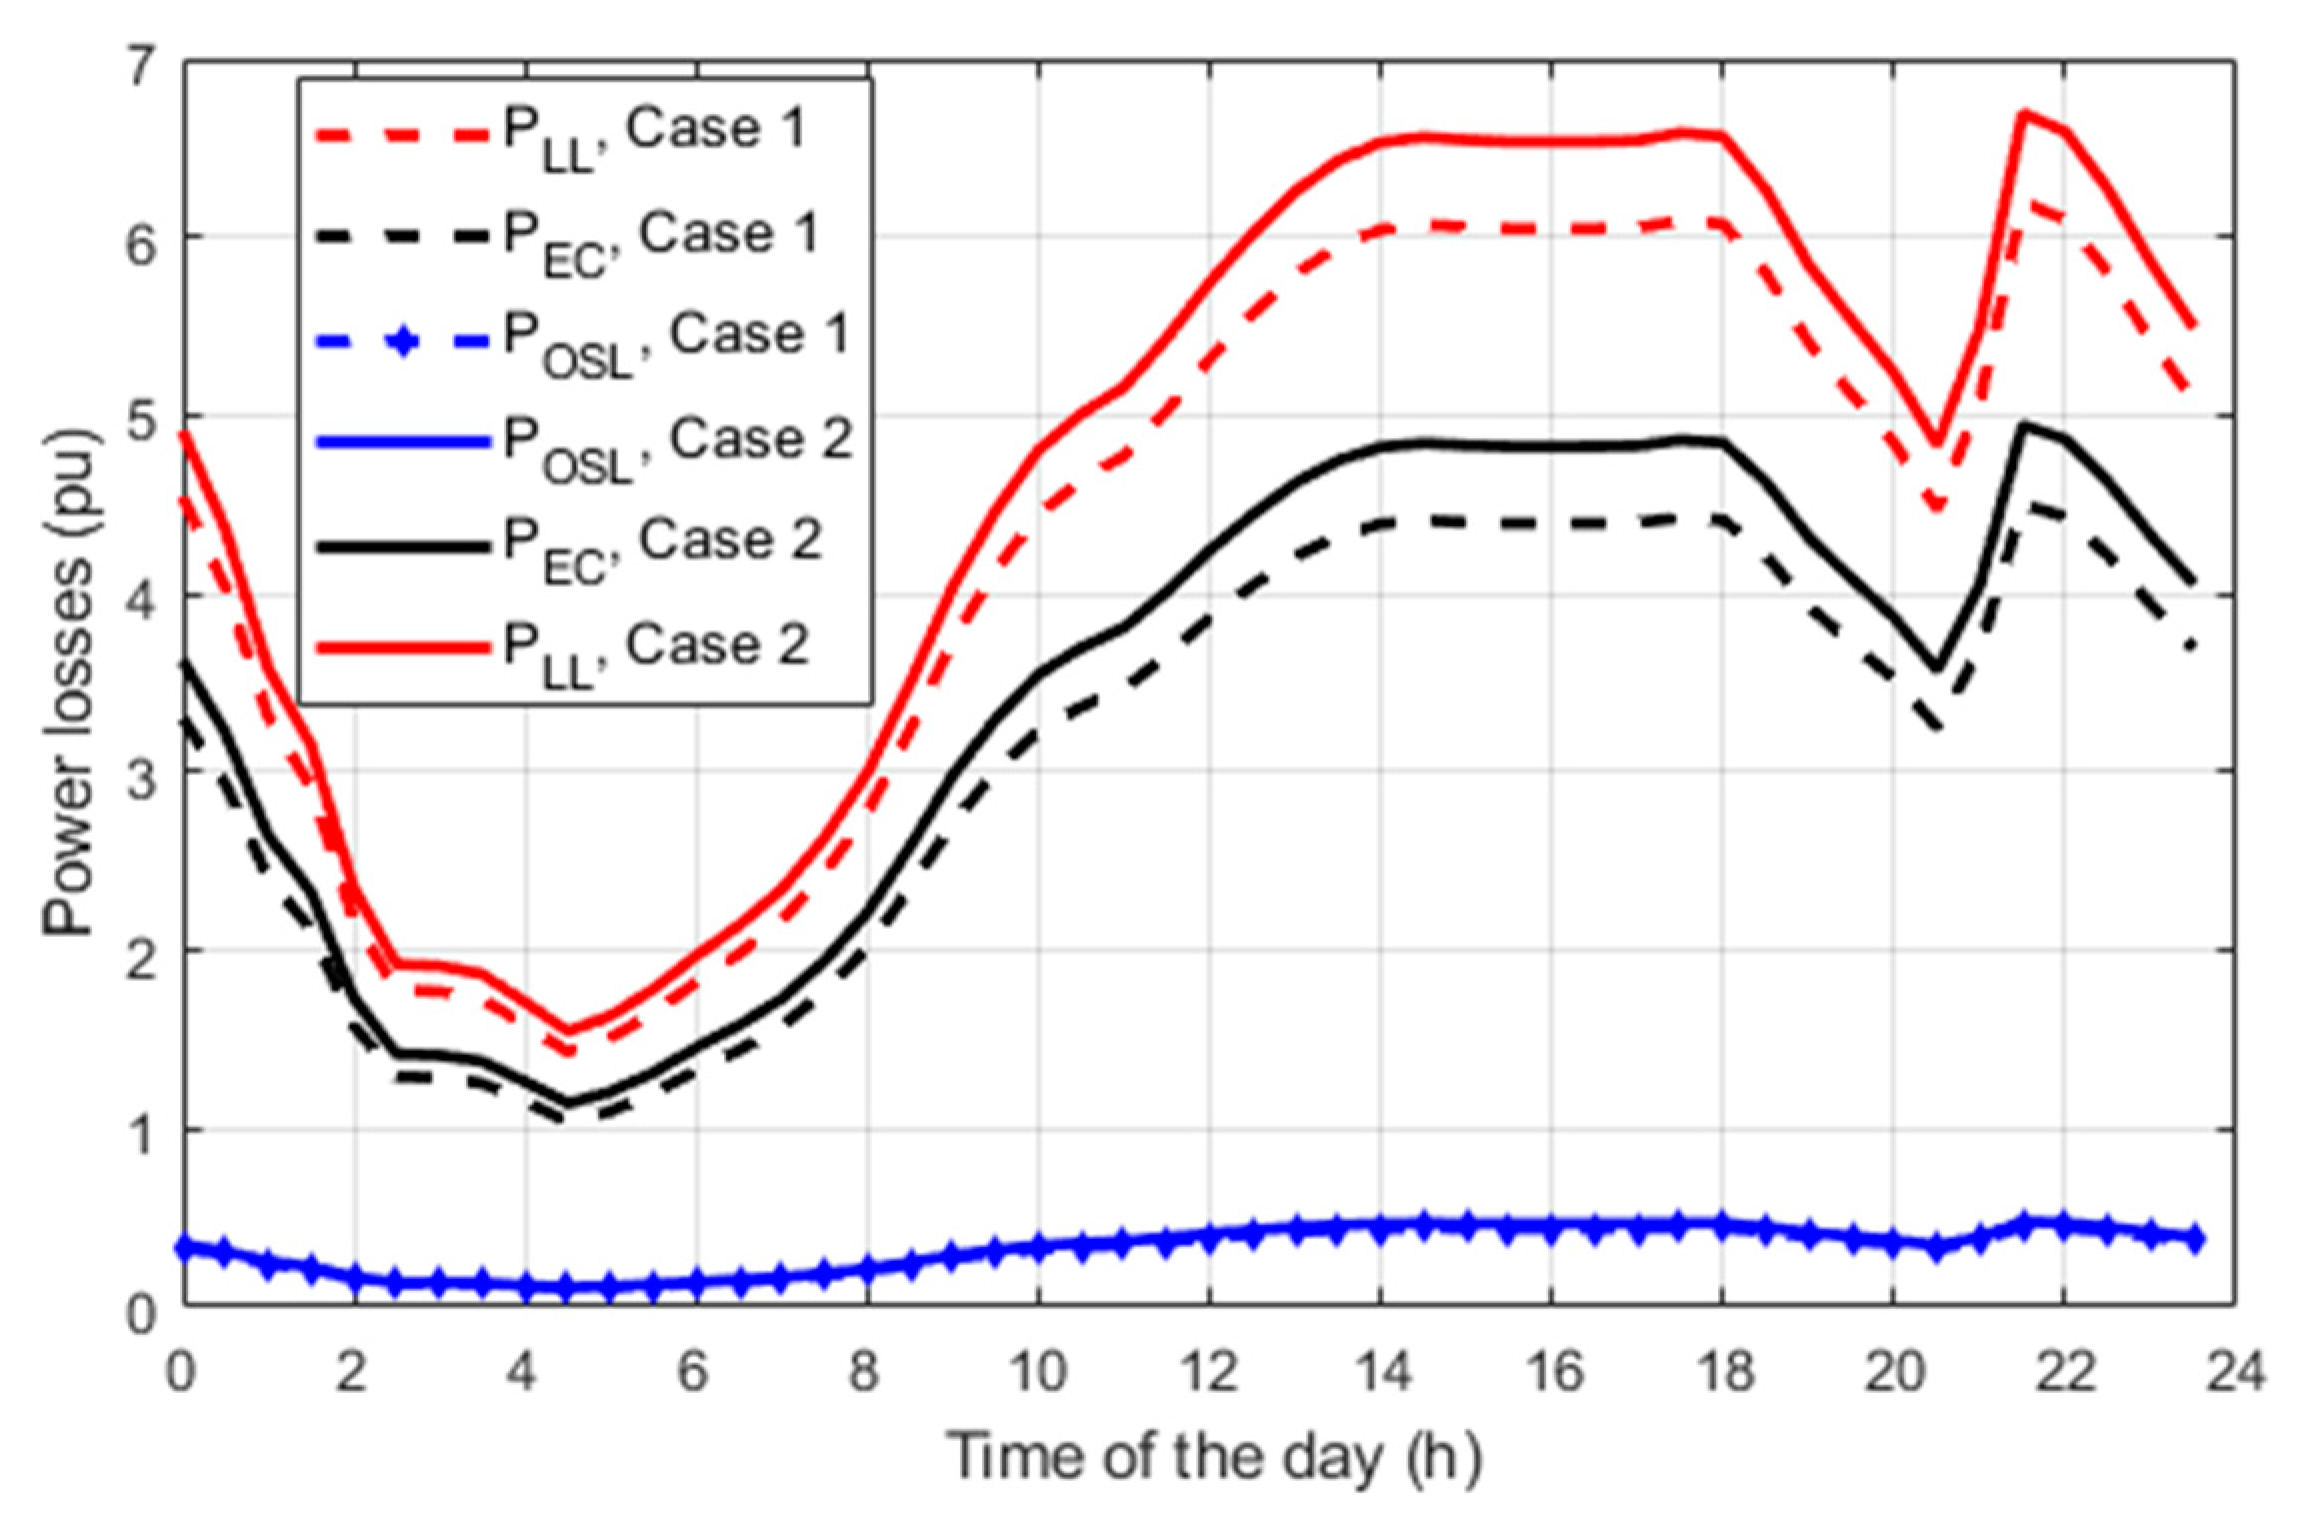
Figure 1. Load loss, winding eddy-current loss, and other stray loss due to Level I/II charging and Level III charging.
Energies 13 03257 g001
Figure 2. Aging acceleration factor due to Level I/II charging and Level III charging.
Energies 13 03257 g002
Figure 3. Transformer lifetime in Cases 1 and 2.
Energies 13 03257 g003
Figure 4. The IEEE 33-bus radial distribution system with electric vehicle (EV) charging stations and photovoltaic (PV)-based distribution generation units (DGs).
Energies 13 03257 g004
Figure 5. Daily power profiles for different load types.
Energies 13 03257 g005
Figure 6. Flowchart of the DHPF technique.
Energies 13 03257 g006
Figure 7. Total harmonic distortion (THD) for voltage at maximum loading condition.
Energies 13 03257 g007
Figure 8. Current distortion through the main substation transformer: (a) harmonic currents at t = 10:00 a.m., (b) current THD daily profile.
Energies 13 03257 g008
Figure 9. THD for voltage after PV compensation.
Energies 13 03257 g009
Figure 10. THD for current after PV compensation.
Energies 13 03257 g010
Figure 11. Transformer real-life before and after PV compensation.
Energies 13 03257 g011
Table 1. Characteristics of a sample 1500 kVA distribution transformer.
CharacteristicRated Value
Power1500 kVA
No Load Loss1600 W
Copper Loss6250 W
Eddy Current Loss3216 W
Other Stray Loss1584 W
Winding Temperature Rise65 °C
Ambient Temperature30 °C
Normal Insulation Life180,000 h
Table 2. Total harmonic distortion of level I/II chargers at various charging periods.
hCharging Time ( t i , minutes)
346617994102
I h I 1 (%)30.271.762.042.452.3311.16
51.621.562.011.832.1211.87
72.181.350.951.190.95.03
90.530.770.650.951.565.98
Table 3. Total harmonic distortion of a single phase level III charger at various charging periods.
hCharging Time ( t i , minutes)
717
I h I 1 (%)32.846.61
52.966.27
71.814.75
92.284.65