Article

Power Resilience Enhancement of a Residential Electricity User Using Photovoltaics and a Battery Energy Storage System under Uncertainty Conditions

by
Nallapaneni Manoj Kumar
1,
Aritra Ghosh
2,3,* and
Shauhrat S. Chopra
1,*
1
School of Energy and Environment, City University of Hong Kong, Kowloon, Hong Kong
2
Environment and Sustainability Institute, University of Exeter, Penryn, Cornwall TR10 9FE, UK
3
College of Engineering, Mathematics and Physical Sciences, Renewable Energy, University of Exeter, Cornwall TR10 9FE, UK
*
Authors to whom correspondence should be addressed.
Energies 2020, 13(16), 4193; https://doi.org/10.3390/en13164193
Submission received: 30 June 2020 / Revised: 7 August 2020 / Accepted: 10 August 2020 / Published: 13 August 2020
(This article belongs to the Special Issue Assessment of Photovoltaic-Battery Systems)

Abstract

:
Even in today’s modern electric grid infrastructure, the uncertainty in the power supply is more often seen and is mainly due to power outages. The reasons for power outages might be any of the following: extreme weather events, asset failure, natural disasters, power surges, acute accidents, and even operational errors by the workforce. Such uncertain situations are permitting us to think of it as a resilience problem. In most cases, the power outages may last from a few minutes to a few weeks, depending on the nature of the resilience issue and the power supply system (PSS) configuration. Therefore, it is imperative to understand and improve the resilience of a PSS. In this paper, a four-component resilience framework is proposed to study and compare the resilience of three different PSS configurations of residential electricity users (REUs) considering the realistic power outage conditions in the humid subtropical ecosystem. The proposed PSS configurations contain electric grid (EG), natural gas power generator (NGPG), battery energy storage (BES), and photovoltaics (PV) as the assets. The three PSS configurations of a REUs are EG + BES, EG + NGPG + BES, and EG + PV + BES, respectively, and in these, one REU is only the consumer and the other two REUs are prosumers. By using the proposed framework, simulations are performed on the three PSS configuration to understand the increasing load resiliency in the event of a power outage. Also, a comparative techno-economic and life cycle based environmental assessment is performed to select the most resilient PSS configuration among the EG + BES, EG + NGPG + BES, and EG + PV + BES for an REU. From the results, it was established that EG + PV + BES configuration would enhance the power resilience of an REU better than the other two PSS configurations. Besides, it is also observed that the identified resilient PSS configuration is cost-effective and environmentally efficient. Overall, the proposed framework will enable the REUs to opt for the PSS configuration that is resilient and affordable.

Graphical Abstract

1. Introduction

In general, the conventional electric grid is a centralized system that connects the power output from many fossil and non-fossil fuel-based power plants to one and transmits the power steadily to electricity users. The most commonly seen electricity users are residential ones. The electric grid (EG) transmits power from remote areas (where the power plants are located) over a long distance to the residential electricity demand centers. This allows power flow only in one direction from high voltage to a low voltage level, and then it is distributed to the electricity consumers, who are typically called residential electricity users (REUs), but in today’s trend, the role of renewable energy (RE) has become very crucial in EG. RE, in most cases, is localized, and the power generation capacities vary from small to megawatt-scale. In most cases, the generated voltages from the RE-based power plants are small relative to those of conventional power plants. Even though RE-based power plants are feasible for local power generation, their integration into a large and highly centralized grid poses a limitation to their use and overall, it is understood that this is challenging [1]. This is due to the frequent fluctuation and, as a result, frequent loss of generation occasioned by the intermittent nature and variability of RE. Besides, it is further compounded by the reverse power flow that may occur in a conventional EG that was originally designed to allow power flow only in one direction, but later, with the advancements seen in distributed energy resources (DERs) and grid integration regulations, the deployment of RE into EG has become a feasible option [1,2]. Today, the trend for the use of DERs, particularly RE for electric power generation both at the off-site and on-site load centers, has increased exponentially across the globe. The growth in RE use is due to the need for decarbonization in the power sector. Besides, environmental friendliness and energy security, as well as consistent improvement in technology and falling cost of RE are also favoring this growth [3].
Now with the support of DERs and other improvements seen in energy-related technologies like power electronics and power system control and operations, the conventional EG has taken a paradigm shift towards modernization. Even after modernization, the EG continues to experience uncertainties that directly or indirectly affect the energy consumption patterns of REUs [4]. The uncertainty in supplying power to REUs is more often seen and is mainly due to power outages. The reasons for power outages might be any of the following: extreme weather events, asset failure, natural disasters, power surges, acute accidents, and even the operational errors by the workforce [5]. Such uncertain situations are permitting us to think of this as a resilience problem. In most cases, the power outages may last from a few minutes to weeks, depending on the nature of the resilience issue and the power supply system (PSS) configuration. Thus, the power outage situations result in the complete unavailability of the power to REUs. From the resilient PSS point of view during the power outages, power availability has to be ensured, and it can be done in many ways.
Indeed, there are numerous ways to understand resilience, and these would depend on the nature of the system. Recent studies, for this reason, have called for engineering greater resilience especially in the power and other industrial systems. A few studies have employed network analysis to understand the resilience and sustainability of industrial symbiosis system that facilitates energy, water and material flows [6,7]. The network analysis is further extended and applied in few critical infrastructures in the United States of America (USA) and United Kingdom (UK) (for e.g.,: energy resources and power sector, information technology and communication, finance, healthcare and public health, transportation, and food and agriculture) to understand the implications of interconnectedness and interdependencies on resilience [8,9]. But when it comes to power sector, metrics-based approaches are used [10]. More often the mitigation strategies for enhancing the resilience of power systems are based on short term and long-term measures adopted [11].
However, in the literature, many authors have varying opinions on the way to ensure resilience, and it is often considered as an issue of reliability. Few studies exist in the literature where researchers have discussed the difference between reliability and resilience of the power supply system (PSS). Reliability more often deals with component failure, but the resilience of PSS is different, and it often deals with the capability of a PSS to sustain and bounce back to normal operation after any unseen or unexpected uncertainty [12]. This means the resilience assessment admits the possibility of PSS failure and focuses on its recovery and adaptation, thereby ensures continuous power supply to the REUs. The U.S. National Academy of Sciences defines resilience as the ability to plan for, recover from, and adapt to adverse events over time [13], but the most recent definition of resilience from the literature is the ability of a system to sustain, to rapidly recover, and learn to adapt its structure to unexpected disruptive events [14]. Based on the above definitions of resilience, it is clear that, for any sought of disruption, the PSS should be able to recover soon and provide the power to REUs, but ensuring resilience is quite difficult with a conventional PSS. Even with modern electricity infrastructure, the disruptive events are still occurring, and resilience is a big question. For instance, irrespective of whether a nation is developed or developing, the power outage incidents are happening across the globe. From 1960 to 2019, across the globe, thousands of power outage events were recorded, and among these, a few are very massive events that lasted for more than a month. In Figure 1, a heat map showing the locations where power outages events have occurred across the globe is indicated [15].
From the heat map shown in Figure 1, it is understood that the USA.’s EG experiences these power outages most often. A recent study, on significant power outages across the USA, also reported the data on power outages events and the affected population [16]. A list of power outage events due to numerous resilience issues across the USA are shown in Figure 2 [17].
From Figure 2, it can be seen that the number of power outage events occurred are different for each state in the USA The least number of power outage events occurred are eight in Rhode Island, and the maximum number of power outage events occurred are 537 in California. As per the United States Department of Energy (US DoE) statistics, during one such major power outage, at least 50,000 customers have been impacted, and approximately 300 MW unplanned firm load loss is experienced [17]. Moreover, these power outages will have a significant impact on society, residential, and industrial operations. The effect would depend upon the frequency of power outage occurrence at a particular location. From Figure 2, it is clear there is a significant impact in most states of the USA, and hence there is scope for researching on improving the resilience of PSS, so that, the REUs are ensured with adequate power supply.
In order to ensure and improve the resilience of PSS, many solutions have been proposed in the literature. The most suggested and preferred solution in the literature is the use of a backup power facility, either as a storage or generation option [18]. For residential houses, microgrids are mostly recommended. For instance, a microgrid is modeled for powering 100% of electrical loads using a renewable-based power system. It is suggested that the RE-based power system is only capable of powering the houses based on the nature of resilient issues and also depends on the intensity of the power outage [19]. On the other hand, diesel generator (DG)-based studies are also presented by a few researchers, and they suggest that continuous power supply is possible during power outages [20]. Later with the advancement seen in DERs, the use of battery energy storage (BES) systems has become more popular. Few studies have shown any evidence on ensuring resilience; if the PSS configuration has the combination of BES with RE or DG based backup facilities or any RE-based hybrid configuration [21,22]. In a study conducted for the USA, for providing improved power resilience, Anderson et al. suggested the use of hybrid renewable energy-based microgrid composed of solar photovoltaics (PV), DG, and BES [22]. In addition, few studies conducted for the USA were mainly concentrated methods to assess and enhance resilience. For instance, a probabilistic method is developed to assess the resilience of the PSS considering the disruptive event caused due to a hurricane [23]. In another study, the concept of survivability through microgrids is introduced for enhancing the power resilience of PSS.
From the brief literature review, it is understood that there is a thrust to carry out research on power resilience, but so far, although many different PSS configurations have been proposed, none have been compared based on their feasibilities [24,25]. In addition, the studies related to the resilience of PSS, highlighting of the techno-economic and environmental indicators is very limited. Hence, different PSS configurations that are location-specific were proposed by considering a resilience framework embedding techno-economic and environmental indicators. These PSS configurations include; electric grid + battery energy storage, electric grid + battery energy storage + natural gas power generator, electric grid + battery energy storage + photovoltaics. The proposed resilience framework is based on being prepared, sustaining, recovery, and learning to adapt. Based on the proposed framework, realistic and meaning full indicators are explored from the techno-economic-environmental point of view. The main contributions of this manuscript are as follows:
  • A four-component resilience framework with techno-economic and environmental indicators to understand the resilience of residential electricity user (REU) power supply system (PSS).
  • A battery energy storage (BES) as a preparedness measure that is not considered in most of the literature is considered here while modeling the proposed PSS configurations.
  • The proposed three different REUs are modeled considering power outage duration as well as the electric load conditions of the New York-based residential multi-story building as a case study.
  • Evaluation of unmet and compensated electric loads for resilience comparison between the three PSS configurations of an REU.
This paper has a total of six sections; Section 2 presents the four-component resilience framework and the considered indicators; in Section 3, the description of the proposed three PSS configurations for REUs along with modeling is given; in Section 4, data collection, techno-economic and environmental modeling and simulation for the proposed three PSS configuration is shown along with control strategies. In Section 5, the results are presented, and a thorough discussion is made, and in Section 6, conclusions are provided.

2. Resilience Framework

For understanding the resilience of the PSS configuration, a well-structured framework is necessary. The proposed framework should ensure that the system can sustain, recover, and adapt to the power outages or any other disruptive events. In this study, the proposed framework has four components, namely; preparedness, robustness, recovery, and adaptation [13,14]. These four components are clearly presented and depicted in Figure 3.
From Figure 3, it is understood that the highlighted depictions of the disruptive events (Level-1 and Level-2) and the variation in PSS functionality as per the disruptive events matches the resilience definition. Each component of the proposed resilience cycle is different based on its nature, and the four components are briefly explained below:
Preparedness: This component suggests the preparedness level of the PSS configuration for power outages. Here, an assumption is made that each REU is already prepared for power outages by employing backup energy storage.
  • As a preparedness measure, battery energy storage is used.
Robustness: This component suggests the level to which the PSS configuration can sustain and will be able to supply power to REUs in the event of a power outage.
  • For understanding this component, an indicator, i.e., an increase in unmet electric load, is considered.
Recovery: This component suggests the level to which the PSS configuration was recovered and able to supply power back to the REUs.
  • Here compensated load by the PSS configuration during the event of a power outage is considered as an indicator.
Adaptation: This component suggests the level of learning by the PSS configuration based on the experienced power outages. More or less, it will give information on how the preparedness levels are improved based on the learning from previous power outages incidents.
  • The adaptation step demands the renovation and modernization of the energy infrastructure.
Here, based on the above four-component resilience cycle, and for each component, indicators were identified, which were further used as constraints during techno-economic and environmental optimization of PSS configurations. These indicators include the; unmet electric load, compensated loads, power supplied by the PSS configuration, the cost of energy, net present value, initial capital investments, and the emissions (carbon dioxide; sulfur dioxide; nitrogen oxides).

3. Power Supply System (PSS) Modelling for Residential Electricity Users (REUs)

The PSS is a network of various electrical and electronic equipments that are deployed to generate, transfer, and distribute electrical energy. A typical example of such PSS is the EG upon which most electricity users depend. Here, a case of REUs alone is considered. In the context of REUs, the examples of the PSS would fall broadly under two categories; off-grid and on-grid. Here, the PSS configurations that fall under on-grid mode is considered. This section briefly describes the considered three different PSS configurations for REUs along with the modeling.

3.1. PSS Configurations for REUs

As mentioned above, in this study, three different PSS configurations are chosen to serve the electric load demand for REUs. The considered PSS configuration has both renewable and non-renewable power generating sources, and each PSS configuration has an energy storage component. Among these three, PSS configuration, one is a consumer, and the other two are prosumers. In Figure 4, the schematic view of studied PSS for REUs is shown, and in the below subsections, the configurations are described briefly for individual REUs.
The energy governance function is shown in Equation (1), and this describes the variation in PSS functionality (as shown in Figure 3) for an REU within the specified PSS configuration:
E REU = f ( E PSS , E BES )
where, E R E U is the energy demanded by the REU in kWh; E PSS is the energy supplied by the PSS configuration in kWh; and the E BES is the energy available or supplied by the battery energy storage in kWh.

3.1.1. REU with EG + BES based PSS Configuration

In Figure 5, a PSS configuration for a REU under the consumer-only category is shown. In this PSS configuration, the REU will only consume electricity that is coming from the electric grid for operating the residential electrical loads (which means there is no on-site energy generation facility). The main equipment in this configuration are the electrical loads, power converter, BES, and EG. These components are connected in the PSS network of an REU, considering both the alternating current (AC) bus and direct current (DC) bus. The AC load bus was linked to electrical loads and EG, while the DC load bus was linked to BES. Both the AC and DC load buses were connected through the power converter. Here, the power converter is mainly used to regulate and convert the DC power outputs to AC and vice versa. From the resilience point of view, the main aim of each REU is to prepare for power outages. In this PSS configuration, the REU is already prepared for power outages. As a preparedness measure, a backup power facility employing a BES within the electricity supply network of an REU is taken.

3.1.2. REU with EG + NGPG + BES based PSS Configuration

In Figure 6, a PSS configuration for REU under the fossil fuel-based prosumer category is shown. In this PSS configuration, the REU will buy the electricity from the EG. At the same time, excess electricity produced at the facility will be sold to the EG. The conditions for buying and selling will depend on the REU and the deployed control strategy. Here, the EG is given the primary priority for serving the residential electrical loads and the BES facility. In the event of power outage condition, the electrical loads are operated through BES. If still the EG is not repaired, then the backup power generation facility will come into connection and serves the residential electrical loads.
The main equipment in this configuration are the electrical loads, power converter, BES, natural gas power generator (NGPG), and EG. These components are connected to the PSS network of an REU, considering both the AC bus and the DC bus. The AC load bus was linked to electrical loads, NGPG, and the EG, while the DC load bus was linked to BES. Both the AC and DC load buses were connected through the power converter, which is mainly used to regulate and convert the DC power outputs to AC and vice versa. From the resilience point of view, the main aim of each REU is to prepare for power outages. In this particular PSS configuration also, the REU is already prepared for power outages. As a preparedness measure, a backup power facility employing a BES and NGPG within the electricity supply network of an REU is taken.

3.1.3. REU with EG + PV + BES based PSS Configuration

In Figure 7, a PSS configuration for REU under the renewable-based prosumer category is shown. In this PSS configuration, the REU will buy the electricity from the EG. At the same time, excess electricity produced at the facility will be sold to the EG. The conditions for buying and selling will depend on the deployed control strategy. Here, the electrical loads are served by taking power from the PV system and the EG. In the event of a power outage condition, the electrical loads are operated entirely on the PV system. If there is variation in the output power produced by the PV system, then the loads are served by taking power from the BES. If still the EG is not repaired, then the backup power generation facility will come into connection and serves the residential electrical loads. The main equipment in this configuration are the electrical loads, power converter, BES, PV, and EG. These components are connected to the PSS network of an REU, considering both the AC bus and the DC bus. The AC load bus was linked to electrical loads and the EG, while the DC load bus was linked to BES directly and to the PV system through maximum power point tracking (MPPT) enabled DC-DC converter [26]. Both the AC and DC load buses were connected through the power converter, which is mainly used to regulate and convert the DC power outputs to AC and vice versa. From the resilience point of view, the main aim of each REU is to prepare for power outages. In this particular PSS configuration also, the REU is already prepared for power outages. As a preparedness measure, a backup power facility employing a BES and PV system within the electricity supply network of an REU is taken.

3.2. REUs PSS Equipment Modelling

In the above discussed three PSS configurations, they are different types of equipment related to power generation, power conversion, and energy storage. Overall, in three configurations, the main equipment are the electrical loads and EG, NGPG, PV, power converter, and BES. This section briefly dealt with the equipment modeling, and the details are given below.

3.2.1. Electrical Loads and Electric Grid (EG)

The electrical loads that consume energy are the most common type of equipment that we see in REUs. The most seen electrical loads are broadly categorized based on their nature that may be resistive, inductive, and capacitive. The typical examples of residential electrical loads are lights, fans, computers, cooking facilities, heaters, pumps, air conditioners, etc. In this study, we have considered the realistic electrical loads of a residential building located in a humid subtropical ecosystem is considered. The data related to electrical loads are obtained from the Open EI Database for load profiles [27]. The detailed load profile and its discussion is given in Section 4.
The EG that is chosen in this study is the national power grid. In general, the national power grid is a combinational network that unites the power producers and consumers. Here both the power producers and consumers are interconnected, and mostly the produced power comes from both the renewables and non-renewables. In most countries, REUs are connected to the national EG, and they assumed to have a continuous supply of energy. Although the EG suffers from the blackouts that lead to power outages at the residential level, still the residential buildings are connected to the EG. In this study, three different PSS configurations are considered, and in all the three, the EG is used.

3.2.2. Natural Gas Power Generator (NGPG)

A fossil fuel-powered generator that uses natural gas as a fuel for power generation is used as one of the backup facilities in one of the considered PSS configurations. The electrical output from the NGPG is a function of the fuel burned, and it can be estimated using Equation (2) [28]:
P NGPG = NGPG × m NG × H V NG 3.6
where, P NGPG is the electrical power output in kW; NGPG is the efficiency of the NGPG in %; m NG is the mass flow rate of the natural gas that is burned for power generation in kg/h; H V NG is the heating value of the natural gas in MJ/kg.
The mass flow rate of the natural gas in m3 is given by using Equation (3), and it is the multiplication of natural gas fuel density to the amount of fuel consumed. The natural gas fuel consumption can also be estimated using Equation (4):
m NG = ρ NG × F C NG
F C NG = ( F o × P r NGPG ) + ( F 1 × P NGPG )
where, ρ NG is the density of the natural gas fuel (kg/m3); F C NG is natural gas fuel consumption in m3/h; P r NGPG is the rated capacity of the natural gas power generator in kW; and F o and F 1 are the natural gas fuel curve intercept and slope in m3/h/kW.
The supplied energy by the natural gas power generator represented using E N G P G is given by multiplying the electrical power output with the operating time, t in h, see Equation (5).
E NGPG = t = 1 n P NGPG × t

3.2.3. Photovoltaics (PV)

In this study, the solar PV system is also used as one of the backup power generation facilities in one of the PSS configurations. In the solar PV system, the PV modules and other energy conversion devices help in converting the incident solar irradiance into useful electricity. The electrical output from the PV system is given by using Equation (6) [24,29]:
P PV = PV × PC × A PV × G PV × ( 1 + γ ( T PV T ref ) )
where, P PV is power produced from the PV system in kW; PV is the power conversion efficiency PV module in %; PC is the efficiency of the power converter in %; A PV is the area of the PV array in m2; G PV is the solar irradiance incident on the plane of the PV array in kW/m2; γ is the temperature co-efficient of the PV module; T PV is the PV module temperature in °C; and T ref is the reference temperature in °C.
The PV module temperature is one of the most crucial factors that need to be considered while modeling any sought of PV application. In the literature, mostly the nominal operating cell temperature (NOCT) model is used, which is widely accepted and can be more appropriate for open rack-mounting installations [29]. But in this study, the considered REUs have opted for rooftop PV. So accordingly for the REU with rooftop, the T PV is calculated by using the arbitrary temperature model, as shown in Equation (7) [30]:
T PV = T amb + m c ( 0.32 8.91 + 2 W s ) G PV
where, T amb is the ambient temperature in °C; m c is the mounting co-efficient; and W s is the wind speed in m/s.
The supplied energy by the photovoltaic power generation system is represented by multiplying the electrical power output with the operating time, t in h, see in Equation (8):
E PV = t = 1 n P PV × t

3.2.4. Power Converter

In this study, in all the three PSS configuration, as a preparedness measure, we have used the BES. In general, the battery stores electrical energy in the form of chemical energy, but during the charging and discharging conditions, it only operates with the direct current electricity, but the REUs use alternating current electricity, hence, to facilitate this conversion of power from DC to AC and vice versa, a power converter is used. Here, the power converter is crucial to facilitate a continuous flow of energy between the PSS and the REUs. The power flow conditions for the power converter, acting both as inverter and rectifier are modeled using Equations (9) and (10) [29,31]:
P PC _ Inv = PC _ Inv × P DC
P PC _ Rec = PC _ Rec × P AC
where P PC _ Inv is the power converter output in kW when it is acting as an inverter; P PC _ Rec is the power converter output in kW when it is acting as a rectifier; PC _ Inv and PC _ Rec are the efficiencies of the power converter in inverter and rectifier modes, respectively; P DC and P AC are the input feeds in kW for the power converter in inverter and rectifier modes, respectively.

3.2.5. Battery Energy Storage (BES)

As a preparedness measure, a backup energy storage facility using BES is considered in all the three PSS configurations. As per the resilience conditions, it is always better to be prepared for power outages, and in the event of a power outage, the BES will serve the REUs. In order to facilitate this, we allow the batteries to charge while the REU is connected to PSS configuration.
In this study, in all three configurations, the BES will be charged, which means whenever there is excess electricity in PSS, the batteries will store the excess portion and provide to the load when power outages or any sought of disruption occurs.
In BES, the conditions for charging and discharging are mostly dependent on power generation availability and REUs consumption patterns in all the three PSS configurations. These conditions are modeled using the Equations (11) and (12). Equation (11) represents the state of charge condition, and Equation (12) represents the depth of the discharge condition. In both conditions, a self-discharge rate is considered [29,32,33]:
t = 1 n E BES = t = 1 n [ ( E BES ( t 1 ) × ( 1 S dr ) ) + ( E PSS E REU ) × PC _ Inv × BES ]
t = 1 n E BES = t = 1 n [ ( E BES ( t 1 ) × ( 1 S dr ) ) + ( ( E REU × PC _ Inv ) E PSS ) ]
where E BES , E PSS , and E REU are the energy stored in a battery in kWh, energy generated by the PSS configuration in kWh, and energy required by the REU in kWh, respectively; S dr represents the self-discharging rate of the battery in %; BES is the efficiency of the BES system in %; and t is the time represented in h.

4. Data Inputs and Simulation of Proposed PSS Configurations

This section provides information regarding the data used for performing the resilience simulations and the techno-economic and environmental assessments. In addition, the simulation procedure used in PSS configurations is briefly presented.

4.1. Data Inputs

4.1.1. Electrical Load Profile

In this study, the resilience assessment of three different PSS configurations, and their techno-economic and environmental feasibility is carried out. As a case study, a multi-floor residential building located in New York, (NY, USA), that experiences humid subtropical climates is considered. The most critical data for the REUs is the electrical load’s energy consumption pattern, as shown in Figure 8. The data on energy consumption patterns are obtained from the Open EI Database for load profiles [27].
From Figure 8, it is observed that the load profile is time-dependent, with a maximum variation observed in the months (from May to October). The maximum load consumption was recorded in the month of July, making it the month of peak energy demand, which is around 59.04 kW. The observed average load is 25.4 kW, and the average daily energy required by the REU is 610.5 kWh. The estimated annual AC primary load is 222,834 kWh/y.

4.1.2. Electric Grid Power Outage and Tariff Data

Even in the days of modern electric grid infrastructure, uncertainty in the power supply is more often seen, especially in the studied location, and is mainly due to power outages. The reasons for power outages might be any of the following: extreme weather events, asset failure, natural disasters, power surges, acute accidents, and even the operational errors by the workforce. Here the studied location is New York (NY, USA). Based on the recent data article by Mukherjee et al. 2018 [16]. It is understood that the considered location has frequent power outages, and at times, power outages were last from a few minutes to weeks. Here, for carrying out the simulation study and understanding the resilience of PSS, the power outages that occurred in the year 2016 were considered [16]. In 2016, alone, three major power outage events occurred in New York, and the details are shown in Table 1.
In the USA, the electricity tariff rates vary from state to state, but when compared to other states, the REUs in New York pay 44% more for electricity than the average USA residential price [34,35]. In New York State, the average electricity tariff rate for REUs is 17.42 cents/kWh, which is roughly 0.1742 US$/kWh [34,35].

4.1.3. Power Supply Systems Equipment Cost

In this study, three different PSS configurations are simulated for understanding resilience. The proposed PSS configurations contain EG, NGPG, BES, and PV as the primary assets or the equipment. The cost details, along with the technical specifications each equipment used in PSS configuration, are given Table 2 and Table 3 respectively.

4.1.4. Data Inputs on Natural Gas Fuel and Emission Factors

In the considered three PSS configurations, in only one configuration, the NGPG is used. In this PSS configuration, natural gas is burnt to produce electricity in the event of grid failure. While modeling the study, the data related to natural gas prices specific to New York are considered. The variation trend in natural gas prices over the last 10 years in New York is shown in Figure 9.
In New York, natural gas can be purchased for an average price of 12.68$/thousand cu. ft [38]. This value is converted in $/cu.m and is around 0.44779 %/cu.m. While modelling, the data related to natural gas fuel properties are considered, and they are given in Table 4.
For the environmental assessment of the PSS configurations, the emission factors data is considered. The considered emission factors are based on life cycle assessments. As the REUs are located and connected to the national EG in New York, the EG emission factors for CO2, SO2, and NOx are considered as 287 g/kWh, 0.36 g/kWh, and 0.20 g/kWh, respectively [39]. From the literature, it was identified that a crystalline PV technology based solar module emits 55 g CO2/kWh, 0.38 g SO2/kWh, and 0.2 g NO2/kWh [40]. The BES was considered to emit 338 kg CO2/kWh based on its life cycle, in addition to CO2, the batteries SO2 emissions were 2.23 g/kWh [41]. The emissions related to NGPG are modeled within the simulation tool.

4.2. Simulation of PSS Configurations

Here, the hybrid optimization model for electric renewables (HOMER) simulation tool used to model different PSS configurations. This tool allows us to model any of the conceptual PSS configurations, along with multiple constraints. The database of this tool provides us with numerous inbuilt power conversion devices and DERs.
The simulation is carried out for the steps presented in the form of a flow chart depicted in Figure 10. The simulation has proceeded for three different PSS configurations that are discussed in the previous section. While performing the simulations, in the first step, the pre-assessment of collected residential electrical load profiles, resources such as solar irradiance and natural gas fuel, and system design is done. Here, the selection of meteorological data for the study location using the pre-built data sets is made for evaluating PV performance. After preparing the input datasets ready, the PSS configuration models are built by selecting the appropriate electric power components from the HOMER library. In a similar way, all three PSS configuration models were built.
In the second step, the resilience and techno-economic and environmental analysis is carried out. Here, while modeling each component of PSS configuration, their technical and cost parameters and optimum sizing search spaces are enabled along with the specific constraints to achieve techno-economic and environmentally feasible configuration and, at the same time, that ensures resilience. At this stage of the simulation, the power outage scenarios are applied for each PSS configuration, and the indicators considered for resilience are quantified. In addition, the sensitivity analysis is also carried out by considering the sensitive parameters in order to achieve a lower net present cost (NPC) and the cost of energy (CoE). Here, in each PSS, the applicable sensitive parameters like solar irradiance, discount rates, and natural gas prices are considered.
The cost parameters are based on the following approach: Among them, the NPC that represents the overall costs of the PSS configuration considered capital, operation, and maintenance (O & M), replacement cost, etc. for its lifetime is calculated as per Equation (13) [29,31]:
NPC = TC i × ( 1 + i F 1 + F ) n ( 1 + i F 1 + F ) n 1
where TC , n, i, i’, and F represent the total cost, number of years the annual real interest rate, real interest rate, nominal interest rate, and annual inflation rate, respectively.
Cost of energy (CoE) is calculated as given in Equation (14) [29,31]:
CoE = TC L prim , AC + L prim , DC
where Lprim,AC, and Lprim,DC are the AC primary load and the DC primary load, respectively.
In the third step, the obtained results for three PSS configurations were analyzed and compared based on the selected indicators for resilience and techno-economic and life cycle based environmental feasibility.

5. Results and Discussion

The results of three PSS configurations under grid outages are presented briefly along with the resilience assessment. In addition, the three PSS configurations are compared based on techno-economic and life cycle based environmental indicators. Grid outage modeling is the common result of the three PSS configurations. Based on the power outage data, the disruption in the power supply to the REUs is evaluated and presented in Figure 11.
From Figure 11, it is understood that a total of three power outages occurred, and the duration of the outages lasted from 1.21 h to 311.95 h. The first power outage was an intentional attack and is shorter, and within 1.21 h, the grid restoration has taken place. The second power outage is due to system operational error, and however, the grid restoration happened within 3.18 h. These two power outages were shorter compared to the third incident that took almost 311.95 h to restore. The third power outage was the major one, and it happened due to the shortage of fuel resources on the grid side. Due to the power outages, the unmet electric load at the REUs is increased in each power outage incident, see in Figure 12.
From Figure 12, it is understood that the unmet electric load will increase if the EG is not restored within the specified time. The cumulative unmet electric load for the duration of power outage events is 31.211 kW (outage-1), 98.2 kW (outage-2), and 7676.08 kW (outage-3), respectively. If no backup power facility is available (either energy storage or generation), the REUs have to face the emergency, and this clearly shows that the preparedness towards grid outages from the REUs side is nil. As a result, REUs will have to experience deficit energy that is around 7805.49 kWh/y. In this case, the PSS configurations are not resilient. The indicators for resilience and the techno-economic and environmental feasibility of PSS configuration without any backup energy storage and generation are presented in Table 5.
However, when it comes to a practical situation, the REUs will be prepared for a certain level of emergencies, and aligns with the assumption made under the preparedness component of the proposed resilience framework. Here, the REUs are already prepared for power outages, and as a result, in each PSS configuration, BES is considered. Hence, by considering the grid uncertainty, the proposed three PSS configurations for REUs were studied to understand which configuration is more resilient. In the below subsections, the results of proposed PSS configurations are briefly presented.

5.1. REU with EG + BES Based PSS Configuration

In EG + BES based PSS configuration, the REUs load is directly connected to the EG. Since REUs are connected to the grid, the power supply will obviously be disrupted in the event of a power outage. But as per the proposed resilience framework, preparedness measure is already considered. So, the REUs are already prepared for power outage emergencies with backup power facilities using a BES. In general, the REUs will not have sufficient information to decide the battery storage capacity specific to unmet electric load during power outage events. Here, to have an understanding of the feasibility of EG + BES configuration, irrespective of the REUs ability to afford the BES, we modeled the battery capacity considering the maximum possible power outage duration as battery autonomy, i.e., roughly 13.18 days. Simulation is carried out with the power outage events during the usual conditions, where the REUs draw power from the EG, and at the same, the batteries are fully charged. Here, when the power outage occurred, the battery starts discharging for meeting the REUs electric load requirements. As batteries are charged to 100%, they can power the REUs for the complete blackout duration and thus meet the required load. The PSS configuration with EG + BES was able to supply power and can be one of the resilient solutions. The indicators for resilience and the techno-economic and environmental feasibility of PSS configuration are presented in Table 6. However, when it comes to the practical situation, an individual REU may not be able to afford a BES with 13.18 days of battery autonomy.

5.2. REU with EG + NGPG + BES Based PSS Configuration

In EG + NGPG + BES based PSS configuration, the REUs electric load is connected to the NGPG and a BES. These two back up options will meet the electric loads in the case of emergencies. This configuration is considered under the prosumer category, but the choice of operation of the NGPG and power selling to the grid is more dependent on the REUs. The simulation is carried out, assuming that the REUs will operate the NGPG only in emergency situations. As per the PSS configuration, a simulation model is developed in the HOMER tool. The model based on sensitivity analysis showed that the NGPG was able to generate the electricity for the gird outage durations. The compensated load by NGPG during the power outage events is presented in Figure 13 and Figure 14.
In Figure 15, the power produced by the NGPG and along with the power purchased from the EG, is shown.
From Figure 15, it is clear that in the event of a grid outage, the NGPG able to restore the PSS thereby provides continuous power supply to REU. The indicators for resilience and the techno-economic and environmental feasibility of PSS configuration are presented in Table 7.

5.3. REU with EG + PV + BES based PSS Configuration

5.3.1. Weather Data for PV Modelling

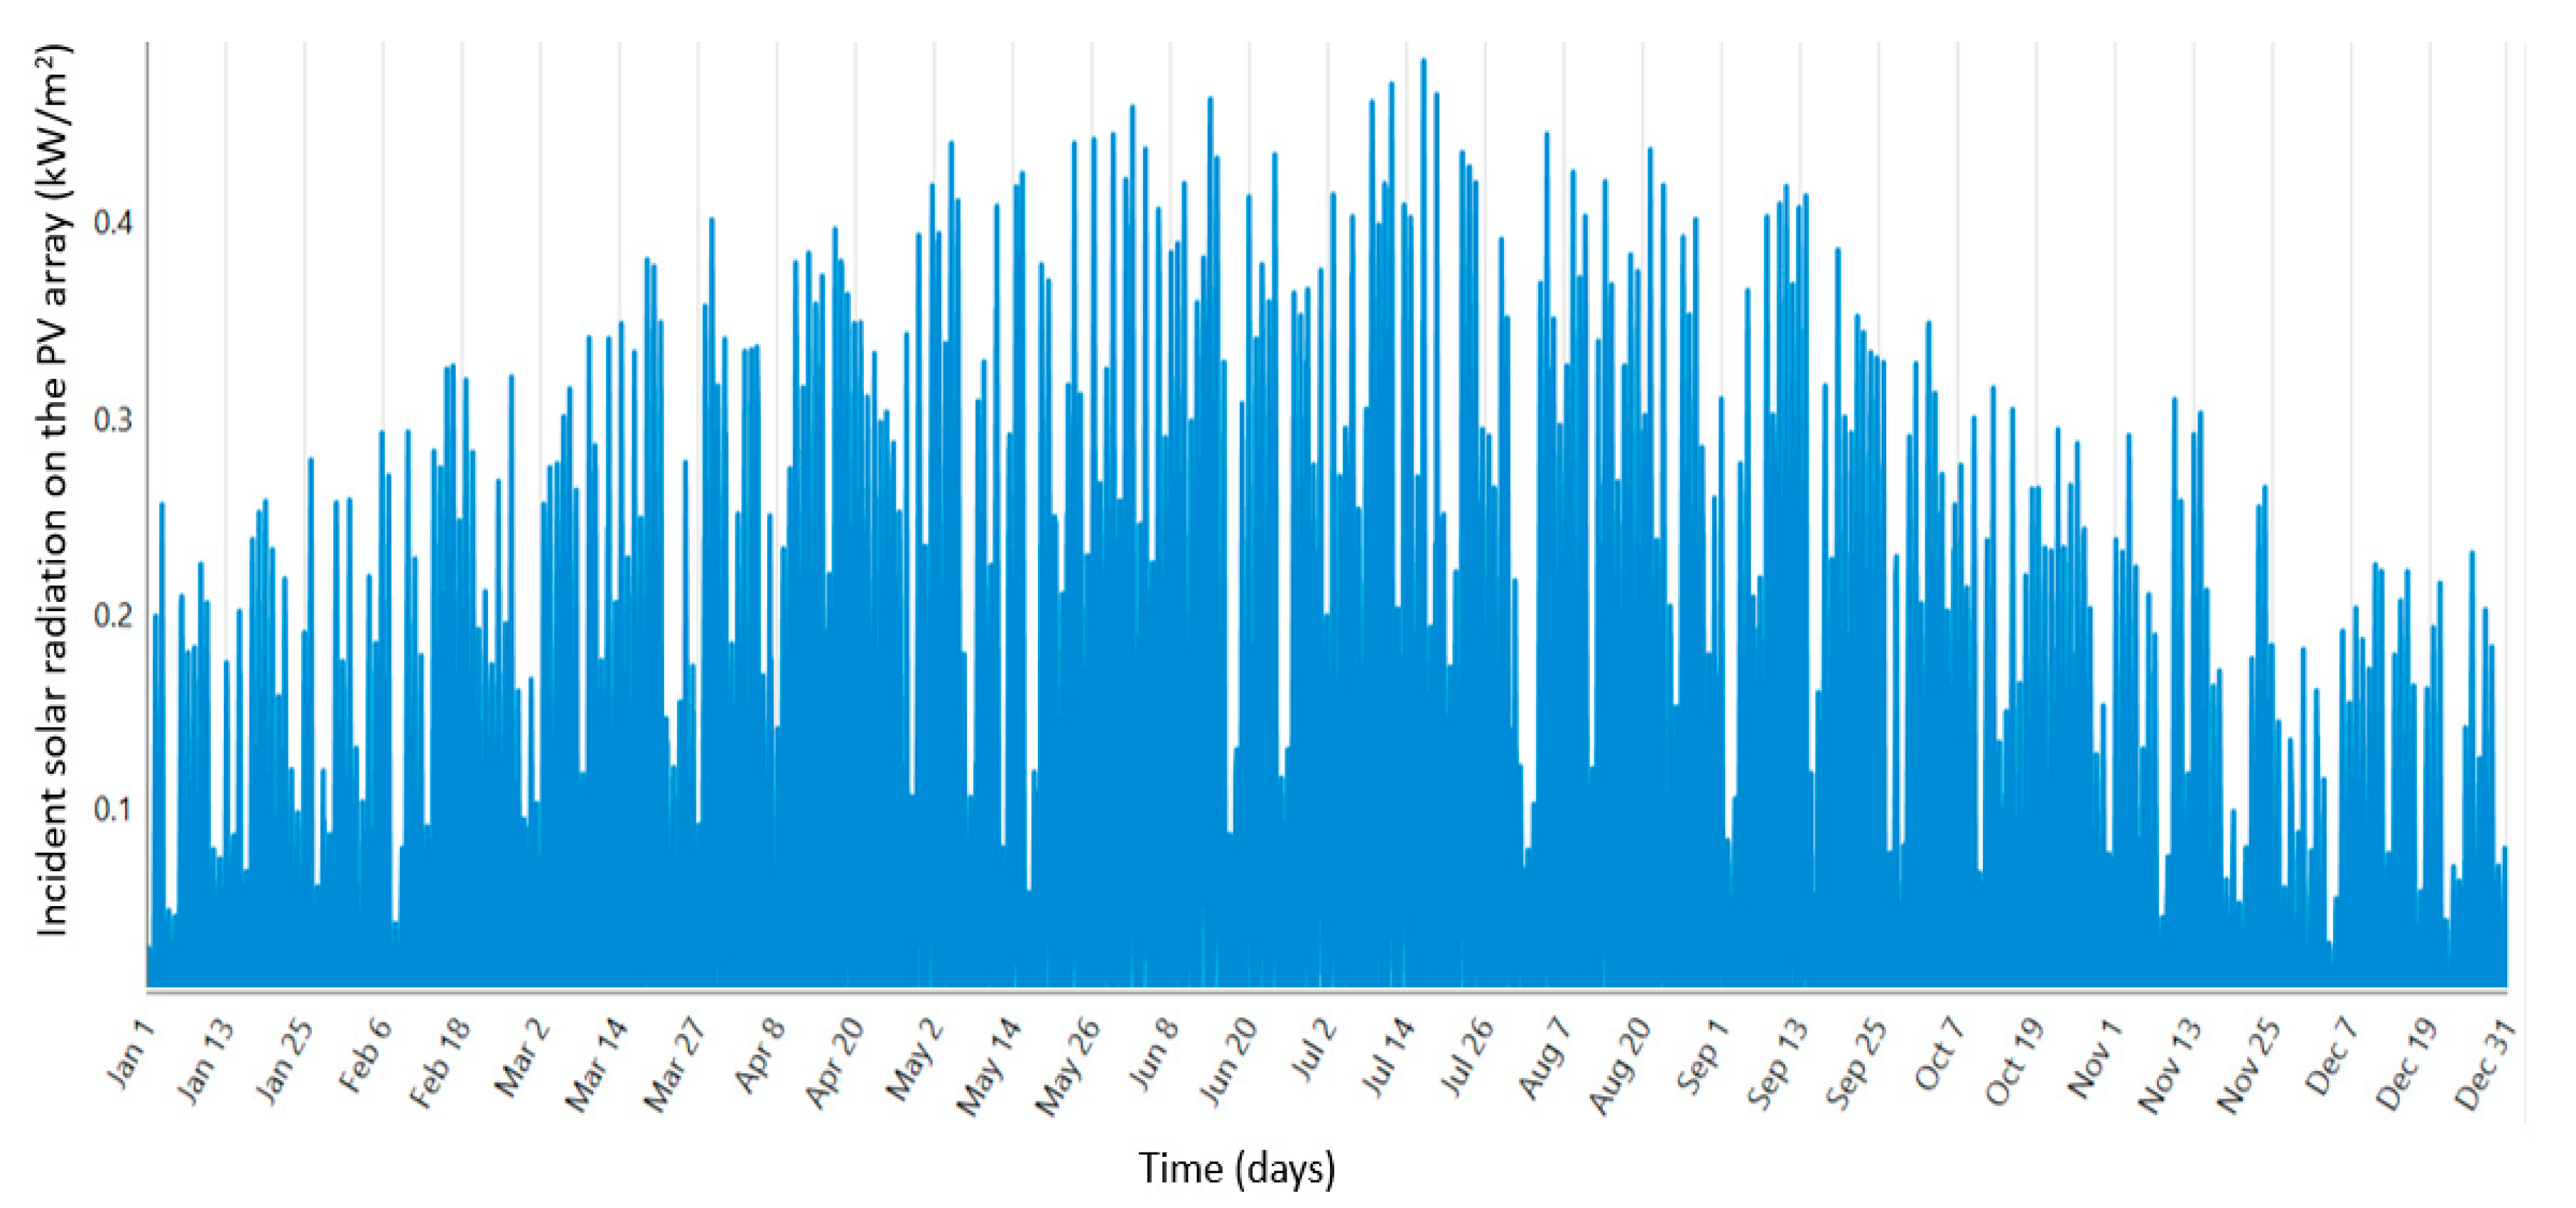
For the studied residential location, throughout the year, there exists a significant amount of solar radiation potential but with varying capacities. The data on solar radiation potential is collected from the National Aeronautics and Space Administration (NASA) databases using the data access provision provided by the HOMER tool and presented in Figure 16.
From Figure 16, at the REUs, the observed solar radiation power potential varies from 0.02 kW/m2/day to 0.48 kW/m2/day, which is sufficient to power the REUs. In terms of energy potential, the daily potential for the given month is varied between 1.67 to 5.67 kWh/m2/day recording maximum in June and minimum in December. The annual average daily solar radiation is 3.80 kWh/m2/day, and the observed clearness sky index is 0.4906, which is suitable for solar power generation. Apart from solar radiation, in the PV system modeling, we used wind speed and ambient temperatures to estimate the impact of module temperature on the total power produced. In the considered locations, the observed annual average wind speed for the last ten years was around 5.7 m/s. The wind speeds are ranged between 4.60 to 6.68 m/s, with an average of 2.75 m/s. The annual average temperature is observed at 11.68°C. The monthly average daily temperatures were observed to vary between −0.99 to 23.89°C recording the minimum in January and maximum in July.

5.3.2. Power Performance of EG + PV + BES based PSS Configuration

In EG + PV + BES-based PSS configuration, the electric load is connected to an on-site solar PV power plant as well as the EG. This configuration is considered under the prosumer category, where the REUs sell the power to the grid. The simulation is carried out by considering the local weather parameters, as discussed in Section 5.3.1 and power outage conditions, as shown in Table 1. In our simulation, the effect of sensitive parameters on the overall power generation is also observed. From the investigation, it was understood that the PV plant was able to meet the electrical load requirements of REUs, and at the same time, it was able to sell power to the EG. The power generation profile under EG + PV + BES-based PSS configuration is depicted in Figure 17. The indicators for resilience and the techno-economic and environmental feasibility of PSS configuration are presented in Table 8.

5.4. Comparison of PSS Configurations

In this section, the investigated three PSS configurations were compared based on their resilience, and techno-economic and life cycle-based environmental feasibility indicators. The detailed comparison of the indicators is presented in Table 9. In Table 10, the renewable-based prosumer category of the PSS configuration (i.e., EG + PV + BES) results are compared considering the two conditions that are with and without sales to EG.
Based on the obtained comparative results shown in Table 9 and Table 10, it is understood that the three configurations (EG + BES; EG + NGPG + BES; EG + PV + BES) were observed to be resilient and were able to supply power during power outages. Here, the resilience was achieved with optimal planning of energy infrastructure under each PSS configuration. In addition, based on the nature of the PSS category, i.e., consumer or prosumer, we observed a significant effect on the techno-economic and environmental indicators. For example, the initial capital cost was observed to be very high for EG + BES configuration, and this is because of the battery capacity needed to meet the massive power outage that lasts for almost 316 h. The initial capital cost for EG + NGPG + BES-based PSS configuration is quite less, as it is only planned for emergency backup. If the NGPG is made to operate continuously considering the grid sales, the capital cost will increase; also, the operating and maintenance cost would be very high. The third PSS configuration, i.e., EG + PV + BES, can be operated in prosumer mode, and in this configuration, the initial cost would be a little high but with almost zero investment on fuel resources, which is better when compared to NGPG. In addition, the payback is also viable. PV, when operated considering the REUs load consumption alone, has lower amounts of emission than the operation with grid sales. Even from the CO2 emission point of view, the PSS with PV and BES seems to have lower emissions. In addition, the observed CoE is lower for the PSS with PV and BES. Overall, after a thorough quantification of the techno-economic and life cycle based environmental indicators, the EG + PV + BES was able to perform well by satisfying the resilient condition and ensuring the power supply.

5.5. Discussion on Ensuring Resilience and Future Research Directions

In this section, a brief discussion is provided on how the studied three PSS configurations ensured the power resilience considering the four-component resilience framework. Besides, based on the provided discussion, few unaddressed issues were identified, and accordingly, the future research directions are proposed. In this study, the proposed three PSS configurations were resilient enough in supplying power to the REUs in the grid outage events, but each configuration differed in their techno-economic and life cycle-based environmental indicators as discussed in Section 5.4. The resilience is investigated based on PSS functionality variation, which is the function of the available power and the electricity demand at the REUs.
In the case of REU that is dependent only upon the EG (where there is no facility for on-site generation and storage), due to grid outage, there is a sudden fall in PSS functionality to zero. The fall to zero would happen immediately as there is no backup, thus low preparedness. The value of PSS functionality will be maintained as zero until the grid restoration has taken place, making the system not robust to grid outages. However, the recovery is observed to be 100%, but only after a dedicated amount of time, i.e., the time taken for grid restoration. The fourth component, i.e., adaptation, is more important. Based on the experiences, the REUs must learn and must adapt existing approaches that make the system more resilient. The adaptation is more related to improving the system efficiency and associated assets, which involves capital investment. With this, the PSS can adapt to previously experienced situations and is able to enhance preparedness to deal with the outage in the future.
In the case of EG + BES-based PSS configuration, during the grid outage, the PSS functionality is observed to vary. Here the resilience of PSS configuration is dependent upon the size of BES. If the considered BES capacity can manage the unmet loads, there will not be any drop in PSS functionality, and it is always maintained at maximum until and unless there is another disturbance at BES. The size of BES would again influence capital investment. The four-components of resilience will be affected; for instance, preparedness can be achieved even with low capacities of BES, which needs a lower investment, whereas the PSS may not be robust enough if the grid restoration times are longer. The recovery component is again dependent upon the capacity of the BES and grid restoration times.
The other two considered PSS configurations can generate on-site power generation. During the grid outages, they provide continuous power supply making the PSS configurations more resilient. In the case of EG + NGPG + BES, the PSS functionality is more dependent upon the NGPG operation time and natural gas fuel availability at the REUs, whereas, in the case of EG + PV + BES, the PSS functionality is more dependent upon the intermittent nature of the solar irradiance. In the considered location, these two resources are available, hence the impact on PSS functionality and resilience components is not much.
Based on the above-provided discussion, a few future research directions can be proposed. These include:
Investigation of the investments made in energy infrastructure and their impacts on improving resilience can be considered as one of the research directions, as in our study. We observed the variations in economic indicators based on the proposed energy infrastructure.
Resilience framework incorporating islanding and other grid disturbance detection approaches could be considered as one possible future research direction.
Tools that support grid restoration can be beneficial in optimal scheduling of on-site power generation facilities at REUs side, and in fact, they could influence the robustness component of the resilience cycle.
Modernization and re-design of PSS infrastructure by using advanced technologies like Blockchain [42,43,44], Internet of Things [45], Energy Internet [46], Blockchain-based Internet of Things (B-IoT) [47], and Artificial Intelligence (AI) techniques such as Machine Learning (ML), and Deep Learning (DL) [48] could favor in tracking the power outage events and thereby allows us to have a data-driven solution. Hence, power sector digital transformation from the context of resilience can be one of the possible future research directions.
Location and ecosystem specific studies can be further modeled to evaluate the feasibilities of PSS configurations in the context of the proposed resilience framework.

6. Conclusions

In this study, three different PSS configurations to meet the load demand of the REUs were proposed. The main objective of this study was to understand the resilience of PSS configurations during the power outages events. Besides, the resilient PSS configuration should be feasible from the techno-economic and life-cycle environmental emission point of view. For understanding this, a four-component resilience framework is proposed along with few indicators. As per the proposed framework, we observed that all three PSS configurations (that include the EG + BES; EG + NGPS + BES; and EG + PV + BES) were found to provide power during the power outages events. In all the three PSS, the resilience indicator, i.e., the unmet electric load, is observed to be zero. Even though there is an equal improvement in resilience, but in the context of techno-economic and lifecycle-based environmental indicators, each PSS differed. Based on this investigation, the following conclusions were drawn:
  • The configuration with the BES alone as a support option may not be feasible for longer power outage scenarios.
  • The configuration with fossil fuel-based PSS configuration (i.e., NGPG) would definitely be a solution; however, it is not feasible from the perspective of the least cost of energy and lowest life-cycle emissions.
  • A PV plus BES-based PSS configuration would be much more feasible under the prosumer only category, as it allows energy trade between the REUs and EG.
  • The EG + PV + BES based PSS configuration is observed to enhance the overall resilience, thereby help in improving the energy accessibility to REUs.
Overall, it is understood that the PSS configurations can be resilient as prosumers to the grid outage conditions. At the same, the PSS can be feasible from the techno-economic and life cycle-based environmental perspective.

Author Contributions

Conceptualization, N.M.K., and S.S.C.; Data curation, N.M.K.; Formal analysis, N.M.K.; Funding acquisition, A.G. (towards APC), and S.S.C.; Methodology, N.M.K., and S.S.C.; Resources, S.S.C.; Software, N.M.K., and S.S.C.; Supervision, S.S.C.; Validation, N.M.K.; Visualization, N.M.K.; Writing―original draft, N.M.K., Writing―review and editing, N.M.K., A.G., and S.S.C. All authors have read and agreed to the published version of the manuscript.

Funding

This research received no external funding.

Conflicts of Interest

The authors declare no conflict of interest.

References

  1. Cifor, A.; Denholm, P.; Ela, E.; Hodge, B.M.; Reed, A. The policy and institutional challenges of grid integration of renewable energy in the western United States. Utilities Policy 2015, 33, 34–41. [Google Scholar] [CrossRef] [Green Version]
  2. Eid, C.; Codani, P.; Perez, Y.; Reneses, J.; Hakvoort, R. Managing electric flexibility from Distributed Energy Resources: A review of incentives for market design. Renew. Sustain. Energy Rev. 2016, 64, 237–247. [Google Scholar] [CrossRef]
  3. Hertwich, E.G.; Gibon, T.; Bouman, E.A.; Arvesen, A.; Suh, S.; Heath, G.A.; Bergesen, J.D.; Ramirez, A.; Vega, M.I.; Shi, L. Integrated life-cycle assessment of electricity-supply scenarios confirms global environmental benefit of low-carbon technologies. Proc. Natl. Acad. Sci. USA 2015, 112, 6277–6282. [Google Scholar] [CrossRef] [PubMed] [Green Version]
  4. Bayati, N.; Aghaee, F.; Sadeghi, S.H. The Adaptive and Robust Power System Protection Schemes in the Presence of DGs. Int. J. Renew. Energy Res. 2019, 9, 732–740. [Google Scholar]
  5. Field, C.B.; Barros, V.R.; Stocker, T.F.; Dahe, Q.; Dokken, D.J.; Ebi, K.L.; Mastrandrea, M.D.; Mach, K.J.; Plattner, G.; Allen, S.K.; et al. Managing the Risks of Extreme Events and Disasters to Advance Climate Change Adaptation; Cambridge University Press: New York, NY, USA, 2012. [Google Scholar]
  6. Chopra, S.S.; Khanna, V. Toward a Network Perspective for Understanding Resilience and Sustainability in Industrial Symbiotic Networks. 2012 IEEE International Symposium on Sustainable Systems and Technology (ISSST), Boston, MA, USA, 16–18 May 2012; pp. 1–6. [Google Scholar]
  7. Chopra, S.S.; Khanna, V. Understanding resilience in industrial symbiosis networks: Insights from network analysis. J. Environ. Manag. 2014, 141, 86–94. [Google Scholar] [CrossRef] [PubMed]
  8. Chopra, S.S.; Khanna, V. Interconnectedness and interdependencies of critical infrastructures in the US economy: Implications for resilience. Phys. A Stat. Mech. Appl. 2015, 436, 865–877. [Google Scholar] [CrossRef]
  9. Chopra, S.S.; Dillon, T.; Bilec, M.; Khanna, V. A network-based framework for assessing infrastructure resilience: A case study of the London metro system. J. R. Soc. Interface 2016, 13, 20160113. [Google Scholar] [CrossRef] [Green Version]
  10. Roege, P.E.; Collier, Z.A.; Mancillas, J.; McDonagh, J.A.; Linkov, I. Metrics for energy resilience. Energy Policy 2014, 72, 249–256. [Google Scholar] [CrossRef]
  11. Panteli, M.; Mancarella, P. Influence of extreme weather and climate change on the resilience of power systems: Impacts and possible mitigation strategies. Electr. Power Syst. Res. 2015, 127, 259–270. [Google Scholar] [CrossRef]
  12. Power Systems Engineering Center (PSERC). Engineering Resilient Cyber Physical Systems; Power Systems Engineering Center (PSERC): Tempe, AZ, USA, 2011. [Google Scholar]
  13. Linkov, I.; Bridges, T.S.; Creutzig, F.; Decker, J.; Foxlent, C.; Kroger, W.; Lambert, J.H.; Levermann, A.; Montreuil, B.; Nathwani, J.; et al. Changing the resilience paradigm. Nat. Clim. Chang. 2014, 4, 407–409. [Google Scholar] [CrossRef]
  14. Linkov, I.; Trump, B.D.; Keisler, J. Risk and resilience must be independently managed. Nature 2018, 555, 30. [Google Scholar] [CrossRef] [PubMed]
  15. Global Outage Tracker Powered by Machine Learning: DataCapable Adds Global Power Outage Maps to Esri’s ArcGIS Marketplace. Available online: https://gisuser.com/2017/06/global-outage-tracker-powered-by-machine-learning-datacapable-adds-global-power-outage-maps-to-esris-arcgis-marketplace/ (accessed on 29 June 2020).
  16. Mukherjee, S.; Nateghi, R.; Hastak, M. Data on major power outage events in the continental US. Data Brief 2018, 19, 2079. [Google Scholar] [CrossRef]
  17. USA Blackout Annual Report 2014. Eaton USA’s Blackout Tracker. Available online: http://pqlit.eaton.com/ll_download_bylitcode.asp?doc_id=33333 (accessed on 15 June 2020).
  18. Najafi, J.; Peiravi, A.; Anvari-Moghaddam, A.; Guerrero, J.M. Resilience improvement planning of power-water distribution systems with multiple microgrids against hurricanes using clean strategies. J. Clean. Prod. 2019, 223, 109–126. [Google Scholar] [CrossRef]
  19. Rosales-Asensio, E.; de Simón-Martín, M.; Borge-Diez, D.; Blanes-Peiró, J.J.; Colmenar-Santos, A. Microgrids with energy storage systems as a means to increase power resilience: An application to office buildings. Energy 2019, 172, 1005–1015. [Google Scholar] [CrossRef]
  20. Marqusee, J.; Don, D.J., II. Reliability of emergency and standby diesel generators: Impact on energy resiliency solutions. Appl. Energy 2020, 268, 114918. [Google Scholar] [CrossRef]
  21. Anderson, K.; Laws, N.D.; Marr, S.; Lisell, L.; Jimenez, T.; Case, T.; Li, X.; Lohmann, D.; Cutler, D. Quantifying and Monetizing Renewable Energy Resiliency. Sustainability 2018, 10, 933. [Google Scholar] [CrossRef] [Green Version]
  22. Balasubramaniam, K.; Saraf, P.; Hadidi, R.; Makram, E. Energy management system for enhanced resiliency of microgrids during islanded operation. Electr. Power Syst. Res. 2016, 137, 133–141. [Google Scholar] [CrossRef]
  23. Ouyang, M.; Dueñas-Osorio, L. Multi-dimensional hurricane resilience assessment of electric power systems. Struct. Saf. 2014, 48, 15–24. [Google Scholar] [CrossRef]
  24. Faraji, J.; Babaei, M.; Bayati, N.; Hejazi, M.A. A comparative study between traditional backup generator systems and renewable energy based microgrids for power resilience enhancement of a local clinic. Electronics 2019, 8, 1485. [Google Scholar] [CrossRef] [Green Version]
  25. Li, J.; Niu, D.; Wu, M.; Wang, Y.; Li, F.; Dong, H. Research on Battery Energy Storage as Backup Power in the Operation Optimization of a Regional Integrated Energy System. Energies 2018, 11, 2990. [Google Scholar] [CrossRef] [Green Version]
  26. Kumar, N.M.; Subathra, M.S.P.; Moses, J.E. On-Grid Solar Photovoltaic System: Components, Design Considerations, and Case Study. In Proceedings of the 2018 4th International Conference on Electrical Energy Systems (ICEES), Chennai, India, 7–9 February 2018; pp. 616–619. [Google Scholar]
  27. Open EI Database for Energy Load Profiles in USA. Available online: https://openei.org/wiki/Data (accessed on 12 June 2020).
  28. HOMER Energy. Homer Pro Version 3.7 User Manual; HOMER Energy: Boulder, CO, USA, 2016; Available online: https://www.homerenergy.com/pdf/HOMERHelpManual.pdf (accessed on 12 June 2020).
  29. Kumar, N.M.; Chopra, S.S.; Chand, A.A.; Elavarasan, R.M.; Shafiullah, G.M. Hybrid renewable energy microgrid for a residential community: A techno-economic and environmental perspective in the context of the SDG7. Sustainability 2020, 12, 3944. [Google Scholar] [CrossRef]
  30. Kumar, N.M.; Gupta, R.P.; Mathew, M.; Jayakumar, A.; Singh, N.K. Performance, energy loss, and degradation prediction of roof-integrated crystalline solar PV system installed in Northern India. Case Stud. Therm. Eng. 2019, 13, 100409. [Google Scholar] [CrossRef]
  31. Karmaker, A.K.; Hossain, M.A.; Manoj Kumar, N.; Jagadeesan, V.; Jayakumar, A.; Ray, B. Analysis of Using Biogas Resources for Electric Vehicle Charging in Bangladesh: A Techno-Economic-Environmental Perspective. Sustainability 2020, 12, 2579. [Google Scholar] [CrossRef] [Green Version]
  32. Krishan, O.; Suhag, S. Techno-economic analysis of a hybrid renewable energy system for an energy poor rural community. J. Energy Storage 2019, 23, 305–319. [Google Scholar] [CrossRef]
  33. Adefarati, T.; Bansal, R.C. Reliability, economic and environmental analysis of a microgrid system in the presence of renewable energy resources. Appl. Energy 2019, 236, 1089–1114. [Google Scholar] [CrossRef]
  34. New York State Energy Profile. Available online: https://www.eia.gov/state/print.php?sid=NY (accessed on 12 June 2020).
  35. Electric Power Monthly. Available online: https://www.eia.gov/electricity/monthly/epm_table_grapher.php?t=epmt_5_6_a (accessed on 12 June 2020).
  36. How Much do Solar Panels Cost in the U.S. in 2020? Available online: https://news.energysage.com/how-much-does-the-average-solar-panel-installation-cost-in-the-u-s/ (accessed on 12 June 2020).
  37. Bloomberg New Energy Finance, Battery Pack Prices Fall as Market Ramps up with Market Average at $156/kWh in 2019. Available online: https://about.bnef.com/blog/battery-pack-prices-fall-as-market-ramps-up-with-market-average-at-156-kwh-in-2019/?sf113554299=1 (accessed on 12 June 2020).
  38. Monthly Average Price of Natural Gas—Residential, U.S. Department of Energy, Energy Information Administration “Natural Gas Navigator” Historic Price Series. Available online: http://eia.doe.gov/dnav/ng/hist/n3035ny3m.htm (accessed on 12 June 2020).
  39. US Grid Emissions Factors. HOMER Pro Version 3.14; HOMER Energy: Boulder, CO, USA, 2020; Available online: https://www.homerenergy.com/products/pro/docs/latest/us_grid_emissions_factors.html (accessed on 12 June 2020).
  40. Fthenakis, V.M.; Kim, H.C.; Alsema, E. Emissions from photovoltaic life cycles. Environ. Sci. Technol. 2008, 42, 2168–2174. [Google Scholar] [CrossRef] [PubMed] [Green Version]
  41. Liu, W.; Sang, J.; Chen, L.; Tian, J.; Zhang, H.; Palma, G.O. Life cycle assessment of lead-acid batteries used in electric bicycles in China. J. Clean. Prod. 2015, 108, 1149–1156. [Google Scholar] [CrossRef]
  42. Kumar, N.M. Blockchain: Enabling wide range of services in distributed energy system. BeniSuef Univ. J. Basic Appl. Sci. 2018, 7, 701–704. [Google Scholar] [CrossRef]
  43. Ahl, A.; Yarime, M.; Tanaka, K.; Tanaka, K.; Sagawa, D. Review of blockchain-based distributed energy: Implications for institutional development. Renew. Sustain. Energy Rev. 2019, 107, 200–211. [Google Scholar] [CrossRef]
  44. Ahl, A.; Yarime, M.; Goto, M.; Chopra, S.S.; Kumar, N.M.; Tanaka, K.; Sagawa, D. Exploring blockchain for the energy transition: Opportunities and challenges based on a case study in Japan. Renew. Sustain. Energy Rev. 2020, 117, 109488. [Google Scholar] [CrossRef]
  45. Kumar, N.M.; Dash, A.; Singh, N.K. Internet of Things (IoT): An Opportunity for Energy-Food-Water Nexus. In Proceedings of the 2018 International Conference on Power Energy, Environment and Intelligent Control (PEEIC), Greater Noida, Uttar Pradesh, India, 13–14 April 2018; pp. 68–72. [Google Scholar]
  46. Kabalci, Y.; Kabalci, E.; Padmanaban, S.; Holm-Nielsen, J.B.; Blaabjerg, F. Internet of Things Applications as Energy Internet in Smart Grids and Smart Environments. Electronics 2019, 8, 972. [Google Scholar] [CrossRef] [Green Version]
  47. Kumar, N.M.; Mallick, P.K. Blockchain technology for security issues and challenges in IoT. Procedia Comput. Sci. 2018, 132, 1815–1823. [Google Scholar] [CrossRef]
  48. Xu, Y.; Ahokangas, P.; Louis, J.-N.; Pongrácz, E. Electricity Market Empowered by Artificial Intelligence: A Platform Approach. Energies 2019, 12, 4128. [Google Scholar] [CrossRef] [Green Version]
Figure 1. Heat map highlighting locations where power outages occurred across the globe [15].
Energies 13 04193 g001
Figure 2. The number of power outage events in each state of the USA [17].
Energies 13 04193 g002
Figure 3. Four component resilience framework.
Energies 13 04193 g003
Figure 4. Schematic view of the proposed three power supply system configurations for residential electricity users [Note: EG—Electric grid; BES—Battery energy storage; NGPG—Natural gas power generator; PV—Photovoltaics.]
Energies 13 04193 g004
Figure 5. Schematic view of EG + BES based power supply system configuration [Note: EG—Electric grid; BES—Battery energy storage; DC—Direct current; AC—Alternating current.]
Energies 13 04193 g005
Figure 6. Schematic view of EG + NGPG + BES based power supply system configuration [Note: EG—Electric grid; BES—Battery energy storage; NGPG—Natural gas power generator; DC—Direct current; AC—Alternating current].
Energies 13 04193 g006
Figure 7. Schematic view of EG + PV + BES based power supply system configuration [Note: EG—Electric grid; BES—Battery energy storage; PV—Photovoltaics; DC—Direct current; AC—Alternating current; MPPT—Maximum power point tracking].
Energies 13 04193 g007
Figure 8. Electricity load profile of a multi stair residential building located in New York, USA [Note: REU—Residential electricity users; USA—United States of America).
Energies 13 04193 g008
Figure 9. Trends in natural gas price variation.
Energies 13 04193 g009
Figure 10. Flowchart for simulation modeling of power supply system configurations. [Notes: EG-Electric grid; BES-Battery energy storage; NGPG—Natural gas power generator; PV—Photovoltaics.].
Energies 13 04193 g010
Figure 11. Electricity purchased from grid highlighting on the power outage duration for the year.
Energies 13 04193 g011
Figure 12. The increasing trends of unmet electric load profile vs. electric grid restoration time: (a) outage-1 (intentional attack); (b). outage-2 (system operational error); (c). outage-3 (fuel supply issue).
Energies 13 04193 g012
Figure 13. Time series graph showing the operation of the natural gas power generator.
Energies 13 04193 g013
Figure 14. Power compensated by the natural gas power generator.
Energies 13 04193 g014
Figure 15. Share of power production in EG + NGPG + BES based power supply system configuration [Note: EG-Electric grid; NGPG-Natural gas power generator; BES-Battery energy storage].
Energies 13 04193 g015
Figure 16. Solar radiation potential available in the location.
Energies 13 04193 g016
Figure 17. Share of power production EG + PV + BES based power supply system configuration [Note: EG-Electric grid; PV-Photovoltaics; BES-Battery energy storage].
Energies 13 04193 g017
Table 1. Data on power outages in New York, USA
Start TimeRestoration TimeOutage DurationReasonNotation
7:49 AM on 7 May9:02 AM on 7 May1.21 hIntentional attackOutage-1
9:29 PM on 26 May12:40 AM on 27 May3.18 hSystem disruptionOutage-2
7:30 AM on 31 May7:27 AM on 13 June311.95 hFuel supply issueOutage-3
Note: USA—United States of America; h—hours.
Table 2. Cost details of the most important equipments used in power supply systems [24,29,36,37].
Cost ParametersPhotovoltaicsPower ConverterBatteryNatural Gas Power Generator
Capital cost3100 $/kW137.5 $/kW156 $/kWh500 $/kW
Replacement cost3100 $/kW137.5 $/kW156 $/kWh500 $/kW
Operation & maintenance cost310 $/y13.7 $/y15.6 $/y0.03 $/op. h
Note: kW—kilo watt; y—year; kWh—kilo watt hour; op. h—Operational hours; $—United States Dollars.
Table 3. Technical specifications of the power supply systems equipment.
ParameterValues with Units
Photovoltaics (PV)
Peak power1 kW
Temperature coefficient−0.3%/°C
Nominal operating temperature47 °C
Efficiency at the standard test condition21%
Lifetime25 y
Battery Energy Storage (BES)
TypeLithium-ion
Nominal capacity16.7 kWh
Nominal voltage12 V
The initial state of charge100%
Minimum state of charge20%
Self-discharge rate (including the safety circuit)5%/day
Lifetime15 y
Natural Gas Power Generator (NGPG)
Input fuelNatural gas
Capacity65 kW
Efficiency95%
Lifetime15,000 h
Power Converter (PC)
Capacity60 kW
Efficiency95%
Lifetime15 y
Note: kW-kilo watt; %—Percentage; °C—Degree centigrade; y—year; kWh-kilo watt hour; V—Volts; h—hours.
Table 4. Properties of the natural gas fuel used in a natural gas power generator.
ParametersValue with Units
Lower heating value45 MJ/kg
Density0.79 kg/m3
Carbon content67%
Sulfur content0%
Note: MJ-mega joules; kg—kilo gram; m3—Cubic meter; %—Percentage.
Table 5. Techno-economic and environmental indicators of a power supply system without any backup energy storage or generation facility.
ParametersValue with Units
Initial capital cost0 (the user does not invest)
Operation cost37,458.05 $/y
Cost of energy0.1742 $/kWh
Total load demand222,834 kWh/y
Load consumption215,029 kWh/y
Purchase value of electricity from grid37,458.05 $/y
Grid sales0 (there is no provision)
Unmet electric load7805 kWh/y
CO2 emissions61,713,323.00 g/y
SO2 emissions77,410.44 g/y
NOx emissions43,005.80 g/y
Note: $—United States dollar; y—year; kWh—kilo watt hour; g—grams.
Table 6. Techno-economic and environmental indicators of EG+BES based power supply system.
ParametersValue with Units
Initial capital cost$2,028,188.00
Operation cost37,458.05 $/y
Cost of energy0.1742 $/kWh
Net present cost$4,045,528.28
Total load demand222,834 kWh/y
Load consumption215,029 kWh/y
Purchase value of electricity from grid37,458.05 $/y
Grid sales0 (there is no provision)
Unmet electric load0 kWh/y
CO2 emissions64,351,413.00 g/y
SO2 emissions94,815.59 g/y
NOx emissions43,005.80 g/y
Note: EG—Electric grid; BES—Battery energy storage; $—United States dollar; y—year; kWh—kilo watt hour; g—grams.
Table 7. Techno-economic and environmental indicators of EG + NGPG + BES based power supply system.
ParametersValue with Units
Initial capital cost$38,741.09
Operation cost39,857.95 $/y
Cost of energy0.1903 $/kWh
Net present cost$634,431.83
Total load demand222,834 kWh/y
Load consumption from grid215,029 kWh/y
Purchase value of electricity from grid38,817.68 $/y
Grid sales0 (there is provision but used as standby option)
Unmet electric load0 kWh/y
Load supplied by a natural gas generator7805 kWh/y
Fuel cost1157.41 $/y
CO2 emissions65,741,000.00 g/y
SO2 emissions76,400.00 g/y
NOx emissions46,000.00 g/y
Note: EG—Electric grid; NGPG—Natural gas power generator; BES—Battery energy storage; $—United States dollar; y—year; kWh—kilo watt hour; g—grams.
Table 8. Techno-economic and environmental indicators of EG + PV + BES based power supply system considering only REUs load.
ParametersValue with Units
Initial capital cost$83,078.76
Operation cost47,236.07 $/y
Cost of energy0.05560 $/kWh
Net present cost$485,892.00
Total load demand222,834 kWh/y
Load consumption from grid26,515.00 kWh/y
Purchase value of electricity from the grid4618.91 $/y
Energy fed to grid sales471,079 kWh/y
Grid sales value349,540.62 $/y
Unmet electric load0 kWh/y
CO2 emissions18,407,350.00 g/y
SO2 emissions84,146.62 g/y
NOx emissions44,566.80 g/y
Note: EG—Electric grid; PV—Photovoltaics; BES—Battery energy storage; $—United States dollar; y—year; kWh—kilo watt hour; g-grams.
Table 9. Comparison of resilience and techno-economic and life cycle based environmental feasibility indicators for three PSS configurations.
ParametersEG + BESEG + NGPG + BESEG + PV + BES
Initial capital cost$2,028,188.00$38,741.09$83,078.76
Operation cost37,458.05 $/y39,857.95 $/y47,236.07 $/y
Cost of energy0.1742 $/kWh0.1903 $/kWh0.05560 $/kWh
Net present cost$4,045,528.28$634,431.83$485,892.90
Unmet electric load0 kWh/y0 kWh/y0 kWh/y
CO2 emissions64,351,413.00 g/y65,741,000.00 g/y44,316,890.00 g/y
SO2 emissions94,815.59 g/y76,400.00 g/y263,161.24 g/y
NOx emissions43,005.80 g/y46,000.00 g/y138,859.60 g/y
Note: EG—Electric grid; BES—Battery energy storage; NGPG—Natural gas power generator; PV—Photovoltaics; $—United States dollar; y—year; kWh—kilo watt hour; g—grams
Table 10. Comparison of resilience and techno-economic and life cycle based environmental feasibility indicators for EG + PV + BES based power supply system configuration with and without sales to EG.
ParametersEG + PV + BES
With Sales to EGWithout Sales to EG
Initial capital cost$83,078.76$83,078.76
Operation cost47,236.07 $/y47,236.07 $/y
Cost of energy0.05560 $/kWh0.05560 $/kWh
Net present cost$485,892.90$485,892.90
Unmet electric load0 kWh/y0 kWh/y
CO2 emissions44,316,890.00 g/y18,407,350.00 g/y
SO2 emissions263,161.24 g/y84,146.62 g/y
NOx emissions138,859.60 g/y44,566.80 g/y
Note: EG—Electric grid; BES—Battery energy storage; PV—Photovoltaics; $—United States dollar; y—year; kWh—kilo watt hour; g—grams.

