1. Introduction
The goal of a multi-business firm is to create more value than what stand-alone businesses would do. This value added is commonly referred to as “corporate surplus”. However, in recent years, a growing number of multi-business firms has been valued with a corporate discount rather than a corporate surplus. This general trend can also be seen in the energy market. Over the last 10-15 years, fully integrated utilities, such as RWE or E.ON, have significantly lost market capitalization. In contrast, more focused companies in the energy sector, such as National Grid or Centrica, have gained value. Therefore, business economists have been debating whether a certain degree of diversification improves or deteriorates the multi-business firms’ performance compared to more focused companies. At the same time, the energy markets in Germany and Europe have undergone significant changes driven by re-regulation, ambitious energy and climate policy goals, and technical change. Both liberalization and re-regulation simultaneously take place in different geographical parts of Europe, as well as in different sectors of the energy market. This leads to additional uncertainty about the utilities’ future market roles and business models.
A review of both the development of the energy market and the performance of integrated as well as focused utilities shall reflect the capital market’s opinion on future business models, leading to the question of whether the multi-business model is outdated for the energy market. In order to investigate this question, however, the sources of possible corporate surpluses need to be carefully studied. The general opinion is that these surpluses can only be achieved by realizing synergies. In our study, in order to identify utilities’ significant synergies, the German utility RWE is analyzed in detail from a 2012 perspective. RWE is selected as the object of research for several reasons. On the one hand, by operating strong businesses on all stages of the energy value chain, RWE had been fully vertically integrated. On the other hand, by focusing on its core markets, Germany, the United Kingdom (UK), and the Netherlands, as well as on the growth markets in Central Eastern Europe (CEE) and South Eastern Europe (SEE), RWE has had a clear European focus and a broad portfolio of market activities in a dynamic, re-regulated, and increasingly competitive business environment. Thereby, a wide range of (potential) synergies can be evaluated within a single firm. One also can expect that experiences with the effects of regulatory changes on synergies within one market can be translated into future changes within another market, easing the evaluation of expected future effects on the business models of multi-business utilities in Europe. Finally, the 2016 strategic decision of RWE and E.ON (made public in March 2018) to split the former RWE (and now E.ON) subsidiary Innogy between the two firms, aimed at enabling both firms to become more focused and avoid some competition (E.ON selling its renewable generation business to RWE, and in turn receiving the network and retail business from Innogy), fuels the discourse on the merits of more focused vs. more integrated utilities, and will make it worthwhile to undertake another case study on the synergy potentials of these two firms.
In this study, only synergies of true (intra-firm) business integration are evaluated, whereas synergies through horizontal and vertical inter-firm cooperation are beyond the scope of the analysis. Quantitative synergy evaluation demands deep insights and extensive expert knowledge of the respective businesses. In order to be able to discuss and evaluate the complete range of (potential) synergies within multi-business utilities, synergies will therefore be evaluated on a qualitative basis. Overall, empirical evidence is found for the hypothesis that both already realized and potential synergies can be of significant value to European multi-business utilities. However, these synergies are subject to continuous change due to market evolution and regulatory change. Based on the insights from this study, operating an integrated business model cannot simply be discarded as outdated, even in today’s energy markets, since it offers numerous opportunities that can potentially (and within the existing unbundling rules and obligations of the European Commission) be leveraged into attractive new business models.
The remainder of this paper is organized as follows.
Section 2 starts with a survey of both the energy market evolution in Europe and the performance of “integrated” versus “focused” European utilities, as well as a presentation of the theoretical background on the intra-firm synergies of integrated firms. There are different types of synergies multi-business firms can realize, which, depending on their business model and market environment, can be more or less significant. For this reason, synergies are first categorized and then the evaluation criteria from the relevant studies are presented. Whereas especially financial synergies, such as the optimization of the risk/return profile, can be evaluated with well-established models (e.g., Markowitz’ portfolio optimization), other utility-specific synergies have not yet been sufficiently considered in this context. Hence, the focus of our study lies on these. In
Section 3, the methodological approach is described, followed by the empirical analysis in
Section 4, where, in a first step, all relevant aspects of RWE’s business structure are discussed. Based on these insights, in a second step, the (potential) synergies of multi-business utilities are uncovered. The results of the empirical analysis regarding the main value-driving synergies are then qualitatively evaluated in detail in order to determine whether the RWE Group would merit a corporate surplus. In light of the rapidly changing energy market environment, a critical review of the expected further development of these synergies is also provided. In
Section 5, the discussion of the results obtained provides some evidence on whether an integrated business structure can indeed add value in the European energy market and thus whether a corporate surplus valuation by the capital market is justifiable or not. Finally, in
Section 6 a conclusion regarding the potential of synergies within multi-business utilities as well as arising policy implications are provided.
The challenges due to the structural change in companies and the multitude of new business models (BMs) render the design of a corporate strategy increasingly difficult, and therefore are considered in many studies. Bosbach, Brillinger and Schäfer [
1] analyzed the impeding and enhancing factors influencing the efficiency of operating multiple BMs in a corporate portfolio as well as BM innovation as being key to remain competitive. They find that portfolio diversification aligned with the firm-specific corporate strategy is indispensable for ensuring competitiveness. Globocnik, Faullant and Parastudy [
2] provided a conceptual model on how to realize a consistent and dynamic strategy and BM management. The proposed model enables the perfect alignment of internal activities for BM management and strategic planning by creating an integrated management framework. Morandi-Stagni, Santaló and Giarratana [
3] assessed the potentials of reallocating disposable (e.g., free cash-flow) resources across business units (BUs). They concluded that diversified companies increased the resource allocation in BUs that were threatened by competition, instead of reallocating resources to other BUs. Technological synergies between BUs are found to be a negative moderator of reallocation. Snihur and Tarzijan [
4] aimed to identify the effects of BM portfolio complexity. The increase in imitation barriers due to the effects of between-complexity is here discovered to be one of the explanations for the recent findings of high performance in multi-BM organizations. Sohl, Vroom and McCann [
5] extended the existing research on the relationship between BM diversification and firm performance. They reveal that demand-related BM diversification showed a positive impact on profitability, especially when there is a strong demand heterogeneity. Sueyoshi and Goto [
6] investigated the synergy effects between utilities applying a specialized or diversified BU-structure. They concluded that concentrating on the core business is still the most promising strategy for success in the utility sector. Specht and Madlener [
7] also dealt with emerging BMs at energy supply companies and the challenges they face. The authors conclude that BMs for energy supply companies, in order to be successful, need to switch to a more customer-(or consumer-) centric perspective. Finally, Karami and Madlener [
8] studied the effect of BM innovation on electricity suppliers in the retail market. They discovered that those companies that use a customer-/consumer-centric approach are more successful due to an increasing relevance and use of distributed energy resources and new energy and other related services.
2. Theoretical Background
2.1. Business Structure and Market Analysis
2.1.1. Business Structures and Scope of the Firm
For investigating and evaluating the synergies of multi-business utilities, first the structure of such multi-business firms has to be defined and discussed. Firms can be categorized by many different dimensions, such as size, branch, strategic alignment, etc. For the purpose of this study, a differentiation based on their organizational structure regarding product scope, geographical scope, and vertical scope is used.
Figure 1 introduces a scheme for defining the main stages of the value chain in the energy market, as presented in
Section 4.1.1 below. These stages are defined by the corresponding functions performed in these businesses. The vertical scope of the firm depends on the stages it is active in (i.e., either vertically integrated or focused). The geographical scope (or horizontal scope) refers to the regions in which the firm operates. If it is only active in one geographical market, it is a regionally operating firm. If it is active in more than one country, it is an internationally operating firm. Finally, the product scope refers to the firm being diversified or not. Firms can either only be active in a single industry sector or multiple industry sectors. The exemplary firm shown in
Figure 1 is internationally operating, vertically integrated, and diversified. Depending on the strategic and regional differences between the businesses performed by the firm, businesses are usually divided into business units, which functionally operate independently of each other. Regardless of a firm’s vertical, geographical, or product scope, the goal of such an organization is always to produce more value than what an unorganized or disintegrated firm would do. This value added is referred to as “corporate surplus”. However, if multi-business firms fail to create additional value, firms can also be charged with a corporate discount.
Figure 2 illustrates the corporate surplus as the motive to create multi-business firms as well as the corporate discount as a result of the failed creation of value added.
The left-hand side of
Figure 2a shows the corporate surplus. In this exemplary case, the multi-business firm consists of three businesses. The size of the bars illustrates the different value components of the businesses. Next to the three stand-alone values of the businesses, the sum of these values can be seen. If—as shown here—the market capitalization of the resulting multi-business firm is higher than the sum of the stand-alone businesses, the multi-business firm is rewarded a corporate surplus. This would reflect the general market opinion for this hypothetical case that the integrated company produces more value than the stand-alone businesses would do. The total value is higher than the sum of the parts. The right-hand side of
Figure 2a shows the corporate discount. The stand-alone values of the businesses, and thus the sum of these internal values, are the same as in the first case. Contrary to the case of a corporate surplus, where the market capitalization of the resulting multi-business firm is lower than the sum of the stand-alone businesses, the multi-business firm is charged with a corporate discount. This would reflect the general market opinion for this hypothetical case that an integrated company produces less value than what a stand-alone business would do. The total value is lower than the sum of the parts. In a market of perfect competition, it is important not only to achieve a corporate surplus but also to be the “best owner” of the respective business.
In
Figure 2b, the same business structure is shown as in
Figure 2a. On the left-hand side, the multi-business firm is rewarded with a corporate surplus (“Owner 1”). On the right-hand side, it can be seen that the same businesses—if owned by “Owner 2”—would be rewarded with a higher corporate surplus than the one achieved by Owner 1. The difference between these corporate surpluses is referred to as “corporate premium”. Being able to achieve a corporate premium compared to the corporate surplus means that Owner 1 is not the best owner for the businesses. In the case of substitutable businesses, the constellation shown results in a permanent competitive advantage in the market for Owner 2 compared to Owner 1. In the case of non-substitutable businesses, Owner 1 is in potential danger of (partly) being taken over by Owner 2, because the latter is able to pay a higher price for the firm owned by Owner 1 than what the market value of that firm is. Generally, synergies are regarded as the reason for the creation of corporate surplus. Failed corporate strategy, by not realizing (enough) synergies, is widely accepted as a reason for corporate discounts (discussed in more detail in
Section 4.3 below).
2.1.2. Performance of Multi-Business Firms and Focused Firms
The divisional firm structure of functional business units and centralized shared services was first introduced by DuPont in the mid-20th century in the US. This structure was subsequently brought to Europe and became the standard for analyzing larger firms. In Germany, for example, whereas in 1950 37% of all large companies achieved 95% of their total sales in only one line of business, in 1960 it was only 27% and in 1993 only 13% ([
10], pp. 34–35). This trend to diversify was based on the belief that, in principle, by applying modern strategic management know-how, managers were capable of leading any company without expert knowledge of the respective business. Due to strict anti-trust legislations and the conviction that widely diversified businesses reduce the risk and thus create superior performance for the companies, this trend led to conglomerate diversification [
10].
Because of the lack of strategic logic of the business acquisitions, most large conglomerates could not deliver superior value. With failed enhanced performance of vertically integrated and conglomerate firms, and increasing market efficiencies especially in industrial countries, more or less committed strategic alliances provided the opportunity to cooperate vertically without the cost of management for the hierarchic structure of a vertically integrated firm. At the same time, the shareholder value approach became more important. Markets started to charge failed superior performance with corporate discounts and thus put pressure on the managers of these firms. Therefore, a trend to refocus (downscope) on the firm’s core businesses and to divest non-core businesses began in the 1980s and 1990s [
10] (pp. 34–36).
In recent years, in terms of the product scope, a trend to refocus on core businesses with strategic bonds is noticeable. In terms of the vertical scope, a trend to outsource and form strategic alliances can be seen; only the geographic scope has seen an increase in diversification ([
10] and [
11], p. 2).
Debates are ongoing which business model performs better. In [
10] (pp. 38–41), it was found that the majority of economists nowadays believe that focusing on core businesses creates more value than broad diversification. This, in turn, does not mean that diversification is generally regarded as a failed strategy but rather that businesses have to fit the core competences of a firm in order to create more value. With a set of core competences that are rather unique, compared to competitors, also strategically fitting businesses can be operated in a more sophisticated manner than without these competences. In turn, this can result in a corporate surplus. Multi-business firms operating their businesses based on such corporate core competences can be seen as “focusing diversifiers” [
10].
Depending on the research methods used, performance indicators, investigated period of time, and the group of firms studied, economists find different results regarding the performance of multi-business firms compared to focused firms. In [
10] (pp. 42–44), it was found that modestly diversified companies are a little more stable compared to single-business companies. These findings are based on the percentage of firms going bankrupt within a certain period of time. Furthermore, the authors find examples for multi-business firms with a sustainably better performance than single-business firms. However, according to the findings, this success is not based on the mere fact of diversification, but on superior corporate management of strategically related businesses [
10] (pp. 42–44). Reference [
12] found that, on the one hand, the temptation to diversify is generally strong once a company has reached a certain size and maturity. On the other hand, the study states that only a few diverse companies have generated more value through diversification when businesses are not connected adequately to each other. The authors in [
12] found this to be the reason for the disappearance of “unlikely pairings” within the years studied. Contrary to many managers’ beliefs, neither does [
12] (pp. 1–2) find an assumed better capital allocation across businesses compared to capital market allocation nor do they find an assumed risk reduction for investors to be the basis for superior performance through diversification. Rather, it is found that diversification tends to cap the upside potential for shareholders while not limiting the downside risk.
Figure 3 visualizes this context based on the total return for shareholders (TRS) of the S&P 500 companies from 2002 to 2010.
Conglomerates can be defined as companies of three or more businesses that “do not have common customers, distribution systems, manufacturing facilities, or technologies” [
12] (p. 3). While in terms of the median TRS more focused companies (11.8%) outperformed conglomerates (7.5%), the distribution in
Figure 3 shows that some conglomerates did outperform some focused companies. However, one can see from the above-described phenomenon that the upside potential is limited while the downside risk is not. According to [
12] (p. 2), the reason for this distribution is that the chances for all businesses within a conglomerate to outperform are rather low. Therefore, the returns of outperforming businesses are “dwarfed” by underperforming businesses. The distribution also illustrates that moderately diversified companies have a higher upside potential compared to conglomerates, and that their outperforming share is still lower than the one of focused companies. In addition to the TRS, [
12] (p. 2) also found more focused companies to outperform conglomerates on an aggregate level in terms of growth of revenues (9.2% compared to 6.3%) and returns on capital (increase of 3% compared to a decrease of 1%). The same as Müller-Stewens and Brauer, [
12] (pp. 1–3) identified “being the best owner” of the respective businesses to be the key for adding more value to a multi-business firm. According to the study, superior corporate management—particularly regarding allocation of capital between competing investments, portfolio management, or cost cutting—is the basis of this. In contrast to developed markets, where [
12] (p. 4) expect conglomerates to disappear with time, the authors found conglomerate structures to still be attractive in emerging markets. Especially where extensive infrastructure is required, large conglomerates have economic advantages regarding acquisition of capital, resources, infrastructure, and needed relationships with the local governments.
Contrary to [
12], Sturm [
11] (p. 1) found a trend back from focusing to diversification. His study is based on an investigation of the biggest 1200 companies from the US, Europe, and Japan between 1995 and 2004. Besides this trend, Sturm [
11] notes an appreciation of this strategy by shareholders as long as the assumed Earnings Before Interest and Taxes (EBIT) was at least 15%. The author found no significant differences in the performance of diversified companies compared to focused companies regarding Return on Sales (ROS) and Return on Capital Employed (ROCE). In addition, the study shows that 80% of all diversified companies, compared to 73% of all focused companies, grew in terms of both revenue and profit. Based on these findings, Roland Berger Strategy Consultants performed an enquiry among 39 German companies, which confirmed the assumed trend to diversify operations. A total of 80% of the companies had diversified within the last five years [
11] (pp. 1–2). According to the results reported in [
11] (pp. 1–2) and in Roland Berger Strategy Consultants [
13] as well, the key to successful diversification is based on an accurate selection and consequent integration of businesses. Among the most important parameters for the selection of new businesses are the strategic relatedness of the companies’ core competence, regional and political stability of the targeted regions, and government support. A divisional organization with local responsibility for the acquired businesses is the favored long-term corporate structure [
11] (pp. 1–2). Roland Berger Strategy Consultants [
13] (p. 27) add up to their aforementioned conviction that diversification is a good actual and future business model. Apart from the reduced risk for the firm, the main reasoning is the possible realization of growth options. These authors also state that this is especially interesting for companies that suffer from low margins in their actual businesses.
Table 1 gives an aggregation of the main findings of the above-discussed studies regarding the performance of diversified compared to focused companies.
2.2. Synergies within Integrated Firms
2.2.1. The Basic Synergy Concepts of Ansoff and Porter
In an economic context, “synergy” goes back to Igor Harry Ansoff’s book
Corporate Strategy in 1965, and was fundamentally extended as a concept by Michael E. Porter in his book
Competitive Advantage, published in 1985 [
14] (p. 17). Ansoff [
15] was the first one to describe and investigate that the value of a combined use of resources can be higher than their separate use. This finding is often described as the “2 + 2 = 5 effect” [
14] (p. 13). Ansoff’s research focused on a description of the effect of synergies, which he describes as the positive effect on the return on capital through realized synergies [
14] (pp. 17–20):
In this equation the return on capital is defined as
Ansoff [
15] generally distinguishes between four types of synergies, namely, (1) income synergies (increasing the company’s revenue); (2) operating synergies (decrease of production costs); (3) investment synergies (lowering the employment of capital); and (4) management synergies. Management synergies can cause both increased revenue and reduced costs [
14] (p. 18). Ansoff expects a higher synergy potential between related than unrelated businesses [
16] (p. 15). Porter [
14] sees the realization of synergies as a basis for the long-term competitive advantages of a company. He analyzed synergies based on a value chain approach. To this end, he divided companies’ business units into strategically relevant functional units, finding material and immaterial interrelations between these functional units [
14] (pp. 20–23). According to his understanding, Porter considers synergies on the level of business units rather than at a corporate level, where the strategic focus lies on risk diversification. Thus—similar to Ansoff—he sees some synergy potential, especially between related businesses [
16] (pp. 16–17). In contrast to Ansoff [
15], who compared the overall performance of stand-alone and combined businesses (cf. Equation (1)), Porter compares the effects of interrelations between the company’s functional units separately. He found five types of material interrelations, namely, (1) production interrelations; (2) market interrelations; (3) procurement interrelations; (4) technological interrelations; and (5) infrastructural interrelations. Immaterial interrelations are caused by skill and knowledge transfer between different functional units [
14] (pp. 20–23). For Porter [
14], the main attributes for the realization of positive synergies are the interrelation caused by cost advantages or differentiation, low risk of imitation by competitors, lower costs for realization than costs for combined use of resources, and that the interrelation has to be realized within high cost or high revenue activities [
14] (pp. 20–23). On the one hand, Porter sees advantages in the combined effort along the value chain due to a more intensive use of resources. On the other hand, he identified problems in the combined effort that can lead to increased costs, namely, (1) costs of coordination (e.g., costs for extensive information technology (IT) systems); (2) costs of compromise (e.g., due to organizational structures that are less optimal than the ones of formerly independent businesses); (3) costs of control (e.g., costs for extended governance to avoid opportunistic behavior); and (4) and costs of inflexibility (e.g., due to reciprocal dependency) [
14] (pp. 20–23).
Following the basic work of Ansoff [
15] and Porter [
14], synergies have been subject to multiple studies, setting the focus on different characteristics and extending the concepts towards different directions. Generally, benefits of a combined effort are only regarded as synergies if they would not have been realized by the stand-alone businesses. Furthermore, the general understanding is that there can be positive synergies as well as negative ones (“dyssynergies”). This makes it necessary to evaluate both effects in order to evaluate the net synergies, which should be positive in order to make their realization reasonable [
14] (pp. 13–14). However, today there is still no general definition for the term “synergy”, which makes it necessary to define it for the purpose of this study.
2.2.2. The Synergy Concept of Müller-Stewens and Brauer
Some authors by definition exclude certain types of benefits through operation of a multi-business firm from the term synergy. As our study focuses on the question whether operation of a multi-business firm is beneficial, it does not make sense to exclude any types of benefits or synergies from the evaluation a priori. In [
10] (pp. 350–351), following a global approach that includes all types of potential benefits, the authors found the realization of synergies to be based mainly on coordination at the corporate level. Therefore, in our study the categorization of synergies draws on this concept. Based on the concepts proposed by Ansoff [
15] and Porter [
14], Müller-Stewens and Brauer [
10] (pp. 350–351) systematically distinguish between four basic types of synergies, namely, (1) operational synergies; (2) management synergies; (3) financial synergies; and (4) synergies of market power.
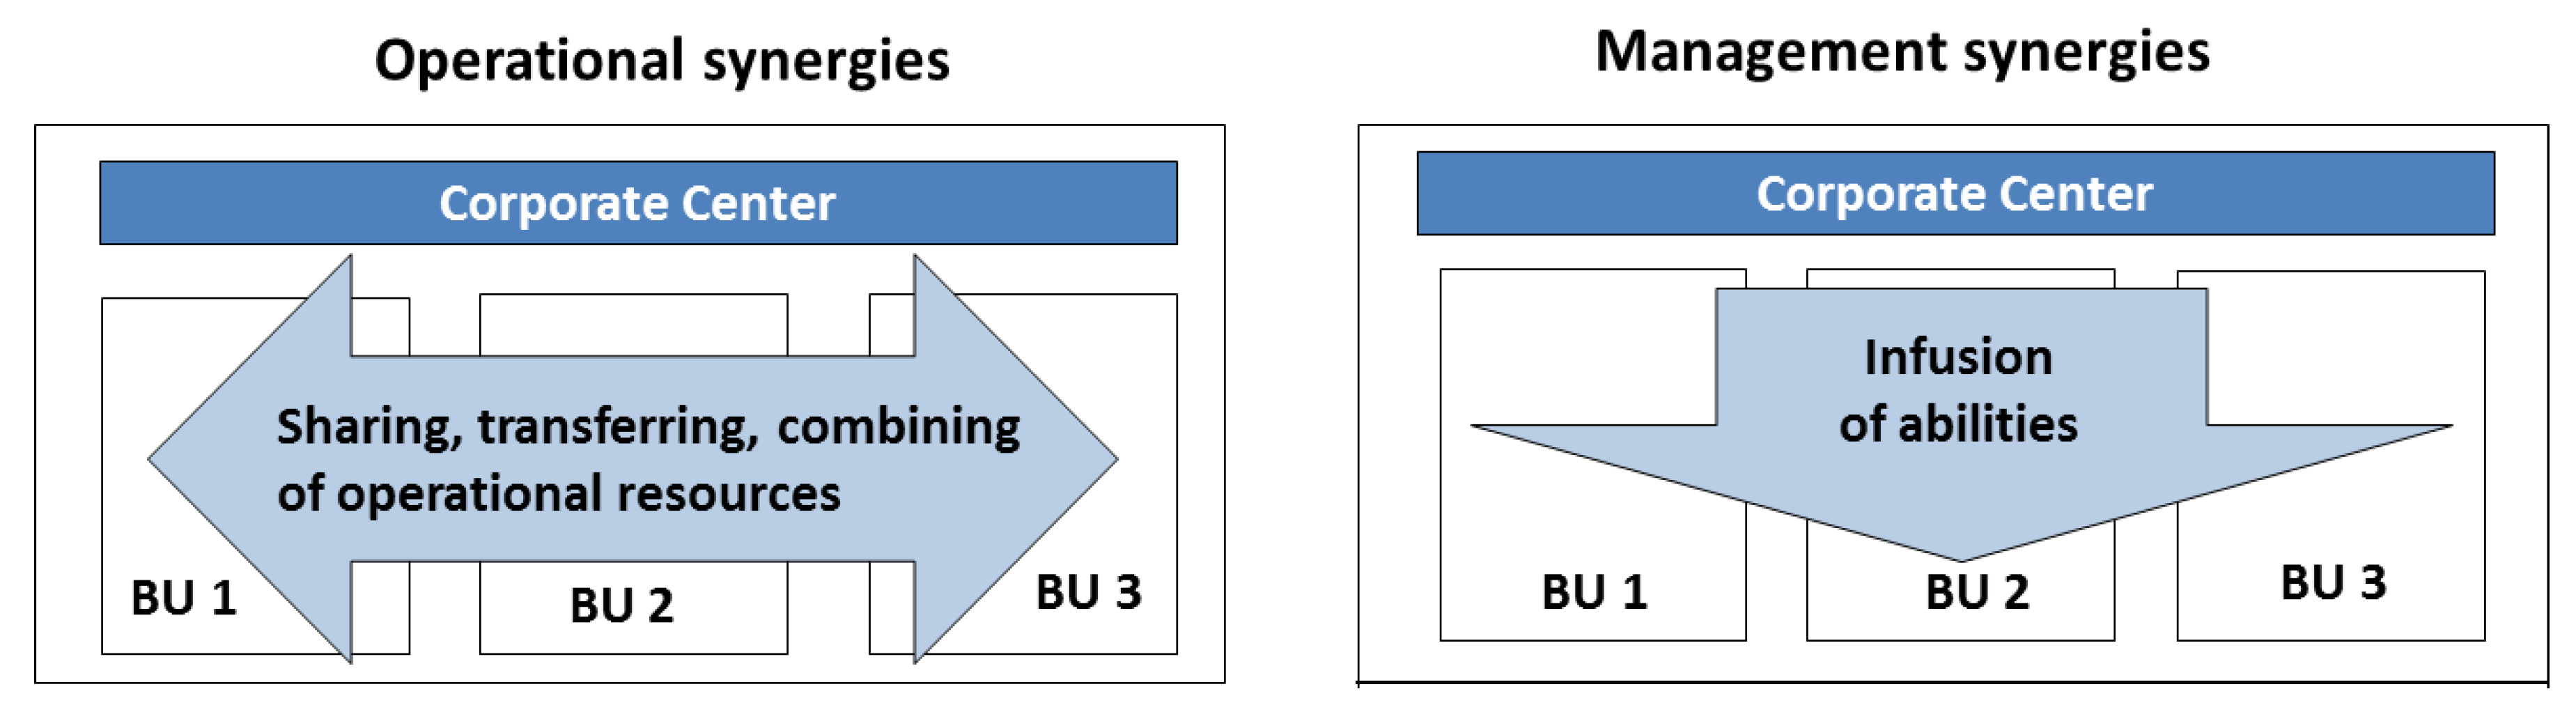
Figure 4 gives an overview of the first two of the above-described synergy types and their further specification. As synergies of market power are mainly collusive, they will not be subject of the evaluation within this study. Financial synergies are generally accepted to be one of the main reasons for the creation of multi-business firms. Our study focuses on the evaluation of synergies in the context of multi-business utilities. Financial synergies are similar to all types of multi-business firms. Therefore, they will not be subject to closer evaluation here either. In addition, RWE ran a sophisticated portfolio strategy management tool that includes the most influential financial synergies. The results of our study can form the basis for further investigations on the question whether other synergies could potentially be included in this tool.
As indicated before, the focus of this categorization lies on the potential gain of value on the corporate level of a multi-business firm. Therefore, in this overview, the corporate center is shown overhead of three exemplary business units (BUs). Müller-Stewens and Brauer [
10] (p. 354) refer to BUs as strategic ones. Every BU, therefore, represents a certain functional unit. The arrows in the chart show the direction of information or resources flow for the respective synergy types.
(i) Operational synergies. Operational synergies are advantages that derive from a joint use of operational resources across the borders of the different BUs. The joint use can be achieved by sharing, combining, or transferring both material and immaterial resources. The question hereby is how to utilize the resources that are only being used in one BU for other BUs. This joint effort can result in both cost advantages and income advantages. Examples for cost advantages from operational synergies are centralized internal and external service facilities (shared-services) for the entire firm, procurement at the corporate level, knowledge and best-practice transfer, and joint use of infrastructure. An example for income advantages is the possibility of offering diverse products to the same customers (cross-selling and integrated offers) [
10] (pp. 24–25; 354–355).
(ii) Management synergies. Management synergies are advantages that derive from certain abilities the corporate center owns and infuses into the BUs. Where operational synergies are based on the similarity or the complementarity of resources on the BU’s level, management synergies are based on the strategic fit between the abilities of the corporate center and the needs of the BUs. Examples for management synergies are the development of centers of excellence on the corporate level, such as for market research, mergers and acquisitions (M&A), and legal matters, or for innovation and growth, which can be used at the business level [
10] (pp. 24–25; 354–355).
Operational synergies are generally considered to have a higher potential value for a company with related strategic businesses. The scope of our study lies on this branch of synergies, which therefore is described in some more detail. Note that in the literature, the term synergy is closely related to the terms “economies of scale” and “economies of scope”, which both refer to operational synergies. As can be seen in
Figure 5, operational synergies can be both cost synergies and income synergies. Where economies of scale only appear as cost synergies, economies of scope can lead to both cost synergies and income synergies [
10] (p. 356).
As indicated before, cost synergies derive from a joint use—by means of sharing or transferring—of both material and/or immaterial resources. Müller-Stewens and Brauer [
10] (pp. 356–358) identify the main sources for cost synergies to be situations in which (1) different products can be fabricated from the same starting material (combined production); (2) existing infrastructure is not entirely being utilized in the existing production process; (3) bundling of similar services or standardization of processes can lead to economies of scale or learning effects; (4) best practices can be transferred to other business units; and (5) resources can be used in more than one business unit.
According to [
10] (pp. 358–359), income synergies derive from the combination of complimentary resources. Through combination of complimentary resources, both new markets and new customer segments can be reached. Müller-Stewens and Brauer [
10] (pp. 369–376) found the main strategies for the realization of income synergies to be (1) coordinated market penetration by means of cross-selling, bundling (e.g., one-stop shopping), coordinated marketing activities, or a family branding strategy; (2) joint production development by means of integrated solutions, technology and product platforms, or innovative combination of resources; (3) coordinated market development by means of development of new geographical markets, or development of new customer segments; and (4) combinatory diversification by means of expansion into new markets, or creation of new markets.
In the elaborations of synergies discussed above, Müller-Stewens and Brauer (pp. 369–376) remain on a rather theoretical level, providing a classification and specification of all kinds of synergies but not giving any insights or instructions on how to identify and evaluate the aforementioned synergies either qualitatively or quantitatively on a practical level.
However, both qualitative and quantitative synergy evaluation is of major importance. Only if the synergies’ potential value for the company exceeds the cost of realization of the respective synergies, the realization is economically viable. In addition, one has to consider whether the potential value of synergy realization is worth the risk. Therefore—in a first step—out of the numerous theoretical potential synergies, those which are the potential value drivers for the company have to be identified. In a subsequent step, these potential value-driving synergies need to be evaluated on a quantitative basis in order to justify the cost of realization.
Section 2.2.3 will present general considerations and selected concepts for qualitative and quantitative synergy evaluation. These are then used to analyze RWE as a selected European multi-business utility for its value driving synergies within this study of the 2012 situation.
2.2.3. Synergy Evaluation
Section 2.1 has shown that in modern economic science there is no clear definition for synergies. Acknowledging that it is already challenging to find a precise definition for synergies, research on contemporary studies shows that both qualitative and especially quantitative evaluation of synergies is even more challenging. Following Müller-Stewens and Brauer [
10], synergies have been categorized into operational synergies, management synergies, financial synergies, and synergies of market power. Based on this theoretical framework, this section focuses on more recent studies of concepts for synergy evaluation.
Concepts for Qualitative Synergy Evaluation
Rockholtz et al. [
17] (p. 189) identify checklist approaches, scoring models, cost-synergy analyses, synergy matrices (based on Ansoff [
15]), and scenario techniques to be the most frequently used instruments for qualitative synergy evaluation. Some of these instruments can also be used for quantitative synergy evaluation (e.g., scenario technique) [
18].
Figure 6 gives an overview of the different stages in (pre-acquisition) synergy evaluation (identification and evaluation) and the respective operational responsibilities as well as suitable measures and methods to achieve this.
Starting on the left-hand side of
Figure 6, the first potential synergies have to be determined and allocated towards the respective value-adding activities. This, for example, can be achieved by using the method of value chain analysis (cf. [
14]). The result of this determination could be a list, classifying potential synergies according to [
10] (pp. 369–376). The next step is the qualitative evaluation of the synergies found. At this step, the relative potential of the synergies has to be compared in order to find the main value drivers; also, the risk of non-realization should be evaluated here. One possible method for this qualitative evaluation is the use of a scenario technique. Proceeding to the right-hand side of
Figure 6, finally, a quantitative evaluation should be performed. Rockholtz, Berens and Brauner [
17] (pp. 190–192) suggests the use of financial plans in order to calculate synergy-based cash flows.
Stuckey and White [
19] (p. 15) suggest a checklist for qualitative evaluation in order to decide whether to vertically integrate (or quasi-integrate) or not. They also propose a specific checklist to evaluate whether an already vertically integrated business should be divested (see
Figure A1). They base their decision-making on both internal questions (e.g., the company’s competence) and external questions (e.g., market power of the respective company and competitors). In their empirical research, Rockholtz et al. [
17] (pp. 190–192) found external whole-company-based performance indicators to be often derived from performance indicators from annual reports or capital market developments. However, he assessed the internal numbers from managerial accounting, to enable allocation of success (based on cash flows) to the respective synergies, to be much more precise, and thus a better basis of any systematic due diligence approach (pre-merger or pre-acquisition).
Concepts for Quantitative Synergy Evaluation
Using Ansoff’s and Porter’s synergy concepts as a foundation, many authors have stressed the necessity of the identification and qualitative evaluation of synergies is necessary before forming a multi-business firm (e.g., [
20], pp. 13–16; [
21], pp. 4–5). Where this can be done based on general concepts, Burde [
20] (pp. 22–24) and Köppen [
21] (p. 124) does not find any general concepts for quantitative synergy evaluation in the literature. Köppen [
21] (pp. 9–11, 94) states that he found hardly any concepts, including sufficient models, for the quantification of synergies.
Other than qualitative synergy evaluation, it is subject to discussion whether quantitative synergy evaluation is necessary. Burde [
20] (pp. 22–24) finds evidence that many M&A experts are convinced that pre-merger synergy quantification is either unnecessary or—due to insufficient information—infeasible in practice. Quoting Coburn, Köppen [
21] (p. 97) emphasizes the necessity of quantitative synergy evaluation in order to justify multi-business models (“If you can’t put numbers on synergy, then it probably doesn’t exist”; p.124), which coincides with the market capitalization, reflecting the shareholders’ opinion about future value generation.
Apart from the lack of information in pre-merger situations, Burde [
20] (pp. 22–24) sees the biggest challenge in assigning numbers to each category of synergies. Whereas economies of scale are generally taxable, immaterial or strategic (“soft”) synergies, such as image improvement or knowledge transfer, are difficult to quantify. Despite these difficulties, according to [
20] (pp. 22–24, 26–27), in most of the relevant literature synergies are generally evaluated based on cash flows.
The (pre-merger) complexity in quantifying strategic synergies derives from the difficulty to predict other market participants’ behavior. Whereas intra-company synergy potentials are realizable independently of market participants, strategic synergy potentials are heavily influenced by market participants’ decisions. This can be subsumed as a dimension of “market closeness” [
20] (pp. 26–27).
Similar to [
20], Köppen [
21] (pp. 74–77; 124–134) distinguishes between non-strategic and strategic synergies, finding that non-strategic synergies usually result from the physical resources of the businesses. According to him, these synergies’ positive effects are generally short-lived but quantifiable. On the other hand, he describes strategic synergies to usually result from immaterial resources, such as know-how or positive reputation. These synergies’ positive effects are generally long-lived but hardly quantifiable due to causal ambiguity.
In light of the great challenges concerning the quantification and the long-term focus (high discount on values) of strategic synergies, Köppen [
21] (pp. 124–134) suggests disregarding these in order to obtain a more conservative and less risky synergy evaluation and avoid “pseudo-quantification”. He finds pros and cons for disregarding or weighting strategic synergies and recommends to at least critically review them and not solely to base multi-business models on these. He advises against quantifying strategic synergies, but instead to regard them as a “safety buffer” in the case of under-realization of non-strategic synergies [
21] (pp. 124–134).
3. Methodology
In order to analyze the European utilities responses to the development of the energy market in Europe and the performance of “integrated” versus “focused” European utilities, we make use of an inductive qualitative method, since the quantitative synergy evaluation demands deep insights and extensive expert knowledge of the respective businesses, which is beyond the scope of the present investigation.
For this research, data was generated and analyzed by including in-depth interviews, survey data, as well as workshops with strategy experts responsible for RWE’s operational companies. The approach adopted is in line with the research question and enables an assessment of the capital market’s opinion on future business models. It also enables to evaluate whether the multi-business model is still useful for the present energy market by gathering information from the relevant stakeholders.
Figure 7 depicts the stages of the research approach adopted in the present study.
After specifying the research problem and questions, research started with an extensive literature review, followed by the sample selection, where RWE was found to be the most representative company for the means of this research. Data was then collected by conducting qualitative interviews (undertaken by co-author J.F. during an internship) and company-internal workshops. The collected information was then systematically analyzed in order to gain an overall understanding of stakeholders in the energy market and their business strategy with regard to “integrated” and “focused” business structures. This, finally, enabled a well-founded assessment of existing potentials and resulting implications for the future energy market and possible business models.
4. Empirical Analysis
4.1. Business Structure and Market Analysis in the Energy Supply Industry
4.1.1. Energy Market Development in Germany and Europe
The value chain in the energy market can generally be divided into three business areas: upstream, midstream, and downstream. The upstream businesses include all operations performed in order to generate secondary energy, which—in the discussed case of grid-bound energies—is electricity or gas. Exploration and production (E&P) refer to crude oil and natural gas, which can often be (co-) produced from the same field or location. Generation refers to the generation of electricity. The midstream businesses include all kinds of energy trading, encompassing short- and long-term contracts, over-the-counter and standardized energy exchange deals, supply, origination, proprietary trading, etc. All operations of energy transmission, distribution, and retail to the end consumer are considered as downstream businesses.
Transition into a Liberalized Energy Market
While after liberalization of the German energy market in 2005, a process started in the late 1990s, eight supra-regional utilities existed at the beginning, after implementation of the unbundling directive only four supra-regional utilities, which owned the transmission network of their business areas, remained: RWE, E.ON, Vattenfall Europe, and EnBW [
22] (p. 93). With the liberalization of the energy market and the unbundling legislation, the regulatory framework and thus market environment changed for all players.
Figure 8 depicts the resulting generic business models.
Due to the unbundling legislation, the supra-regional utilities (a) and upstreamers (e) had to separate the transmission networks from their remaining businesses. Management, administration, and information systems have to be set up separately, de facto leading to two separate firms (although these are still allowed to own the business). Utilities are generally still permitted to own local distribution networks, but these are now strictly regulated. Compared to the situation before the liberalization, additional players can compete in the market, namely, retailers (c) and grid operators (d). Grid operators are the only players in the market permitted to own and operate transmission networks. They have the option to also operate distribution networks, if desired. Their entire business is strictly regulated ([
23], pp. 334–335; [
24]). Due to the now non-discriminatory market access through regulated transmission and distribution grids, retailers can enter the market. The retailers’ BM is characterized by their focus on final consumers without owning or operating their own generation facilities. Therefore, retailers need to act in the energy trading business in order to procure their energy supplies from energy traders, such as upstreamers, supra-regional, or local utilities. While in the monopolistic market, prior to liberalization, participation in distribution and retail business were an option, supra-regional utilities forward-integrate towards the final consumer in order to secure their assets and businesses, especially against retailers. In addition, where trading in the monopolistic market only takes low effort, trading in a liberalized market with new competitors is highly sophisticated [
22] (pp. 98–99). However, whereas—shortly after market liberalization had started—supra-regional utilities tended to integrate along the energy value chain, at the same time many of them refocused on their core competences, selling parts of their conglomerates.
Partly Re-Regulation of Energy Market
Recently, utilities not only had to deal with major changes to their former business environment because of liberalization and unbundling directives, but also with certain legislations aiming at environmental and sustainability aspects (partly re-regulation). The most important impacts of these initiatives shall briefly be summarized in the following. In Germany, the first law for promoting the share of renewable energy, the so-called “Stromeinspeisungsgesetz” (StromEinspG, “Act on the Feed-in of Electricity to the Grid”), passed the parliament in 1990 [
26]. This law was followed by the “Erneuerbare-Energien-Gesetz” (EEG, “Renewable Energies Act”), which is still in effect today. The EEG on the one hand grants priority to renewable energy sources, while on the other hand it provides for technology-specific feed-in tariffs [
27]. In addition, the EU directive 2003/87/EC for the trading of carbon dioxide (CO
2) emission allowances has been phased in since 2004 (transposition into German national law through the “Treibhausgas-Emissionshandelsgesetz”, (TEHG, “Law on Greenhouse Gas Emissions Trading”) [
27]. The effects of both feed-in priority and CO
2 costs shall be explained. The liberalized energy market is organized using a market-clearing price. The intramarginal power plant’s generation costs determine the energy price for all energy sold. Demand for energy varies hourly, daily, and seasonally, leading to the specific minimum and maximum capacities needed. Utilities make their profits through the spread between achieved market prices and marginal short-term generation costs. Renewable energies are granted priority. Therefore, available capacities of renewable sources push other conventional capacities out of the merit order. In addition, the CO
2 costs increase the marginal generation costs of the fossil power plants, depending on their respective efficiency and the fuel’s carbon content [
28] (pp. 106–108). This leads to the effect that fossil power plants with high marginal costs have less full-load hours, due to renewable energies forced into the market, and that marginal revenues of the conventional fossil-fueled power plants decrease as these have to acquire carbon permits. Both effects lead to existing fossil-fueled power plants being less profitable for utilities, which—due to long lifetimes of large-scale power plants—is also a planning challenge [
28]. Renewable power plants, especially wind and solar, are characterized by relatively low marginal generation costs. With rising shares of renewable energies, this leads, on the one hand, to merit order effects and thus decreasing marginal revenues for all technologies and eventually to a latent “missing money problem” for both renewable and non-renewable energy technologies [
29]. Sinking marginal revenues, on the other hand, lead to a decrease of investments in new capacities, which could lead to failure of the existing energy market. Finally, for the German energy market, the phase-out of nuclear power generation—which is an important baseload supplier with low marginal costs—has a major impact on utilities’ profitability [
22] (pp. 101–102). While more and more EU directives are transposed into national laws throughout Europe, in order to homogenize the energy market, similar to Germany, different countries impose different legislations for their home markets. There are also major differences regarding market liquidity. For a supra-regional utility, this leads to additional uncertainty. The previously discussed changes in the German and European energy market since its liberalization show the severe impacts regulatory changes can trigger regarding utilities’ environment and business models. The discussed impacts of regulatory interventions—such as those the EEG has caused on market functioning or failure—show that future regulatory interventions will follow in order to adjust former imperfections (e.g., possible introduction of capacity markets). Apart from general uncertainties, e.g., regarding the economic development and price uncertainties, these uncertainties lead to the challenging question of what business model and portfolio is the most robust for possible future developments. This is even more important in light of the relatively long lifetimes of large-scale power plants. In order to investigate the optimal future business model, in
Section 4.1.2 the performance of multi-business firms and focused firms in general are discussed. In the next step, the performance of multi-business utilities compared to more focused utilities in the changing European market is examined from the 2012 perspective.
4.1.2. Performance of Firms with Different Business Models in the Energy Market
Integrated Utilities
RWE: At the end of 2012, RWE had a market capitalization of €21 bn. Since 2008, the firm had lost −55% of its market capitalization (Reuters [
32]; OnVista [
30]). RWE employed a total of 72,000 staff and was divided into eight (partly subdivided) business units: RWE Dea (upstream business), RWE Power, RWE npower, Essent, RWE East (all of which are regional generation and/or retail and distribution companies), RWE Deutschland (regional distribution and retail company), RWE Innogy (global renewable business), and RWE Supply & Trading (supply, commercial optimization, origination, and trading) ([
25,
28]). At the end of 2011, RWE had a total installed capacity of 49 GW, generating 206 TWh and selling 295 TWh of electricity in that year. Gas sales accounted for 322 TWh. Conventional power generation, distribution, and retail accounted for 84% of the company’s 2011 EBITDA, upstream business for 11%, and renewable energies for 4% of the company’s EBITDA ([
25,
28]). RWE’s strategy in 2012 focused on becoming more sustainable, more international, and more robust. These targets were to be achieved by further increasing the firm’s generation and retail businesses in emerging markets outside of Germany (but inside Europe) and increasing the share of renewable energy generation in the portfolio. At the same time, the focus was on the highly profitable upstream business. The downgrade to a BBB+ rating is mainly a result of the company’s high net debt/EBITDA ratio [
25,
28,
31]. Therefore, RWE planned to continue to divest non-core businesses, cut costs by increasing efficiency, and consider lean capital strategies (such as partnerships instead of full ownership of assets) [
25,
28]. Over the three years from 10/2009–10/2012, the German utility RWE has underperformed both the STOXX
® Europe 600 Utilities index and the German leading share index DAX [
31]. In
Section 4.2, RWE’s business structure and strategy at that time are discussed in some detail.
Focusing Utilities
National Grid (focus on regulated businesses): In 2012, National Grid had a market capitalization of €32 bn. Since 2008, the firm had gained 16% in market capitalization, and since October 2010, 39% [
30,
32]. National Grid employed a total of 25,000 staff and was divided into three business units: UK Transmission, UK Gas Distribution, and US Regulated. All units consist of regulated business only. National Grid did not have any own generation facilities or retail business [
33]. Some 38% of the company’s 2011 EBITDA were earned by UK Transmission, 21% were earned by UK Gas Distribution, and US Regulated accounted for 36% of the company’s EBITDA [
33] (National Grid, 2012). National Grid’s declared strategy was to remain focused on its grid operations. Alongside with its stable regulated business and increase of market capitalization came a stable A rating [
31,
34]. Over the three years from 10/2009–10/2012, the company outperformed both the STOXX
® Europe 600 Utilities index and the British leading share index FTSE 100 [
30].
Centrica (focus on upstream business). In 2012, Centrica [
34] had a market capitalization of €21 bn. From 2008 until 2012, the firm had gained 24% in market capitalization, and since October 2010, 11% [
30,
32]. Centrica employed a total of 35,000 staff and was divided into four business units: Downstream UK (retail of gas and electricity), Upstream UK (mainly oil and gas production, but also generation of electricity), Storage UK (gas storage), and North America (upstream gas production, power generation, retail). Hence the firm was diversified, but with a clear focus on upstream businesses [
34]. At the end of 2011, Centrica had a total installed power plant capacity of 9 GW, generating 32 TWh of electricity in that year. Upstream gas production was 80 TWh and gas sales amounted to 170 TWh. Upstream UK accounted for 42% of the company’s 2011 EBITDA, while 41% were generated through Downstream UK, 13% through North America, and Storage UK accounted for 4% of the company’s EBITDA [
34]. Centrica’s declared strategy focused on a further increase of the upstream business (“grow 50% by 2014”) and renewable energy generation (mainly offshore wind). Alongside with its profitable upstream business, a very low net debt/EBITDA ratio of only 1.1, and the increase of market capitalization, came a stable A rating [
31,
34]. Over the three years 10/2009–10/2012, the British utility Centrica had outperformed both the STOXX
® Europe 600 Utilities index and the British leading share index FTSE 100 [
30].
4.1.3. Summary and Discussion of Findings
Figure 9 shows the relative development of the share prices of some selected utilities out of the above-discussed utilities in comparison with the STOXX
® Europe 600 Utilities index from October 2009 to October 2012. The STOXX
® Europe 600 Utilities index reflects the development of a representative portfolio consisting of selected European utilities, including all the above-mentioned ones except CEZ. Thus, the index reflects the overall development of the European energy market [
35]. As can be seen in
Figure 9, the general trend was that the diversified utilities, such as RWE, underperformed compared to the STOXX
® Europe 600 Utilities index, while the two more focused companies, National Grid and Centrica, outperformed the index.
This leads to the question of whether the diversified business model is outdated for the European energy market. Can the answer to this question be given solely on the basis of the utility’s business model and the performance in the last years preceding the analysis? The conventional generation (and retail) business units of most of the above-discussed diversified utilities accounted for a high share of the companies’ operational profits. For the more focused utilities discussed, in contrast, these business units were of minor or no importance. As discussed in
Section 4.1.1, especially margins from conventional power generation have recently been under pressure. Therefore, one could ask whether it is the utilities’ diversified business structure that causes the decrease of market capitalization, or if companies with high profit shares from this business generally suffer from poor future market outlooks. The most important businesses of the more focused companies happen to be “low risk” (regulated business) and/or highly profitable (upstream business). Hence, from an outside view, it is hardly possible to prove that the business structure of the respective companies and not the general market situation causes market capitalization to increase or decrease. It is complex, and thus challenging, to investigate the impact of the many (and partly contradicting) influencing factors affecting the respective utility’s performance separately. As discussed in
Section 4.1.1, the energy market has been changing rapidly in Europe. Depending on the utilities’ home country, these changes have been more or less significant. Whereas, for example, in Germany the big utilities by law had to divest their transmission networks in the late 2000s, this was not the case for all other European countries. In addition, European countries have implemented different promotion schemes for renewable energies, so that operating in the renewable energy business can be more or less profitable.
In
Section 4.1.1 and
Section 4.1.2, it was observed that most of the investigated utilities’ future strategies include an increased focus on renewable energies and transmission and/or distribution networks. These businesses are to a large extent being (re-)regulated. The increased focus on regulated businesses is presumably due to the guaranteed returns. However, the tense financial situation of many European countries as guarantors of these “low risk” returns can increase investors’ skepticism about the utilities’ future performance and thus lower their market capitalization. This, and the insufficient home markets, are presumably reflected by some utilities’ downgraded ratings. In general, companies’ performance cannot be investigated in isolation of the markets concerned where they are engaged. Amongst others, the general (local) economic performance, market growth or deterioration, market inefficiencies, and regulatory changes always have the potential to affect the profitability of the companies’ business models to an advantage or disadvantage, thus affecting their market capitalization. In
Section 4.1.2, the discussion of recent studies on the performance of multi-business firms compared to focused firms did not find a clear answer to the question which business model is the better one. However, according to
Section 4.1.1 and
Section 4.1.2, the key factor to generating more value and thus being rewarded with a corporate surplus is to be the “best owner” of a business. The general opinion is that a firm can only become the best owner of a business by realizing synergies. The detailed investigation on synergies and concepts for synergy evaluation presented enables to analyze the performance of multi-business utilities compared to focused utilities from an inside rather than an outside view.
4.2. RWE Group Structure and Functions
4.2.1. History of RWE
RWE was initially founded as Rheinisch-Westfälisches Elektrizitätswerk Aktiengesellschaft (RWE AG) in Essen on 25 April 1898. Planned as an institution to ensure the electricity supply of the city of Essen, the company already expanded its business outside of Essen in an early stage. In addition, the company vertically integrated both forward, especially into railway companies (in order to increase the number of electricity customers), and backwards into hard coal and lignite mining (in order to secure the company’s long-term fuel supply). Furthermore, transmission and distribution networks were developed and operated. RWE focused on large power plant units, strategically located within the growing networks of the company. Alongside this vertical and regional expansion came RWE’s strong position in the German electricity market, which was later expanded to also include the gas business. Already in early years, municipalities played a strong role as shareholders for the company [
36]. Mainly due to limited growth opportunities in its core business, in the 1980s RWE diversified both into related businesses, such as upstream and downstream oil (Deutsche Texaco, subsequently as DEA), and into unrelated and distantly related businesses, such as waste management (RWE Entsorgung), water supply, chemicals (in combination with the company’s oil business), construction (majority share in Hochtief AG), environmental services, telecommunication, and the mechanical and plant engineering industry (e.g., Heidelberger Druckmaschinen AG). In the 1990s, RWE was a large conglomerate [
36]; [
37] (pp. 165–166). In the early 2000s, RWE had started to refocus on its core business. Unrelated businesses have been divested in order to streamline operations. First, the focus was set to four business segments, namely, electricity, gas, water, and waste management. In 2012, this focus was concentrated on electricity and gas as the company’s core competences and business segments (but still vertically integrated along the entire value chain). The divestment of some non-core businesses (e.g., water supply) was still ongoing in 2012 [
36].
4.2.2. RWE’s Structure
In 2012, RWE was set up with RWE AG as the management holding that coordinates RWE’s operating companies. Due to corporate history, timeline of expansions, mergers and acquisitions, as well as reorganizations, these companies operated partly on a functional basis and partly on a regional basis. At the time, the company has been restructured and reorganized in order to make the operating companies more functional. As there are still uncertainties about the final structure and organization, the company’s situation in 2012 is discussed in detail in the remainder of this study. The major RWE operational companies were RWE Dea, RWE Power, RWE npower, Essent, RWE Innogy, RWE Supply & Trading, RWE Deutschland, and RWE East. Following the illustration in
Figure 1,
Figure A2 gives an overview of the fields of operation of the above-mentioned major RWE operational companies along the value chain in the energy market. It is to be noted that some companies were active in more than just one step of the value chain and thus not set up as pure functional business units. These are the regional companies RWE npower (covering RWE’s activities in the UK), Essent (covering RWE’s activities in the Netherlands), and RWE East (covering RWE’s activities in Central Eastern Europe/CEE and South Eastern Europe/SEE), as well as RWE Deutschland, which combines (electricity and gas) grid operations and retail in Germany.
Table A1 expands the illustration in
Figure A2 by the regions where the operational companies (subsidiaries) were active in. RWE Deutschland operated with additional regional subsidiaries in both distribution and retail businesses (RWE Vertriebs AG, enviaM, KEVAG, LEW, Süwag, VSE, and KELAG).
4.2.3. Classification of RWE’s Assets and Activities into Asset Classes
The fact that RWE’s operational companies consist of both businesses active in different regions as well as different functions makes it necessary to define “asset classes” for a systematic analysis of RWE’s synergies. The main requirement for each asset class thereby is that it has to represent a homogeneous business. Homogeneous business means that the operations performed within the respective asset class have to be similar to each other, meaning that they have a similar operational structure, the same value drivers, or the same risk/return profile (e.g., based on fuels, fuel and carbon prices, etc.). In addition, only lines of business of major importance to RWE are considered.
Table 3 gives an overview of the asset classes into which RWE’s businesses were subdivided for the purpose of this study. Obviously, this classification is rather crude, but in a first step still allows to identify the main value driving synergy classes and synergies.
“Exploration and Production” includes all assets and operations necessary for RWE’s E&P business, including management and specialized services, representing mainly the operational company RWE Dea. “Generation” includes all assets and operations necessary for RWE’s conventional and nuclear power generation, including hard coal, lignite, and gas-fueled as well as nuclear power plants, but also lignite production and the processes needed for power plant operation, such as maintenance, specialized services, and specialized management. “Renewables” includes all assets and operations needed for RWE’s renewable power generation, thus representing RWE’s regulated generation business, including planning, construction, maintenance, and specialized services and management. RWE’s midstream operations are all performed by the operational company RWE Supply & Trading; due to the inhomogeneous business and for the purpose of this study, “trading” was subdivided into the four different asset classes. (“supply”, “commercial asset optimization” (CAO), “origination”, and “proprietary trading”). “Supply” includes all operations performed for the procurement of natural gas, including short-term and long-term procurement for both RWE’s sales operations and the use in power plants. It is also responsible for the gas portfolio optimization and LNG activities [
25] (p. 209). “CAO” is responsible for the group’s (mainly) asset-backed trading on behalf of the generation companies; it optimizes asset operation, fuel supplies, and hedging. This functional group within RWE Supply & Trading also handles the company’s legally required reserves and balancing operations and thus is the interface towards the generation companies on the inside and the TSO on the outside [
25] (p. 187). “origination” operates the group’s physical and financial customer business of non-standardized over-the-counter (OTC) products, including long-term internal and external back-to-back procurement, complex illiquid transactions and services, and principal investments [
25]. “proprietary trading” is RWE’s platform for non-asset backed trading operations, where all kinds of standardized energy products and derivatives are being traded in order to optimize RWE’s risk and return position in the market, including physical power, oil, gas, coal, and biomass transfers, as well as freight, weather, and carbon permits [
25]. “Grid” includes all the assets and activities performed that are necessary for the distribution of power and gas to the final customers. It is the company’s interface towards TSOs, regulatory institutions, irrespective of whether customers are buying from RWE or other companies active in downstream operations towards the final customers in the respective markets. Its operations also include maintenance, specialized services, and management. “Retail” includes all assets and activities performed in order to sell the company’s products—especially electricity and gas—to both industrial and private final customers. Finally, “Operations” include marketing, management of customer data, and services.
In addition to the classification of asset classes, it makes sense to distinguish potential synergies into synergies derived from the operation of two (or more) businesses or assets within one functional class (“functional synergy”) or within different functional classes (“cross-functional synergy”). As a further concretization, it is useful to distinguish whether the functional or cross-functional synergies are derived from businesses operated within one region (“regional synergies”, e.g., within Germany or the UK) or in different regions (“supra-regional synergies”, e.g., through operation in Germany and the UK).
4.3. Identification and Evaluation of Synergies within the RWE Group
The RWE Group’s potential and already realized synergies discussed within this study were identified in workshops with strategy experts responsible for RWE’s operational companies (held in 2012). In a first step, all kinds (regional, supra-regional, functional, and cross-functional) and classifications (operational, financial, market power, and management) of potential synergies were identified, regardless of their (potential) value and risk for the company as well as the effort needed for their realization. This ensured that possible or theoretical synergies were not disregarded at an early stage. In a second step, out of these numerous findings, the main value driving synergies were identified based on the relevance of the affected RWE businesses and further internal expert knowledge. In a third step, the main value drivers were clustered into similar synergies for further evaluation. The main value driving synergies and their categorization are discussed further below.
4.3.1. Relevance of Businesses for RWE
Main value driving areas can be identified based on their respective relevance regarding costs (including capital costs) or income.
Table 4 gives an overview of RWE’s 2011 key figures for value management and external revenues of the major operational companies.
In terms of the company’s capital employed, the fields of conventional power generation (especially Germany, the Netherlands/Belgium, and UK), retail (Germany, the Netherlands/Belgium, UK, and CEE/SEE), and distribution (Germany and CEE) can be identified as RWE’s most important activities. In terms of external revenues, it can be seen that, in addition, the company’s trading activities are very important. RWE’s activities in the fields of upstream and renewables were still of minor importance in terms of capital employed and external revenues, but the upstream activities contribute a high ROCE. In a study among 110 companies, [
10] (p. 4) finds the activities shown in
Figure 10 to be the ones with the highest (in 2006–2008, and expected future 2009–2013) synergy potential.
It can be seen that the highest synergy potential is found in activities mainly performed within the asset classes “retail” (sales/service and marketing), “generation” (production/supply chain, R&D, and procurement), “supply”, and “origination” (procurement, logistics, and sales), or are generally performed within all asset classes (IT, finance, human resources, and administration). Therefore, based on both the importance of businesses for RWE (
Table 4) and the activities with the highest suspected potential synergies (
Figure 10), the asset classes “retail”, “grid”, “generation”, and the interaction with the asset classes from the trading business (i.e., “supply”, “origination”, “CAO”, and “proprietary trading”) are subject to more detailed analysis. Internal company data and experiences reveal that the following parameters were the main value drivers for these asset classes:
Retail: Price/margin, sales volume, operational excellence (incl. retail hedge);
Grid: Regulatory interest rate, outperformance (regulatory asset management and operational excellence);
Generation: Commodity prices, regulatory environment, operational excellence;
Trading activities: Market liquidity/volatility, commodity prices, information asymmetry.
4.3.2. Main Value Driving Synergies within the RWE Group
Synergies within the Asset Class “Retail” (Functional, Regional, and Supra-Regional)
As indicated in
Section 4.3.1, retail business was of significant importance for RWE. The company had more than 23 million final customers, and retail accounted for more than €1 bn EBITDA, representing approximately 25% of the group’s enterprise value. RWE was active in the retail business in Germany, the Netherlands/Belgium, the UK, and CEE/SEE (
Table 4). According to [
10], sales activities also have the highest current and future synergy potential.
Figure 11a illustrates the main functional synergies within the asset class “retail”, based on the relationships and information as well as coordination flow between the respective businesses.
It can be seen that RWE npower was active as a retailer in the UK, whereas Essent was active as a retailer in the Netherlands and in Belgium. In Germany, RWE Deutschland is the parent company, with its subsidiaries RWE Vertriebs AG, enviaM, KEVAG, LEW, Süwag, VSE, and KELAG (active in Austria, but a subsidiary of RWE Deutschland) operating the retail business. In CEE and SEE, RWE East with its regional subsidiaries RWE Hungaria, RWE Polska, VSE (Slovakia), RWE Transgas, and RWE Turkey Holding operates the retail business. In light of the importance of retail within the value chain, RWE is keen to optimally utilize the group-wide retail know-how. The key measures to achieve this goal are (1) improvement of operational excellence through best practice transfer; (2) an increase in transparency and performance on all stages of the retail value chain; (3) standardization, innovation transfer, customer focus, and key performance indicators (KPI); and (4) support of retail risk management. Thereby, the target is not top-down implementation of one-size-fits-all solutions, but the best practice transfer between operational companies and joint effort in order to develop group-wide methods for benchmarking. Synergies were supposed to be derived from diversity, not uniformity. To ensure this, the pan-European (supra-regional) team established mainly consisted of experts from the respective operational companies, thus creating regional responsibility, while the group center only had a coordinating and steering role. The team was responsible for both the national and international (supra-regional) scope and used numerous approaches for group-wide performance increase. The team was subdivided into groups responsible for different scopes in order to ensure best practice transfer. In the following, these groups are listed with some of their most valuable approaches:
Group customer service: Definition of group-wide KPI for customer service, debt management optimization (e.g., E-Payment, E-Service), transfer of best practices across the group (“Customer service as sales engine”);
Group sales: Joint price perception strategies, retention campaigns and strategies (higher value of existing customers compared to new customers), joint development of sophisticated products for customers;
Group sales performance: Definition of group-wide benchmarks, development of sophisticated customer valuation models, standardized KPI reporting (e.g., regarding marketing efficiency);
Group sales portfolio management: Portfolio-based hedging, risk pricing, and margin risk management;
Group energy services/new products: Leveraging of existing business-to-business (B2B) and business-to-consumer (B2C) products across the group (West to East transfer of expertise in development of sophisticated key account products), development of smart energy solutions, innovation management (e.g., definition of best practice approach to pan-European product development), development of alternative energy efficiency products and services.
The major advantages of best practice and know-how transfer are a high value proposition and benefits with little capital employment. Through increased income and decreased costs, RWE was already able to realize additional value and estimates of high future potential.
Synergies within the Asset Class “Generation” (Functional)
As indicated in
Section 4.3.1, generation business is of major importance for RWE. RWE was active in the generation business in Germany (through RWE Power), the Netherlands/Belgium (through Essent), the UK (through RWE npower), and with a small share in CEE/SEE (through RWE East).
Figure 11b gives an illustration of RWE’s generation business and the main coordination flow as well as the direction of possible flow of tangible and intangible resources in order to realize the synergies. As can be seen, the generation business is very interesting regarding synergies. This is because there are different subsidiaries active and—on a smaller scale—many power plant units, which theoretically can be operated independently from each other. Regarding its substructure of power plant units and the main flow direction of coordination and resources, RWE Power stands representative for the other generation businesses, especially in the Netherlands and the UK. As indicated in
Section 4.3.1, the main value drivers in the generation business are commodity prices, the regulatory environment, and operational excellence. As a result of these value drivers, the most important synergies on this stage of the value chain can be found in the following activities and approaches for increased operational performance:
Collective fuel procurement (e.g., better contractual conditions through volume and more efficient logistics);
Steering of generation (e.g., collective management of service contracts, benchmarking, revision cycles);
Commissioning decisions/approvals;
Centers of excellence (e.g., project valuation, R&D, etc.);
Maintenance strategies, efficient deployment of staff, spare parts procurement;
Balancing of the power market (optimization of several power plants, securitization of the portfolio of power plants, less costs for the provision of energy reserve).
As shown in
Figure 11b, intangible resources—primarily best practices—are transferred supra-regionally and between different kinds of power plants (coal, gas, and nuclear). Tangible resources, such as technology-specific spare parts or specialized staff, are mostly only transferred between power plants of the same kind. Though theoretically feasible on a supra-regional basis, tangible resources, are mostly transferred on a regional basis. In order to reach a higher degree of synergy realization, RWE was setting up a supra-regional generation company in 2012—the new RWE Generation—effective as of January 2013. With this measure, RWE aimed at a high three-digit million € decrease in costs.
Synergies within the Asset Class “Grid” (Functional, Mainly Regional)
Similar to retail and generation, grid business has been of major importance for RWE in 2012. In 2012, RWE was active in the grid business in Germany and Austria (through RWE Deutschland) and in the Czech Republic (through RWE East; grid business on a smaller scale was also pursued in Slovakia, Hungary, and Poland). RWE operated both gas and electricity grids.
Figure 11c gives an illustration of RWE’s grid business and the main flow as well as the direction of possible flows of tangible and intangible resources in order to realize the synergies.
RWE ran several grid companies within Germany. The three biggest ones are Rhein-Ruhr Verteilnetz, Weser-Ems Verteilnetz, and enviaM Netz, which are shown as representatives for the entire business in
Figure 11c. The three grid companies shown, i.e., VCP Net, SMP Net, and JMP Net, are representative for all regional grid companies operated by RWE in the Czech Republic. The grid business in Germany is operated by RWE Deutschland, which works with the group center on a coordination and steering level. Similar to the retail and generation business, the grid business is very interesting regarding synergies. This is because there are many different subsidiaries and smaller grid units, which can be operated independently from each other. As indicated in
Section 4.3., the main value drivers in the grid business are the regulatory interest rate and outperformance (regulatory asset management and operational excellence). As a result of these value drivers, the most important synergies at this stage of the value chain can be found in the following activities and approaches for increased operational performance:
Joint asset management (e.g., asset deployment, maintenance strategies, knowledge transfer regarding grid design, spare parts and manufacturing, standardization and procurement of parts);
Operational excellence (e.g., knowledge transfer regarding efficient deployment of staff, workforce management, operational assignment of external contracts, advantages from standardization);
Regulation management (interaction with the regulator, e.g., structure of investment budget, application for grid charges).
As the grid business is regulated, it is of major importance to outperform other grid operators in order to achieve a margin above the regulated asset margin. However, it turned out that best practice transfer regarding superior regulatory management between different grid units within one region is of fundamental importance in order to ensure attractive grid tariffs. Due to different legal requirements and standards, functional synergies could mostly only be achieved on a regional basis (within one country).
Synergies between the Asset Classes “Retail”, “Generation”, and “E&P” (Cross-Functional)
In the subsections above, the main functional synergies within the asset classes “retail” and “generation” have been discussed in accordance with the findings regarding their relevance for RWE. In the light of the question whether a vertically integrated business model makes sense in the energy market, cross-functional synergies are of particular interest.
Figure 11d illustrates the main functional synergies between the asset classes “retail”, “generation”, and “E&P”, based on the relationships and information flow between the respective businesses.
Figure 11d shows the markets where RWE was active in with both the retail and generation business. RWE Dea has its headquarters in Germany, but is mostly active in other regions of Europe and Northern Africa. For the purpose of the synergies discussed here, no physical presence in the respective market was necessary for synergy realization. Generally, an integrated business model based on generation and retail especially makes sense in evolving markets. In the case of illiquid markets, the combination of generation and retail, on the one hand, secures the company’s supply with electricity for reasonable prices. On the other hand, in illiquid markets the retail business can function as a firm outlet and thus ease the way into the market. In addition, leveraging multiple experiences from mature North Western Europe (NWE) markets can be the key to success in evolving markets. Not only in evolving markets, but also in mature markets, an internal value chain can hedge the company’s risks in multiple ways. Both generation and retail (in liberalized markets) have a high market risk, but a low degree of correlation, which leads to a good hedge when both stages of the value chain are operated.
Figure 12 shows a schematic demonstration of E&P and generation business serving as a hedge for the retail business (in the UK).
In the scenario for this example, the gas price rises. As a consequence, in the UK, which is a market with a high share of gas-fired power plants, the wholesale power price increases. This leads to decreasing returns in the domestic retail business in the short term. At the same time, increasing wholesale power prices led to an increase in the returns on coal, nuclear, and renewable energy, while returns on electricity from gas-fueled power plants remained stable. In addition, higher gas prices led to an increase in returns from E&P. In the longer term, as higher wholesale prices for electricity are included in retail prices, retail income (from the 2012 perspective) was expected to normalize.
Similar to this scenario, a decrease in wholesale electricity prices, as has been observed over the years until 2012, and thus lower returns on generation, can (partly and temporarily) be hedged by retail business operations. Especially in customer segments with low price sensitivity (e.g., B2C, small businesses), decreased wholesale prices can be hedged by not directly passing them on to the customer, thus resulting in a margin shift from generation to retail. Apart from the multiple risk hedges, an internal value chain also led to cost advantages in terms of a reduction in the cost of capital, as discussed next.
Synergies between the Asset Classes from Stage “Trading” and Other Asset Classes (Cross-Functional)
The asset classes of the stage “midstream/trading” were of major importance for RWE.
Figure 13 shows the interdependencies between the different asset classes of this stage.
It can be seen that all asset classes had interdependencies with the trading stage. In addition, the asset classes within the trading stage had interdependencies with each other. The relationships between the asset classes within trading operations are mainly due to the fact that they shared the same infrastructure, e.g., cross-commodity trading desks, and specialized information technology providing them with the information required. In general, the function of the trading asset classes was to optimize RWE’s market position at all stages. Doing so, RWE Supply & Trading was the company’s face to the market and internally supports all other asset classes in their functions. One of the main synergies—in cooperation with generation and retail business—were reduced capital costs due to internal value chains. Other than trades with the wholesale market, internal deliveries and related trades did not require margining. Therefore, no deposit at the clearing energy exchanges had to be made, thus reducing the cost of capital and increasing the company’s financial liquidity.
Figure 14 illustrates this and other synergies between the stages of trading, generation, and retail.
In addition to the avoidance of deposits by internally delivering retail businesses, the risk of credit defaults was passed onto customers. In the case of a diversified multi-client portfolio, this lowers the risk compared to only few clearing banks in the wholesale market. The operation of trading asset classes in combination with businesses on other stages on the value chain provided a broad variety of expert knowledge, contacts, and options, which could increase the overall performance. Some examples for this are (1) logistics, market, and technical expertise; (2) saving of transaction costs through commercialization of EEG-volumes through a Center of Excellence (CoE) within supply and trading; and (3) provision and exploitation of additional options in illiquid markets (e.g., for retail), price hedge, arbitrage profits, market creation, commercialization of fuel positions, and strategic long-term optimization.
4.3.3. Clustering of Main Value Driving Synergies
An investigation of the main value-driving synergies found that these can roughly be categorized into four clusters of similar character: (1) shared services, (2) best practice, (3) commercial asset optimization, and (4) capital requirements. The following subsections provide a synopsis of the main findings.
Shared Services
Figure 15a illustrates the relationship (indicated by arrows) between the group center and the respective asset classes for the cluster “shared services”. On the one hand, shared services can be centralized at the group center, so that the operational companies procure the respective service from there. On the other hand, for example, if one subsidiary operates a regional infrastructure that is valuable for other operational companies as well, shared services can be provided in a decentralized manner.
According to
Figure 10, shared general central services, such as IT, HR, or procurement, are some of the most important activities in terms of potential synergy realization. To this point, they have not been discussed because of their general occurrence in firms of all sectors. Therefore, in order to give a complete overview, they need to be mentioned. In addition, also specialized services can be shared, for example, specialized technical services. The following two shared services were discovered to be of major importance for RWE:
Shared central services (collective management of IT, HR, infrastructure, health, project and portfolio management, technical know-how (benchmarking, revision cycles), procurement (logistics, fuels, spare parts, contracts), etc.);
Shared regional networks, infrastructure (e.g., cross commodity trading desks), and deployment of staff across operational companies, etc.
The more services are centralized, the higher the overhead cost becomes. One will always have to evaluate thoroughly whether a centralization of certain activities is reasonable; also, taking certain activities out of the responsibility of subsidiaries can cause decreasing performance of staff. In addition—if too many (specialized) services are sourced out of a subsidiary—the downturn can be that in the case of a divestment the business is unable to succeed as a stand-alone business and loses its attraction to potential buyers.
Best Practice
Figure 15b illustrates the relationship (indicated by arrows) between the group center and the respective asset classes for the cluster “best practice”. Best practice transfer turned out to be one major field of (potential) synergies for RWE.
Figure 15b shows that best practice transfer is especially meaningful in areas where companies have certain core competences, which provide them with competitive advantages, e.g., within the functional classes retail or generation. However, also a cross-functional transfer of these competences across the group can be highly valuable, e.g., establishing centers of excellence (both centralized and decentralized). One major advantage of best practice transfer is the high potential, while the cost of implementation is usually low. The following four best practice transfers turned out to be the most valuable for RWE:
Centers of excellence (e.g., project valuation, R&D, market knowledge, market data, forecasts, etc.); cost efficiency through one team only instead of various teams, also improving quality;
Operational excellence through knowledge transfer (e.g., efficient deployment of staff, workforce management, manufacturers/procurement intelligence, business development, market entry, price perception strategies, retention campaigns and strategies, development of products, use of valuation models, operational assignment of external contracts, advantages from standardization);
Regulation management (interaction with the regulator that is e.g., structure of investment budget, application for grid charges);
(De-)Commissioning decisions, steering generation, maintenance strategies, and timeline.
Commercial Asset Optimization (CAO)
Figure 16 illustrates the relationships (indicated by arrows) between the different asset classes and the midstream/trading functionalities for the synergy cluster “CAO”.
In
Section 4.3.2 it was found that all asset classes within the RWE Group and the trading activities benefit from each other, while the asset classes during trading are the company’s face to the market. The following five effects were assessed to be the most valuable for RWE:
Avoidance of transaction costs through internal deliveries and related trades, balancing power market (optimization of several power plants, lower costs for the provision of energy reserve);
Integrated optimization of assets, exploiting options/flexibility within the group portfolio;
Arbitrage profits, hedge of price risk (e.g., illiquidity hedge), market creation, commercialization of fuel positions;
Strategic (long-term) optimization/origination;
Offer of integrated solutions, cross-selling, dual fuel customers (one billing, one customer acquisition, one face to the customer, selling of new energy services).
Capital Requirements
Figure 17 illustrates the effect of the synergy cluster “capital requirements”.
The main financial effect, which is rather specific to companies of the energy branch, is the diversification of credit risks through internal deliveries (multi-client retail portfolio instead of a low number of counterparts/clearing bank) and general savings through the avoidance of transaction costs. In addition to the above-described effect through the creation of an internal value chain, including trading options, there are more effects influencing the capital requirements, e.g., tax benefits, advantages of an internal capital market, and the general risk reduction for the group through diversification. As mentioned before, one downturn of risk reduction through diversification is the capping of the upward potential.
5. Discussion of Results
5.1. Assessment of Potential Developments
The empirical analysis revealed that RWE already realized synergies in multiple areas. Furthermore, it was discovered that RWE still had a high potential of additional synergies in its portfolio. However, synergies are subject to change. Market and product development or regulatory changes, for instance, can be game changers. As the realization of synergies and thus achieving a corporate surplus is the main justification for multi-business firms to exist, (net) synergies have to be constantly evaluated. If, in the long run, the operation of business on a certain stage of the value chain is not profitable, the business model has to be reconsidered and the stage of the value chain potentially to be exited.
Figure 18 provides an overview of the main value drivers, general trends, and potential game changers in the most important stages of the value chain for RWE.
The main (potential) synergies of the RWE group were evaluated based on the value drivers shown in
Figure 18. It can be seen that the current general trends in the energy market already affected these synergies. These effects and the potential game changers, whose appearance was uncertain, are evaluated in the following. As mentioned before, conventional generation came under considerable pressure due to legislatively forced de-carbonization (carbon pricing via the Emissions Trading Scheme, EU-ETS) and promotion of renewable energies, leading to a decrease in operating hours, necessity of flexibility, and a decrease in margins. It was unlikely that the margins would recover.
On the contrary, an enforcement of de-carbonization was likely to happen. Regarding trading business, the 2012 trend was that energy markets get increasingly liquid and volatile. Evolving illiquid markets, e.g., in CEE and SEE, were gradually converging to Western European markets. Potential game changers were changes to the legal framework. Growing liquidity of markets decreases asymmetries, and thus generally lowers the potential returns from trading, but at the same time offer new opportunities for further transactions. High investments in grids were, and still are, necessary in order to be able to embed the growing share of renewable energies. Grids are regulated with a fixed return over certain periods of time. Potential game changers are changes to regulations, new technologies, and growing shares of decentralized generation. Regulated business provides risk-free returns for the time of fixed returns, but regulatory changes can potentially occur any time, sometimes drastically changing profitability. Finally, the current trend in retail is that markets become more and more liberalized, leading to competition in all segments. Potential game changers are re-regulation of markets, new technologies, and significant changes in customer behavior, so that how market conditions will develop in the future is prone to considerable uncertainty (on the identification and creation of new business models see also [
7,
8]). Next, the effects of the observed and expected further changes on the afore-discussed synergies of the RWE Group are discussed.
5.2. Potential Influence of Developments on Main Value Driving Synergies
5.2.1. Generation
The main synergies within RWE’s generation business are operational synergies, more precisely, cost synergies, through further increase in operational excellence by means of shared services and best-practice transfer across the group. These synergies are not affected by additional pressure on generation margins. However, RWE is well advised to further increase performance (also in terms of flexibility) in order to operate its assets profitably also in the future. Some power plants (mainly gas-fired ones) were already unprofitable, so that the question arose whether RWE’s generation portfolio was outdated.
5.2.2. Trading
With increasing liquidity in the gas market, the traditional midstream gas business, namely supply, becomes more and more unnecessary. Securing the supply with long-term contracts is gradually replaced by spot market trading. The asset class “supply” will therefore come under pressure; also, with fading information asymmetries and increasing liquidity, profitable business in the asset classes “proprietary trading”, “CAO”, and “origination” has become more challenging. However, higher liquidities also offer potential for new opportunities. One of the main synergy potentials of the trading business, in cooperation with generation and retail business, is reduced capital costs due to intra-firm value chains, and thus avoiding the deposits for margining and transaction costs. This synergy was not affected by market developments. In the case of changes to the legislation regarding deposits or transaction taxes for internal deliveries, this synergy might fade.
5.2.3. Grid
In light of RWE’s tense debt situation in 2012, highly necessary investments were generally not unproblematic. However, being top-notch in the European benchmarks, RWE was able to create high fixed returns in grid operation. The main functional synergies RWE realized in the grid business—operational excellence through best-practice transfer and shared services—were not that much influenced by potential game changers. However, in the case of a further increase in decentralized energy generation, RWE’s total income was expected to decrease, whereas costs would remain stable, leading to a decrease in the returns. In addition, regulatory changes (overregulation) could also lead to a decrease in returns. Consequently, RWE’s grid business would come under pressure.
5.2.4. Retail
Generally, in both regulated and liberalized markets, margins can be insufficient.
Figure 19 shows these constellations. Specifically, in highly liberalized markets with strong competitors, cut-throat competition can occur. If markets are overregulated, insufficient margins may also come up. Exceeding margins are also possible in both regulated and liberalized markets. Therefore, it cannot be said unambiguously whether liberalization enhances or deteriorates business attractiveness. With its group retail steering approach, RWE aimed at gaining, or at least holding, customers (sales synergies) by means of best practice transfer in customer valuation and customer service. Nevertheless, the question remains whether RWE would also succeed in the case of significant changes in customer behavior. However, retail business requires relatively low employment of capital. Moreover, when operated in combination with own generation assets, the risk of low returns can be hedged—at least temporarily. Because exceeding returns as well as insufficient returns are only temporary phenomena, the general risk through game changers is low as long as one operates with a broad portfolio.
6. Conclusions and Policy Implications
The realization of synergies and thus achieving a corporate surplus is generally considered to be the most important reason for the creation of multi-business firms. If multi-business firms fail to create more value than what the stand-alone businesses would do, they are charged with a corporate discount rather than a surplus. An evaluation of multi-business utilities of the European energy market revealed that, over the last years, most multi-business utilities not only underperformed compared to more focused utilities, but in the STOXX® Europe 600 Utilities index as well. In light of the rapidly changing energy market in Europe, the question is whether the multi-business model is outdated in the energy supply industry.
As a case study, the fully integrated utility RWE was selected as an adequate subject for synergy evaluation. For this purpose, the company’s activities were divided into functionally homogeneous asset classes, representing its relevant businesses. In a first step, all possible kinds of synergies (regardless of potential or realization) were put together in dedicated expert workshops. In a second step, the main value-driving synergies within the RWE Group were identified and subsequently evaluated.
The evaluation of synergies in the context of European multi-business utilities has shown both already realized synergies and potential synergies of significant value in multiple areas. However, based on numerous influencing factors, such as the general market development and regulatory changes, synergies are subject to permanent change. Some influencing factors have been identified as potential “game changers” on different stages of the energy value chain. In order to justify the effort that goes along with their realization, synergies have to be evaluated continuously. If, in the long run, the operation of businesses on a certain stage of the value chain is not profitable, the business model has to be reconsidered, and the stage of the value chain potentially to be exited.
Major trends, which put pressure on some of the important areas of activity of the RWE Group, e.g., generation and retail business, were identified. With its broad business portfolio, RWE was able to balance the resulting risks and to operate profitably. As indicated before, there is a high degree of uncertainty regarding the probability for future game changers. Therefore, no clear trend regarding trend impact on RWE’s business model and cash flows could be identified.
Potential game changers not only influence integrated utilities, but also focused utilities, depending on the affected stages of the value chain. If, for example, cut-throat competition would occur in a certain retail market, a utility focusing on retail business would be affected even more than an integrated utility. The integrated set-up would enable the multi-business utility to at least temporarily balance its returns, e.g., through margin shifts. The same is valid for other stages of the value chain. A utility focusing on the upstream business will be affected more by a decrease in margins through increasing gas market liquidity than an integrated utility, which could, for instance, temporarily shift margins from upstream to its gas retail business.
The other side of the medal is that focused utilities, which operate on a stage of the value chain that (temporarily) provides exceeding returns, may seem more attractive to potential investors in the capital market. Due to their business model (unlike focused companies), integrated firms usually have a capped upside potential, which potentially makes them less attractive in the short run. In combination with the conventional generation business being under pressure (merit order effect, CO2 prices, stiffened nuclear safety regulation, etc.), this could be an explanation why more focused utilities with minor generation activities outperform integrated utilities with strong generation business in terms of market capitalization.
The recently announced strategic decisions of E.ON and RWE to exchange assets, and follow a horizontal market segmentation strategy, refuels the debate on the usefulness of vertical integration of utilities in liberalized and rapidly changing energy markets. While RWE’s interest lies in carbon neutrality by 2040 and expanding their renewables and (flexible) conventional power generation assets globally, E.ON aims at focusing more on distribution grids and retail markets and end-use customer services (including e-vehicle charging). The deal has recently been taken to court for judicial review by a group of competitors in the German market, despite the fact that the European Commission had already given green light to the deal with only rather minor conditions [
38].
Based on the insights from this study, operating an integrated business model does not seem to be outdated in the energy market. On the one hand, integrated utilities will always have to carefully evaluate their realized synergies and the remaining synergy potentials. Based on a changing market environment, for example, a refocusing process away from one stage and into another stage of the value chain might be mandated at times. On the other hand, based on different kinds of synergy realization, such as risk diversification, operational excellence through best practice transfer, and shared services, overall, the integrated business model offers numerous advantages. Broad experiences offer the chance to leverage these into attractive markets.
Policy-makers are advised to carefully evaluate the trade-offs between the potential gains from unbundling of companies’ businesses in order to avoid cross-subsidization and gains in efficiency by allowing, or even fostering, the exploitation of synergies, where the expected social welfare gain is considered to be larger. Still, synergy potentials are subject to change over time, affected by regulatory amendments and rapid market evolution. This evolution is backed up by the urgent need for a sustainable energy transition, expected to lead to substantial decarbonization, digitization, decentralization, democratization—as well as sector coupling—and hence vast opportunities also for multi-business utilities.


