1. Introduction
The climate emergency is forcing many economic sectors to deeply reshape their usual development models and structure. One of the current hot topics is decarbonisation, involving the gradual substitution of fossil fuels with other resources to reduce the contribution to the greenhouse effect. Thus, decarbonisation may be considered as one of the most important macro-trends of this century, whose effects impact every industrial and civil activity, and the electrical supply system is directly involved in this process. Although both photovoltaic and wind turbines installed capacity has strongly increased in the last few years, the electricity generation from coal power plants is still broadly common. Coal still plays a major role in industrial activities in Europe, and its share in electricity production is even arising in developing countries owing to the low costs. However, as a starting point to achieve effective decarbonisation, many European countries are either heading to dismiss coal power plants or, at least, reduce their operation.
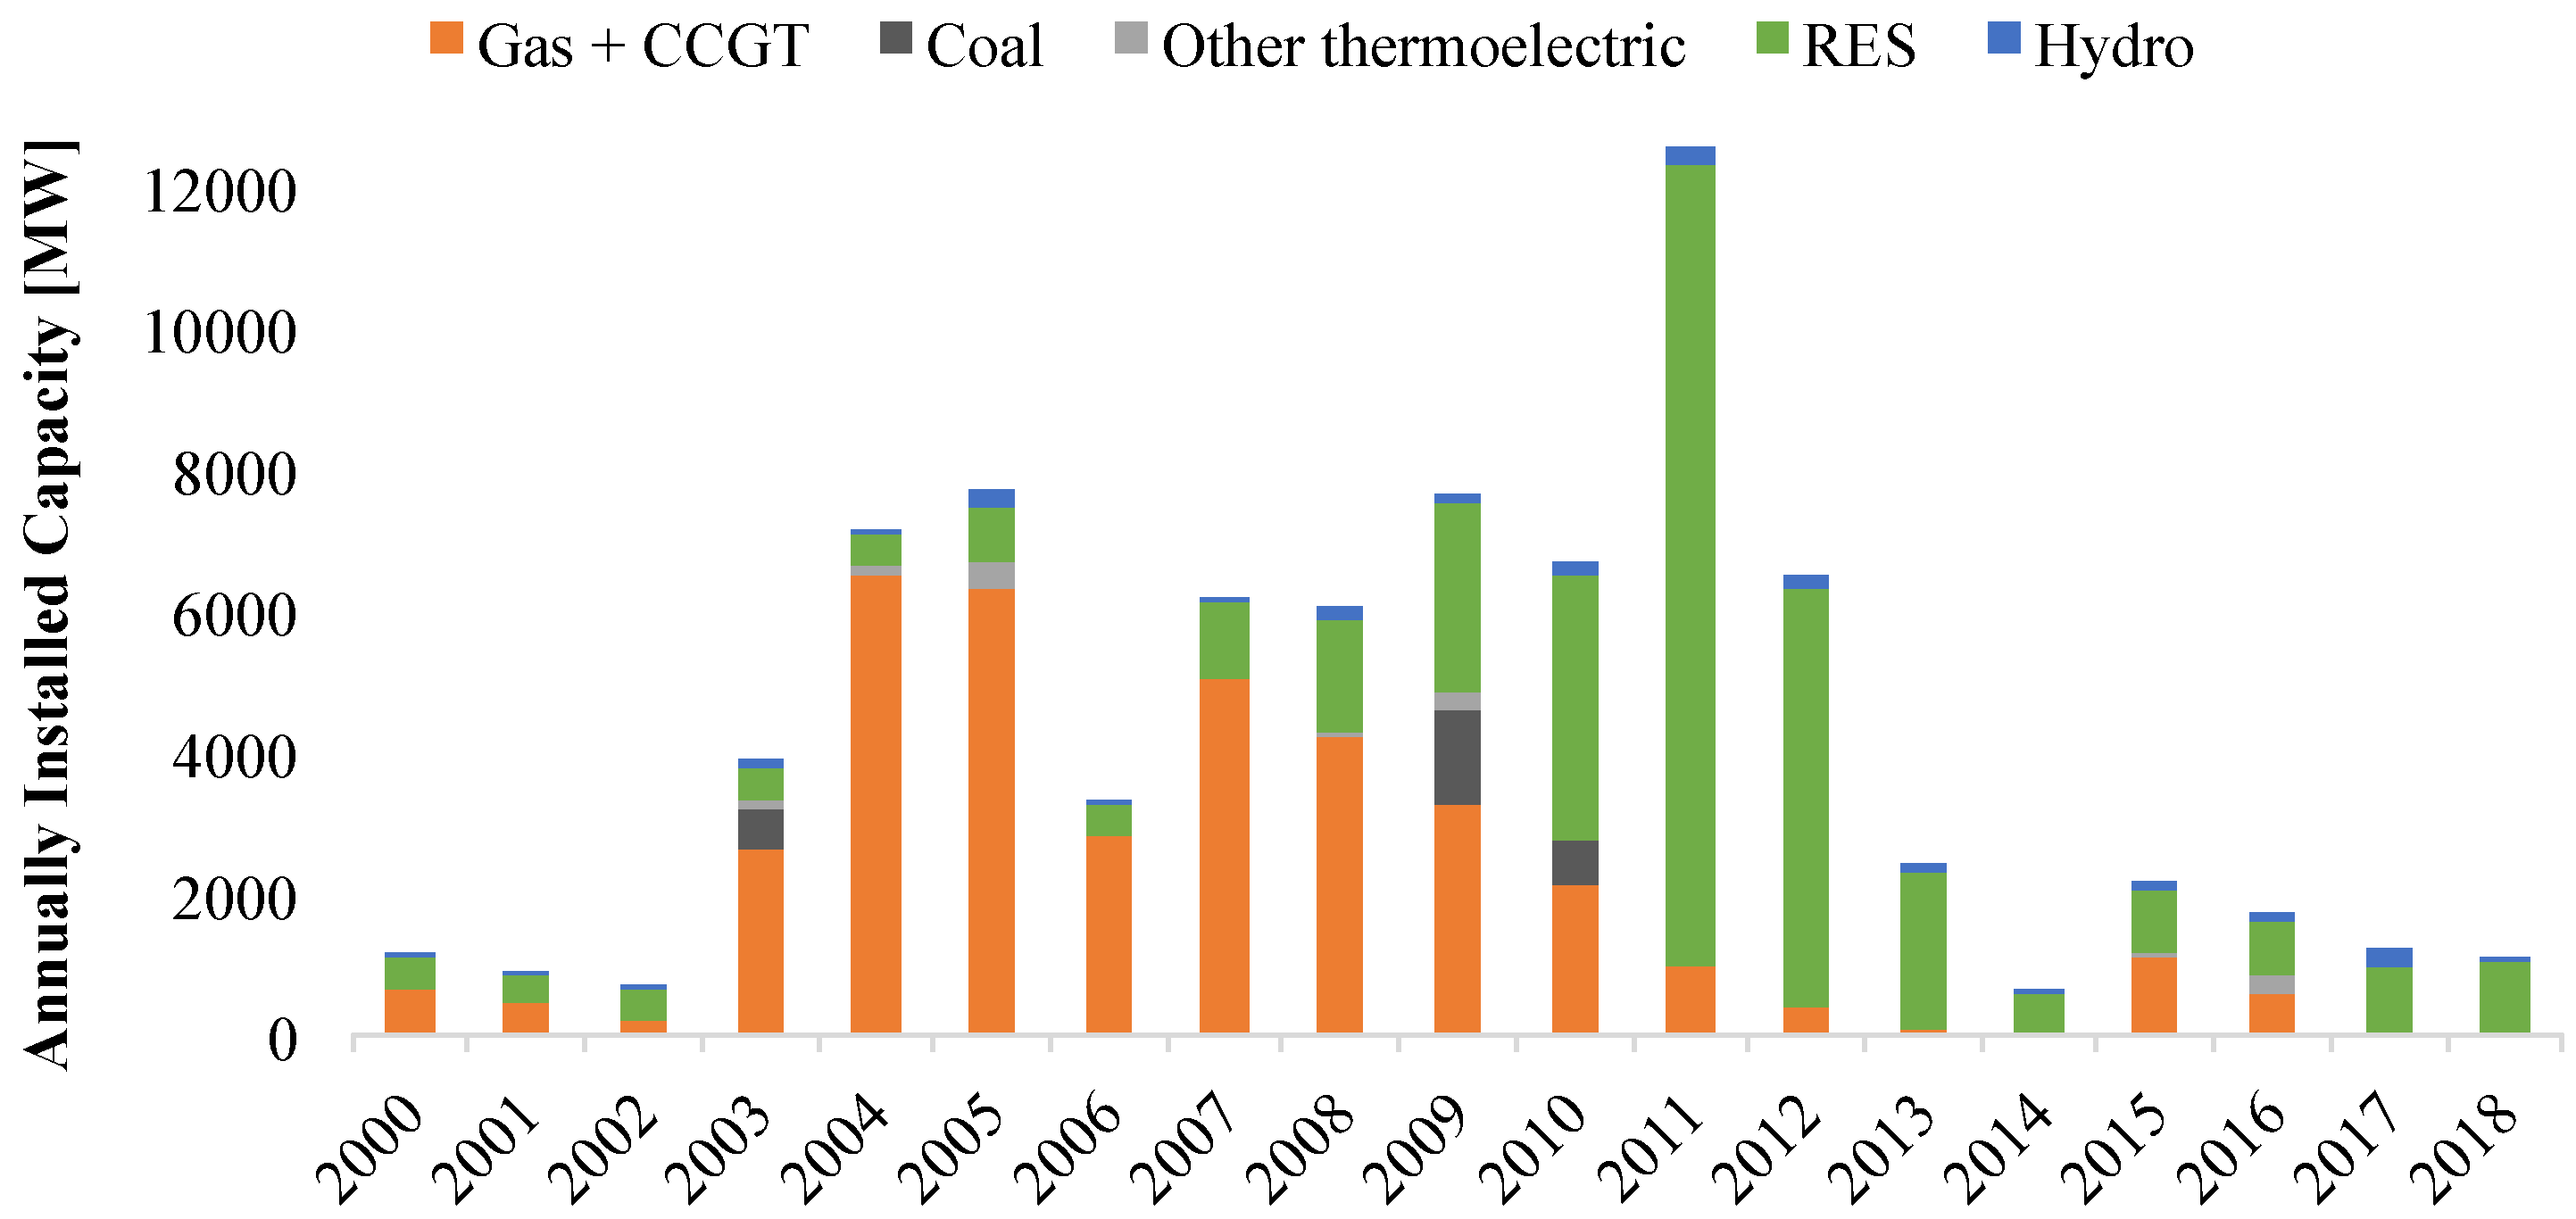
In this context, the Italian electrical system was deeply reshaped from the 2000s by two main drivers, dividing this time span in two phases. The first phase started in 2002 with the simplification of the administrative procedure to obtain the necessary authorizations to build new large power plants, deriving from the approval of the law 9 April 2002 n. 55 [
1], also known as “Sblocca Centrali” (Unlock Power Plants). This action, motivated by concerns about the supply system reliability, boosted the increase of the thermoelectric capacity, with about 36 GW installed between 2003 and 2010, as shown in
Figure 1, while from 2010 to the subsequent years, this trend was greatly reduced. The greatest part of these plants was based on combined cycle gas turbine (CCGT) technology, being less pollutant and expensive than coal-fired power plants, while a negligible part of oil and waste-fired plants (other thermoelectric) was installed.
In the same period, the European Union issued the Directive 2001/77/CE promoting the widespread adoption of renewable energy sources (RESs) [
3], starting the second phase of the Italian electricity market evolution. As a response to the Directive 2001/77/CE, the Italian government issued new policies, such as feed-in-tariffs [
4,
5,
6] or green certificates [
7], making investments in this sector quite attractive from the economic point of view. The obvious consequence was a massive installation of RES installed capacity, mostly photovoltaic (PV) and wind turbines, while traditional power plants observed a significant decline of their ability to trade energy on the wholesale market owing to feed-in priority reserved to RES technologies [
8].
Furthermore, the economic crisis that occurred in 2008 reduced the national electricity demand, further increasing the RES share. The combination of reduced energy production from predictable thermal power plants owing to feed-in priority and the reduction of the energy demand made the electricity market extremely unstable. In this context, many recently installed, high performing power plants increased the average market price with high supply offers or struggled to operate for the required number of hours to balance their capital costs. The decreasing trend of the contribution of CCGT to electricity production in Italy is shown in
Figure 2, although the reduced hydro production changed this trend again in 2014. The national annual electricity production ranged between 270 and 310 TWh in this period.
The most recent Italian Energy Strategy, referred to as the National Energy and Climate Plan (NECP), aims at obtaining a further expansion of RES, achieving a share of renewables in electricity demand equal to 55% and a share of 30% for the renewables in the gross energy demand by 2030 [
9]. To accomplish this goal, the Italian government deeply counts on solar and wind energy. The Italian NECP also points at the reduction of CO
2 emission intensity in the electricity supply system, forcing the disposal of all the coal-fired power plants by 2025; in order to fulfil this goal, some coal power plants must be closed before the end of their useful life.
The Italian roadmap towards the decarbonisation is shared with other European countries, as many countries belonging to the European Union (EU) discussed plans to abandon coal in the last years. As of mid-2019, the United Kingdom and nine out of twenty-seven EU countries fixed a time horizon for the coal phase-out, ranging between 2022 (France) [
10] and 2038 (Germany) [
11]. The debate on this topic is still open in other countries, and only in some eastern European countries such as Romania [
12] or Bulgaria [
13], there are no measures to reduce the use of coal to date. Keeping in mind the greenhouse gas emission targets and environmental issues, it is likely that coal plants will follow a steady decline in Europe.
In order to assess the consequences deriving from the phase-out of coal power plants, many researchers investigated the effects on the supply side [
14,
15,
16,
17], or the involvement of the electricity market [
18,
19,
20]. Nevertheless, the adoption of an approach integrating these two aspects at the same time would be recommended.
The research addressed in this paper assesses the effects of coal-fired power plants phase-out on electricity prices in Italy, comparing different scenarios and hypotheses according to the current regulation. The Italian grid was divided in six market zones and the power exchanges between the zones and with neighbouring European countries were considered. The study was performed according to a comprehensive methodology taking into account features from both the supply side and the market side, filling the gap existing in the currently available literature. Furthermore, the study aims at evaluating the adequacy of the current Italian supply system, in order to understand if it might stand the considered coal power plants phase-out scenarios.
Four different scenarios were analysed and described in this work, where the consequences of the early phase out in 2025 are compared with the outcomes of the natural scenario, where each power plant is dismissed according to its useful life. Furthermore, the bid-up of the market operators was also accounted for, compared with the scenario where the prices are formulated according to each operator’s production costs.
The paper is organised as follows.
Section 2 provides a wide literature review addressing the different aspects of the problem dealt with and evidencing the research gaps.
Section 3 describes the methodology and the model used for the simulations highlighting its strengths and limitations.
Section 4 describes the Italian generation system with a special focus on CCGT units. This allows deriving interesting conclusions concerning the role of CCGT in the coal phase-out scenarios and a suitable derivation of some cost terms.
Section 5 and
Section 6 show the results of the simulations and draw some conclusions and policy implications, respectively.
2. Literature Review
In this section, an overview of the most important studies analysing the transformation and development of the electricity market is provided. Most of the scientific literature available on the electricity market investigates the main factors driving the market, and a common goal is to understand which factors contribute the most to reshaping the wholesale electricity price. Many of these studies have been carried out in the last decade and almost all of them were developed in Italy or Germany. This literature review is divided into three subsections:
The first one gathers studies examining the impact of changes on the supply side, for example, renewable technologies production, nuclear phase-out, and CO2 emissions targets;
The second subsection describes studies analysing social and economic benefits deriving from mechanisms such as market coupling and capacity market and better management of power flows;
The last part deals directly with relevant studies discussing the consequences of coal phase-out policies.
2.1. Transformation of Capacity Mix and Its Impact on Prices
With the rise of RES penetration, many research papers investigated their influence on the determination of the wholesale electricity price.
Sensfuß et al. [
14] carried out an important study focused on the impact of wind and photovoltaic introduction on the German electricity market. The authors used an agent-based simulation model to determine the weight of the merit order effect on the creation of the wholesale price and to estimate the influence of renewables on the spot electricity market in Germany. The results point out that the merit order effect is significant to reduce the wholesale price and that the energy from wind and photovoltaic produced a welfare benefit for users between 2001 and 2006.
Another study validating the fundamental role of wind feed-in-tariffs in the spot electricity market was carried out by Keles et al. [
15], who merged two stochastic models based on historical trends in a unique simulation: the first model simulates the feed-in energy of wind during the year, while the second one reproduces how the spot electricity market behaves. Their results support the thesis that the merit order effect is a fundamental phenomenon in the determination of electricity prices.
Traber and Kemfert [
16] developed an optimization model (ESYMMETRY) able to simulate the electrical energy German market to assess the impact of wind energy. They took into account the start-up costs and the presence of oligopolistic agents in the market. With respect to a hypothetical scenario with no wind feed-in, the historical scenario shows that prices were 3.7 €/MWh lower, on average, in the period between 2007 and 2008.
The impact of renewables on the prices of electricity has also been broadly studied in Spain, as the share of solar and wind installed power in Spain in the last decade has remarkably increased. Azofra et al. [
17] used an artificial intelligence-based methodology (M5P algorithm) applied to wind production historical data from 2012; they analysed 111 scenarios with different percentages of real wind capacity in 2012 and their results show that the Spanish electrical system has a net economic gain as long as its wind production is equal or higher than 83% of the actual production value. Besides, the best scenario occurs when its wind generation is 110% of the real one, and under this circumstance, the whole simulated price reduction is 10.94 €/MWh.
Ballester et al. [
21] followed an econometric and statistical approach to assess whether RES affected the spot electricity price and its volatility on the Spanish electricity market. Analysing the market and production historical data from 2001 to 2013, they confirmed that RES brought a decrease in electricity price linked to more frequent price jumps and volatility. Nevertheless, their results underline that upward price jumps are rare.
The same issue has been highlighted in the United States. Martinez-Anido et al. [
22] developed an optimization model using a commercial software tool (PLEXOS) to evaluate the effect of wind power on prices of electrical energy of the Independent System Operator of New England (US). They simulated different scenarios and they concluded that the electricity price always decreases with the increasing wind share, although the price stability is affected. Nevertheless, in this study, wind energy proved to have a lower impact on price volatility in the short-term rather than in the long-term.
A regression-based approach was applied to about 21,000 hourly records of California Independent System Operator’s market prices and their most important drivers from 2012 to 2015. In this way, Woo et al. [
23] found that RES actually mitigated an electricity price increase occurred during that period, which was mainly related to the natural gas price take off, nuclear plants decommissioning, and economic growth.
Another huge transformation of production capacity mix may occur from nuclear phase-out policies, which gained strength throughout Europe in the last decade. Bruninx et al. [
24] presented an evaluation of the possible consequences in Germany of the nuclear phase-out. They applied a cost minimization model based on a multimodal power system design. Their simulations pointed out that congestion issues in some interconnections within the German power system might arise after nuclear decommissioning. Besides, nuclear energy would be replaced by coal or lignite power plants, thus increasing CO
2 emissions.
Other studies followed a different approach, determining the main drivers of the electricity price decline based on historical data. Kallabis et al. [
25] developed a model to identify which element led to the electricity price drop in Germany in the years between 2007 and 2013. The main benefit of using this model is the low number of inputs required and the low computational time, although this aspect implies that many simplifications were included. According to these authors, the fall of emission allowances price, that is, an allowance to release one tonne equivalent of CO
2 during a defined period of time [
26], was by far the most important factor, followed by the renewable energies feed-in. Bublitz et al. [
27] had the same aim but focused their study on Central Western Europe (CWE) electricity price (EPEX SPOT) in the years between 2011 and 2015. On the basis of two different simulation models, and contrarily to many similar studies, these authors showed that fuel and carbon prices have still a dominant effect on the wholesale electricity price.
2.2. Towards an Integrated Electricity Market
To implement an integrated European electricity market, the optimization of energy flows between countries is required, in order to obtain an even distribution of welfare benefits. To achieve this target, new power interconnections and market mechanisms are necessary.
Boffa et al. [
18] investigated a possible implementation of the Italian power transmission network, focusing on the north–south bottleneck. Their results indicate a non-linear relationship between energy flows capacity and wholesale electricity price, meaning that a small increment in Italian north–south connection capacity may provide a relevant price decrease, with a net welfare benefit for the end users.
An assessment of welfare benefits and economic gain for the Italian electricity market, under a market coupling trade design, was carried out by Pellini [
19]. The author used a deterministic optimization model (ELFO+++) to simulate the Italian day-ahead electricity market (DAM). In this model, the Italian market and grid were divided into seven macro-regions, that is, the actual six Italian market zones and a unique region for the import. The input data for this model were the energy flow limitations between regions. According to this study, a welfare benefit of at least 137 M€/year is to be expected supported by a market coupling mechanism. Moreover, a better management of international energy flows was attained.
Newbery et al. [
20] employed the ACER methodology to understand how a different handling of power flows between nations influences electricity prices in Europe. Simulations were carried out under market coupling rules for many cross-border connections throughout Europe. The resulting short-term economic gain was about 3.9 b€/year, which is more than 100% of the current gains from power trade through interconnection lines.
An agent-based simulation model (PowerACE) was designed and used to analyse the electricity market of the CWE region by Ringler et al. [
28]. The results concern welfare benefits and improved generation adequacy owing to the integrated market. The hypothesis that an integrated market brings many advantages was confirmed, from both an economic benefit and supply safety points of view. Nevertheless, these gains are not always homogenous throughout regions.
Another important change in the electricity market that is worth illustrating is the implementation of capacity market (CM), or capacity mechanism. This regulatory tool was initially formulated in the United States during the 1990s, and then was extended around the world, especially in North Europe. CM is based on remuneration to the power plant owners to keep their plants available to increase or decrease their production in a predetermined period of time [
29]. This instrument, introduced in many countries, is linked to the RES boost that occurred over the last decades, as solar and wind power generation is strictly dependent on weather conditions, making RES production unpredictable and intermittent. This means that, because a massive electricity storage capacity is lacking, high flexibility power plants are still necessary for the grid security during load peaks or when RES production is low [
30,
31]. Furthermore, the introduction of this new remuneration mechanism is necessary to keep the traditional power plants in operation, as the merit order effect [
14,
15] and the dispatching priority reserved to RES [
32] made new investments in these technologies less attractive.
Bublitz et al. [
33] carried out an overview of the current CM status in the world. They summarised the reasons behind the introduction of CM within a liberalized electricity supply system, such as to guarantee a reliable service and to avoid shortages of flexible capacity during peak-load hours. Furthermore, they presented critics to the CM idea, stating that it is not the best tool to solve the reliability problems, but solutions such as demand-side management should be promoted [
34]. Moreover, they reviewed many studies based on real-world scenarios analysing the CM and taking into account realistic hypotheses such as duopoly or oligopoly market, strategic investments, and irrational expectations of the players.
Bhagwat et al. [
35] used an agent-based simulation model to compare the impact on the U.K. electricity market of a long-term CM against a yearly contract CM. Their results show that, in both scenarios, this mechanism can compensate the decline in new flexible capacity investments, although it might also generate price volatility. Besides, with long-term contracts, the prices of both capacity and electricity are less volatile than with yearly contracts. Furthermore, it is underlined that, if a demand shock occurs, CM helps to provide security of supply.
Conflicting results are also illustrated by Bajo-Buenestado [
36], who implemented a two-stage simulation model to understand the impact of CM on Texas (USA) electricity prices, distinguishing only between peak load and base load generation units. Simulations provided two main outcomes: CM causes an increase in the wholesale electricity price, but it also increases the reliability of the power grid and avoids price volatility. Another important result is that the welfare benefit of CM is higher under the assumption of a perfectly competitive market.
2.3. The Impact of Coal Phase-Out Policies
Besides the studies broadly analysing the electricity market developments, some recent literature papers directly discuss coal phase-out policies. For instance, the study of Graichen et al. [
37] illustrated an approach to decarbonize the German electricity sector. The proposed approach suggested the entire coal capacity to be phased out at the latest in 2040, suggesting the need for a timing schedule for the final shut-down of the coal-fired power plants that are running, based on their technical lifetimes and operating costs. Reitz et al. [
38] assessed the effect of a phase-out of coal capacities that was only partly implemented. The study highlighted that the decommissioning of three GW coal-fired and six GW lignite-fired power plants would decrease the yearly carbon emissions of about 23 million tonnes in Germany; at the same time, the wholesale electricity prices would increase, increasing the profitability of flexible gas power plants.
Heinrichs et al. [
39,
40] analysed a possible coal phase-out in Germany, investigating three different scenarios. In the business-as-usual scenario, an early phase-out of coal power is not imposed and the power plants are decommissioned according to their technical lifetimes; in the coal phase-out (COUT) scenario, lignite-fuelled coal power plants are decommissioned by 2030 and hard coal-based plants by 2040. In the carbon cap (CAP) scenario, the resulting carbon emission quantities, obtained from the application of the COUT scenario, are used as a cap for carbon emissions of the electricity sector, allowing all technologies to emit within this cap. The analysis illustrated to what extent an early phase-out of coal may reduce CO
2 emissions. In terms of system costs, however, they are remarkably lower in the CAP scenario, allowing exactly the same amount of emissions. These authors also carried out an integrated assessment and a survey to investigate the degree of acceptance of coal power generation. The result of their study was that, on one hand, the acceptance of coal power generation decreased and, on the other, an early phase-out would not be enough to meet the German emission reduction target.
A study carried out at Imperial College London by Gross et al. [
41] evaluated the effects in Great Britain of the continuation of coal power production on carbon emissions reductions; in any of the scenarios, coal capacities were not shut down. A TIMES model of the British electricity sector was adopted for this aim, applying many assumptions, such as no wind feed-in during the hours of peak load, capacity payments, and so on. The results show that the coal intensity exceeds the carbon emission targets both of the Committee on Climate Change’s and of the Department of Energy and Climate Change’s. Another result is that a market-based coal phase-out cannot be implemented by the current rules on carbon prices.
2.4. Discussion and Outcomes
The literature review provided in
Section 2.1,
Section 2.2 and
Section 2.3 highlighted the main policies and trends currently transforming the electricity market. Other mechanisms and trends have also impacted the electrical systems in the last few years, such as demand-side management, the electrification of the heating sector, the electric vehicles diffusion, and the interactions between electricity and heating sectors through power-to-gas technologies. Nevertheless, as these innovations are mainly related to the electricity demand evolution and are driven by technical constraints rather than referring to the market, their description appears out of the scope of this paper.
As this state-of-the-art review shows, the academic discussion concerning the electricity market followed two main roads. On one hand, many papers investigating the transformations in the electricity production system were published. On the other hand, the analysis of new market rules contained in the broader concept of an integrated market, together with an implementation of power transmission grid and capacity market tool, was considered. In order to take into account for both of these philosophies, the methodology described in the present study aims at combining these two approaches, taking into account elements related to the supply side (e.g., production capacity mix, fuels cost) and to the market side (energy flows optimization, market coupling, new interconnections). The methodology was applied to the impact assessment of coal phase-out in Italy as a demonstrative case study.
As a recap of this long literature review, a summary of the analysed studies is provided in
Table 1.
3. Materials and Methods
The aim of this paper is the assessment of the effects of coal power plants phase-out on the wholesale electricity market prices, comparing different scenarios and hypotheses according to the current regulation. To achieve this goal, a wholesale electricity market was simulated through an optimization model, taking into account the energy demand; the production of thermal and renewable power plants, modelled as power nodes; import and export power flows; and the price formation logics. Furthermore, taking as a reference the Italian market, the division of the country in many market zones was also included, with each market zone being made up of power nodes and energy demand, and considering the transport capacity among the zones as an upper bound for the power flows.
The inputs of the system are energy demand, coal-fired and CCGT power plants capacity, other thermal generators with a small impact on the DAM, renewables’ production, water intake for hydropower plants, and fuel and carbon allowances prices. The hourly variables (demand, RES generation, import/export, transmission capacity, commodities price) define the power flows exchanged in the market and thermal generation in each hour of the year (8760 values times N variables). The main output of the simulations is the value of hourly electricity prices. The annual average price is then derived from the time series of hourly prices. The workflow of the model is shown in
Figure 3.
The model described here simulates the DAM. The system performs the market-clearing for every hour of the year, finding the minimum price through the optimal combination of feasible power flows. In detail, the electricity demand was assumed to be independent from the prices, and the market balance was identified as the configuration able to cover the demand at the minimum available price, according to the constraints. This operation is slightly different from the true DAM, which is based on the merit order cost criterion [
42], where the market balance originates from the equilibrium between demand and offer curves, although both criteria aim at reaching the lower price.
Moreover, it was assumed that all the energy exchange takes place only on the DAM, without taking into account subsequent market sessions such as intra-day market and ancillary services [
43]. This approximation is considered to be acceptable for the aim of the present research, which aims to derive indications about the response of the system, in terms of price variations, resulting from structural changes due to a coal phase-out policy.
The simulations were carried out using PLEXOS
® [
44], a commercial simulation software for the utility markets (power, water, gas) commonly employed by market analysts, traders, and planners. The model processes the input data of the electrical system and minimizes the objective function in each time interval.
The objective function to be minimized is the system’s yearly cost for electricity generation, whose formulation is shown in Equation (1):
In Equation (1), the first summation indicates the generation cost of the electricity produced inside the market zones, while the second one indicates the cost of energy imported from the neighbouring market zones. The model performs the optimization taking into account the relation linking generation cost to the generated power, which is commonly considered to be a quadratic law in the literature [
43,
45,
46]. In this way, no linear approximations were introduced in the model, as was sometimes done in other models.
The optimization was performed subject to the equality constraint of the hourly balance between demanded and offered capacity for all the zones, as in Equation (2):
The power flows between the market zones were also constrained according to the real transmission capacity between the macro-zones, setting a further constraint for the problem, shown in Equation (3):
The symbols in the previous equations have the following meaning: n and m are the indices indicating the market zones (both national and foreign areas); i is the index indicating the power plant; t is the index indicating the time interval (hour); ci,n is the generation cost for the i-th power plant located in the n-th market-zone; Xi,n,t is the installed capacity for i-th power plant located in the n-th market-zone, depending on the available operating plants; cm is the marginal cost of the m-th market-zone; impn,m is the maximum allowed flow between the zones m and n; and Dn,t is the load in the n-th zone at time t. The term si,n,t indicates the load factor for the i-th power plant located in the n-th market-zone at time t and has a value within the range 0 ≤ si,n,t ≤ 1 [kWh/kW]. Its value is “0” when a power plant is off, it is “1” when it is at its maximum load, and it has a value between “0” and “1” when an intermediate condition occurs. The term sn,m,t indicates the load factor for the interconnection capacity between the market zones n and m at time t and it has a value in the range −1 ≤ sn,m,t ≤ 1 [kWh/kW]. It is “0” when there is no power flow through the correspondent interconnection, it is “−1” or “1” when the connection line is used at its maximum capacity (in export or in import, respectively), and finally it assumes an in-between value when the interconnection capacity is only partially employed. Values of si,n,t and sn,m,t are among the outputs of the optimization. The term En,m,t indicates the global actual power exchange between zones n and m during the hour t [MW]. The term impn,m,t is the maximum allowed flow between zones m and n during the hour t [MW].
4. Case Study: The Italian Power System
4.1. Italian Context
In 2019, Italy covered 57% of its electricity demand exploiting thermoelectric power plants, mainly CCGT plants [
47]. Although the latter is the thermoelectric technology with the largest generation share in Italy, the production share of coal plants is still significant. In detail, there are eight coal-fired power plants still operating in Italy, with a cumulated rated capacity of nearly 8 GW (7886 MW). On average, their annual production is higher than 40 TWh, equal to 13% of the whole domestic production [
48,
49], with a resulting number of equivalent hours that is larger than CCGT power plants. In
Figure 4, the location and the cumulated rated power of the coal power plants operating in Italy are provided.
The operation of coal plants is exclusively led by economic issues, as most of the electrical energy is traded on the DAM. During the day ahead market session, power plants dispatch is defined following economic merit order criteria, implying that power plants offering energy at a lower marginal cost are most likely to be chosen. Owing to the drop in the CO
2 emission allowances price that occurred in the last years (5.5 €/ton in 2017), together with a lower unit cost of coal, coal power plants were able to outplay competitors on the DAM. They were thus able to offer their energy at a lower price than CCGT, although the latter are more efficient and have less impact on the environment. At the same time, electricity generated by renewables attained a share of 32% of domestic demand in Italy in 2019 [
47], mostly owing to the spread of PV and wind generation in the last years. The combined effect of diminishing operating costs for coal-fired plants and increased renewables feed-in contributed to a decrease in CCGT production.
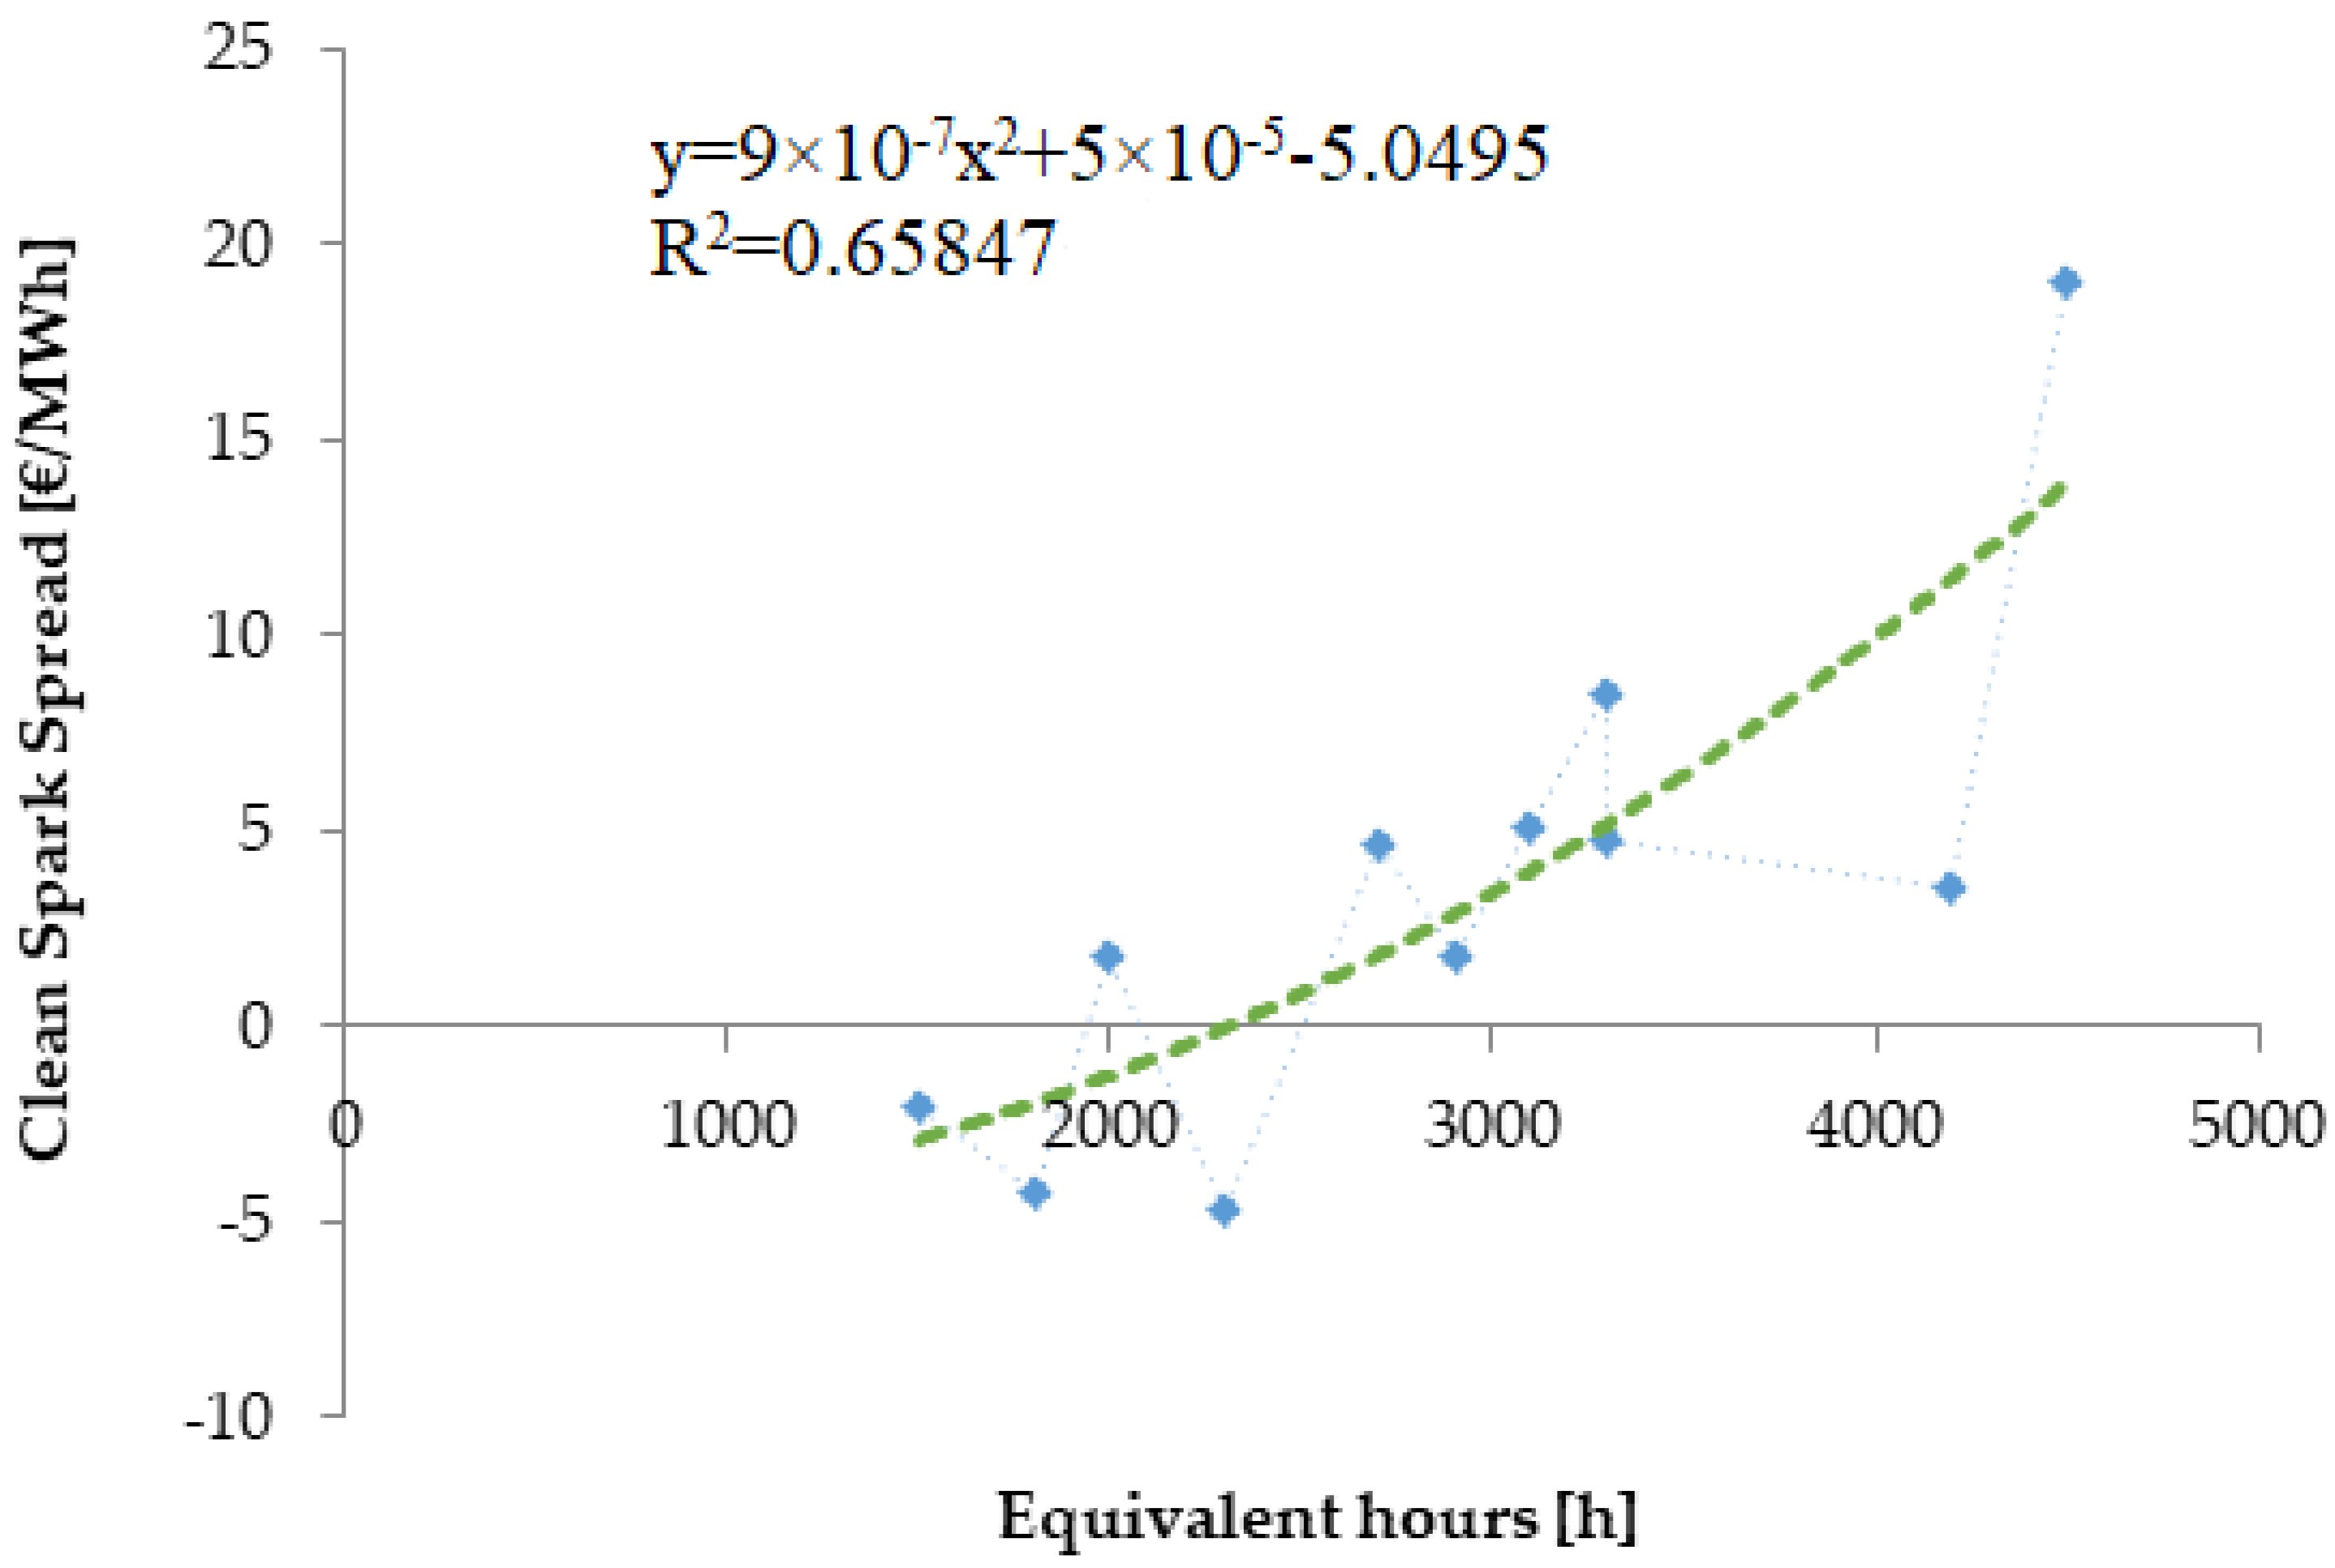
CCGT power plants are designed to work a good number of hours throughout the year. However, owing to the low generation cost of coal-fired power plants and the simultaneous growth of RES production share, CCGT plants were forced to reschedule their activities plan and to change their market strategy. In the last years, a trend for CCGT power plants usage has become evident. It denotes that, the higher the CCGT equivalent operating hours, the greater the marginal gains. The data reported in
Figure 5 illustrate this trend; it was obtained using values of clean spark spread (CSS) and those of annual equivalent working hours for Italian CCGT plants. CSS is defined as the difference between PUN (Italian national unique wholesale price) and electricity generation cost (€/MWh), with the latter being strongly related to fuel consumption and price, as well as emission allowances price. CSS for CCGT and coal-fired plants was calculated according to the following:
where
Pfuel denotes the fuel price expressed in €/MWh
th,
PCO2 is the price of CO
2 emission allowances in €/ton,
f is a factor indicating the emission rate of the power plant expressed in ton/MWh
th (equal to 0.21 ton/MWh
th for gas and 0.33 ton/MWh
th for coal), and
η is the average plant efficiency set equal to 0.55.
An explanation for the data illustrated in
Figure 5, as well as the related extrapolation trend, can be provided according to the classic economic demand/supply law. In detail, when operators struggle to be accepted on the market, they usually offer their energy supply at a lower price, in order to cover the fixed costs of production at least, even at the risk of reducing incomes. On the other hand, when marginal demand is large and the energy offered by operators is required, they try to maximize their gains, thus generating their bid-up.
The bid-up determination process was performed according to the equation extrapolated in
Figure 5, obtained using the values of the years from 2007 to 2017. This equation is the average trend between the overall yearly average values of CSS and the CCGT plant load factor, obtained through the least square method using a quadratic polynomial extrapolation. Although the coefficient of determination of this extrapolation is quite low, the present approach was widely used in similar studies in the past, and it was adopted in this study as well in order to obtain a generic trend for the CSS.
On the basis of the variable cost simulation, a forecast of CCGT load factor was obtained. With this, using Equation (2), the forecast of the CSS yearly average was obtained. Finally, to get the hourly bid-up, the obtained yearly average CSS was distributed according to an hourly coefficient that depends on the ratio between produced energy and available CCGT capacity for each market zone. This coefficient allows higher bid-up values in times of supply shortness and lower bid-up values when demand for CCGT plants is low.
The expected effect on the market and prices also depends on the geographic location of the power plants. The main problems of fitness are expected to occur in Sardinia island, which is electrically connected to the Italian peninsula by two undersea interconnections, with a cumulated capacity higher than 1 GW [
52]. The shutdown of the two existing coal power plants in Sardinia could affect the reliability of the grid in the case of islanded operation, as the island would be supplied only by RES plants that would not guarantee the stability of the grid.
4.2. Simulation Scenarios
The main target of this study is to evaluate the effect of the early phase-out of coal production units on the electricity price, in accordance with the provisions of the current Italian energy policy. Secondly, this study aims at highlighting the extent to which the Italian supply system has a global overcapacity, particularly regarding the thermoelectric power plants such as CCGT. For this sake, two scenarios with two different hypotheses were analysed and compared in this study: in Scenario 1, the coal-fired plants’ decommissioning is based on the life span and without considering new measures to prolong it; in Scenario 2, the coal plants are assumed to be shut down all by 2025 owing to administrative regulations. Furthermore, in order to further investigate the price variations resulting from these two scenarios, two hypotheses regarding the criterion of bid formulation by the operators for each scenario were adopted. In Hypothesis 1, the offers are formulated taking into account only the variable production cost, known as short run marginal cost (SRMC), being mainly dependent on the fuel consumption and on the CO
2 allowances prices. In Hypothesis 2, the operator’s “bid-up” on SRMC was also considered for each power plant. Although the bid-up is the result of each operators’ strategy and does not follow exact rules, it was assumed that bid-up is not different between the operators, but just between the market areas, as the aim of this research is not to highlight the impact on individual operators, but on the overall price change.
Figure 6 illustrates the residual technical life of each plant adopted for the base scenario.
The simulations were carried out for each of the years between 2019 and 2030; hence, the time horizon of this study is a mid-term and long-term period.
Table 2 summarises the examined hypotheses on the simulated scenarios. The abbreviation HYP.1 refers to the hypothesis of no performed bid-up, meaning that only SRMC is taken into account. Secondly, HYP.2 refers to the hypothesis of adding the bid-up to the SRMC.
4.3. Simulation Scenarios
The Italian power system was schematized with six nodes representing the six macro-zones of the market on DAM, divided as in
Figure 7.
Table 3 recaps the total interconnection capacity, known as net transfer capacity (NTC) between Italy and neighbouring countries, both existing and scheduled. Although an increment of gas pipelines transport capacity is expected in the near future, Italy has historically been a net electricity importer, thus we only relied on this aspect in our study, neglecting variations on the availability of natural gas.
The hourly load was fixed, assuming the demand to be independent from the energy price, and it fully represents the demand in the market segment, on which the production must be optimised. Each node is characterised by thermoelectric and hydroelectric generating units whose attributes are the technical characteristics as follows: heat rate, ramp up and ramp down, technical minimum, max capacity, and fuel and CO2 certificates costs. They represent the generation units that actually operate on the Italian DAM. For each node, there are also virtual generators representing the non-programmable renewables production and the generation units that do not go on the market. The production of these plants was assumed upstream of the simulations and is seen by the system as a fixed production that is offered at no cost. The effect of this additional production capacity is a reduction of the contestable market space for flexible production units. A similar approach was employed for the import quotas. In detail, the model is confined to the Italian national territory and does not take into account the market of neighbouring countries, which influences the behaviour of the Italian market. Therefore, to approximate these dynamics, the neighbouring countries have been schematized as generators or virtual loads located in the node in which they are physically connected. Their production or load profile was imposed upstream of the simulation and takes into account the developments of the interconnection network and the development plans on the evolution of the production mix of the countries interconnected with Italy.
4.4. Simplifying and Critical Issues
In order to clearly explain all the hypotheses lying at the base of the present work, the major assumptions made for setting up the model are summarised in this section. Furthermore, the critical issues, which stem from some of the adopted simplifications, are recapped.
The first question concerns power exchanges between Italy and neighbouring countries. The power flows between foreign countries are considered as input data for the simulation, thus the model analyses only the power flows within the Italian market with no regard for behaviour of foreign markets. This hypothesis is considered suitable because Italy has historically been a net importer of electricity exclusively owing to economic reasons, in terms of a lower price of the energy imported from abroad. In detail, Italy mainly buys energy from France and Germany (through Swiss and Austria); within the simulated time horizon, it was assumed that there are no relevant variations in the supply side of these neighbouring countries so that the electricity cost has no important fluctuations. Hence, in our simulations, Italy always has an economic benefit from import, owing to its higher average domestic price.
Regarding the interconnections between the zones of the country, the model takes into account the development of the domestic power network, thus the market simulations also include the improvements of the power grid. All the input data for the domestic grid and for the international connections were drawn from [
55,
56].
A further issue concerns the creation of a bid-up price, as explained in
Section 4.1. The bid-up value for each scenario was obtained performing an upstream variable cost simulation, which gives the load factor for each CCGT plant; then, the bid-up values were calculated through the equation shown in
Figure 5. It is important to underline here that this process should be done in subsequent iterations because the upstream variable cost optimization does not take into account the bid-up itself. Hence, once the first value of bid-up is found, the model iterates the simulation adding the established bid-up. Nevertheless, the results shown in this paper regard only the first iteration, as the successive iterations do not provide any change in the final price. This is owing to the fact that CCGT power plants already have a production cost higher than the other thermal plants, so the dispatching of CCGTs, as well as their load factors, depends only on the composition and variation of the supply mix, for example, coal-fired power plant phase-out.
Another aspect deserving to be clarified is that the model performs the optimization, taking into account the non-linear curves linking the cost of generation to the generated power; in this way, there are no linear approximations, as the employed software allows for the inclusion of the real curves.
As a final remark, it was assumed that all the operators behave according to the same strategy for the determination of the bid-up. In detail, they follow the basic demand/supply rule to drive their activities on the market. This is a critical assumption to be overcome in future works, although it might be considered as the equivalent cumulated result of the strategies of the operators. In reality, market operators act according to different strategies and are influenced by many and complex factors going beyond the demand/supply law. In order to highlight the weight on the final price of different strategies of each operator, a model able to reproduce the behaviour of the operators more accurately should be implemented.
4.5. Parameters Estimation and Collection
In order to gather reliable results from the simulations, different kinds of data were collected. The hourly load, representing the demand for each market zone, is fixed and was derived from historical data and forecasts [
47,
48,
56]; assuming a fixed demand means to model this value as independent from the energy price.
Each node of the model is characterized by thermoelectric and hydroelectric generation units, characterized by technical parameters such as heat rate, ramp up and ramp down, technical minimum, max capacity, type of fuel, and cost and CO
2 emission limits. Forecasts on fuel and CO
2 allowance price data were drawn from [
57], while specific emissions for each technology were gathered from [
58].
In order to also take into account for the development of the power system in the close future, available data regarding both the demand and the interconnection limits between the market zones were employed [
55,
56].
The capacity in each node represents the generation units that actually operate on the DAM. Furthermore, for each node, there are also virtual generators representing the non-programmable renewables production and the generation units that do not sell on the market, such as cogeneration power plants [
59]. Non-programmable renewable generation is assumed upstream of simulations on the basis of historical production data, and it is seen by the system as a pre-determined supply that is offered on the market at zero price. Supply of other production units that do not participate to the market was defined following the same approach, thus they were assumed to be offered at a fixed predefined cost based on historical data. The evolution trend of RES capacity included in the model is shown in
Figure 8.
Regarding the supply system, it does not evolve according to an economic optimization, but assuming administrative directives or considering the useful lifetime of power plants, depending on the scenarios described in
Section 4.2.
The import and export power flows were determined through a procedure similar to the one shown for non-programmable RES production, with data being available in [
60].
5. Results
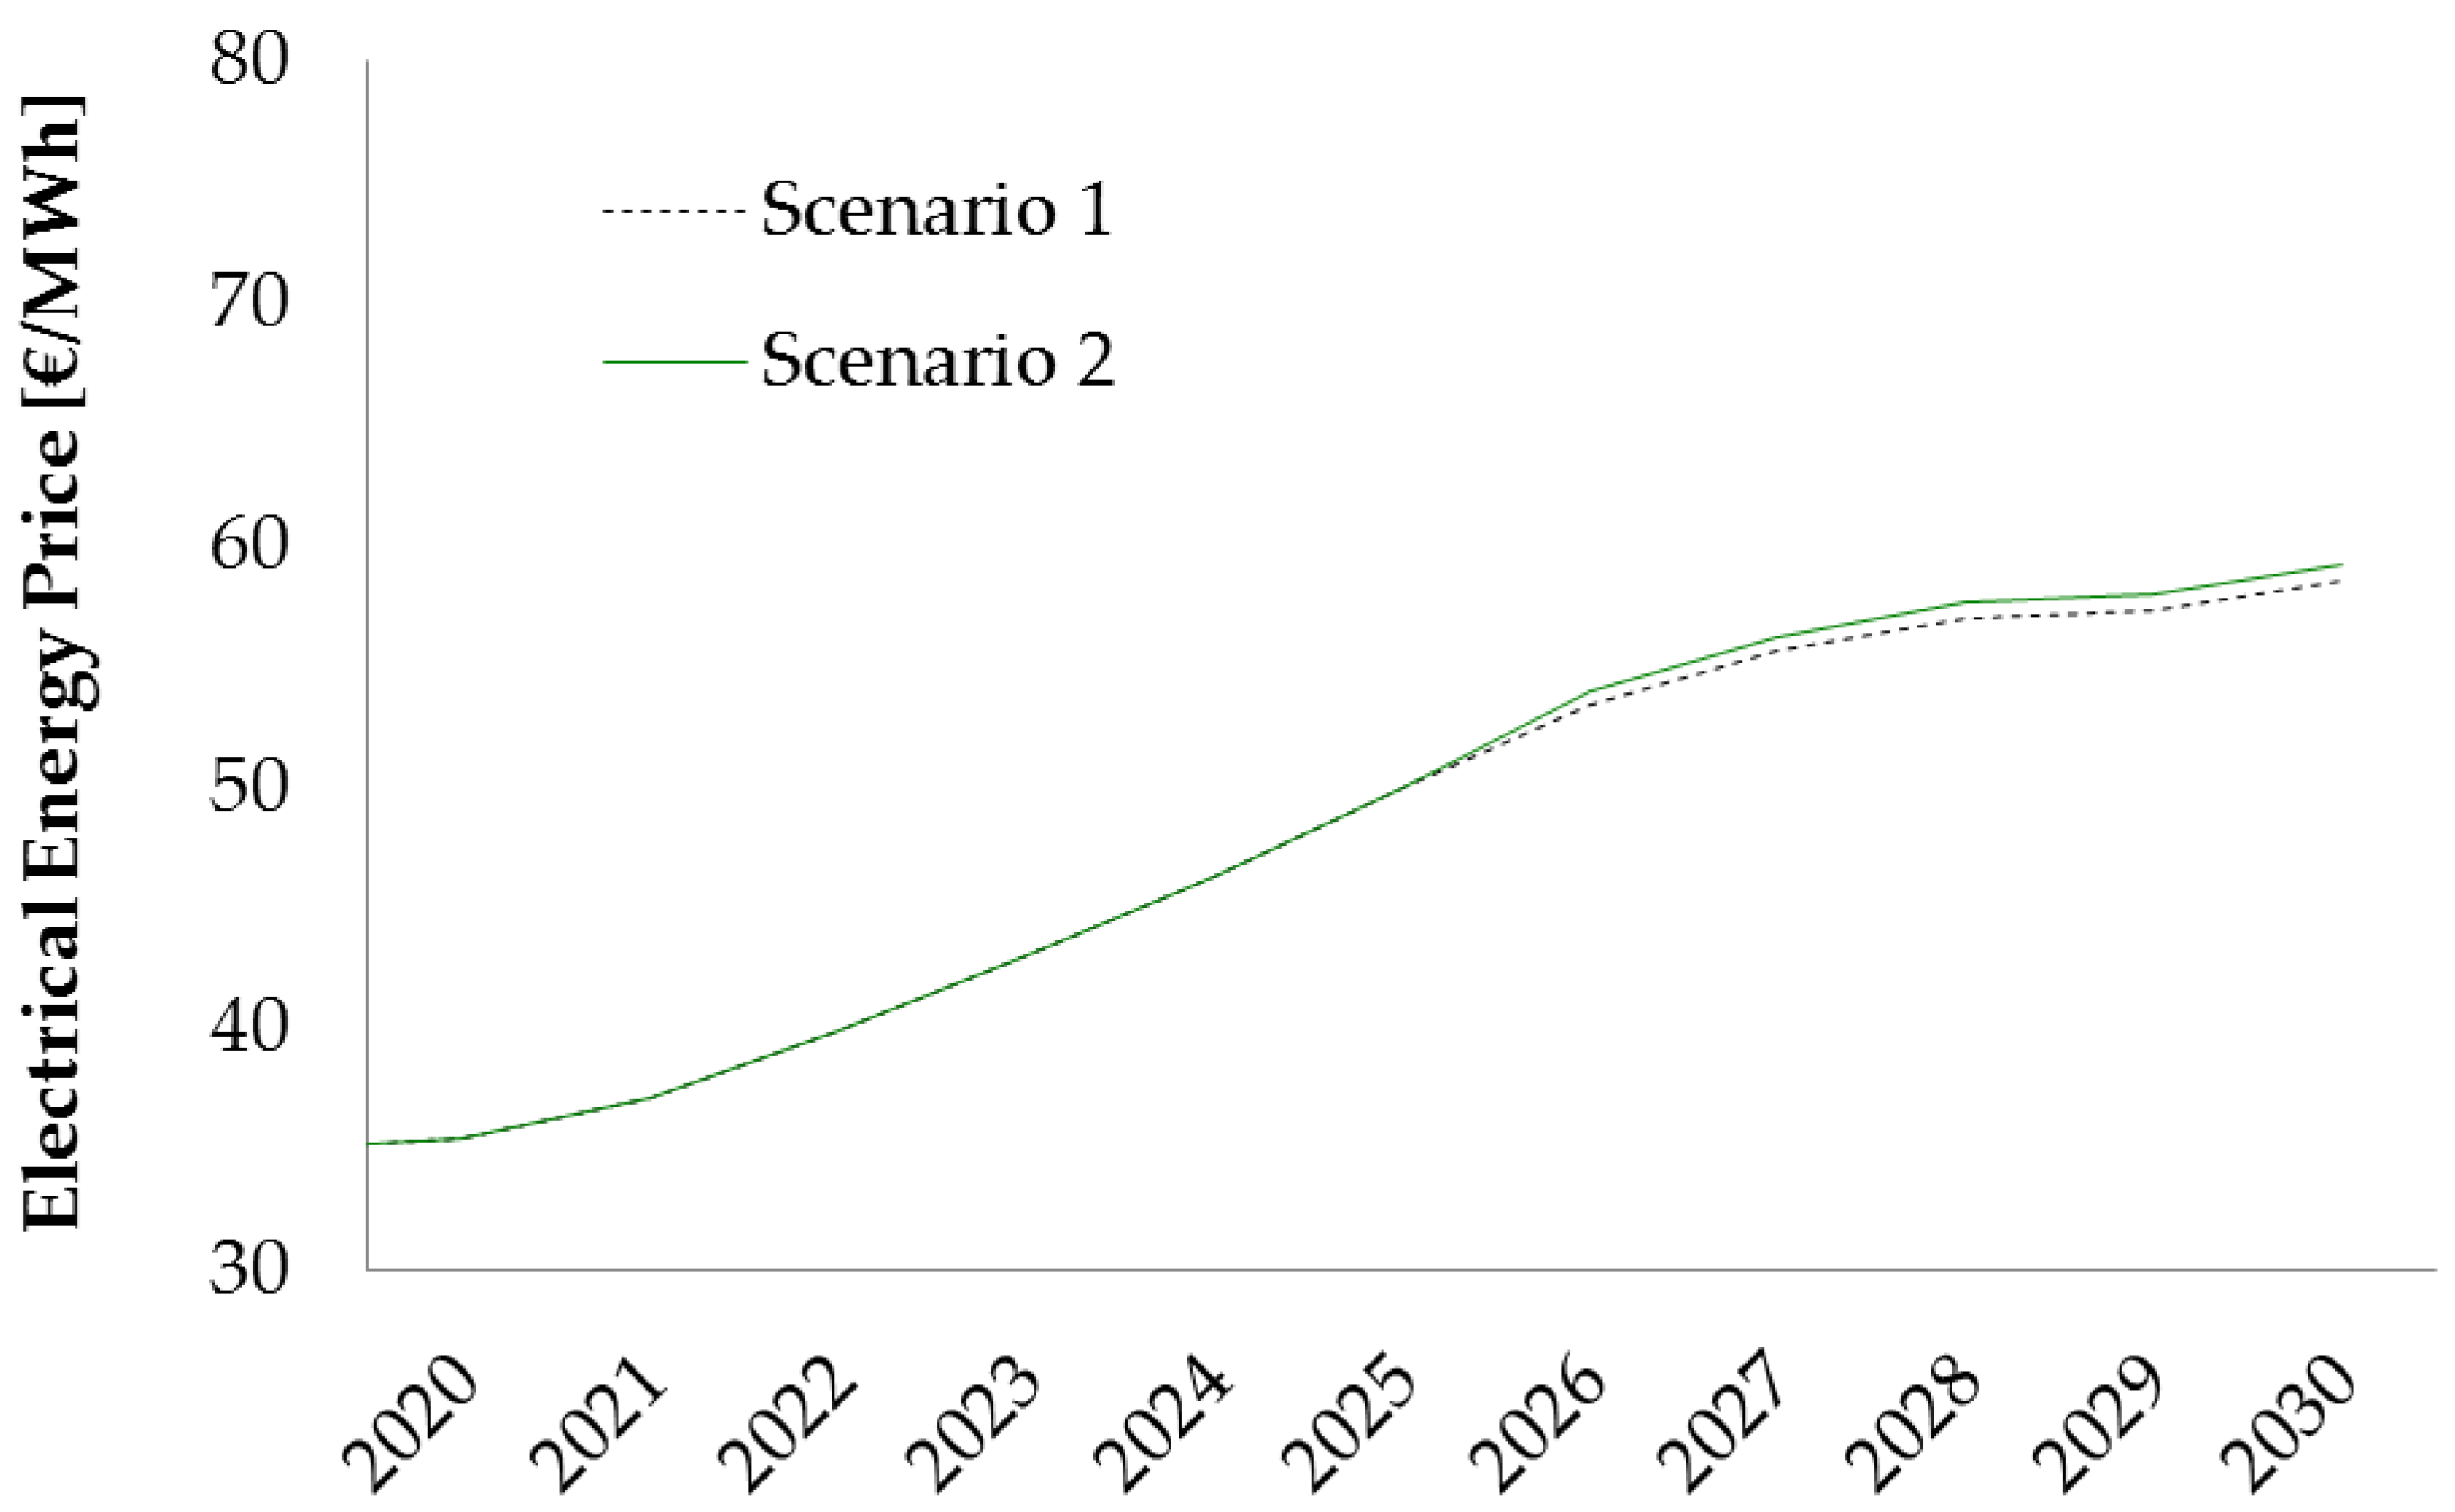
To measure the differences between the two scenarios, the yearly average PUN and the annual equivalent hours of the CCGT plants were taken into account as key performance indicators. In HYP.1, the difference between the results of the two scenarios does not change until 2025, while the variations in the following years keep increasing slowly until 2030. These two trends are shown in
Figure 9. It is evident that the deviation between the two scenarios is limited, indicating that the early decommissioning of the coal plants would have a slight impact on the marginal price of the system and would cause an increase in the PUN of 0.70 €/MWh in 2030. Simultaneously, the equivalent hours of CCGT plants, shown in
Table 4, would increase up to around 820 h in 2030.
The limited difference in the variable price can be related to the current overcapacity of the generation system. Thus, the reduced capacity owing to the early coal-fired plants phase-out in the second scenario is replaced, increasing the production of the existing CCGT plants. This is owing to the current status of the Italian supply system, which is characterized by an overall overcapacity caused by CCGT power plants. This situation allows CCGT plants to replace the dismissed coal plants so that the adequacy and reliability of the Italian grid would be granted without any further investment on the supply side. The limited variation in the marginal system cost highlights the fact that CCGT plants remain the marginal technology for most of the hours. The slight increase in price is given by the increase in production of the less competitive CCGTs that are produced in a greater number of hours owing to the absence of coal production.
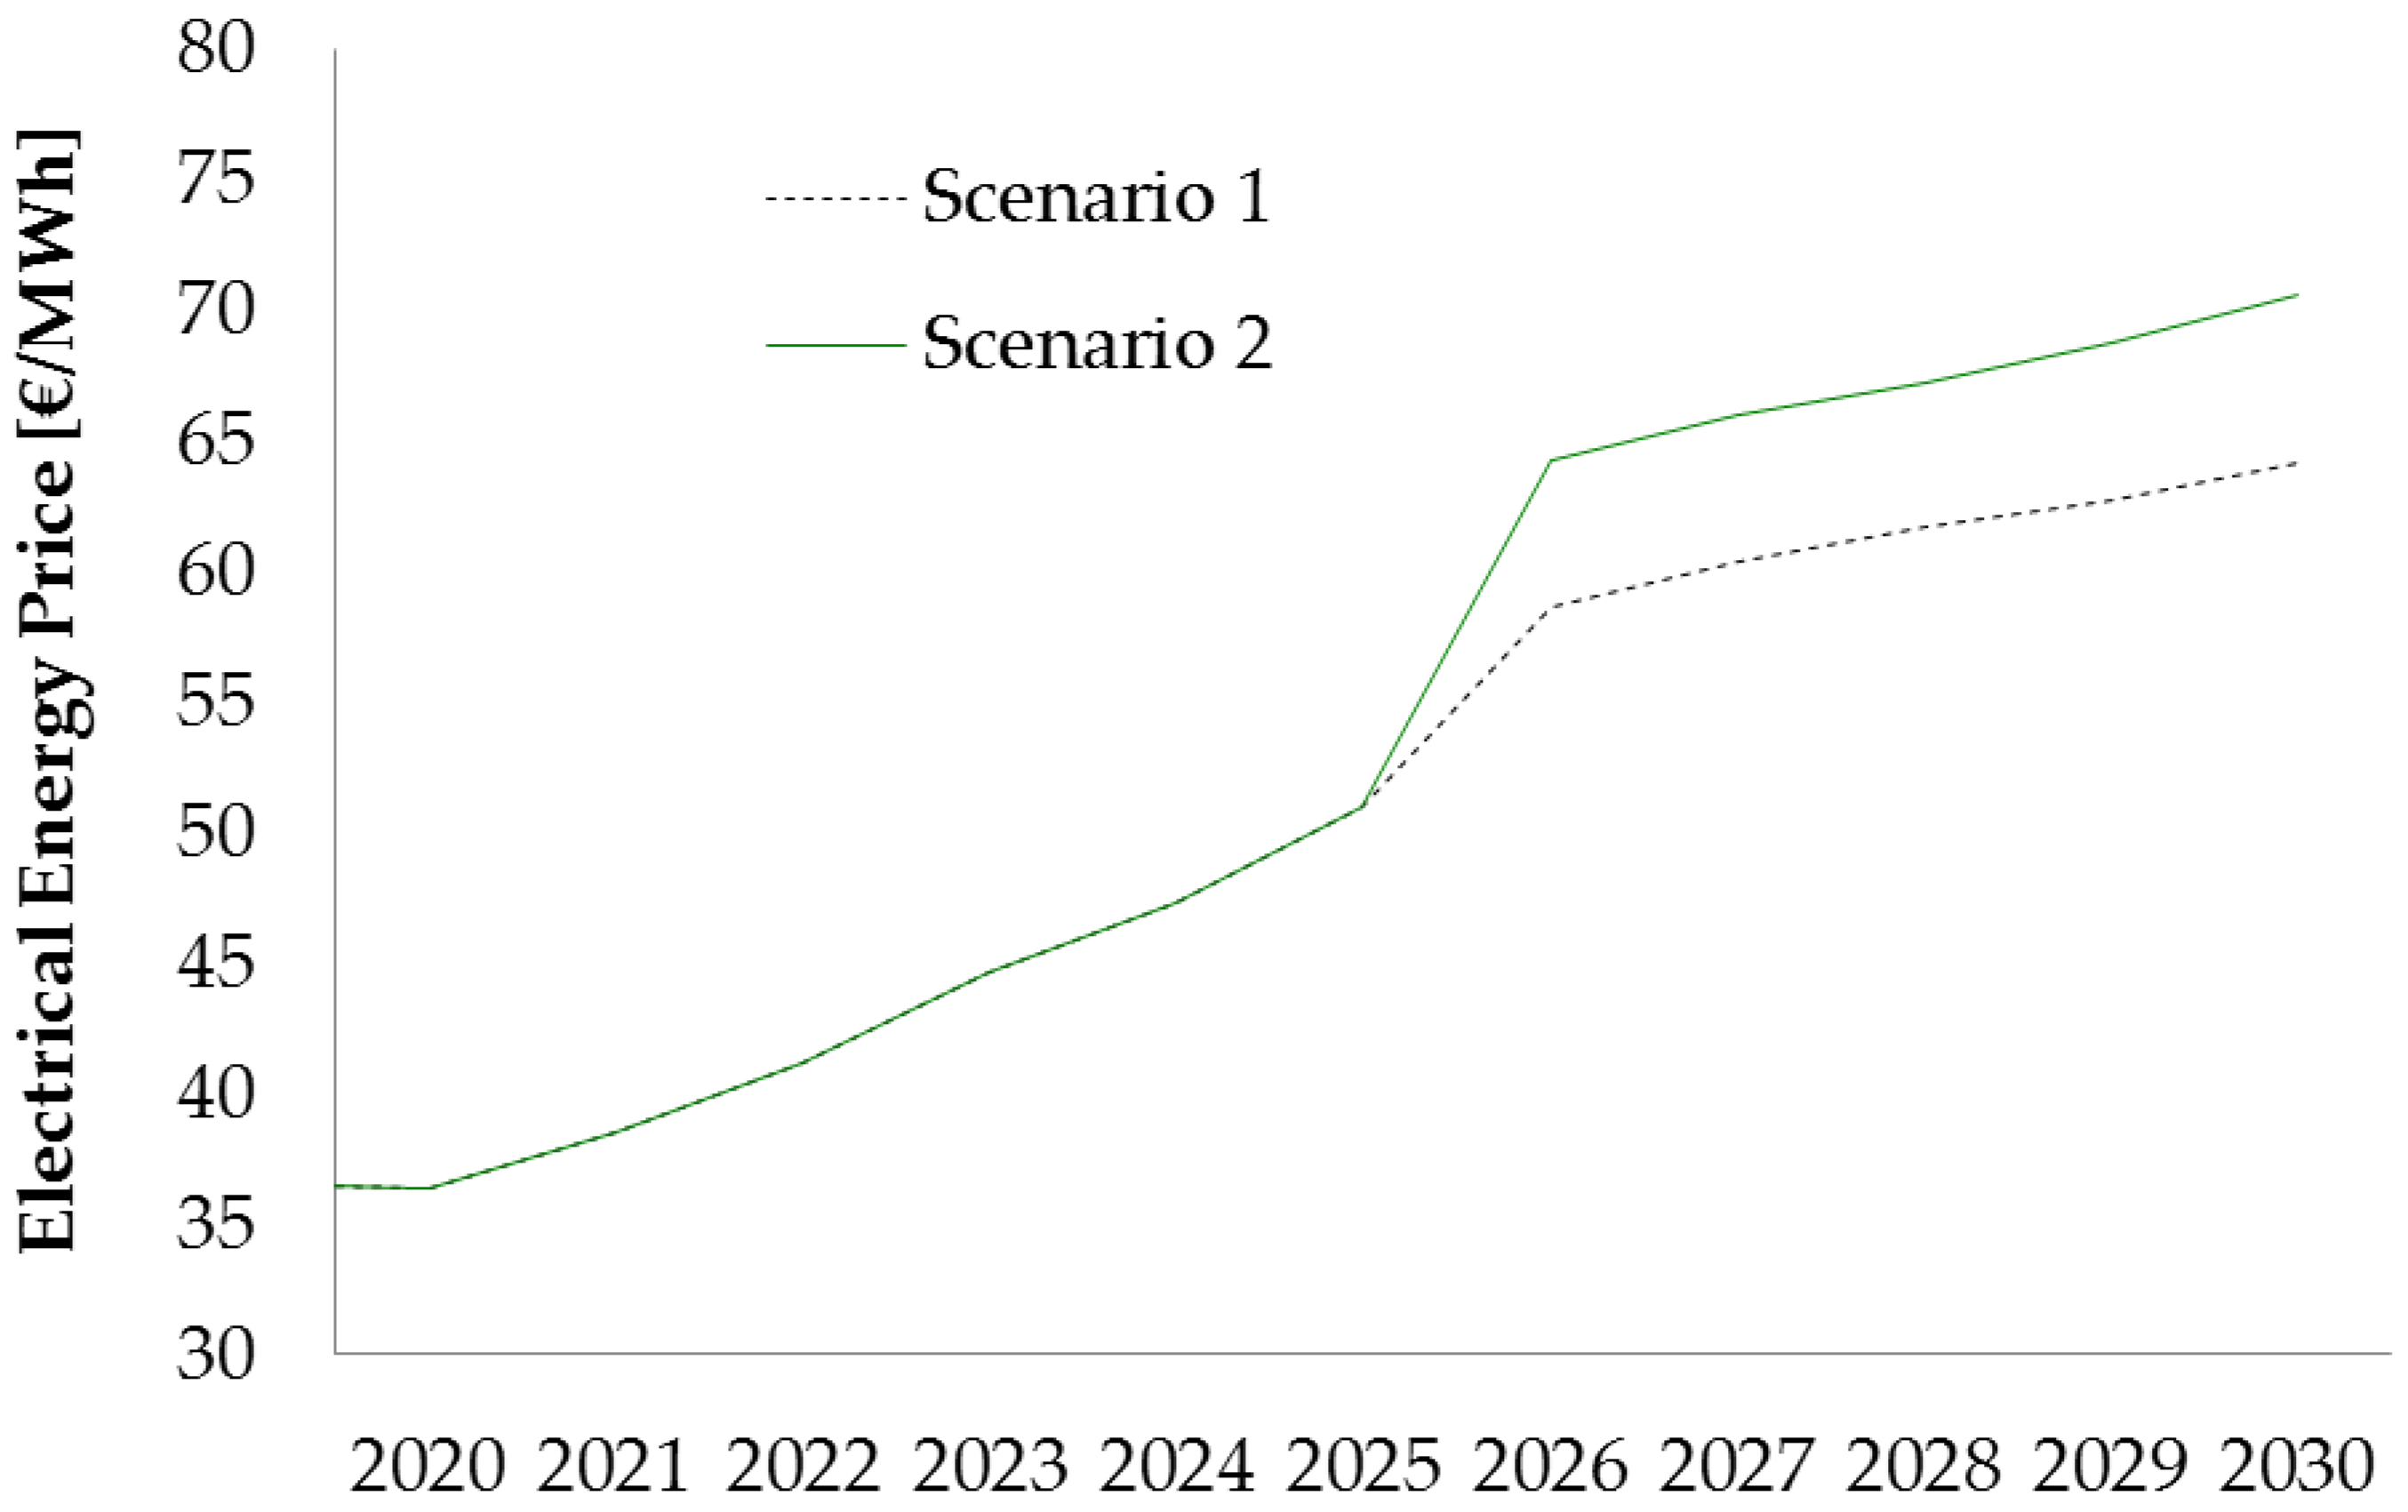
The difference becomes more relevant in the second hypothesis, where the bid-up is considered (
Figure 10), the difference of the average annual PUN between the two scenarios to 2030 rises from 0.70 €/MWh to 6.41 €/MWh. The increase in the PUN difference between the two scenarios is owing to the impact that the equivalent operating hours have on the bid-up; that is, the market space left by coal-fired plants increases the likelihood of being in the market for combined-cycle plants, thus allowing operators to offer a higher price.
The following charts are presented in order to show more accurately the current condition of overcapacity shortly illustrated above, which characterizes the Italian supply system.
Figure 11 shows the maximum annual peak load and the total production capacity in Scenario 2, which refers to the administrative complete coal phase-out by 2025. In 2020, with a consistent part of coal power still available, the overall capacity exceeds the annual maximum peak load. More interesting is the fact that, in 2030, after the shutdown of all coal plants, the total capacity still clearly overcomes the annual max peak load and the dispatchable capacities (thermal and hydro) are close to the peak demand as well. The missing dispatchable capacity can be covered via imports when the RES capacity does not deliver owing to weather conditions. The same conditions can be found in Scenario 1 as well, as no administrative coal phase-out is considered in Scenario 1, hence it also shows an overall overcapacity status.
Furthermore, another interesting result concerns the generation mix in 2030 in both scenarios, on the base of which it is possible to calculate the total carbon emission.
Figure 12 describes how the generation mix is subdivided in 2030. In Scenario 1, the phase-out based on the useful life of power plants leads to a small, but quite relevant share of coal generation, equal to about 7%. Although the overall thermoelectric generation is the same in the two analysed scenarios, in Scenario 2, the gap of coal plants is filled by gas-powered plants, which produce less carbon emission. As a consequence,
Figure 13 shows that the difference between the two scenarios, in terms of carbon emission, is really important, although both coal and natural gas are fossil fuels. Owing to coal phase-out, for the year 2030, the overall annual carbon emission could be cut by 10 million tons in Scenario 2 as compared with Scenario 1.
6. Conclusions
In this paper, the impact on the energy price caused by the early disposal of coal-fired power plants has been analysed. In Italy, the electricity generation by coal is still today one of the main sources, accounting for about 15% of domestic power production. The renunciation of coal use is included among the measures of the decarbonisation strategy of the Italian government.
In order to evaluate the price variation, a simulation model of the Italian market based on linear programming was realized considering two coal phase-out scenarios. Moreover, the results were evaluated considering two bidding strategies of CCGT operators, the first based on variable production costs and the second based on the operators’ bid-up, estimated based on the market results of the past years.
The simulation results show that the impact of the decommissioning of coal power plants is limited with regard to the average variable cost and prices for the country (PUN), owing to the current overcapacity of the generation fleet. The difference becomes considerable if the operators’ bid-ups is accounted for, as the scarcity of supply allows operators to offer at higher prices. The price impact may be moderate, however, there is a risk of having excessive volatility on prices in an energy-only market environment, which is almost independent from the coal policy. That means that a coal phase-out in Italy can be designed without fearing a huge impact on prices. The impact on prices can be further limited if the authority could set a cap on annual revenues or on scarcity rents, so that plant operators that increase bid-ups are constrained to offer near their actual short-run marginal cost [
33]. This could remove investment incentives for new capacities in energy-only market design and can put generation adequacy in danger. However, the imminent launch of the capacity market will allow operators to reduce risk factors by making energy market prices more predictable, making any investments in new thermoelectric capacity simpler, and thus avoiding problems with the adequacy of the generation system.
In terms of the development of capacity mix, it is possible to state that, according to the considered scenarios, the Italian electrical system is able to replace the production from coal plants without the need for further thermoelectric capacity, because the CCGT and RES plants can step-in for the diminishing coal capacity and can cover the peak demand as well, also including the import. As a limitation, this study does not address the inner-zone network capacity, which is another important point to address in future research. Another limitation of the present study is that the coal-fired power plants can only be replaced by other fossil fuel-based plants. This is owing to the limited attractiveness of storage system, whose massive installation may push a further installation of non-predictable RES systems, further helping the decarbonisation process.
As shown by the results, coal production would be replaced by existing gas power plants, which would, therefore, have greater revenues from the sale of energy owing to the increase in sold volumes; as a result, operators could “settle” for lower remuneration of capacity by offering lower prices in the newly introduced Italian capacity market. Besides, the expansion of gas power production replacing coal power significantly reduces electricity-related carbon emissions (about 10 million tons in 2030), allowing Italy to approach its greenhouse gas reduction targets.
Although natural gas is a fossil fuel, thus emitting greenhouse gases during its combustion, the progressive rise in its employment for electricity production provided a significant annual reduction in carbon dioxide emissions, equal to about 10 million tons.
Finally, it is worth mentioning that the method used in this article is the basis for subsequent energy planning studies, in which, for instance, the effects of a capacity market can be analysed considering possible optimal bidding strategies in the presence of various capacity remuneration schemes [
61] and changes as well as constraints that would occur in the energy market. Further studies will also consider the location of CCGT plants and the impact of their operation in congestions and balancing problems.
Author Contributions
Conceptualization, M.F. and E.R.S.; methodology, M.F., D.K., F.M., and E.R.S.; software, M.F.; validation, M.F., F.M., and G.L.R.; formal analysis, M.F. and F.M.; investigation, M.F., F.M., and G.L.R.; resources, M.F., F.M., and G.L.R.; data curation, M.F., F.M., and G.L.R.; writing—original draft preparation, M.F., D.K., G.L.R., and E.R.S.; writing—review and editing, F.M., G.L.R., D.K., and G.Z.; visualization, F.M. and G.L.R.; supervision, D.K., E.R.S., and G.Z.; project administration, D.K., E.R.S., and G.Z.; funding acquisition, E.R.S. All authors have read and agreed to the published version of the manuscript.
Funding
This research received no external funding.
Conflicts of Interest
The authors declare no conflict of interest.
Abbreviations
| Abbreviation | Meaning |
| CCGT | Combined Cycle Gas Turbine |
| CM | Capacity Market |
| CSS | Clean Spark Spread |
| CWE | Central Western Europe |
| DAM | Day-Ahead Market |
| NECP | National Energy and Climate Plan |
| NTC | Net Transfer Capacity |
| PUN | Prezzo Unico Nazionale (National Unique Wholesale Price, in Italian) |
| PV | Photovoltaic |
| RES | Renewable Energy Sources |
| SRMC | Short Run Marginal Cost |
| SYMBOLS |
| Subscripts | Meaning | Unit |
| i | Index indicating the power plant | - |
| n, m | Indices indicating the market zones | - |
| t | Index indicating the time interval (h) | - |
| Parameters | Meaning | Unit |
| Cm | Marginal cost of the market-zone m | €/MWh |
| ci,n | Generation cost for the power plant i located in the market-zone n | €/MWh |
| Dm,t | Load in the zone m at time t | MWh |
| f | Emission rate of the CCGT power plant | ton/MWh |
| impn,m | Maximum allowed flow between the zones m and n | MW |
| PCO2 | CO2 emission allowances price | €/ton |
| Pfuel | Fuel price for CCGT plants | €/MWh |
| Xi,n | Installed capacity for power plant i located in the market-zone n | MW |
| η | Average CCGT power plant efficiency | - |
| Decision variables | Meaning | Unit |
| si,n,t | Load factor for power plant i located in the market zone n at time t | h |
| sn,m,t | Load factor for the interconnection capacity between the market zones n and m at time t | h |
References
- Italian Government. Legge 9 Aprile 2002, n. 55 Recante Misure Urgenti Per Garantire la Sicurezza del Sistema Elettrico Nazionale, 9 April 2002. Available online: https://www.camera.it/parlam/leggi/02055l.htm (accessed on 23 April 2020). (In Italian)
- Terna. Transparency Report Platform. Available online: https://www.terna.it/it/sistema-elettrico/transparency-report (accessed on 23 April 2020).
- European Parliament and Council. Directive 2001/77/EC of 27 September 2001 on the promotion of electricity produced from renewable energy sources in the internal electricity market. 2001. Available online: https://eur-lex.europa.eu/legal-content/EN/TXT/?uri=CELEX:32001L0077 (accessed on 23 April 2020).
- Italian Ministry of Economic Development. Decreto Ministeriale 28 luglio 2005. Criteri per l’incentivazione della produzione di energia elettrica mediante conversione fotovoltaica della fonte solare. Available online: https://www.ambientediritto.it/Legislazione/Energia/2005/dm%2028lug2005.htm (accessed on 23 April 2020). (In Italian).
- Italian Ministry of Economic Development. Decreto Ministeriale 18 dicembre 2008, Incentivazione della produzione di energia elettrica da fonti rinnovabili, ai sensi dell’articolo 2, comma 150, della legge 24 dicembre 2007. n. 244, 2008. (In Italian). Available online: https://www.mise.gov.it/index.php/it/90-normativa/decreti-interministeriali/69771-69771 (accessed on 23 April 2020).
- Italian Regulatory Authority for Energy, Networks and Environment (ARERA). Delibera 3 giugno 2008—ARG/elt 74/08, Testo integrato delle modalità e delle condizioni tecnico-economiche per lo scambio sul posto (TISP), 2008. (In Italian). Available online: https://www.arera.it/it/docs/08/074-08arg.htm (accessed on 23 April 2020).
- Italian Ministry of Economic Development. Decreto Ministeriale 24 ottobre 2005, Direttive per la regolamentazione dell’emissione dei certificati verdi alle produzioni di energia di cui all’articolo 1, comma 71, della legge 23 agosto 2004. n. 239, 2005. (In Italian). Available online: https://www.gazzettaufficiale.it/eli/id/2005/11/14/05A10401/sg (accessed on 23 April 2020).
- Italian Government. Decreto Legislativo 16 Marzo 1999, n. 79. Attuazione della direttiva 96/92/CE recante norme comuni per il mercato interno dell’energia elettrica, 16 March 1999. (In Italian). Available online: https://www.gazzettaufficiale.it/eli/id/1999/03/31/099G0136/sg (accessed on 23 April 2020).
- Italian Ministry of Economic Development. Integrated National Energy and Climate Plan. Available online: https://www.mise.gov.it/images/stories/documenti/it_final_necp_main_en.pdf (accessed on 5 July 2020).
- European Commission. COM(2019) 285 final. United in delivering the Energy Union and Climate Action—Setting the foundations for a successful clean energy transition. 2019. Available online: https://eur-lex.europa.eu/legal-content/EN/TXT/?uri=CELEX%3A52019DC0285 (accessed on 23 April 2020).
- The German Coal Commission. Agora Energiewende and Aurora Energy Research. A Roadmap for a Just Transition from Coal to Renewables. 2019. Available online: https://www.agora-energiewende.de/fileadmin2/Projekte/2019/Kohlekommission_Ergebnisse/168_Kohlekommission_EN.pdf (accessed on 5 July 2020).
- European Commission. C(2019) 4423 final. Commission Recommendation on the draft integrated National Energy and Climate Plan of Romania covering the period 2021-2030. 2019. Available online: https://op.europa.eu/en/publication-detail/-/publication/95ab2931-ce18-11e9-992f-01aa75ed71a1 (accessed on 5 July 2020).
- European Commission. C(2019) 4423 final. Commission Recommendation on the draft integrated National Energy and Climate Plan of Bulgaria covering the period 2021–2030. 2019. Available online: https://eur-lex.europa.eu/legal-content/EN/TXT/?uri=CELEX:32019H0903(02) (accessed on 5 July 2020).
- Sensfuß, F.; Ragwitz, M.; Genoese, M. The merit-order effect: A detailed analysis of the price effect of renewable electricity generation on spot market prices in Germany. Working paper sustainability and innovation 2008. Available online: https://www.isi.fraunhofer.de/content/dam/isi/dokumente/sustainability-innovation/2007/WP7-2007_merit-order-effect.pdf (accessed on 23 April 2020).
- Keles, D.; Genoese, M.; Möst, D.; Ortlieb, S.; Fichtner, W. A combined modeling approach for wind power feed-in and electricity spot prices. Energy Policy 2013, 59, 213–225. [Google Scholar] [CrossRef]
- Traber, T.; Kemfert, C. Gone with the wind?—Electricity market prices and incentives to invest in thermal power plants under increasing wind energy supply. Energy Econ. 2011, 33, 249–256. [Google Scholar] [CrossRef] [Green Version]
- Azofra, D.; Jiménez-Macías, E.; Martínez-Cámara, E.; Blanco-Fernández, J.; Saenz-Díez, J. Wind power merit-order and feed-in-tariffs effect: A variability analysis of the Spanish electricity market. Energy Convers. Manag. 2014, 83, 19–27. [Google Scholar] [CrossRef] [Green Version]
- Ballester, C.; Furió, D. Effects of renewables on the stylized facts of electricity prices. Renew. Sustain. Energy Rev. 2015, 52, 1596–1609. [Google Scholar] [CrossRef]
- Martinez-Anido, C.B.; Brinkman, G.; Hodge, B.-M. The impact of wind power on electricity prices. Renew. Energy 2016, 94, 474–487. [Google Scholar] [CrossRef] [Green Version]
- Woo, C.K.; Moore, J.; Schneiderman, B.; Ho, T.; Olson, A.; Alagappan, L.; Chawla, K.; Toyama, N.; Zarnikau, J. Merit-order effects of renewable energy and price divergence in California’s day-ahead and real-time electricity markets. Energy Policy 2016, 92, 299–312. [Google Scholar] [CrossRef]
- Bruninx, K.; Madzharov, D.; Delarue, E.; D’haeseleer, W. Impact of the German nuclear phase-out on Europe’s electricity generation—A comprehensive study. Energy Policy 2013, 60, 251–261. [Google Scholar] [CrossRef]
- Kallabis, T.; Pape, C.; Weber, C. The plunge in German electricity futures prices—Analysis using a parsimonious fundamental model. Energy Policy 2016, 95, 280–290. [Google Scholar] [CrossRef]
- European Parliament and Council, 2018. Directive 14 March 2018, 2018/410, Amending Directive 2003/87/EC to enhance cost-effective emission reductions and low-carbon investments, and Decision (EU) 2015/1814. Available online: https://eur-lex.europa.eu/legal-content/EN/TXT/?uri=CELEX%3A32018L0410 (accessed on 23 April 2020).
- Bublitz, A.; Keles, D.; Fichtner, W. An analysis of the decline of electricity spot prices in Europe: Who is to blame? Energy Policy 2017, 107, 323–336. [Google Scholar] [CrossRef]
- Boffa, F.; Pingali, V.; Vannoni, D. Increasing Market Interconnection. An Analysis of the Italian Electricity Spot Market; University of Torino, Department of Economics and Public Finance: Torino, Italy, 2009. [Google Scholar]
- Pellini, E. Measuring the impact of market coupling on the Italian electricity market. Energy Policy 2012, 48, 322–333. [Google Scholar] [CrossRef]
- Newbery, D.; Strbac, G.; Viehoff, I. The benefits of integrating European electricity markets. Energy Policy 2016, 94, 253–263. [Google Scholar] [CrossRef] [Green Version]
- Ringler, P.; Keles, D.; Fichtner, W. How to benefit from a common European electricity market design. Energy Policy 2017, 101, 629–643. [Google Scholar] [CrossRef]
- Department of Energy and Climate Change, 2013. Energy Act. 18 December 2013. Available online: https://www.gov.uk/government/collections/energy-act (accessed on 23 April 2020).
- Hach, D.; Spinler, S. Capacity payment impact on gas-fired generation investments under rising renewable feed-in—A real options analysis. Energy Econ. 2016, 53, 270–280. [Google Scholar] [CrossRef]
- Doorman, G.; Barquin, J.; Barroso, L.; Batlle, C.; Cruickshank, A.; Dervieux, C.; Flanagan, R.; Gilmore, J.; Greenhalg, J.; Höschle, H.; et al. Capacity Mechanisms: Needs, Solutions and State of Affairs; CIGRÉ: Paris, France, 2016. [Google Scholar]
- Newbery, D.; Pollitt, M.G.; Ritz, R.A.; Strielkowski, W. Market design for a high-renewables European electricity system. Renew. Sustain. Energy Rev. 2018, 91, 695–707. [Google Scholar] [CrossRef] [Green Version]
- Bublitz, A.; Keles, D.; Zimmermann, F.; Fraunholz, C.; Fichtner, W. A survey on electricity market design: Insights from theory and real-world implementations of capacity remuneration mechanisms. Energy Econ. 2019, 80, 1059–1078. [Google Scholar] [CrossRef]
- Hogan, M. Follow the missing money: Ensuring reliability at least cost to consumers in the transition to a low-carbon power system. Electr. J. 2017, 30, 55–61. [Google Scholar] [CrossRef]
- Bhagwat, P.C.; Marcheselli, A.; Richstein, J.C.; Chappin, E.J.; De Vries, L.J. An analysis of a forward capacity market with long-term contracts. Energy Policy 2017, 111, 255–267. [Google Scholar] [CrossRef]
- Bajo-Buenestado, R. Welfare implications of capacity payments in a price-capped electricity sector: A case study of the Texas market (ERCOT). Energy Econ. 2017, 64, 272–285. [Google Scholar] [CrossRef]
- Graichen, P.; Kleiner, M.M.; Podewils, C. The energy transition in the power sector in Europe: State of affairs 2016. Available online: https://www.agora-energiewende.de/fileadmin2/Projekte/2017/Jahresauswertung_2016/Die_Energiewende_im_Stromsektor_2016_EN.pdf (accessed on 23 April 2020).
- Reitz, F.; Gerbaulet, C.; Von Hirschhausen, C.; Kemfert, C.; Lorenz, C.; Oei, P.Y. Verminderte Kohleverstromung könnte zeitnah einen relevanten Beitrag zum deutschen Klimaschutzziel leisten. DIW Wochenber. 2014, 47, 1219–1229. [Google Scholar]
- Heinrichs, H.U.; Markewitz, P. Long-term impacts of a coal phase-out in Germany as part of a greenhouse gas mitigation strategy. Appl. Energy 2017, 192, 234–246. [Google Scholar] [CrossRef]
- Heinrichs, H.U.; Schumann, D.; Vögele, S.; Biß, K.H.; Shamon, H.; Markewitz, P.; Többen, J.; Gillessen, B.; Gotzens, F.; Ernst, A. Integrated assessment of a phase-out of coal-fired power plants in Germany. Energy 2017, 126, 285–305. [Google Scholar] [CrossRef]
- Gross, R.; Speirs, J.; Hawkes, A.; Skillings, S.; Heptonstall, P. Could Retaining Old Coal Lead to a Policy Own Goal? ICEPT Research Report; Centre for Energy Policy and Technology, Imperial College London: London, UK, 2014; Available online: http://assets.wwf.org.uk/downloads/wwf_coal_report_imperial_college_final.pdf (accessed on 5 July 2020).
- Gestore del Mercato Elettrico. Testo integrato della disciplina del mercato elettrico. 2003. (In Italian). Available online: https://www.mercatoelettrico.org/It/MenuBiblioteca/Documenti/20160720_testo_integrato_disciplina_mercato_elettrico.pdf (accessed on 5 July 2020).
- Nutkani, I.U.; Loh, P.C.; Blaabjerg, F. Cost-based droop scheme with lower generation costs for microgrids. In Proceedings of the IEEE ECCE Asia Downunder, Melbourne, Australia, 3–6 June 2013; pp. 339–343. [Google Scholar]
- Energy Exemplar. PLEXOS Website. Available online: https://energyexemplar.com/solutions/plexos/ (accessed on 24 April 2020).
- Astapov, V.; Shuvalova, J. About suitability of condensing power plants to power distribution system. In Proceedings of the 4th International Youth Conference on Energy (IYCE), Siofok, Hungary, 6–8 June 2013; pp. 1–5. [Google Scholar]
- Marconato, R. Electric Power Systems; CEI: Milano, Italy, 2002. [Google Scholar]
- Terna, Statistical Data. 2019. Available online: https://www.terna.it/it/sistema-elettrico/transparency-report/download-center (accessed on 23 April 2020).
- Terna, Statistical Data. 2018. Available online: https://www.terna.it/it/sistema-elettrico/transparency-report/download-center (accessed on 23 April 2020).
- Assocarboni, 2018. Produzione di energia elettrica e carbone: L’anomalia italiana. 2018. (In Italian). Available online: https://assocarboni.it/assocarboni/il-carbone/ (accessed on 23 April 2020).
- Assocarboni. Available online: https://assocarboni.it/assocarboni/il-carbone/le-centrali-in-italia/ (accessed on 5 July 2020).
- GME Statistic Data. Available online: https://www.mercatoelettrico.org/it/Statistiche/ME/DatiSintesi.aspx (accessed on 5 July 2020).
- Terna. SACOI Interconnection Data and Statistics (In Italian). Available online: http://download.terna.it/terna/0000/1114/42.PDF (accessed on 26 August 2020).
- Italian Ministry of Economic Development. Strategia Energetica Nazionale. 2017; (In Italian). Available online: https://www.mise.gov.it/images/stories/documenti/Testo-integrale-SEN-2017.pdf (accessed on 26 August 2020).
- Terna. Import NTC Values on France, Switzerland, Austria, Slovenia and Greece to Italy Interconnection—YEAR 2018. Available online: https://download.terna.it/terna/0000/1005/88.PDF (accessed on 5 July 2020).
- Terna. Development Plan 2018. (In Italian). Available online: https://download.terna.it/terna/0000/1039/76.PDF (accessed on 26 August 2020).
- Terna. Develpment Plan 2019. (In Italian). Available online: https://download.terna.it/terna/0000/1188/36.PDF (accessed on 26 August 2020).
- International Energy Agency (IEA). Forecasts about Fuel and CO2 Allowances Prices. Available online: https://www.iea.org/ (accessed on 2 June 2019).
- Italian National Institute for Environmental Protection and Research (ISPRA). Tabella dei parametri standard nazionali per il monitoraggio e la comunicazione dei gas ad effetto serra ai sensi del decreto legislativo n. 30 del 2013. (In Italian). Available online: https://www.minambiente.it/sites/default/files/archivio/allegati/emission_trading/tabella_coefficienti_standard_nazionali_11022019.pdf (accessed on 27 August 2020).
- Italian Regulatory Authority for Energy, Networks and Environment (ARERA). Deliberation n. 48/04, Avvio del dispacciamento di merito economico per l’anno 2004 e connesse disposizioni in materia di adeguatezza della capacità produttiva del sistema elettrico nazionale e di attuazione della deliberazione dell’Autorità per l’energia elettrica e il gas 30 gennaio 2004. n. 5/04, 2004. (In Italian). Available online: https://www.arera.it/it/docs/04/048-04.htm (accessed on 26 August 2020).
- Italian Energy Services Manager (GSE). Available online: www.gse.it (accessed on 26 August 2020).
- Italian Regulatory Authority for Energy, Networks and Environment (ARERA). Deliberation 21 luglio 2011—ARG/elt 98/11, Criteri e condizioni per la disciplina del sistema di remunerazione della disponibilità di capacità produttiva di energia elettrica, ai sensi dell’articolo 2 del decreto legislativo 19 dicembre 2003. n. 379, 2011. (In Italian). Available online: https://www.arera.it/it/docs/11/098-11arg.htm (accessed on 26 August 2020).
© 2020 by the authors. Licensee MDPI, Basel, Switzerland. This article is an open access article distributed under the terms and conditions of the Creative Commons Attribution (CC BY) license (http://creativecommons.org/licenses/by/4.0/).

 ,
, 


