Abstract
In data centers, heating, ventilation, and air-conditioning (HVAC) consumes 30–40% of total energy consumption. Of that portion, 26% is attributed to fan power, the ventilation efficiency of which should thus be improved. As an alternative method for experimentations, computational fluid dynamics (CFD) is used. In this study, “parameter tuning”—which aims to improve the prediction accuracy of CFD simulation—is implemented by using the method known as “design of experiments”. Moreover, it is attempted to improve the thermal environment by using a CFD model after parameter tuning. As a result of the parameter tuning, the difference between the result of experimental-measurement results and simulation results for average inlet temperature of information-technology equipment (ITE) installed in the ventilation room of a test data center was within 0.2 °C at maximum. After tuning, the CFD model was used to verify the effect of advanced insulation such as raised-floor fixed panels and show the possibility of reducing fan power by 26% while keeping the recirculation ratio constant. Improving heat-insulation performance is a different approach from the conventional approach (namely, segregating cold/hot airflow) to improving ventilation efficiency, and it is a possible solution to deal with excessive heat generated in data centers.
1. Introduction
In data centers, information-technology equipment (ITE) expends an enormous amount of electricity on information processing. Data centers are thus known as facilities that consume huge amounts of electricity. In fact, it is estimated they account for 1% of global electricity consumption [1]. Although, almost all the power consumption of the ITE in a data center is converted into sensible heat, the failure rate of the ITE increases as its inlet temperature increases [2]. From the standpoint of preventing “information-communication stagnation” due to failure of ITE, the ITE is therefore cooled 24 h a day, 365 days a year. As an operational target for cooling, the thermal guidelines [2] presented by the American Society of Heating, Refrigerating, and Air-Conditioning Engineers (ASHRAE) TC 9.9 are often cited. As for a data center, heating, ventilation, and air-conditioning (HVAC) consumes 30–40% of the energy of the whole facility [3]. Accordingly, better energy conservation is strongly demanded. Especially in the case of a data center, fans consume a large amount of power because the sensible-heat load of the housed ITE is processed with a large volume of air, which accounts for about 26% of the power consumption of the HVAC [4]. For that reason, improving the efficiency of air-conditioning airflow has been actively researched.
Through full-scale experiments, four airflow configurations (namely, raised-floor supply/room return; raised-floor supply/ceiling return; ceiling-supply/room return; and ceiling-supply/raised-floor return) were compared and evaluated according to the evaluation index (based on dimensionless room temperature and standard deviation) proposed by Nakao et al. [5]. Supply-air volume for each perforated panel in an experimental facility equipped with a raised-floor computer-room air-conditioning (CRAC) unit was measured, and phenomena such as decreased supply-air volume and backflow near the CRAC were investigated by Rambo et al. [6]. However, methods such as full-scale experiments and reduced-model experiments face problems such as the cost of constructing the test environment and the difficulty of changing conditions on a large scale. Accordingly, as recommended in ASHRAE TC 9.9, as a method for studying optimization and analysis of air flow [4], thermal and air-flow simulations based on computational fluid dynamics (CFD) are being actively used.
CFD is an effective study tool for comparing airflow schemes (which usually require large-scale experiments) and for optimizing parameters that require multiple levels. In a study by Shrivastava et al., CFD was used to compare thermal performances of seven types of airflow schemes that combine raised-floor supply, raised-floor return, ceiling supply, and ceiling return [7]. In another study, as for the ventilation design of these airflow schemes, height of the ceiling, airflow rate through perforated panels, and position of return vents were studied as parameters [8]. And a parameter study of ceiling height in multiple airflow schemes was conducted by Sorell et al. [9]. Airflow distribution from perforated panels was analyzed by CFD by using raised-floor height and aperture ratio of the panels as parameters, and a method to make the airflow distribution uniform was proposed by Patankar et al. [10,11]. As a parameter study by CFD aimed at improving the thermal environment, the effect of airflow separation (by, for example, aisle enclosure and blank panels, was verified by Wibron et al. [12] and Wang et al. [13]. Moreover, optimum conditions for the outlet angle of the aperture panel were studied by Ni et al. [14]. In addition, as a method for improving airflow in the maintenance phase of an existing data center, a baffle plate was proposed by Yuan et al., who optimized its size and mounting angle [15].
In this way, CFD makes it possible to compare airflow schemes and conduct parameter studies on each element of a data center without conducting large-scale experiments, thereby improving efficiency of research. However, the results of CFD analysis change according to whatever element is modeled. Now, we consider combining actual measurements taken at a data center with the results of CFD simulation. If we try to build a CFD model with the minimum number of elements and fit it to measurement data by only setting those elements, the setting may deviate greatly from the theoretical values or actual values.
As for the raised-floor air-supply method, the raised floor is used not only for distributing air flow, but also for providing space for laying power supplies, network cables, air-conditioning pipes, and other infrastructure. VanGilder et al. argued that this housed infrastructure acts as obstacles that may interfere with the airflow, so it is desirable to include these obstacles in airflow analysis of the raised floor [16]. And Joshi et al. reported that “distributed air leakage”, which occurs in an area equivalent to 0.1–0.5% of the exposed floor area of the fixed panels (due to abrasion of tile seals), corresponds to 10–15% of the air volume passing through the perforated panels [17]. Karki et al. treated air leakage from fixed panels of raised floors as a research theme [18]. Joshi et al. also showed that pressure loss in the raised-floor-supply/ceiling-return system is about 250 Pa [17]. Accordingly, since the pressure difference inside the rooms in a data center is large, it is considered that the gap between structural components (such as the above-mentioned raised-floor fixed panels) affects the CFD simulation result. In addition, accompanying the high-density housing of ITE, airflow separation to suppress the rise of ITE inlet temperature is becoming more important. Typical methods of airflow separation are: (i) cold-aisle/hot-aisle rack arrangement, (ii) aisle containment (which physically separates the cold aisle and the hot aisle), and (iii) panels that prevent backflow of ITE outlet air from places where ITE is not yet mounted on the mounting rails in racks (hereinafter, “blank panels”). On the contrary, by separating the space in this manner, large pressure or temperature differences are generated between the spaces. And such pressure difference promotes air leakage (as mentioned above). Furthermore, in a data center—composed of material with low thermal resistance (such as steel plate or aluminum), it is considered that heat transmission due to temperature differences has a considerable influence.
In light of the above-described background, in the present study, in a simulation room of a data center adopting the raised-floor-supply/transverse return method (using cold-aisle containment (CAC) and blank panels), the elements that are thought to affect the results of CFD analysis were modeled, and the factors that affect prediction accuracy of the analysis were revealed. Presence of obstructions, thermal resistance of structural components and aperture ratio of air gaps were selected as the elements. Moreover, a method for improving accuracy of predicting the thermal environment of a data center by CFD simulation using parameter tuning is proposed. In addition, in the CFD model after tuning, the heat-insulation performance is examined in terms of improving the thermal environment and reducing energy consumption. High heat generation in data centers is a major problem, and air segregation, which is one of the solutions, has reached a fairly high level. However, no papers have yet referred to the heat-insulation performance as a means of further improving the thermal environment. This article suggests that advanced insulation performance contributes to the improving ventilation efficiency, and quantifies the effect of improving heat-insulation performance.
2. Parameter-Tuning Method
The design of experiments (DOE)—developed by R. A. Fisher of the United Kingdom for streamlining agricultural experiments—is a method for assignment and analysis of experiments [19]. Compared with the conventional one-factor-at-a-time approach, this DOE can obtain sufficient information in a small number of experiments, so it makes it possible to study the effects of multiple factors on a certain process [20].
The aim of this study is to improve prediction accuracy of CFD simulations by using this DOE. The parameter-tuning method for multiple characteristics proposed by Nishina et al. is used so that the same CFD model can be accurately reproduced even if the air volume of the air-conditioner varies [21]. As for this multi-character parameter-tuning method, before the two steps that respectively reduce deviation and bring values closer, a step for reducing the difference in deviation patterns with respect to the signal factor for each characteristic is added.
The DOE for parameter tuning when K types of characteristics are given as Pk (k = 1, 2, …, K) is shown in Table 1. This is a direct-product experiment in which the parameter-tuning factor is the inner factor, and the signal factor (G) is the outer factor. Mixed-level orthogonal array L18 is used for the inner orthogonal array. Here, xjk is taken as the experimental measurement of signal factor Gj at the j-th level in regard to characteristic Pk, and cijk is taken as the simulation result of characteristic Pk and signal factor Gj in regard to the i-th analysis of the inner orthogonal array. The difference between the simulation results and the experimental measurements is taken as yijk, given as

Table 1.
Design of experiments (DOE) for multi-feature parameter tuning.
The procedure of parameter tuning is described as follows. When the optimum level differs in each step, the level of the first step is basically given the highest priority, and the level of the second step is given next priority.
1. First Step
The condition regarding the reproducibility of the deviation pattern of the signal factor for each characteristic is set. The factorial effect of the tuning factor is calculated with Si, calculated by using the following formula, as the analysis characteristic. For each factor, a level with a small average Si value is selected.
2. Second Step
The analysis characteristic for the variation of signal factors is defined as the sum of squared deviation Si’, and the condition to minimize the value of Si’ is given as:
3. Third Step
Mean value for each analysis is obtained, and the factorial effect of the tuning factor on the mean value is calculated. A level with an average value close to zero is selected.
The handling of the interaction between factors when using the orthogonal array is described hereafter. Generally, in an orthogonal array, the main effect of a factor appears as the effect of the column to which the factor is assigned, and the interaction between factors appears in a different column from the column to which the factor is assigned. When another factor is assigned to the column in which the interaction appears, the effect of that factor and this interaction appear to be confounding [22]. In this study, the interaction is not considered so as to select the optimum level with high reproducibility, even if the interaction has a certain influence. Therefore, in regard to the orthogonal array, mixed-system orthogonal array L18 (in which interaction does not appear in a specific column; i.e., interactions appear almost uniformly in all columns) is used, and the superiority or inferiority between the levels is evaluated by using the average value of the analysis characteristic for each level. Moreover, prediction accuracy is confirmed at the change of level in each step, and unexpected deterioration of accuracy due to interaction is eliminated.
3. Parameter Tuning
3.1. Overview of Verification Room
The verification room simulating a data center is shown in Figure 1, and the specifications of the experimental equipment are detailed in Table 2. The rack layout in the verification room is a cold-aisle/hot-aisle type, and the cold aisle is fitted with cold-aisle containment (CAC) that surrounds with horizontal components that pass over the racks. At the center of the verification room (hot-aisle part), the room, raised floor, and ceiling are divided by temporary partitions (antistatic flameproof films), and the target range of verification room is 11.0 m long and 5.0 m deep. Of the 22 19-inch racks, 20 racks are equipped with one heat generator with a 2-kW heater, and the other two (unused) racks are blocking the door side of the racks. The heat generators (with height of 6U) are installed at heights of 23U to 28U from the rack bottom.
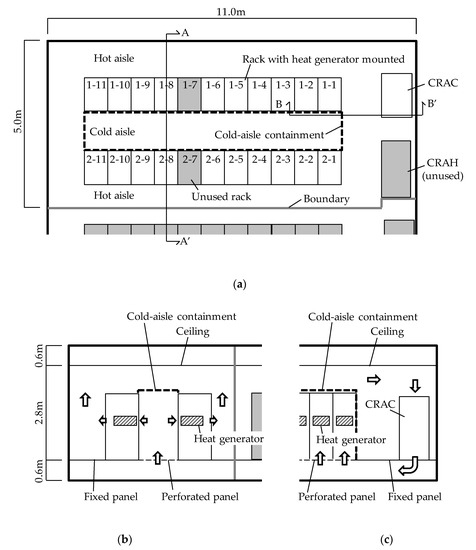
Figure 1.
(a) Plan view of verification room, (b) cross section A-A’, and (c) cross section B-B’.
Table 2.
Overview of experimental equipment.
As for the CFD model, the following conditions are set: airflow of the CRAC, air-supply temperature of the CRAC, airflow at the heat generator, and calorific value of the heat generator. They are values measured at the points listed in Table 3 or calculated values based on the measured values. The air volume of the CRAC was calculated from average air velocity and effective area of the inlet of the CRAC, and the air volume of the heat generator was calculated from the power consumption and the inlet/outlet temperature difference. Inlet-air temperature of the heat generator is a prediction target of the CFD simulation.
Table 3.
Measurement points.
3.2. Overview of CFD Model
Commercial software was used for CFD analysis. The simulation set-up is shown in Table 4. The discretization algorithm used is SIMPLEC (Semi-Implicit Method for Pressure-Linked Equations Consistent) based on the orthogonal finite-volume method [23]. As the turbulence model, the standard k-ε model, which is commonly chosen in CFD analysis of data centers [7,8,13,14,15,16,18,24], was selected. Fundamental governing equations are the continuity equation, the Navier–Stokes equation and the energy equation. The buoyancy is considered in the Navier–Stokes equation using the Boussinesq approximation. This CFD software does not consider the surface roughness of the materials. The walls enclosing the verification room are modeled as adiabatic. Convergence is considered when calculation error in the entire analysis area is 10−3.5. VanGilder et al. reported that grid size used for CFD analysis significantly affects prediction accuracy in a rough range [24]. In this study, to eliminate the effect of different grid sizes as much as possible, the same number of partitions (23,400,000 grids) was used for all models.
Table 4.
Simulation set-up.
A model of the verification room is shown in Figure 2. Aperture ratios are assigned to the raised-floor perforated panels of the cold aisle and rack door, respectively. The raised-floor perforated panel has alternately arranged aperture ratios of 25% and 50%. In the CFD model, the aperture ratio is uniform (37.5%). A ratio of 76% (catalog value) is assigned to aperture of the rack door.
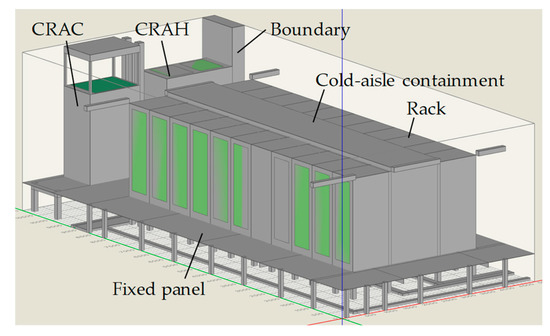
Figure 2.
Model of verification room.
3.3. Signal Factors and Characteristics
To improve the accuracy of the CFD model, the goal of this study is to be able to reproduce the simulation results with the same model even if the airflow supplied by the air conditioner varies. Therefore, for the experiments conducted in the verification room, fan frequency of the CRAC was set to 45 Hz (G1), 54 Hz (G2), and 63 Hz (G3) with air-supply volume of the CRAC as a signal factor. The conditions assigned in the experiments are listed in Table 5. In addition, the inlet temperature of the heat generator, which is the prediction target, is measured 10 times (namely, 10 racks), as shown in Table 3. Since 10 temperature measurements are targeted, a multi-characteristic DOE is applied as a combination of 10 characteristics.
Table 5.
Signal factors and conditions for computational fluid dynamics (CFD) models.
3.4. Prameter-Tuning Factors
Factors that are considered to affect the results of CFD analysis are extracted as listed in Table 6. As for the level indicating the presence or absence of a model, the first level has a model, and the second level has no model. As for the levels related to the numerical values of the model, the first level is a theoretical value or a measured value, the second level is half the value of the first level, and the third level is not considered in the model. However, the second level of thermal resistance (factor C), calculated by thermal conductivity and thickness of the materials, is twice the thickness of the first level. Column H, to which no factor is assigned, is the error column (e).
Table 6.
Parameter-tuning factors.
Each parameter-tuning factor is outlined as follows.
A. Presence or Absence of Obstructions
The raised floor frame, airflow guide, piping and cables, and air-conditioner inlet structure (shown in Figure 3) are modeled as obstacles. Here, the airflow guide is a steel plate—obliquely fixed immediately below the air-conditioner outlet—for smoothly introducing air-conditioned air into the raised-floor space.
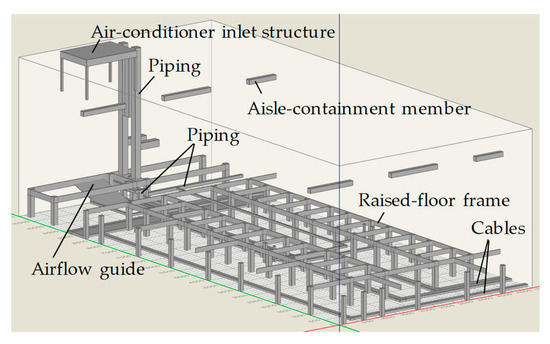
Figure 3.
Model of obstructions.
B. Aperture Ratio of CRAH
The unused computer-room air handler (CRAH) adjacent to the CRAC is tuned off. However, a pressure difference between the inlet and outlet ports occurs, so it is possible that the inside of the CRAH becomes a leakage path and affect the CFD results. Static pressure inside the CRAH during rated operation were obtained from the P-Q characteristic curve of the internal fans as well as rated air capacity and rated external static pressure of the CRAH, and resistance coefficient was calculated from internal static pressure of the CRAH and airflow velocity on the inlet surface. An aperture ratio corresponding to the resistance coefficient is assigned to the inlet port of the CRAH.
C. Thermal Resistance
Heat transmission of the raised-floor fixed panel, rack case, heat generating case, CAC, and blank panel are considered. Thermal-resistance value was obtained from thermal conductivity and thickness of the materials, and the heat-transfer coefficient was calculated by using the automatic calculation function of the CFD software.
D. Aperture Ratio of Fixed Panels
Measured values were used for the aperture ratio of raised-floor fixed panels. The air-gap size between panels was about 10 mm per 26 fixed panels (with width of 300 mm).
E. Aperture Ratio of Blank Panels
The aperture ratio is separately assigned to the following blank panels: (i) a blank panel to be installed on the mounting rail in the rack in which ITE is not installed; (ii) a side blank panel that blocks the gap between the rack side and mount rail; and (iii) a lower blank panel that blocks gap at the bottom of the rack and the bottom edge of the blank panels and side blank panels. Measured values are used for each aperture ratio.
F. Presence or Absence of Gap between Racks
The gap between the racks, namely, 6 mm, is considered in the model. In the case that no gap exists, the space between the racks is closed with a rectangular parallelepiped model with a width of 6 mm. For the third level, the dummy-level technique is used, and a standard first level is substituted as the dummy level.
G. Aperture Ratio of CAC
Although no large gaps exist in the CAC itself, a gap of about 2 mm exists in the 80-mm fixing member between the upper part of the rack and the CAC horizontal members. This measured value is used as the aperture ratio of the CAC.
3.5. Implementation of Parameter Tuning
The signal factor and parameter-tuning factor are assigned as shown in Table 1 and analyzed on the basis of the DOE. From the analysis results shown in Appendix A, analytical characteristics Si, Si’, and were calculated and averaged at each level of the fitting factor to create the factor-effect diagram shown in Figure 4. As for analysis characteristic Si, the level reflecting any of the parameter-tuning factors, including the dummy level of factor F, in the CFD model is smaller, and it can be said that the reproducibility of the results when the air-supply capacity of the CRAC is varied is good. On the other hand, if theoretical values and measured values (first level) of aperture ratio of the CRAH (B), thermal resistance (C), and aperture ratio of the blank panels (E) are taken as conditions for the CFD model, the reproducibility becomes worse than that of the second level.
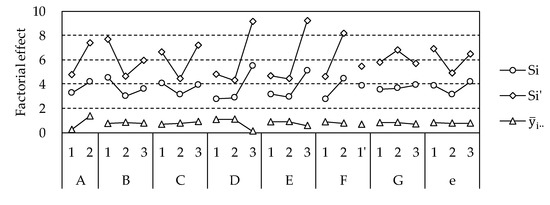
Figure 4.
Factor–effect diagram of parameter-tuning factors.
In the first step of parameter tuning, a level with a small analysis characteristic Si is selected. In the second step, the level at which analysis characteristic Si’ is small is selected, and in the third step, the level at which analysis characteristic is close to zero is selected. Basically, the level selected in the first step is given the highest priority, and the level selected the second step is given second priority. When the level is changed in a lower-order step, the optimum level selected in a higher-order step will be changed. Consequently, the factors that change the level in each step are limited to a single factor. Prediction accuracy is then confirmed after the change. The indexes taken to confirm prediction accuracy are: (i) average deviation () between the simulated heat-generator inlet temperatures of 10 racks and the corresponding measurement results and (ii) residual sum of squares, Se.
The levels to be selected by parameter tuning in each step are listed in Table 7, and the confirmation results concerning prediction accuracy are shown in Figure 5. As described above, in the first step, the level at which analysis characteristic Si was small for each factor was selected. In the second step, parameter-tuning factor D with the largest decrease in analysis characteristic Si’ was changed from the first level to the second level. Prediction accuracy is confirmed after the second step. Residual sum of squares Se and average deviation remained almost unchanged. In the third step, the third level of factor D, at which the analysis characteristic is close to zero, was selected. As shown in the factor-effect diagram, change in prediction accuracy after the third step increased residual sum of squares Se; however, average deviation was close to zero, and prediction accuracy was significantly improved.
Table 7.
Result of implementing parameter tuning.
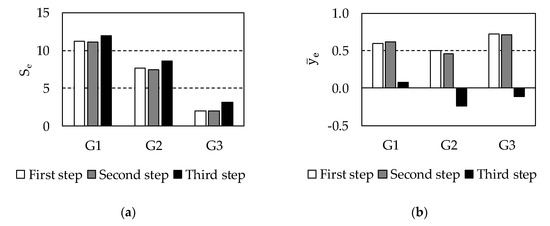
Figure 5.
Confirmation of prediction accuracy at each step of fitting: (a) residual sum of squares Se and (b) average deviation
Originally, to derive the optimal combination of signal factors (3 levels) and parameter-tuning factors (2 levels × 2 factors and 3 levels × 5 factors), the brute-force method requires 2916 simulations. With the proposed parameter-tuning method, by performing the analysis assigned to mixed-level orthogonal array L18 in terms of only the number of signal factors and performing all three steps for confirming the tuning result in terms of only the number of signal factors, an optimum combination was derived after 63 trials.
Reproducibility of the actual inlet temperature of a heat generator is confirmed as follows. The measurements and simulation results of heat-generator inlet temperature for each rack when CRAC fan frequency was varied [45 Hz (G1), 54 Hz (G2), and 63 Hz (G3)] are plotted in Figure 6. Each step of the simulation is considered first. The simulation results of the first step and those of the second step show no significant difference under any CRAC airflow conditions. Next, compared to the first and second steps, the third step reveals that the heat-generator inlet temperature decreased, especially in the racks far from the CRAC, namely, racks 1–5 to 11 and 2–5 to 11. It is considered that the reasons for this result are twofold: (i) there is no bypass air flowing from inside of the raised floor to the hot aisle via the gap in the fixed panels and (ii) sufficient air-conditioning air supply passed through the perforated panel in the raised floor.
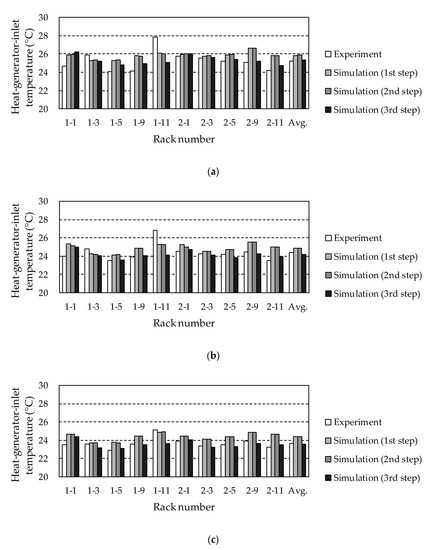
Figure 6.
Prediction results for heat-generator inlet temperature at computer-room air-conditioning (CRAC) fan rotational speeds of (a) 45 Hz (G1), (b) 54 Hz (G2), and (c) 63 Hz (G3).
Next, the simulation results of the third step after parameter tuning are compared with the measurements. As for the first row of racks, although deviations in temperature of 1 to 1.5 °C and 3 °C exist for rack numbers 1-1 and 1-11, as for the other racks, the experimental measurements could be roughly reproduced. Also, as for the second row, the experimental measurements could be predicted accurately. Rack number 1-11 shows large deviations, which suggest that a factor that not reflected in the CFD model is increasing the heat-generator inlet temperature. Under the assumption that there is a gap in the part where the vertical member of the CAC and the rack number 1-11 contact, the results that reflect this gap in the CFD model for CRAC fan frequency of 63 Hz (G3) is shown in Figure 7. As for the result of changing the gap in intervals of 10 mm, when the gap was 30 mm, the simulated heat-generator inlet temperature of rack number 1-11 was close to the measured value. Also, the assumed gap did not adversely affect the prediction results of other inlet temperatures.
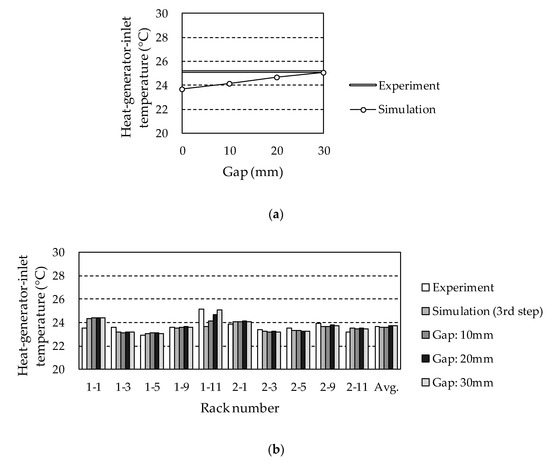
Figure 7.
Change in the prediction result of heat-generator inlet temperature by reproducing the gap of the part contacting the vertical member of the cold-aisle containment (CAC) and the rack number 1-11 at CRAC fan frequency of 63 Hz (G3): (a) prediction result of rack number 1-11 and (b) prediction result of all racks.
As mentioned above, in the existing literature [17,18], the influence of the air gap between the raised-floor fixed panels is mentioned. However, prediction accuracy of this model was higher if the gap was not reflected in the model. In this CFD model, the bypass route that passes through the stopped CRAH is modeled, and as a bypass route, it exists in parallel with the gap between the raised-floor fixed panels. Since this opening is larger than the gap between the raised-floor fixed panels, the influence of the presence or absence of the model of the fixed-panel gap may be reduced.
4. Improvement of Thermal Environment
4.1. Improvement Measures
According to the result of the parameter tuning described in the previous section, heat transmission by the components was reflected in the proposed model. However, it is considered that the heat transfer due to air flow accounts for the majority of the heat transfer in the data center, and the heat transfer due to the heat transmission of the structural components has not received much attention. Accordingly, in this section, the effect of improving the indoor thermal environment when the heat-insulation performance of the structural components is improved is verified.
As for the CFD model implementing the third step of tuning, in consideration of heat flow, a heat-insulation material (glass wool; thickness: 10 mm) is uniformly attached to the structural components to improve the thermal environment. Changes in the thermal resistance of each component are listed in Table 8. Thermal resistances of the original components are sufficiently small compared to that of the attached heat-insulation material, so they are ignored. In other words, in the CFD model after improvement, the geometry and grids of computational domain remain the same, and just the thermal-resistance values of the original components are changed to the value equivalent to the glass wool with 10 mm thickness. However, the heat generator is a model of ITE, and it is not realistic to attach a heat-insulation material to ITE. Accordingly, heat resistance of the heat generator’s case is taken as the same value before and after the improvement of thermal environment.
Table 8.
Improvement measures for the thermal environment.
4.2. Evaluation Criteria
As an index to measure the effect of improving the thermal environment, the air-management metrics [25] proposed by Tozer et al. are used.
As for air-management metrics, when modeling the air flow path in the data center, in addition to CRAC air volume (mc) and ITE air volume (ms): (i) negative-pressure airflow (mn) (which is the airflow that is induced into the raised floor by the Venturi effect), (ii) bypass-air volume (mb) (supplied from the raised floor and returns to the CRAC without cooling the ITE), and (iii) recirculation-air volume (mr) (i.e., that of outlet air from the ITE that returns to the ITE inlet) are incorporated in the model.
By solving the mass and heat-balance equations that hold for each part of these airflow paths, the air-volume ratio can be obtained from the temperature of each part. The air-volume ratio is composed of four elements: (i) balance ratio (BAL) (i.e., ratio of CRAC air flow (mc) to ITE air flow (ms); (ii) negative-pressure ratio (NP) (i.e., ratio of negative-pressure air flow (mn) to CRAC air flow (mc); (iii) bypass ratio (BP) (i.e., ratio of bypass airflow (mb) to raised-floor airflow (mf); and (iv) recirculation ratio (R) (i.e., ratio of recirculation air flow (mr) to ITE air flow (ms)). The equations for obtaining these respective airflow ratios from temperature are given below:
Here, Tr is CRAC return-air temperature, Tc is CRAC supply-air temperature, Tf is raised-floor temperature, Ts is ITE inlet temperature, and Th is ITE outlet temperature.
As described above, the air-management metrics evaluate the efficiency of air-conditioning from air– volume ratio, and the equation holds under the assumption that heat is only transferred by air flow. This assumption also holds for data-center-evaluation indicators such as “supply heat index” (SHI) and “return heat index” (RHI) by Sharma et al. [26] and “air segregation efficiency” (ASE) by Tozer et al. [27] However, heat transfer in the proposed CFD model is a combination of air flow and heat transmission. Accordingly, in this study, as in the past, it is assumed that heat transfer is due to air flow, and the thermal environment is evaluated on the basis of air-flow ratio. Hereafter, change in the evaluation index due to improvement in heat-insulation performance of the structural components is considered, and the possibility that heat transmission by overall heat transfer affects the thermal environment is suggested.
4.3. Result of Improvement
Temperature and air-flow ratio of each part before and after improvement of the thermal environment are shown in Figure 8, Figure 9 and Figure 10. Even under the condition in which the CAC and blank panels are installed, before improvement, the temperature of the air supplied from the CRAC is raised by 0.4–1.2 °C in the raised floor and by a further 1.3–2.4 °C in the ITE inlet port. At CRAC fan frequency of 45 Hz (G1) with BAL of 0.85, temperature of the air supplied from the CRAC rises by 3.6 °C on reaching the ITE inlet. Under any of the CRAC airflow (fan frequency) conditions, compared with the respective temperatures before the improvement, temperature inside the raised floor decreased by about 0.3 °C and ITE inlet temperature decreased by about 0.8 °C after the improvement. Regarding the air volume ratios obtained from the temperature of each part, the value after improvement was 0.02 lower than that before improvement, 0.02 for NP, 0.04–0.05 for R, and 0.04 for R. It is clear from the change of each index of the air-management metrics that the improvement of the thermal environment has the effect of improving heat-insulation performance. It is also clear that heat-insulation performance affects all three airflow paths, namely, the negative-pressure flow path, bypass flow path, and recirculation flow path.
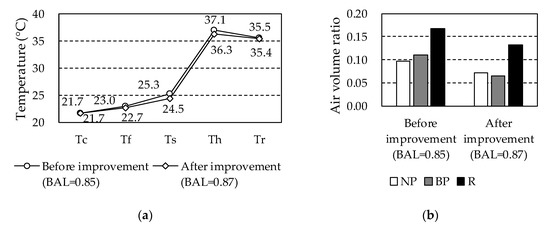
Figure 8.
Improvement effect of thermal environment at CRAC fan frequency of 45 Hz: (a) average temperature of each part and (b) air-management metrics.
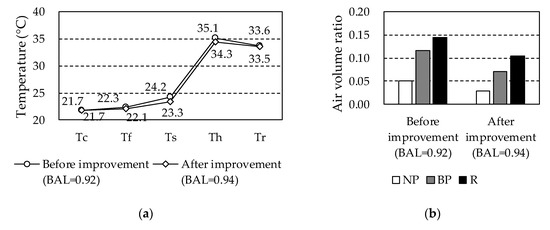
Figure 9.
Improvement effect of thermal environment at CRAC fan frequency of 54 Hz: (a) average temperature of each part and (b) air-management metrics.
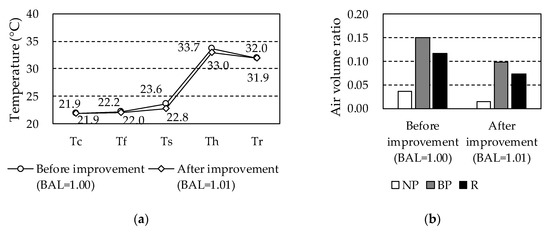
Figure 10.
Improvement effect of thermal environment at CRAC fan frequency of 63 Hz: (a) average temperature of each part and (b) air-management metrics.
The extent of the effect of heat transmission on the evaluation index based on air-volume ratio is considered hereafter. As explained in the previous section, in the proposed CFD model, heat is transferred by air flow and heat transmission. Therefore, by checking the difference between each index (i.e., NP, BP, and R) before and after the thermal-environment improvement under the same CRAC fan frequency, it can be confirmed how much the low thermal resistance of the structural components deteriorates the indexes. CRAC fan frequency of 45 Hz (G1) is described as an example hereafter. Airflow equivalent to 10% of the CRAC airflow (mc) is induced into the raised floor from the room interior as negative-pressure airflow (mn), and 2% of that value is due to heat transmission. Similarly, 11% of the raised-floor air volume (mf) returns to the CRAC without cooling the ITE as bypass air volume (mb), and 4% of that value is due to heat transmission. Recirculation-air volume (mr) (namely, volume of outlet of the ITE that returns to the ITE inlet port) accounts for 17% of the ITE air volume (ms), of which 4% is due to heat transmission. Since it is assumed that 10-mm-thick glass wool will be installed as the thermal-environment improvement measure, it is considered that the effect on the heat environment will improve if the data center is completely insulated. Originally, the CAC and blank panels are installed in an indoor environment that requires high airflow-segregation efficiency; however, as the high-density installation of ITE progresses, even higher levels of cold- and hot-air segregation are required. Improving ventilation efficiency by reducing heat transmission is one possible solution to this problem.
The possibility of energy reduction by improving heat-insulation performance is considered as follows. To make it easier to see changes in each index due to varied CRAC fan frequency, Figure 8, Figure 9 and Figure 10 are rearranged as Figure 11. BAL on the horizontal axis of Figure 11 is the ratio of CRAC air volume (mc) to ITE air volume (ms), as given by Equation (5), and BAL increases as CRAC air volume increases. As BAL increases, NP decreases, BP increases, and R decreases. It is considered that NP decreases and BP increases because the larger the BAL, the more air is supplied to the raised floor. Similarly, it is considered that R decreases as a sufficient amount of air is supplied to the cold-aisle containment (as BAL increases). In both cases, each index is lower after the improvement than that before the improvement within the range of the CRAC-airflow conditions used in this study.
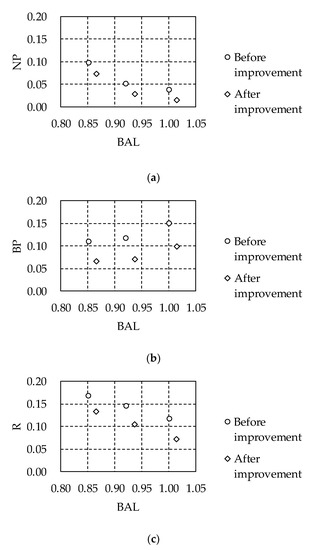
Figure 11.
Relationship between balance ratio (BAL) and each air-flow ratio: (a) balance ratio (BAL) and negative-pressure ratio (NP); (b) balance ratio (BAL) and bypass ratio (BP); and (c) balance ratio (BAL) and recirculation ratio (R).
Hereafter, the index to be improved is taken R, the target value of R is set to maximum CRAC supply-air volume, and the energy-saving effect due to the improvement of heat-insulation performance is calculated. The calculation results are listed in Table 9. The relationship between BAL and R is approximated with a linear function, and when BAL (which is equivalent to R = 0.12 (BAL = 1.00) before improvement) after the improvement is calculated, BAL was determined as 0.90. Under the assumption that ITE air volume (ms) is constant, CRAC air volume (mc) can be reduced to 90%. This effect translates into the effect of reducing power consumption. Theoretically, power consumption of the fan is proportional to the cube of the ratio of pre-change air volume and post-change air volume. Therefore, if fan air volume is reduced by 10%, power consumption of the fan is reduced by 26%. In other words, it can be said that by insulating the structural components with 10-mm-thick glass wool, it is possible to reduce power consumption of the CRAC fan by 26% and obtain a thermal environment equivalent to that corresponding to CRAC fan frequency of 63 Hz (G3). In practice, it is desirable to: (i) calculate, on a trial basis, the reduction of running cost when CRAC fan frequency is reduced and the initial cost of installing the heat-insulation material and (ii) judge whether to adopt these improvement measures on the basis of the life-cycle cost of the data-center room.
Table 9.
Trial calculation of energy-saving effect after improvement of heat-insulation performance.
5. Concluding Remarks
In this study, the aim was to improve the prediction accuracy of ITE inlet temperature in CFD simulation of a verification room simulating a raised-floor supply/transverse-return data center utilizing cold-aisle containment and blank panels. In the verification room, obstructions, gaps between components, and heat transmission of components are considered as factors that may affect the results of CFD analysis. In addition, the factors were tuned so that prediction accuracy could be maintained with the same model even if the CRAC supply-air volume was varied. To ensure the parameter tuning is efficient, the “design of experiments” (DOE) method was used. To tune the parameter-tuning factor and its level under the three conditions of CRAC supply-air volume, it is necessary to perform 2916 simulations by brute force; however, the proposed method can derive the optimum level of the tuning factor in 63 simulations. Comparing the average ITE inlet temperature of 10 racks with the experimental measurements and CFD simulation results after parameter tuning showed that the former was within ±0.2 °C under all CRAC airflow conditions. Although the factors and levels adopted depend on the target room, the proposed parameter-tuning method is considered to be versatile in terms of improving the accuracy of CFD simulations.
Moreover, the fact that the CFD model after tuning incorporates heat flow through the structural components was focused on, and improving the thermal environment was investigated. As a result of improving the insulation performance of the raised-floor fixed panels, rack cases, aisle containment, and blank panels by insulating with 10-mm-thick glass wool, average ITE inlet temperature was decreased by about 1 °C. This result was rearranged by air-management metrics, and a method of evaluating the influence of CRAC supply-air volume and thermal-insulation performance on the thermal environment was demonstrated. It was shown that improving the heat-insulation performance of the structural members makes it possible to reduce power consumption of the CRAC fan by 26%, while keeping the recirculation ratio constant. For the target thermal environment in question, it is desirable to calculate reduction of running cost by narrowing the CRAC supply-air volume and initial cost increase due to installing advanced heat insulation on a trial basis and compare them in regard to life-cycle cost.
High-density mounting of ITE is progressing, and air-segregation methods such as aisle containment and blank panels have been implemented; however, in the future, higher ventilation efficiency (cold/hot air segregation) will be required. Reduction of heat transmission by improving thermal-insulation performance is an approach for cold/hot air segregation that differs from airflow segregation because it suppresses heat transfer in the partitioned space. Improving thermal-insulation performance of structural components is likely to be one solution to the problem of high heat generation in data centers.
Author Contributions
Conceptualization, N.F.; methodology, N.F., T.M., and H.H.; software, N.F.; validation, N.F., Y.U., and T.M.; formal analysis, N.F.; investigation, N.F. and Y.U.; resources, Y.U.; data curation, N.F.; writing—original draft preparation, N.F.; writing—review and editing, Y.U., T.M., and H.H.; visualization, N.F.; supervision, H.H.; project administration, Y.U.; funding acquisition, Y.U. and H.H. All authors have read and agreed to the published version of the manuscript.
Funding
This research was funded by JSPS KAKENHI, grant number JP18H0159109.
Conflicts of Interest
The authors declare no conflict of interest.
Appendix A
Table A1.
Results of analysis based on DOE (first row).
Table A1.
Results of analysis based on DOE (first row).
| Characteristic | P1 (1-1) | P2 (1-3) | P3 (1-5) | P4 (1-9) | P5 (1-11) | ||||||||||
|---|---|---|---|---|---|---|---|---|---|---|---|---|---|---|---|
| Experimental result | 24.7 | 24.0 | 23.5 | 25.9 | 24.8 | 23.6 | 24.1 | 23.5 | 22.9 | 24.1 | 23.9 | 23.6 | 27.8 | 26.8 | 25.1 |
| Signal factor | G1 | G2 | G3 | G1 | G2 | G3 | G1 | G2 | G3 | G1 | G2 | G3 | G1 | G2 | G3 |
| analysis 01 | 25.9 | 25.1 | 24.8 | 25.3 | 24.5 | 23.9 | 25.2 | 24.2 | 23.8 | 25.7 | 25.0 | 24.6 | 25.9 | 25.4 | 25.0 |
| 02 | 25.6 | 24.9 | 24.6 | 25.2 | 24.3 | 23.7 | 24.8 | 24.1 | 23.7 | 25.4 | 24.7 | 24.3 | 25.8 | 25.0 | 24.9 |
| 03 | 25.8 | 23.6 | 22.4 | 24.8 | 23.2 | 22.4 | 24.2 | 23.0 | 22.4 | 23.8 | 22.9 | 22.5 | 23.1 | 22.5 | 22.3 |
| 04 | 25.4 | 24.8 | 24.5 | 25.1 | 24.1 | 23.7 | 24.8 | 24.1 | 23.7 | 25.4 | 24.9 | 24.4 | 25.8 | 25.3 | 24.9 |
| 05 | 26.1 | 24.9 | 24.3 | 25.3 | 24.3 | 23.4 | 25.4 | 24.0 | 23.4 | 25.8 | 24.8 | 24.3 | 26.0 | 25.2 | 24.7 |
| 06 | 26.5 | 25.2 | 24.2 | 25.8 | 24.2 | 23.3 | 25.4 | 23.8 | 23.1 | 25.1 | 24.0 | 23.4 | 24.8 | 23.9 | 23.2 |
| 07 | 25.7 | 24.9 | 24.5 | 25.2 | 24.3 | 23.5 | 25.2 | 24.1 | 23.6 | 25.9 | 24.9 | 24.4 | 26.3 | 25.4 | 24.9 |
| 08 | 25.5 | 24.4 | 24.0 | 25.0 | 23.7 | 23.0 | 24.7 | 23.5 | 22.9 | 25.4 | 24.0 | 23.4 | 25.4 | 24.1 | 23.5 |
| 09 | 26.1 | 24.7 | 23.5 | 25.5 | 23.8 | 22.8 | 25.4 | 23.9 | 23.0 | 26.6 | 25.0 | 24.1 | 27.9 | 26.2 | 25.1 |
| 10 | 26.5 | 25.4 | 24.4 | 24.9 | 23.5 | 23.1 | 23.8 | 23.2 | 23.0 | 27.9 | 25.7 | 23.2 | 27.9 | 25.8 | 24.0 |
| 11 | 27.2 | 26.7 | 25.8 | 26.3 | 24.9 | 24.4 | 25.7 | 25.0 | 24.6 | 26.9 | 25.9 | 25.8 | 27.6 | 26.8 | 26.4 |
| 12 | 28.3 | 27.0 | 26.1 | 27.0 | 25.0 | 24.2 | 26.4 | 25.0 | 24.3 | 27.9 | 26.4 | 25.9 | 28.7 | 27.4 | 27.0 |
| 13 | 27.5 | 26.2 | 25.2 | 25.9 | 24.6 | 24.1 | 25.9 | 24.7 | 24.2 | 27.2 | 25.8 | 25.0 | 27.7 | 26.6 | 25.7 |
| 14 | 27.1 | 26.4 | 25.4 | 25.4 | 24.1 | 23.5 | 24.9 | 24.0 | 23.9 | 26.6 | 24.6 | 25.2 | 27.4 | 25.0 | 25.8 |
| 15 | 28.0 | 26.9 | 25.8 | 26.7 | 24.9 | 24.1 | 26.3 | 25.0 | 24.3 | 27.9 | 26.4 | 25.6 | 28.8 | 27.5 | 26.7 |
| 16 | 25.9 | 25.1 | 24.4 | 25.1 | 24.0 | 23.4 | 25.2 | 24.0 | 23.4 | 27.2 | 25.1 | 24.1 | 27.6 | 26.3 | 24.9 |
| 17 | 27.6 | 26.5 | 25.2 | 26.1 | 24.6 | 23.9 | 26.2 | 24.7 | 24.1 | 27.9 | 26.1 | 25.1 | 28.1 | 26.7 | 25.8 |
| 18 | 26.7 | 26.4 | 25.0 | 26.4 | 24.6 | 23.9 | 26.1 | 24.9 | 24.2 | 28.7 | 27.0 | 25.9 | 29.7 | 27.9 | 26.6 |
Table A2.
Results of analysis based on DOE (second row).
Table A2.
Results of analysis based on DOE (second row).
| Characteristic | P6 (2-1) | P7 (2-3) | P8 (2-5) | P9 (2-9) | P10 (2-11) | ||||||||||
|---|---|---|---|---|---|---|---|---|---|---|---|---|---|---|---|
| Experimental result | 25.8 | 24.6 | 23.9 | 25.6 | 24.3 | 23.4 | 25.2 | 24.2 | 23.5 | 25.1 | 24.4 | 23.9 | 24.2 | 23.5 | 23.2 |
| Signal factor | G1 | G2 | G3 | G1 | G2 | G3 | G1 | G2 | G3 | G1 | G2 | G3 | G1 | G2 | G3 |
| Analysis 01 | 26.0 | 25.0 | 24.6 | 25.7 | 24.8 | 24.4 | 25.9 | 24.9 | 24.5 | 26.7 | 25.6 | 24.9 | 25.9 | 25.2 | 24.8 |
| 02 | 26.4 | 25.0 | 24.4 | 26.0 | 24.7 | 24.2 | 26.0 | 24.8 | 24.4 | 26.7 | 25.6 | 24.8 | 25.6 | 24.9 | 24.6 |
| 03 | 26.7 | 24.0 | 22.5 | 26.6 | 24.2 | 22.5 | 26.3 | 24.0 | 22.5 | 24.3 | 22.9 | 22.6 | 22.7 | 22.3 | 22.3 |
| 04 | 26.1 | 24.8 | 24.4 | 25.8 | 24.6 | 24.1 | 25.9 | 24.9 | 24.4 | 26.7 | 25.7 | 24.8 | 25.6 | 25.0 | 24.6 |
| 05 | 26.0 | 24.7 | 24.0 | 25.8 | 24.5 | 23.7 | 26.1 | 24.8 | 24.1 | 26.6 | 25.4 | 24.7 | 25.4 | 24.8 | 24.3 |
| 06 | 26.4 | 24.9 | 24.0 | 26.1 | 24.2 | 23.3 | 25.6 | 23.9 | 23.2 | 25.2 | 24.0 | 23.4 | 24.5 | 23.7 | 23.2 |
| 07 | 25.7 | 24.8 | 24.2 | 25.6 | 24.5 | 23.9 | 25.8 | 24.8 | 24.3 | 26.6 | 25.4 | 24.8 | 26.0 | 25.1 | 24.6 |
| 08 | 25.3 | 24.2 | 23.8 | 25.1 | 23.7 | 23.0 | 24.8 | 23.7 | 23.1 | 25.8 | 24.2 | 23.5 | 24.8 | 23.9 | 23.3 |
| 09 | 25.5 | 24.2 | 23.2 | 25.2 | 23.8 | 23.0 | 25.7 | 24.2 | 23.8 | 28.0 | 25.9 | 24.8 | 27.2 | 25.5 | 24.5 |
| 10 | 27.9 | 25.7 | 24.3 | 26.8 | 24.8 | 23.3 | 26.1 | 24.5 | 23.3 | 26.8 | 24.6 | 23.5 | 27.9 | 25.7 | 24.3 |
| 11 | 27.3 | 26.5 | 25.8 | 26.5 | 25.1 | 24.5 | 26.2 | 25.2 | 24.8 | 27.9 | 27.0 | 26.8 | 27.8 | 27.0 | 26.4 |
| 12 | 28.3 | 26.8 | 26.1 | 27.3 | 25.2 | 24.3 | 26.9 | 25.2 | 24.6 | 28.9 | 27.4 | 27.3 | 28.8 | 27.5 | 27.1 |
| 13 | 27.2 | 26.2 | 25.2 | 26.5 | 24.9 | 24.1 | 26.5 | 25.1 | 24.3 | 28.2 | 26.9 | 25.7 | 27.6 | 26.6 | 25.7 |
| 14 | 27.0 | 26.3 | 25.2 | 25.8 | 24.3 | 23.6 | 25.3 | 24.2 | 23.8 | 26.0 | 24.3 | 25.1 | 27.3 | 24.9 | 25.9 |
| 15 | 28.0 | 26.6 | 25.8 | 27.0 | 25.2 | 24.2 | 26.7 | 25.2 | 24.5 | 28.9 | 27.5 | 26.7 | 29.0 | 27.6 | 26.9 |
| 16 | 25.8 | 24.9 | 24.3 | 25.0 | 23.9 | 23.4 | 25.1 | 23.9 | 23.4 | 26.7 | 24.9 | 24.0 | 27.4 | 25.8 | 24.8 |
| 17 | 27.5 | 26.4 | 25.3 | 26.0 | 24.6 | 23.9 | 26.2 | 24.7 | 24.0 | 27.9 | 26.2 | 25.2 | 28.0 | 26.5 | 25.7 |
| 18 | 27.0 | 26.5 | 25.2 | 26.3 | 24.6 | 23.9 | 26.1 | 24.8 | 24.1 | 28.5 | 26.8 | 25.9 | 29.5 | 27.9 | 26.5 |
References
- Masanet, E.; Shehabi, A.; Lei, N.; Smith, S.; Koomey, J. Recalibrating global data center energy-use estimates. Science 2020, 367, 984–986. [Google Scholar] [CrossRef]
- ASHRAE TC9.9. Thermal Guidelines for Data Processing Environments, 4th ed.; ASHRAE: Atlanta, GA, USA, 2015; ISBN 978-1-939200-03-7. [Google Scholar]
- Shehabi, A.; Smith, S.; Sartor, D.; Brown, R.; Herrlin, M.; Koomey, J.; Masanet, E.; Horner, N.; Azevedo, I.; Lintner, W. United States Data Center Energy Usage Report; Lawrence Berkeley National Laboratory: Berkeley, CA, USA, 2016.
- ASHRAE TC9.9. Best Practices for Datacom Facility Energy Efficiency; ASHRAE: Atlanta, GA, USA, 2008; ISBN 978-1-933742-27-4. [Google Scholar]
- Nakao, M.; Hayama, H.; Nishioka, M. Which cooling air supply system is better for a high heat density room: Underfloor or overhead? In Proceedings of the 13th International Telecommunications Energy Conference (INTELEC’91), Kyoto, Japan, 5–8 November 1991; pp. 393–400. [Google Scholar]
- Rambo, J.; Nelson, G.; Joshi, Y. Airflow distribution through perforated tiles in close proximity to computer room air-conditioning units. ASHRAE Trans. 2007, 113, 124–135. [Google Scholar]
- Shrivastava, S.; Sammakia, B.; Schmidt, R.; Iyengar, M. Comparative analysis of different data center airflow management configurations. In Proceedings of the ASME 2005 Pacific Rim Technical Conference and Exhibition on Integration and Packaging of MEMS, NEMS, and Electronic Systems Collocated with the ASME 2005 Heat Transfer Summer Conference (IPACK2005), San Francisco, CA, USA, 17–22 July 2005; pp. 329–336. [Google Scholar]
- Shrivastava, S.; Sammakia, B.; Iyengar, M.; Schmidt, R. Significance level of factors for different airflow management configurations of data centers. In Proceedings of the ASME 2005 International Mechanical Engineering Congress and Exposition (IMECE2005), Orlando, FL, USA, 5–11 November 2005; pp. 99–106. [Google Scholar]
- Sorell, V.; Gandhi, V.; Abougabal, Y.; Watve, A.; Khankari, K. An analysis of the effects of ceiling height on air distribution in data centers. ASHRAE Trans. 2006, 112, 623–631. [Google Scholar]
- Patankar, S.V.; Karki, K.C. Distribution of cooling airflow in a raised-floor data center. ASHRAE Trans. 2004, 110, 629–634. [Google Scholar]
- Patankar, S.V. Airflow and cooling in a data center. J. Heat Transf. 2010, 132, 073001. [Google Scholar] [CrossRef]
- Wibron, E.; Ljung, A.-L.; Lundström, T.S. Comparing performance metrics of partial aisle containments in hard floor and raised floor data centers using CFD. Energies 2019, 12, 1473. [Google Scholar] [CrossRef]
- Wang, F.; Huang, Y.; Prasetyo, B.Y. Energy-efficient improvement approaches through numerical simulation and field measurement for a data center. Energies 2019, 12, 2757. [Google Scholar] [CrossRef]
- Ni, J.; Jin, B.; Zhang, B.; Wang, X. Simulation of thermal distribution and airflow for efficient energy consumption in a small data centers. Sustainability 2017, 9, 664. [Google Scholar] [CrossRef]
- Yuan, X.; Wang, Y.; Liu, J.; Xu, X.; Yuan, X. Experimental and numerical study of airflow distribution optimisation in high-density data centre with flexible baffles. Build. Environ. 2018, 140, 128–139. [Google Scholar]
- VanGilder, J.W.; Zhang, X.; Sheffer, Z.R.; Healey, C.M. Potential flow model for predicting perforated tile airflow in data centers. ASHRAE Trans. 2011, 117, 771–786. [Google Scholar]
- Joshi, Y.; Kumar, P. (Eds.) Efficient Thermal Management of Data Centers; Springer Science + Business Media: New York, NY, USA, 2012; ISBN 978-1-4419-7123-4. [Google Scholar]
- Karki, K.C.; Radmehr, A.; Patankar, S.V. Prediction of distributed air leakage in raised-floor data centers. ASHRAE Trans. 2007, 113, 219–226. [Google Scholar]
- Taguchi, G.; Yokoyama, Y. Design of Experiments, Revised ed.; Japanese Standards Association: Tokyo, Japan, 1979; ISBN 978-4-542-80138-7. (In Japanese) [Google Scholar]
- Design of Experiments in Protein Production and Purification, Handbook. Available online: https://cdn.gelifesciences.com/dmm3bwsv3/AssetStream.aspx?mediaformatid=10061&destinationid=10016&assetid=17616 (accessed on 26 June 2020).
- Nishina, K.; Yoshino, M.; Yamada, S. Statistical experimental design in simulation—More efficient parameter tuning. In Proceedings of the 1st Conference of Transdisciplinary Federation of Science and Technology, Nagano, Japan, 25–26 November 2005; pp. 99–104. (In Japanese). [Google Scholar]
- Fuji Xerox Co., Ltd. QC Study Group. Answers to Questions about Design of Experiment Methods; Japanese Standards Association: Tokyo, Japan, 1989; ISBN 4-542-50322-4. (In Japanese) [Google Scholar]
- FlowDesigner2020 Reference Guide; Advanced Knowledge Laboratory: Tokyo, Japan, 2020. (In Japanese)
- VanGilder, J.W.; Zhang, X. Coarse-Grid CFD: The effect of grid size on data center modeling. ASHRAE Trans. 2008, 114, 166–181. [Google Scholar]
- Tozer, R.; Kurkjian, C.; Salim, M. Air management metrics in data centers. ASHRAE Trans. 2009, 115, 63–70. [Google Scholar]
- Sharma, P.K.; Bash, C.E.; Patel, C.D. Dimensionless parameters for evaluation of thermal design and performance of large-scale data centers. In Proceedings of the 8th AIAA/ASME Joint Thermophysics and Heat Transfer Conference, St. Louis, MO, USA, 24–26 June 2002; p. 3091. [Google Scholar]
- Tozer, R.; Whitehead, B.; Flucker, S. Data center air segregation efficiency. ASHRAE Trans. 2015, 121, 454–461. [Google Scholar]


© 2020 by the authors. Licensee MDPI, Basel, Switzerland. This article is an open access article distributed under the terms and conditions of the Creative Commons Attribution (CC BY) license (http://creativecommons.org/licenses/by/4.0/).