Abstract
The United States Air Force has implemented a dispersed air base strategy to enhance mission effectiveness for near-peer conflicts. Asset dispersal places many smaller bases across a wide geographic area, which increases resupply requirements and logistical complexity. Hybrid energy systems reduce resupply requirements through sustainable, off-grid energy production. This paper presents a novel hybrid energy renewable delivery system (HERDS) model capable of (1) selecting the optimal hybrid energy system design that meets demand at the lowest net present cost and (2) optimizing the delivery of the selected system using existing Air Force cargo aircraft. The novelty of the model’s capabilities is displayed using Clark Air Base, Philippines as a case study. The HERDS model selected an optimal configuration consisting of a 676-kW photovoltaic array, an 1846-kWh battery system, and a 200-kW generator. This hybrid energy system predicts a 54% reduction in cost and an 88% reduction in fuel usage, as compared to the baseline Air Force system. The HERDS model is expected to support planners in their ongoing efforts to construct cost-effective sites that minimize the transport and logistic requirements associated with remote installations. Additionally, the results of this paper may be appropriate for broader civilian applications.
1. Introduction
After nearly two decades of counterterrorism and counterinsurgency, the Unites States (US) Department of Defense (DoD) 2018 National Defense Strategy (NDS) has shifted its primary focus to near-peer conflict [1]. In an armed conflict with near-peer adversaries, air superiority will be contested; therefore, forces may need to be on constant alert within the contested airspace. To mitigate risk in a near-peer conflict, the RAND Corporation proposed that the Air Force employ a dispersed air base concept that involves conducting operations from many smaller air bases [2]. This strategy will allow the Air Force to set up and operate in one location and rapidly move operations before the base is targeted for attack. However, conducting operations from a large number of bases inherently increases the fuel, munitions, food, and water resupply logistical complexity and its exposure to disruptions by adversaries [3].
The RAND report focused on the possibility of a conflict in the area surrounding the South China Sea, and it identified that a mixture of different types of bases is required to achieve military objectives in a contested battlespace—“stay-and-fight” may have an indefinite duration, “drop-in” may last days to weeks, and “fighter forward arming and refueling point (FARP)” may be established for less than a day. Stay-and-fight bases have a larger footprint, operate on the edge of the contested battlespace, and have more permanent infrastructure, including grid-tied power and large-scale fuel storage. One the other end of the spectrum, fighter FARP bases are conceptualized as austere airfields, where everything needed to conduct operations would be flown in on cargo aircraft and only used for short periods. This paper focuses on drop-in bases, which are similar to the forward operating post concept the US employed in Afghanistan and Iraq. These bases will primarily use expeditionary equipment and fabric shelter facilities.
Since the drop-in bases would not be connected to any source of local prime power, all electricity would be produced from liquid fuel generators, which have a demand of approximately 2270 L per day [4,5]. Alternative methods of energy generation would reduce the high logistics requirement for fuel and, also, lower the site’s reliance on fuel and resupply, which, in turn, increases its energy resiliency.
Investing in energy systems such as solar photovoltaics and wind turbines allows for alternative methods of energy production. These systems can be combined with energy-storage platforms and existing generator capabilities to provide energy resilience and sustain operations, thereby reducing fuel resupply frequency. Individual energy system components can be integrated into a hybrid energy system (HES), which is defined as any system that combines energy-generation technologies to create a more robust power infrastructure. The majority of HES include solar photovoltaic panels, which are connected to a battery backup system that supplements a diesel generator [6]. These systems can intelligently supply power from different sources, depending on the current demand and external conditions. Having a diversified portfolio of energy-generation sources allows for the limited availability of fuel to be prioritized for flight operations.
HES are inherently resilient, and resilient infrastructure integration is a focus area within the 2018 NDS [1]. Studies have shown how HES can be used to reduce isolated communities’ reliance on fossil fuel power generation, which increases their resilience to logistics disruptions [6,7]. Energy storage is a vital contributor to resilience; it allows for a generator to operate at peak efficiency, and it provides the user the ability to turn off the generator, either for silent operations or regular maintenance [8]. To illustrate this concept, Gildea et al. (2011) demonstrated an 80% fuel savings using an 80-kWh battery connected to a 15-kW generator [9]. Solar photovoltaics are another critical component of a HES. Connecting a solar array to an energy-storage system allows excess energy produced during peak hours to be captured and discharged during periods of darkness, further reducing the fuel consumed by the generator [10]. Several military studies have also demonstrated the feasibility of connecting photovoltaic (PV) panels to soft-walled shelters to reduce the overall power demand [4,11,12,13,14,15]. Additionally, tents with integrated PV cells have proven effective in meeting the electricity needs of a displaced refugee population [16,17].
Wind turbines are another potential HES component—as wind can be prevalent all hours of the day, it is a well-suited complement to photovoltaics. Several studies have also analyzed case studies using the combination of wind, PV, and diesel generation to show the benefits of integration [18,19]. There are a few drawbacks to these systems, however. First, these systems are complex and may be challenging to operate in contingency environments. Since wind turbines involve moving parts, these systems require more maintenance and repairs than passive solar arrays. Second, as mobility and ease of shipping are essential in these circumstances, few locations in the world might justify the weight and cost of such a system [8].
A number of research studies have presented HES optimization models for remote, isolated, or stand-alone locations. These models primarily focus on the economic tradeoff between the costs associated with purchasing a HES and the energy savings that are received from the system [20,21,22]. A common theme among the articles is the specificity attached to a case study and how each system had to be tailored specifically to the location being analyzed, all of which resulted in some form of economic payback or increase in power quality as a result of incorporating the proposed system. In addition to technoeconomic analyses, studies have considered other objectives, including weather-based reliability [23], social criteria [24], and energy-storage lifespan [25]. Using the commercially available Hybrid Optimization Model for Multiple Energy Resources (HOMER) software to optimize the microgrid system is a common method, because it greatly simplifies the process of developing a system specific to the identified region [26,27,28]. By comparing the economic and environmental benefits of different types of HES, HOMER is able to rapidly optimize an HES using the selected location’s climate data and load profile.
Despite the significant contributions of the aforementioned research studies and demonstrations, there was no reported research that focused on: (1) computing the energy demand of a fabric shelter camp based on local weather data, (2) minimizing the transportation logistics involved in airlifting an optimized HES, and (3) generating optimal tradeoffs between fuel consumption savings of a HES with the fuel cost incurred during transportation.
This paper seeks to address these limitations by computing optimal system configurations for different operational locations using the newly developed hybrid energy renewable delivery system (HERDS) model. HERDS is a MATLAB-based model that incorporates outputs from HOMER and an aircraft selection model (ASM) [29,30]. The ASM is used to optimize the use of mobility aircraft, such as the C-130J-30, C-17A, and the C-5A, to transport expeditionary equipment from prepositioned theater storage sites to drop locations [2,30]. The result is a model that enables the identification of the most cost-effective HES for a fabric shelter base at any geographic location.
The remainder of this paper is structured as follows: Section 2 defines the parameters used in the HOMER and ASM models and details how they integrate with the overall cost model, while Section 3 demonstrates the unique capabilities of the HERDS model to minimize the transportation and operational cost of the HES by analyzing a case study set in the Philippines. Finally, Section 4 provides a summary of the study and concluding thoughts.
2. Materials and Methods
The hybrid energy renewable delivery system (HERDS) model was constructed to optimize a HES system to increase the energy resiliency of a base and to reduce the amount of fuel it consumes by generating power. The HERDS model is formulated in the three distinct stages shown in Figure 1: the data inputs needed to run the model, the calculations performed from the input parameters, and the resulting output values and configurations. In the input stage, the site location and number of personnel stationed at the base are needed, in addition to the physical, performance, and cost attributes of the different components in the HES. During the calculations stage, an electric load profile is generated and used to compute the optimal HES combinations that can then be airlifted with a select combination of aircraft. The final outputs of the model are the configurations of the HES, the airframes needed for system transportation, and a total cost in present dollar terms that can be used to compare alternative courses of action.
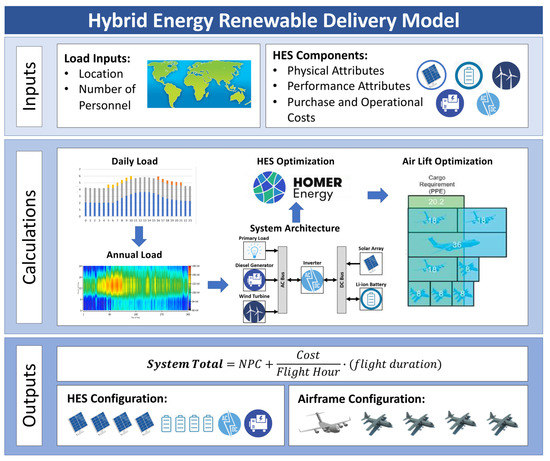
Figure 1.
An overview of the input parameters, calculations performed, and outputs of the hybrid energy renewable delivery system (HERDS) model [31]. HES: hybrid energy system and NPC: net present cost.
Utilizing the HOMER software simplifies this process. Once a location is selected, the software downloads the appropriate solar and wind resource data from the National Renewable Energy Lab (NREL) database, as well as the National Aeronautics and Space Administration (NASA) Surface Meteorology and Solar Energy database [29]. This data is then used to predict the amount of energy produced and stored by the microgrid at a specific location. The different HES components, such as solar panels, wind turbines, energy storage, and inverters, can be added and edited individually to replicate a real-world system. Figure 2 displays a generic HES architecture that can be used within HOMER. The software also allows the user to specify the economical parameters of the model as a whole and for each HES component. This architecture is evaluated within HERDS and, also, two variations of the architecture—either without the solar array or without the wind turbine.
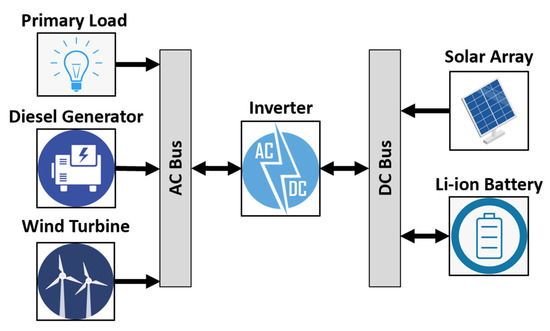
Figure 2.
Architecture of a generic HES.
The electrical load requirements must be known to model a site and generate an optimally sized HES. The primary facility type used in drop-in bases are fabric shelters. The Alaska Small Shelter System, shown in Figure 3, is representative of this type of facility. It consists of hollow aluminum segments held together by rack and pin placed directly on the ground; both the floor and exterior shell consist of a fabric liner. The exterior shell material, measured as 1.6-mm-thick, is the primary barrier between the exterior environment and the air conditioned space within the shelter [32].
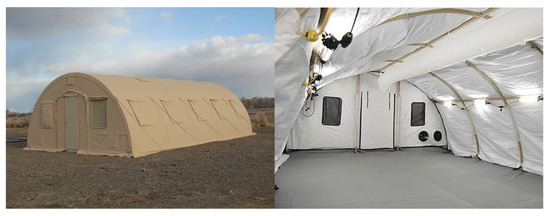
Figure 3.
Alaska Small Shelter System exterior and interior. Representative of the fabric shelters being used in the HERDS model [33].
One load that all of these shelters share is the power required to maintain the shelter at a stable temperature—typically, 21 °C. An environmental control unit (ECU) is attached to every fabric shelter in the base. Cumulatively, shelter heating and cooling demands are responsible for the majority of the encampment’s energy consumption [32]. Data from metering demonstrations at test sites have revealed a relationship between the external ambient temperature and the load required to heat or cool the shelter [4]. The fabric shelter differs significantly from permanent construction envelopes, where internal heat gains are much more notable. The tent’s envelope is drastically thinner, resulting in conduction and convection being the driving heat transfer modes. This relationship can then be applied to heat transfer equations to determine the power needed for the ECU to maintain the desired temperature within a tent, as shown in Equation (1) [34,35].
Equation (1). ECU power draw equation. η represents the energy efficiency ratio of the ECU (modeled as 1.69 [36]; is the exposed surface area of the tent; is the outside air temperature; is the inside air temperature; and U is the overall coefficient of heat transmission, including the air films, tent material, and insulation. Added as a base load requirement is 2 kW to run the ventilation fan. The 3 is a constant to account for additional heat transfer through radiation and air infiltration [4]. One thousand is used to convert the units from Watts to kW.
Equation (1) is used to account for the thermal resistive effects of the different layers between the exterior and the interior environment of the shelter. The U-value (Equation (2)) sums the resistive element between the ambient temperature (To) and the interior temperature (Ti) to account for the changes in the heat flow across the different materials, accounting for their thickness and thermally conductive properties. Figure 4 displays the relationship between the interior and exterior temperatures concerning heat flow across the various material layers of the tent.
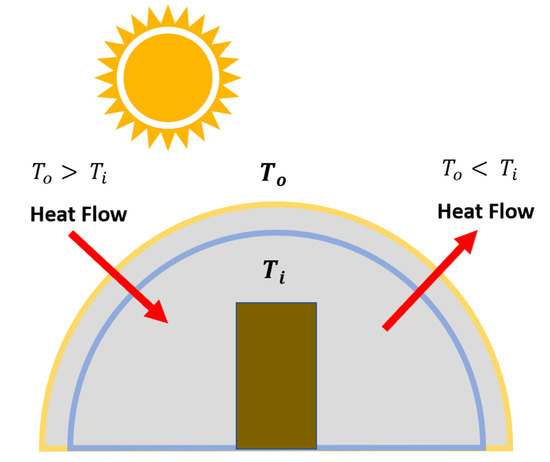
Figure 4.
Visualization of the resistance to heat flow. To and Ti represent the exterior ambient temperature and interior temperature, respectively.
Equation (2). Cumulative heat transmission coefficient, where xi is the thickness of the physical layer, and ki is the thermal conductance of the material.
In addition to the electrical load from the ECU, the tents draw power from the system for other requirements. Some of these loads are broken down by the tent function, either a billeting tent or a mission-oriented shelter. Billeting tents are where the occupants rest, and mission-oriented shelters house the array of sensors and communication equipment used by the base and are manned 24 h per day. Metering reports from Afghanistan show that other loads occur at regular intervals during the day, such as when the lights come on in a billeting tent or when a new shift starts in the mission-oriented tents, and make up approximately 0.2% of the overall camp load [37]. The combination of all the loading factors is listed in Table 1.

Table 1.
Typical fabric shelter power load parameters. ECU: environmental control unit.
Before HES-sizing can occur, HOMER requires the user to either select from a set of generic components or input the system performance data, as well as the purchase and operational costs associated with the equipment. After the microgrid architecture has been established and the annual loading requirement is defined, the software then runs simulations for every combination of components (diesel generator only, diesel generator and a battery system, PV and a battery system, etc.) and computes the optimized system for each combination using the net present cost (NPC) with an inflation rate of 2.00%. The NPC considers the equipment purchase cost, the costs for component replacements, the system maintenance cost, and generator fuel consumption cost. Costs other than the initial cost are converted to a present value, which allows for projects of different sizes, lifecycles, and geographic locations to be compared.
HOMER is not able to incorporate transportation costs into its optimization calculations. To account for these costs, the optimal HES is converted into pallet position equivalents. Using the aircraft selection model, the cheapest transportation option is selected, and a total airlift cost is calculated based on the flight time between the staged material’s location and the drop-in base site [30].
Calculating pallet position equivalents is dependent on the type of resource required. Using the Air Force standard 463-L pallet constraints, the resource can be divided up either by weight or volume. The maximum weight for one pallet position is 4535 kg (10,000 lbs.), and the maximum volume for one pallet is limited to 2.74-m-high by 2.24-m-long by 2.44-m-tall [38]. The best combination of aircraft needed to airlift the HES to the base is determined using the resulting pallet equivalents. The most common types of aircraft used for airlift operations are the C-130J-30, C-17A, and the C-5A, and their basic specifications are listed in Table 2 [30].
Table 2.
US Air Force cargo aircraft specifications [39].
Using the aircraft listed in Table 2, the ASM then determines the number and type of aircraft required to airlift the system. To do this, the model assumes that all aircraft are equally available for transport. First, it calculates all possible combinations of aircraft that can transport the palletized HES by weight and compares them against each aircraft’s maximum payload specifications. The model then compares the cargo requirement against the amount of pallet positions that are available within each of the proposed aircraft to determine each applicable airlift combination. Using each possible airlift combination, the model calculates the cumulative cost per flight hour. This cost is primarily derived from the fuel usage rate of each aircraft, as well as the total ownership costs, which include the cost of purchase, maintenance, and repairs for the aircraft [30]. This cost per hour is used to determine the least expensive option for transporting the HES to its destination. The total flight cost, as a function of the total flight time and cost per hour, is then added (without discounting) to the net present cost of the HES.
3. Results
To demonstrate the unique capabilities of the HERDS model, a case study was analyzed utilizing a drop-in base with 300 assigned personnel at Clark Air Base, Philippines. This size base was chosen because the personnel there will be using expeditionary equipment and will likely utilize fabric shelters [2]. Given the camp population and facility requirements, access to prepositioned fuel sources is unlikely, and leadership will have to prioritize the fuel they have available to primarily support flight line operations. These traits make a drop-in base of this size an ideal situation to integrate a HES.
Several assumptions are made to simulate the battlefield circumstances accurately. First, all required material for a HES is prepositioned at three nearby staging countries with stay-and-fight-sized bases: Japan, Guam, or Australia. Next, it is assumed that all required austere location base equipment (tents, generators, electrical equipment, etc.) are already in place and need no further material from additional airlifts. To simulate the existing power grid, a 200-kW generator was added to the model to generate any power that could not be met with PV cells or wind turbines. Since the generator capability is already assumed to be in place, the smallest allowable purchase cost was selected—$0.01/kW. The fuel price was set at $2.00 per liter, which includes the cost of the fuel and an estimate of transportation costs to the site.
Additionally, all HES equipment is assumed to be purchased without a loan. In order to represent this within HOMER’s NPC calculations, a discount rate of 0.01% was used. Finally, the HES equipment, once transported to Clark Air Base, will continue to be utilized for the duration of operations [2]. A project lifespan of 15 years was used to model the utilization of the components until failure.
Time-series data for the ambient temperature in the area was collected from NASA’s global weather data in one-hour intervals and used to generate the initial electric load of the shelters [40,41]. This temperature data is applied to Equation (1) to generate the load of the ECU connected to the tent. For this case study, the modeled shelter uses a 2.54-cm Thinsulate layer of insulation, which has an individual U-value of 1.2 and a cumulative heat transmission coefficient of 0.9 The calculated ECU load is then added to the other loads listed in Table 1 to generate the estimated daily load profiles for fabric shelters at Clark Air Base, Philippines. Figure 5 displays the resulting loads for one day for both a billeting and a mission tent.
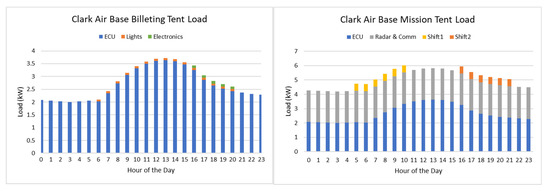
Figure 5.
Individual billeting (left) and mission tent (right) power loads. On the right chart, Shift 1 and Shift 2 show the estimated power loads due to mission-essential functions. ECU: environmental control unit.
Single shelter loads were then scaled to reflect the size of a drop-in base. The 300 personnel needed to operate the base were divided among 25 billeting tents and five mission tents [42]. The aggregate daily loads were translated to annual loads using HOMER, as shown in Figure 6. Next, the estimated annual load for the base was used to compute the HES optimal design points.
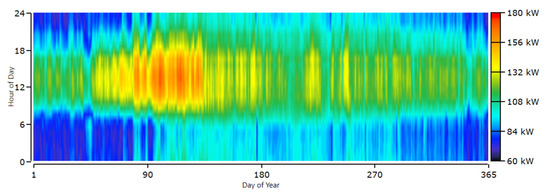
Figure 6.
Detailed annual electrical load profile for a site near Clark Air Base, Philippines.
For this case study, specific components were chosen due to their market availability, performance specifications, and ability to be transported in pallets aboard aircrafts. The PV panels being modeled in this study are SunPower E20 [43]. They have a rated capacity of 327 W and an efficiency of 20.4%, which is 3–5% more efficient than most commercially available panels [44]. Panel efficiency was a prime consideration for the case study in order to minimize the area required for the array. Table 3 lists additional manufacturer specifications for the solar panel [43,45,46].
Table 3.
HES (hybrid energy system) model component specifications and HOMER (Hybrid Optimization Model for Multiple Energy Resources) system inputs [43,45,46].
Wind turbines used in the simulation are representative of the Kingspan KW6 [45], which is rated at 6 kW, has a 15-m-tall tower, and a 5.6-m rotor diameter. Its size makes it ideal for accessing the wind above the structures of the camp, while still being small enough not to interfere with air operations [26]. The turbine’s cost data are listed in Table 3.
The energy-storage optimization process was calculated within HOMER using 1-kWh intervals in the standard Li-ion battery. This interval enabled a high level of precision in calculating the needed energy storage. The resulting energy-storage requirement is then converted to an integer number of the 210-kWh Tesla power bank system [46] in order to model the airlift requirements. A summary of the component parameters is presented in Table 3.
Using the components listed in Table 3, HOMER generated 5060 different systems. Each HES listed in Table 4 is the system with the lowest NPC over the 15-year lifespan for each unique architecture.
Table 4.
Resulting HOMER optimal combinations of components. PV: photovoltaic and NPC: net present cost.
HES 1 and HES 2 resulted in similar-sized arrays, energy storage, and NPC. The main difference in the two systems is that HES 1 only has a combination of solar PV and battery backup, along with a generator, while HES 2 adds a single wind turbine. The addition of a wind turbine caused the NPC to increase slightly for HES 2 and resulted in using 1600-L more fuel per year. Next, the transportation costs of both HES combinations were calculated.
The following criteria were used to divide the HES into pallet equivalents. Photovoltaic panel pallets will be governed by volume due to individual panel weights of 18.6 kg [43]. Racking systems, similar to Sollega solar buckets, were included [47], as well as individual microinverters, and all needed connection equipment. Each photovoltaic panel pallet had a rating of 40 kW.
The Kingspan KW6′s 15-m tower [45] can be divided into different sections to meet the dimensional requirements of a pallet and later bolted together on-site. Due to weight requirements, one entire system was split between two aircraft pallets. One pallet contained the base and tower sections, while the other pallet contained the wind turbine and blades. Altogether, the pallet combination had a rated capacity of 6 kW [45].
Energy-storage systems are generally heavier than most other HES components. Systems such as the Tesla Powerpack can store up to 210 kWh and weigh 1622 kg; thus, only two battery banks can be transported per pallet [46]. Table 5 displays the details and contents of each pallet type.
Table 5.
HES component pallet divisions for airlift.
The resulting pallets were then divided up among the different airframes listed in Table 2. The ASM was employed by using the volume (pallet positions) and weight (kg) of all cargo aircraft, then creating all possible combinations of smaller airframes and checking for the lowest cost per flight hour. Table 6 displays all combinations of aircraft capable of transporting the HES and their cost per flight hour. In the table below, HES 1 consists of 22 pallets and 57,352 kg, while HES 2 consists of 24 pallets and 64,610 kg. Each row in Table 6 is a different combination of aircraft sorties that can transport either system.
Table 6.
All possible airlift combinations for HES 1 and 2 [39].
The optimal aircraft combinations for HES 1 and 2 differed primarily due to HES 2 including a 7250-kg wind turbine. The wind turbine caused the needed pallets to exceed the maximum payload of three C-130J-30s by 4900 kg. Without the turbine, HES 1 was able to fit within three C-130J-30s and result in a lower cost per flight hour.
As stated in the RAND report, all the material needed to support these bases is assumed to be prepositioned in the nearby countries of Japan, Guam, and Australia. Figure 7 shows each location in relation to Clark Air Base and the estimated flight duration between each location.
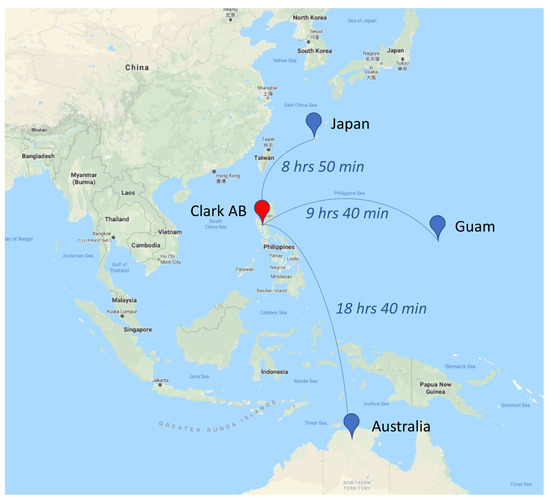
Figure 7.
Estimated flight duration to Clark Air Base from three possible staging areas around the South China Sea [48].
As shown in Figure 7, the closest theoretical staging point for Clark Air Base is in Japan. The total estimated flight duration of eight hours and fifty minutes was used to approximate the total transportation cost of airlifting the material to the drop-in base. Table 7 shows the final calculated costs of operating and transporting the HES.
Table 7.
The purchase and airlift total cost of HES 1 and 2 to Clark Air Base.
Including transportation costs, HES 1 and 2 could avoid $4.7 or $4.6 million of system lifecycle costs over a 15-year lifespan, respectively. When compared to the generator-only solution, HES 1 saves 54.4% in cost and reduces the fuel consumption by 88%. For reference, the generator-only solution (HES 5, Table 4) possessed an NPC of $9.8 million and used 269,477 L of fuel per year.
To account for future climate uncertainty, a sensitivity analysis was conducted to show HES designs and costs using climate-informed loading extremes. This was accomplished by applying the maximum and minimum hourly electrical loads imposed on the system and projecting those loads across the entire day. The resulting systems would identify the possible sizes and cost variations of future systems. The annual load profiles for each case are shown in Figure 8. The maximum electrical load profile had an average of 3148 kWh/day, which is 21% higher than the actual annual load profile from Figure 6. The minimum profile resulted in 2104 kWh/day averaged across the year, which is 19% lower than actual data. The resulting systems size and cost are displayed in Table 8.
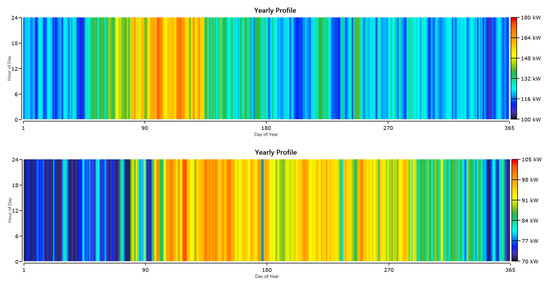
Figure 8.
Maximal (top) and minimal (bottom) annual electric load profiles.
Table 8.
Sensitivity analysis of climate loading extremes, including percent difference (Δ) from optimal HES
The sensitivity analysis demonstrates that the system size and cost are closely related to the average daily load. Both the size of the PV array and the NPC were within three percentage points when compared to the change in average kWh produced per day. At the extremes of the sensitivity range, only small total annual load deviations were observed in comparison to the base case. From a system design perspective, the small deviations generated battery size changes that corresponded with the load increases or decreases. These changes are a result of the system meeting the peak level power throughout the evening hours when supply cannot be supplemented with solar energy. The sensitivity analysis illustrates that a HES can be scaled proportionally to account for anticipated changes in the climate over the duration of a project.
An additional sensitivity analysis was performed for fuel price and base duration to explore the model variability. The base duration is referred to as the project lifecycle in this section. Fuel price was hypothesized to be important to the HES optimization model, and the fuel price was varied from $1–10/L to determine if the optimal solution favored an increased reliance on renewable energy components. As shown in Figure 9, the optimal HES system size increased with the fuel costs; additional fuel savings made it cost-effective to have a larger HES. Additionally, the project lifecycle was varied from one to five years to test the solution sensitivity. Figure 9 also shows the size of the photovoltaic (PV) array and the energy storage (ES) component for the optimal system at each interval in the sensitivity analysis.
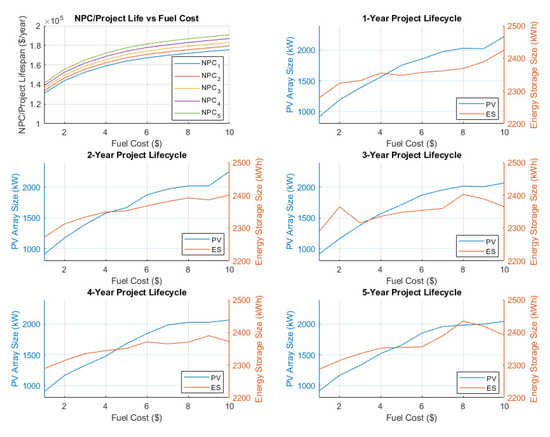
Figure 9.
Sensitivity analysis of the HES optimization. The top-left chart shows the net present cost sensitivity for one-year (NPC1) through a five-year (NPC5) project life. The remaining charts show the dependence of the optimal photovoltaic (PV) array size and energy storage (ES) size for fuel prices varied between $1–10/L and project lifecycles varied from 1–5 years.
The results of the analysis showed an increasingly linear relationship over time with an increasing fuel price to an increase in size and cost of the HES. This near-linear relationship between the NPC and lifecycle time can be demonstrated by the top-left graph in Figure 9. Each system NPC for every fuel cost iteration was divided by the project duration, resulting in the same increasing rate of cost for every project lifespan. In all cases, the optimal architecture was a combination of solar panels, a backup battery system, and a generator. This result only reinforces the conclusion that the system configuration HES 1 from Table 4 is the best HES combination for Clark Air Base.
One other aspect that became apparent during the sensitivity analysis is that the components’ salvage value was artificially deflating the results. Salvage value refers to the amount of money that could be received for selling a component at the end of the project lifecycle. A large portion of the overall NPC was due to the salvage value and did not accurately reflect the system’s lifecycle cost. As an example, a 2-MW solar array costing $2.8 M has an expected lifespan of 25 years. If the overall project has a lifespan of two years, the PV panels will have only lost 2/25ths of their initial value and can be sold to recoup costs; this is reflected by an NPC that is significantly lower than the $2.8 M initial cost. The salvage value term within the NPC calculation does not reflect how the military handles its assets. Once purchased, the military will continue to use the components until they are upgraded or no longer functioning. The final project duration was set to 15 years to mitigate this term. This point in time is when the first component (Li-ion battery pack) within the HES architecture is due to be replaced. By ending the project after 15 years, any salvage value incurred will be offset by the replacement cost of the battery pack.
4. Conclusions
This paper presented the innovative HERDS model to design a hybrid energy system in support of an expeditionary base in a contested environment. The HERDS model is capable of minimizing the transportation and lifecycle costs of a HES, based on a specific climate of the base. A case study was evaluated to highlight the significance and demonstrate the HERDS model’s unique capabilities to (1) predict the power requirements of a camp using fabric shelters, (2) design an optimal HES to meet the required load at a minimal operating cost, and (3) account for airlift requirements and costs and assimilate those values into a single cost to be compared against other projects.
The case study was able to quantify the benefits of implementing a HES designed by the model. The standard case of powering a base with a generator had an NPC of $9.81 million, while the best alternative HES had an NPC of $4.99 million, which was 51% of the baseline cost. These savings directly reflect the 237,441 L of fuel saved a year by the HES. An additional savings of $165,000 was also identified by transporting the HES with three C-130J-30s instead of a single C-5 from its staging area to the base’s location.
While useful in the design of off-the-grid systems, the HERDS model does possess limitations that could be the subject of future research. The model was developed with military applications in mind. Consequently, the model was tailored to only account for fabric shelters and the primary heat transfer modes by which they are affected. Internal heat and solar gains were determined to be insignificant based on the research and demonstrations that were examined in the literature review. The ASM is currently limited to United States Air Force aircraft and assumes the same speed of flight between the different airframes. The economic model used also differs from civilian acquisition models, because it assumes that the equipment will be purchased upfront and not have a loan to pay back during the lifecycle of the project.
These distinctive capabilities of the HERDS model accurately and efficiently evaluate all feasible design configurations in order to select the optimal HES that minimizes the transportation and lifecycle costs. This model will enable base planners to construct cost-effective, energy-resilient bases, all while reducing the exposed logistical tail.
Author Contributions
Conceptualization, J.P. and S.S.; methodology, J.P. and T.W.; software, J.P.; validation, J.P., T.W. and J.D.; formal analysis, J.P.; investigation, J.P.; resources, J.D. and S.S.; data curation, J.P. and J.D.; writing—original draft preparation, J.P.; writing—review and editing, T.W., J.D., and S.S.; visualization, J.P. and J.D.; supervision, S.S.; project administration, S.S.; funding acquisition, S.S. All authors have read and agreed to the published version of the manuscript.
Funding
This research was funded by the Air Force Civil Engineer Center (AFCEC), San Antonio, TX and the Air National Guard Civil Engineering Technical Service Center (NGB/A4OC), Minot, ND.
Conflicts of Interest
The authors declare no conflict of interest.
References
- Mattis, J. Summary of the 2018 National Defense Strategy of the United States: Sharpening the American Military’s Competitive Edge; United States Department of Defense: Washington, DC, USA, 2018.
- Priebe, M.; Vick, A.J.; Heim, J.L.; Smith, M.L. Distributed Operations in a Contested Environment: Implications for USAF Force Presentation; RAND Corporation: Santa Monica, CA, USA, 2019. [Google Scholar]
- US Air Force. Energy Flight Plan 2017–2036; US Air Force: Washington, DC, USA, 2017.
- Lagoon, B. Net Zero Plus JCTD: Evaluation of Energy Saving Technologies for Expeditionary Shelters. US Army NATIC Soldier Research, Development & Engineering Center, 4 November 2009. Available online: http://www.dtic.mil/dtic/tr/fulltext/u2/a514485.pdf (accessed on 12 October 2018).
- US Marine Corps Systems Command, TM 12359A–OD, 1 January 2011. Available online: https://www.marcorsyscom.marines.mil/Portals/105/pdmeps/docs/MEP/B1016B1021.pdf (accessed on 19 January 2019).
- Rodriquez-Gallegos, C.D.; Gandhi, O.; Yang, D.; Alvarez-Alvarado, M.; Zhang, W.; Reindl, T.; Panda, S.K. A Siting and Sizing Optimization Approach for PV–Battery–Diesel Hybrid Systems. IEEE Trans. Ind. Appl. 2018, 54, 2637–2645. [Google Scholar] [CrossRef]
- Pasion, C.; Wagner, T.; Koschnick, C.; Schuldt, S.; Williams, J.; Hallinan, K. Machine Learning Modeling of Horizontal Photovoltaics Using Weather and Location Data. Energies 2020, 13, 2570. [Google Scholar] [CrossRef]
- Robyn, D.; Marqusee, J. The Clean Energy Dividend: Military Investment in Energy Technology and What It Means for Civilian Energy Innovation; Information Technology and Innovation Foundation: Washington, DC, USA, 2019. [Google Scholar]
- Gildea, G.S.; Carpenter, P.D.; Campbell, B.J. SLB-STO-D Analysis Report: Modeling and Simulation Analysis of Fuel, Water, and Waste Reduction in Base Camps: 50, 300, 1000 persons. In U.S. Army Natick Soldier Research; Development and Engineering Center: Natick, CT, USA, 2017. [Google Scholar]
- Thomsen, N.; Wagner, T.; Hoisington, A.; Schuldt, S. A Sustainable Prototype for Renewable Energy: Optimized Prime-Power Generator Solar Array Replacement. Int. J. Energy Prod. Manag. 2019, 4, 28–39. [Google Scholar] [CrossRef]
- Benasutti, P.B.; Harris, W.F.; Krutsch, M.C.; Miletti, J.A. Sustainability Logistics Basing-Science and Technology Objective-Demonstration; Demonstration #1–50 Person Camp Demo. In U.S. Army Natick Soldier Research; Development and Engineering Center: Natick, CT, UAS, 2017. [Google Scholar]
- Rivera, A. Cost Benefit Analysis of Integrated COTS Energy Related Technologies for Army’s Force Provider Module; Naval Postgraduate School: Monterey, CA, USA, 2009. [Google Scholar]
- Pearson, J.; Wagner, T.; Delorit, J.; Schuldt, S. Meeting Temporary Facility Energy Demand with Climate-Optimized Off-Grid Energy Systems. IEEE Open Access J. Power Energy 2020, 7, 203–211. [Google Scholar] [CrossRef]
- Filer, J.; Schuldt, S. Quantifying the Environmental and Economic Performance of Remote Communities. Eur. J. Sustain. Dev. 2019, 8, 176. [Google Scholar] [CrossRef]
- Filer, J.E.; Delorit, J.D.; Hoisington, A.J.; Schuldt, S.J. Optimizing the Environmental and Economic Sustainability of Remote Community Infrastructure. Sustainability 2020, 12, 2208. [Google Scholar] [CrossRef]
- Tammam, A.M. Solar Tent: A Photovoltaic Generator Model for a Flexible Frabic with Inbuilt Cells; Dalarna University Solar Energy Engineering: Falun, Sweden, 2019. [Google Scholar]
- Findeisen, E.; Harwini, R.; Tjokropranoto, H.; Rijnenberg, J.; Lenssen, J.; Reinders, A.H. Integration of flexible photovoltaic modules on top of inflatable tents. In Proceedings of the 43rd IEEE Photovoltaic Specialists Conference, Portland, OR, USA, 5–10 June 2016. [Google Scholar]
- Koussa, D.S.; Haddadi, M.; Belhamel, M. Economic and technical study of a hybrid system (wind–photovoltaic–diesel) for rural electrification in Algeria. Appl. Energy 2009, 86, 1024–1030. [Google Scholar] [CrossRef]
- Rehman, S.; Al-Hadhrami, L.M. Study of a solar PV–diesel–battery hybrid power system for a remotely located population near Rafha, Saudi Arabia. Energy 2010, 35, 4986–4995. [Google Scholar] [CrossRef]
- Wagner, T.; Lang, E.; Assink, W.; Dudis, D. Photovoltaic System Optimization for an Austere Location Using Time-Series Data. In Proceedings of the 2018 IEEE 7th World Conference on Photovoltaic Energy Conversion (WCPEC) (A Joint Conference of 45th IEEE PVSC, 28th PVSEC & 34th EU PVSEC), Waikoloa Village, HI, USA, 10–15 June 2018. [Google Scholar]
- Chester, D.; Wagner, T.; Dudis, D. 36% Reduction in Fuel Resupply Using a Hybrid Generator & Battery System for an Austere Location. Mar. Corps Gaz. 2019, 103, 49–52. [Google Scholar]
- Sufyan, M.; Rahim, N.; Tan, C.; Muhammad, M.; Raihan, S. Optiman Sizing and Energy Scheduleing of Isolated Microgrid Considering the Battery Lifetime Degradation. PLoS ONE 2019, 14, e0211642. [Google Scholar] [CrossRef] [PubMed]
- Dawoud, S.M.; Lin, X.; Okba, M.I. Hybrid renewable microgrid optimization techniques: A review. Renew. Sustain. Energy Rev. 2018, 82, 2039–2052. [Google Scholar] [CrossRef]
- Al-Falahi, M.D.A.; Jayasinghe, S.; Enshaei, H. A review on recent size optimization methodologies for standalone solar and wind hybrid renewable energy system. Energy Convers. Manag. 2017, 143, 252–274. [Google Scholar] [CrossRef]
- García-Vera, Y.E.; Dufo-López, R.; Bernal-Agustín, J.L. Energy Management in Microgrids with Renewable Energy Sources: A Literature Review. Appl. Sci. 2019, 9, 3854. [Google Scholar] [CrossRef]
- Ma, T.; Yang, H.; Lu, L. A feasibility study of a stand-alone hybrid solar–wind–battery system for a remote island. Appl. Energy 2014, 121, 149–158. [Google Scholar] [CrossRef]
- Harvey, A.R. The Modification of HOMER Software Application to Provide The United States Marine Corps with an Energy Planning Tool; Naval Postgraduate School: Monterey, CA, USA, 2012. [Google Scholar]
- Razmjoo, A.; Davarpanah, A. Developing Various Hybrid Energy Systems for Residential Applicaiton as an Appropriate and Reliable way to Achieve Energy Sustainability. In Energy Sources, Part A: Recovery, Utilization, and Environmental Effects; Taylor & Francis: Oxfordshire, UK, 2019; Volume 41, pp. 1180–1193. [Google Scholar]
- Lambert, T.; Gilman, P.; Lilenthal, P. Micropower System Modeling with HOMER. In Intergration of Alternative Sources of Energy; Wiley & Sons: Hoboken, NJ, USA, 2005; pp. 379–417. [Google Scholar]
- Maywald, J.D.; Reiman, A.D.; Overstreet, R.E.; Johnson, A.W. Aircraft selection modeling: A multi-step heuristic to enumerate airlift alternatives. Ann. Oper. Res. 2018, 274, 425–445. [Google Scholar] [CrossRef]
- Maywald, J.D.; Reiman, A.D.; Johnson, A.W.; Overstreet, R.E. The Myth of Strategic and Tactical Airlift. Air Space Power J. 2017, 61–71. [Google Scholar]
- Murley, D.J. Using Geographic Information Systems to Evaluate Energy Initiatives in Austere Environments; Air Force Institute of Technology: Wright-Patterson Air Force Base, Montgomery County, OH, USA, 2017. [Google Scholar]
- Chris, H. Army Alaska Tents, Memphite, 23 Dec 2016. Available online: https://memphite.com/YXJteSBhbGFza2EgdGVudHM (accessed on 3 January 2020).
- Pilsworth, M.N. The Calculation of Heat Loss From Tents; United States Army Natick Research and Development Command: Natick, CT, USA, 1979.
- Stephenson, L.D.; Heffron, A.; Mehnert, B.B. Prediction of Long Term Degradation of Insulating Materials; US Army Corps of Engineers, Engineer Research and Development Center: Champaign, IL, USA, 2015.
- HDT Global. HDT 60K IECU and S60K IECU Specifications Sheet; HDT Global: Solon, OH, USA, 2018. [Google Scholar]
- Newell, B.H.; Shields, E.B. USMC Expeditionary Energy Office Report on Expeditionary Energy Data Collection within Regional Command Southwest, Afghanistan; USMC Expeditionary Energy Office: Washington, DC, USA, 2012.
- Department of the Army, Cargo Specialist’s Handbook, 12 May 2011. Available online: https://armypubs.army.mil/epubs/DR_pubs/DR_a/pdf/web/tc4_13x17.pdf (accessed on 4 February 2020).
- Secretary of the Air Force. Air Force Instruction 65-503 US Air Force Cost and Planning Facotors, Table A4-1; US Air Force: Washington, DC, USA, 2018.
- Pfenninger, S.; Staffell, I. Long-term patterns of European PV output using 30 years of validated hourly reanalysis and satellite data. Energy 2016, 114, 1251–1265. [Google Scholar] [CrossRef]
- Staffell, I.; Pfenninger, S. Using bias-corrected reanalysis to simulate current and future wind power output. Energy 2016, 114. [Google Scholar] [CrossRef]
- Air Force Civil Engineering Center. Bare Base Conceptual Planning; United States Air Force: Washington, DC, USA, 2012.
- SunPower. E-Series Residential Solar Panels E20-327; SunPower: San Jose, CA, USA, 2016. [Google Scholar]
- Solar.com. Solar Panel Efficiency, Solar.com, 1 January 2020. Available online: https://www.solar.com/learn/solar-panel-efficiency (accessed on 9 February 2020).
- Earthmill Maintenance. Kingspan KW6 6kW Wind Turbine, Earthmill Maintenance, 1 January 2020. Available online: https://www.earthmill.co.uk/wind-turbines-for-sale/small-wind-turbines/kingspan-kw6-6kw-wind-turbine (accessed on 26 January 2020).
- Tesla. “Powerpack,” Tesla, 1 January 2020. Available online: https://www.tesla.com/powerpack (accessed on 26 January 2020).
- Sollega. Sollega: Our Products, 1 January 2018. Available online: https://drive.google.com/file/d/1X3EOLvkoU5WaK-7du0g84r-XZgUcAXrn/view (accessed on 26 January 2020).
- Google, Directions for Flying from Kadena AB, Guam AFB, RAAF Tindal AFB to Clark AB, Google Maps, 1 January 2020. Available online: https://www.google.com/maps/dir/Kadena+Air+Base,+Azahigashi,+Kadena,+Okinawa,+Japan/Clark+Air+Base,+Lily+Hill+Street,+Clark+Field,+Angeles+City,+2009,+Pampanga,+Philippines (accessed on 30 January 2020).


© 2020 by the authors. Licensee MDPI, Basel, Switzerland. This article is an open access article distributed under the terms and conditions of the Creative Commons Attribution (CC BY) license (http://creativecommons.org/licenses/by/4.0/).