Article

Ablation-Dominated Arcs in CO2 Atmosphere—Part I: Temperature Determination near Current Zero

1
Leibniz Institute for Plasma Science and Technology (INP), Felix-Hausdorff-Str. 2, 17489 Greifswald, Germany
2
Institute for High Voltage Technology, RWTH Aachen University, Schinkelstrasse 2, 52056 Aachen, Germany
*
Author to whom correspondence should be addressed.
These authors contributed equally to this work.
Energies 2020, 13(18), 4714; https://doi.org/10.3390/en13184714
Submission received: 11 August 2020 / Revised: 27 August 2020 / Accepted: 9 September 2020 / Published: 10 September 2020
(This article belongs to the Special Issue Environmental Compatible Circuit Breaker Technologies)

Abstract

:
Wall-stabilized arcs dominated by nozzle–ablation are key elements of self-blast circuit breakers. In the present study, high-current arcs were investigated using a model circuit breaker (MCB) in CO 2 as a gas alternative to SF6 (gas sulfur hexafluoride) and in addition a long polytetrafluoroethylene nozzle under ambient conditions for stronger ablation. The assets of different methods for optical investigation were demonstrated, e.g., high-speed imaging with channel filters and optical emission spectroscopy. Particularly the phase near current zero (CZ) crossing was studied in two steps. In the first step using high-speed cameras, radial temperature profiles have been determined until 0.4 ms before CZ in the nozzle. Broad temperature profiles with a maximum of 9400 K have been obtained from analysis of fluorine lines. In the second step, the spectroscopic sensitivity was increased using an intensified CCD camera, allowing single-shot measurements until few microseconds before CZ in the MCB. Ionic carbon and atomic oxygen emission were analyzed using absolute intensities and normal maximum. The arc was constricted and the maximum temperature decreased from >18,000 K at 0.3 ms to about 11,000 K at 0.010 ms before CZ. The arc plasma needs about 0.5–1.0 ms after both the ignition phase and the current zero crossing to be completely dominated by the ablated wall material.

Graphical Abstract

1. Introduction

For modern power transmission and distribution grids, high voltage circuit breakers are among the essential elements to ensure safe power flow [1,2]. Basic technology applied therefore are self-blast circuit breakers in which a pressure build-up in a heating volume, necessary for arc quenching around current zero (CZ), is produced by the ablation of material from the nozzle wall due to intense arc radiation. Usually, gas sulfur hexafluoride (SF 6 ) is applied as quenching and insulating gas due to its unique properties as being chemically inert, non-flammable, non-explosive, non-toxic, thermally stable, and an excellent electrical insulator and arc interrupter due to its high electronegativity (electron attachment) and density [3]. Metal-doped polytetrafluoroethylene (PTFE) is used as the nozzle material due to well-adjustable ablation, pressure built-up, and dielectric properties. A main trend of circuit breaker development is the substitution of the extremely potent greenhouse gas SF 6 with a high global warming potential (of about 23,000 times that of CO 2 over a 100 year period) by more environmentally-friendly gases [4]. A variety of alternative gases has been discussed and tested in the last decades, e.g., CO 2 , CF 3 I, C 2 F 4 , c-C 4 F 8 , C 4 F 7 N, and C 5 F 10 as pure gases or in mixtures of two or three gases including components like N 2 , O 2 , and CO 2 . However, only a limited selection remains in the actual investigations. Gas mixtures containing fluoro–nitriles (C 4 F 7 N) or fluoro–ketones (C 5 F 10 O) as minority components (<20%) have been identified as the most promising alternatives to SF 6 in high-voltage gas-insulated switchgear applications because of their low global warming potential together with their dielectric strength values being comparable to SF 6 [5,6,7]. Due to high boiling points (at 1 bar) of the fluoro–ketones (27 ° C) and fluoro–nitriles (−4.7 ° C), gas mixtures with carbon dioxide CO 2 as buffer gas prevent liquefaction at temperatures below −30 ° C. One of the most promising alternatives that has less limitations concerning temperature range and greenhouse effect but reasonable electrical insulation is CO 2 [8,9,10]. Moreover, some of the experimental techniques and results obtained for CO 2 will be relevant for other alternative gases that are usually applied with CO 2 as buffer gas.
For an evaluation of the interruption performance it is mandatory to analyze and understand the time around CZ, i.e., the phase of current interruption and recovery of dielectric insulation in the electrode gap. Beside experimental investigations, computer simulations are of a high importance due to their cost-efficiency and fast adaptation to different geometries. However, such simulation tools need to be validated with experimental results and also to be provided with reliable input parameters based on experimental data. From the physical point of view, numerous transient effects can be observed such as:
  • Reversal of the gas flow in the heating channel,
  • Transition from an ablation-controlled to an axially blown arc,
  • Arc constriction and finally extinction,
  • Wall ablation that still occurs when the energy input by radiation from the arc is terminated, and
  • Dielectric recovery of the electrode gap region.
Hence, the experimental investigation of the CZ phase is of high relevance for the development of high voltage switchgear. One of the main goals is the determination of physical properties as the composition, pressure, and temperature of the plasma. Ideally, this should be done with both spatial and temporal resolution as close as possible to CZ. Such investigations are usually based on optical methods and demand view ports or other access to the arc plasma that is often not available for commercial circuit breakers. A balance must be found between a conservation of geometry, functionality, and plasma conditions on the one side and a modification of the setup on the other side allowing, e.g., optical access as well as fast exchange of fill gas and components as electrodes, nozzles, windows, and ignition wires. In general, model circuit breakers are often equipped with fixed electrodes and ignited by an explosion of thin wires [11]. Experiments with moving electrodes of a pin and tulip shape may provide higher similarity with commercial circuit breaker geometries including the geometry of nozzles, heating chambers, and gas flow. However, reproducibility is often critical for experiments with moving electrodes. Furthermore, often the optical access is either fairly sophisticated and limited in time (using slits and windows [12]) or limited in spatial resolution, e.g., using optical fibers. If side-on diagnostics of the arc through quartz windows placed outside the nozzle is not possible due to non-transparent vapor, an alternative end-on arc observation can be realized through a ring electrode [13]. Alternatively, the PTFE as the standard nozzle material in commercial circuit breakers can be replaced by polymers that are transparent, e.g., PMMA [14,15].
In this work, two setups are used for investigation with optical emission spectroscopy (OES). In both setups, two pin electrodes are placed in a fixed distance and surrounded by PTFE nozzles. Ignition wires are used to initiate the arcs. The main difference between the setups is the nozzle geometry:
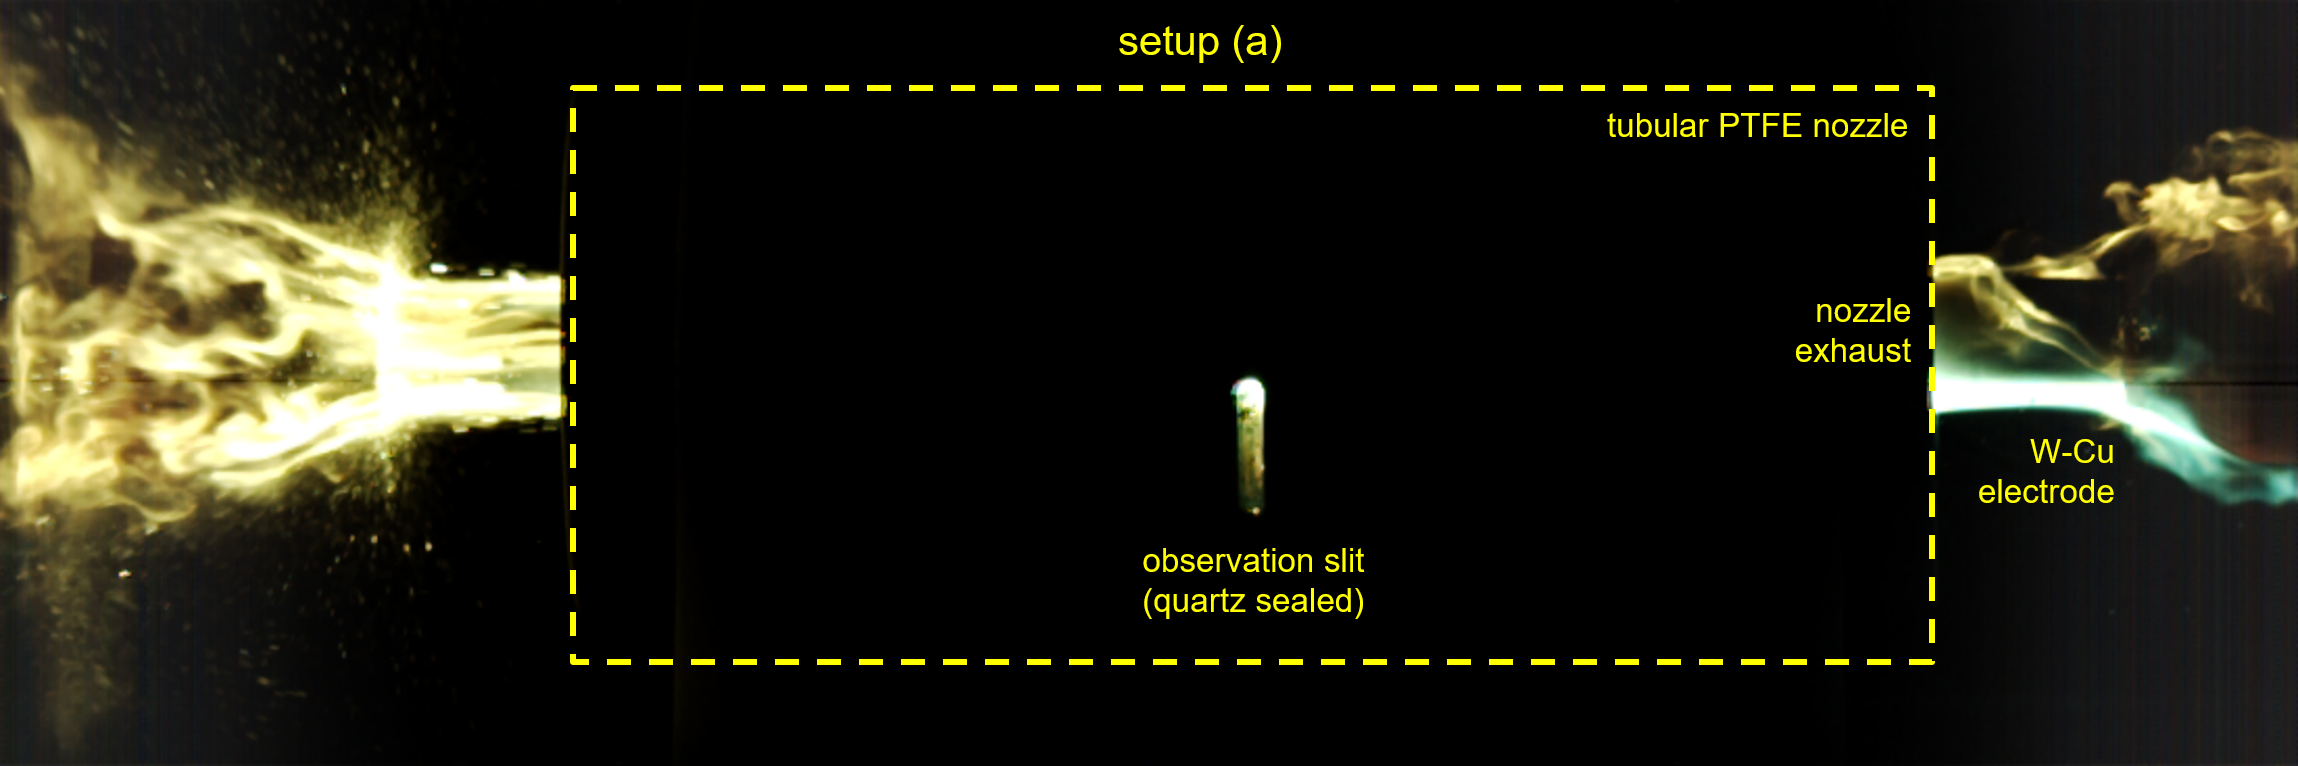
  • The first, more simple setup is applied to generate extra-high pressure built-up and strong influence of the wall ablation. Therefore, the nozzle is made of a single, long PTFE tube. The influence of ignition wire and surrounding gas (ambient air) during the early stage of the arc discharge have been investigated in [16]. In the present work, the focus is set on the gas flow reversal as well as the detection limits for the determination of plasma temperature profiles around CZ. For these issues, no surrounding chamber is needed.
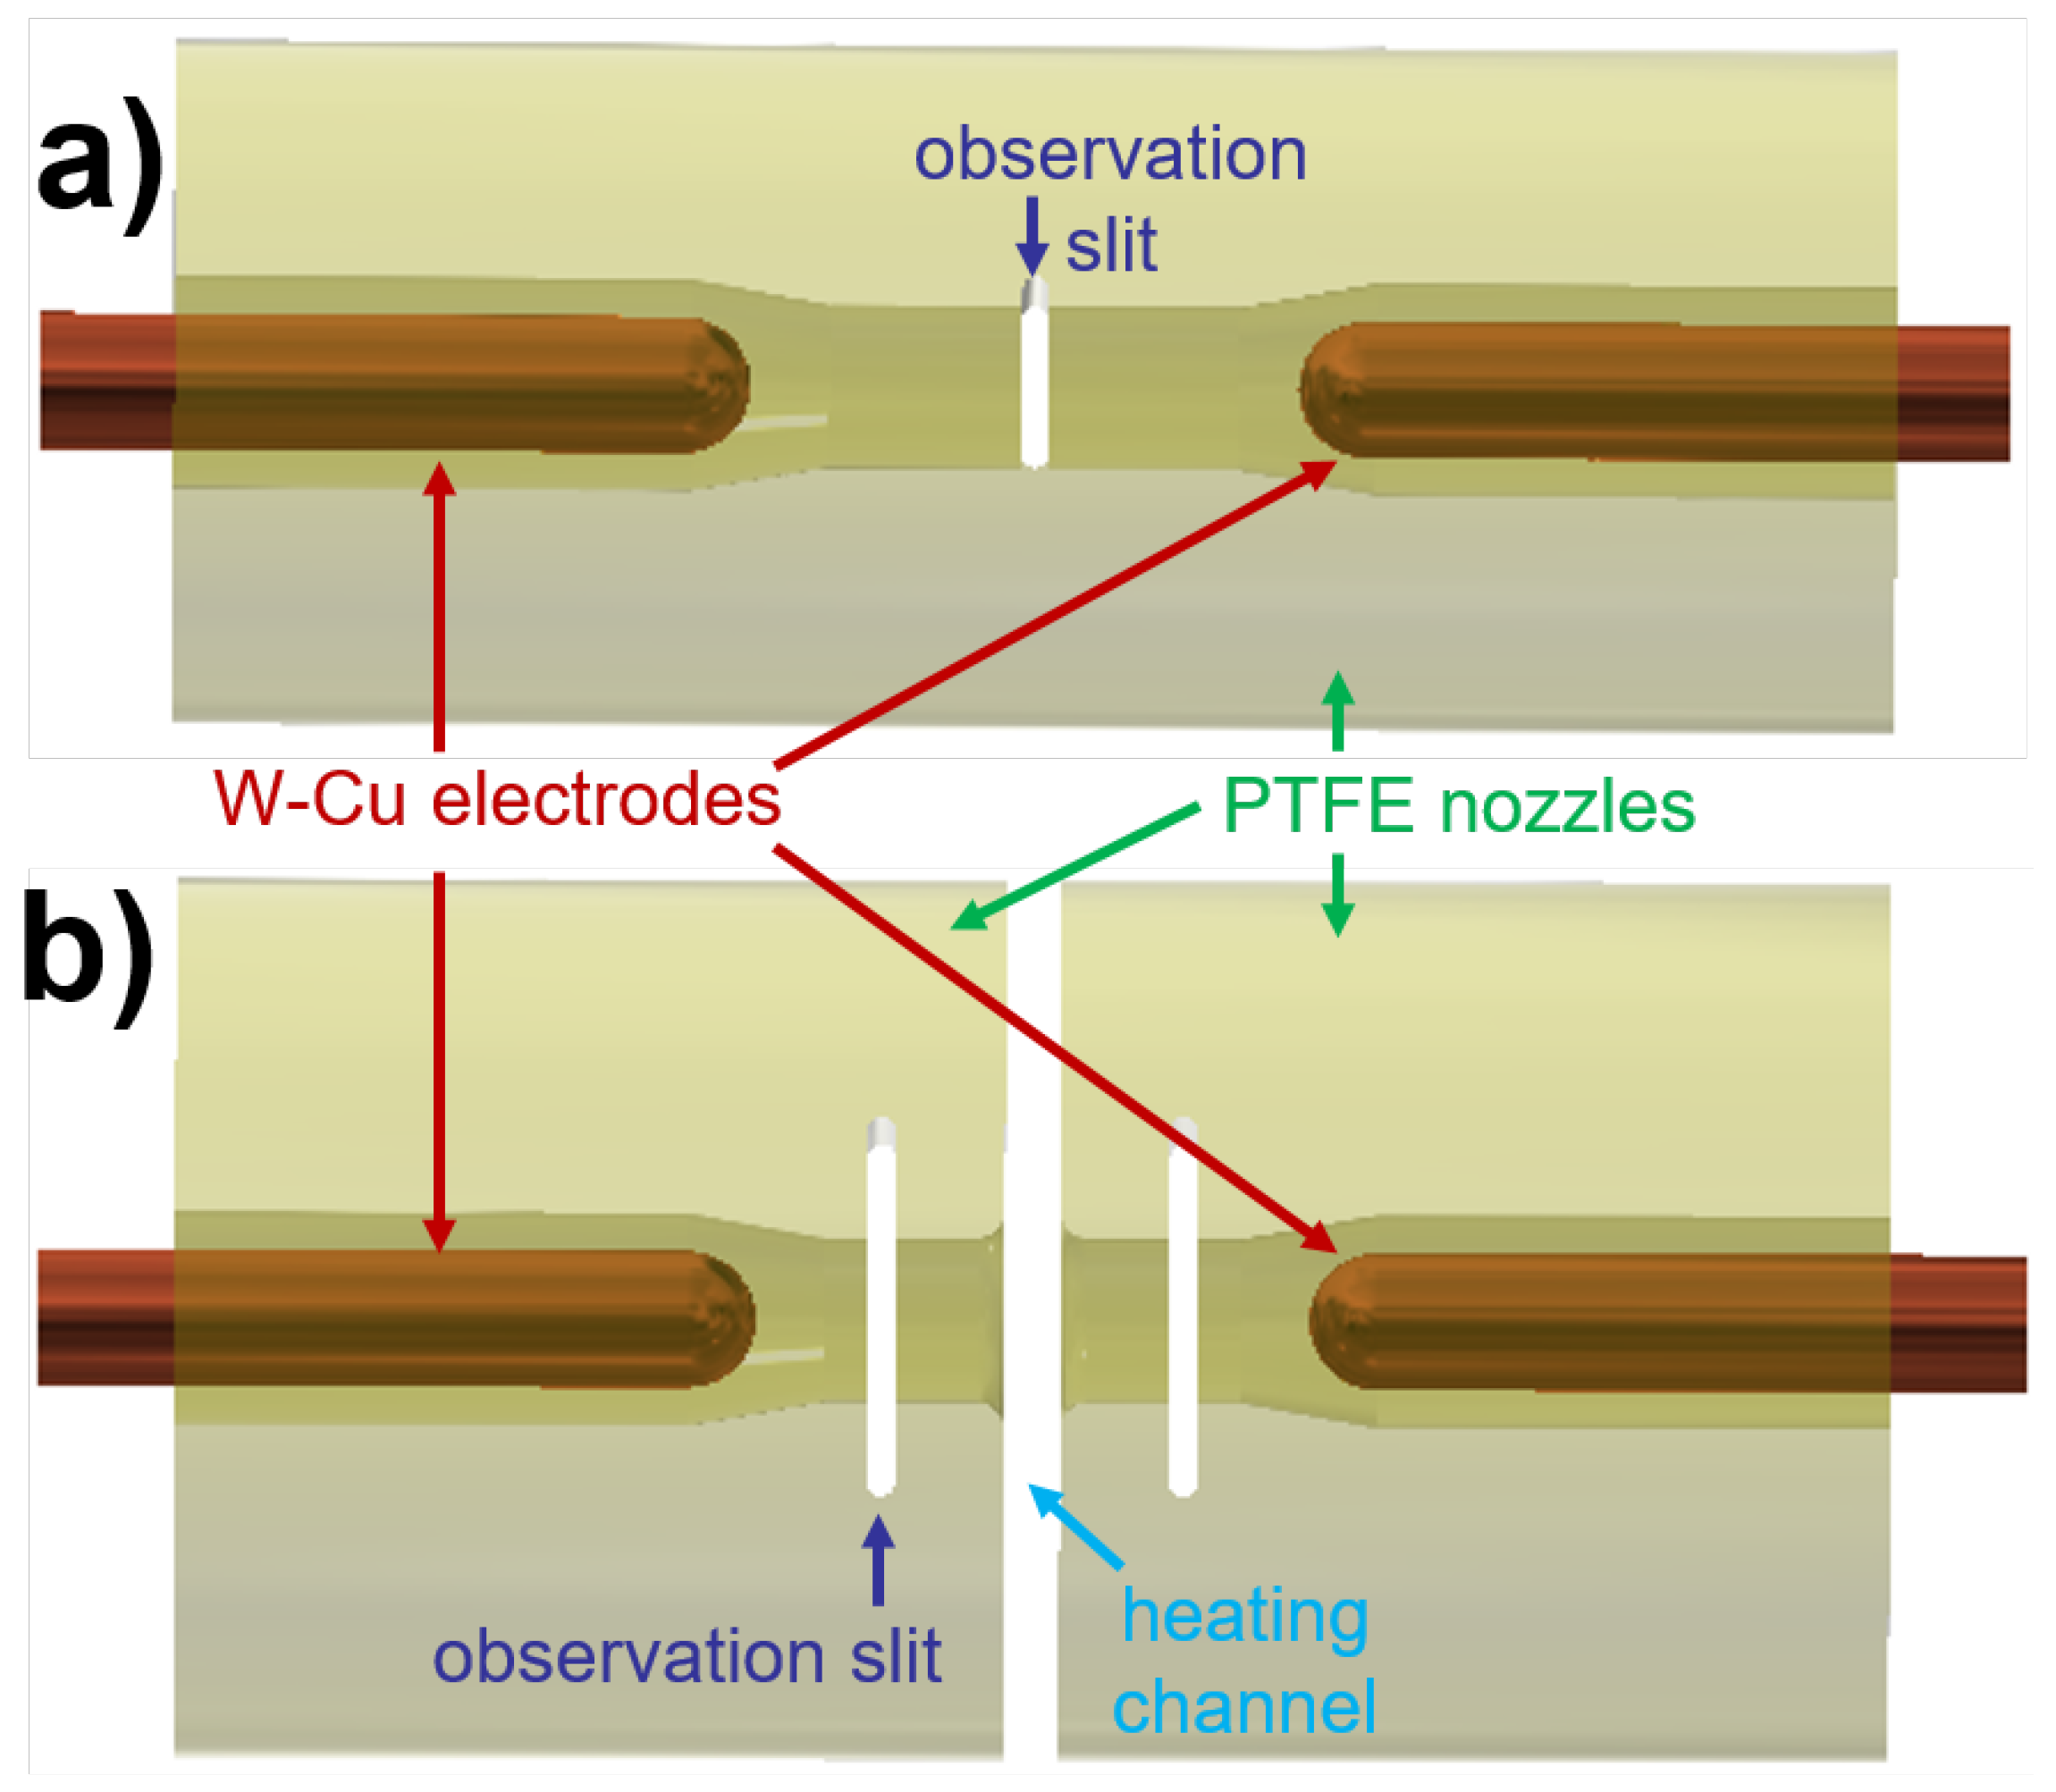
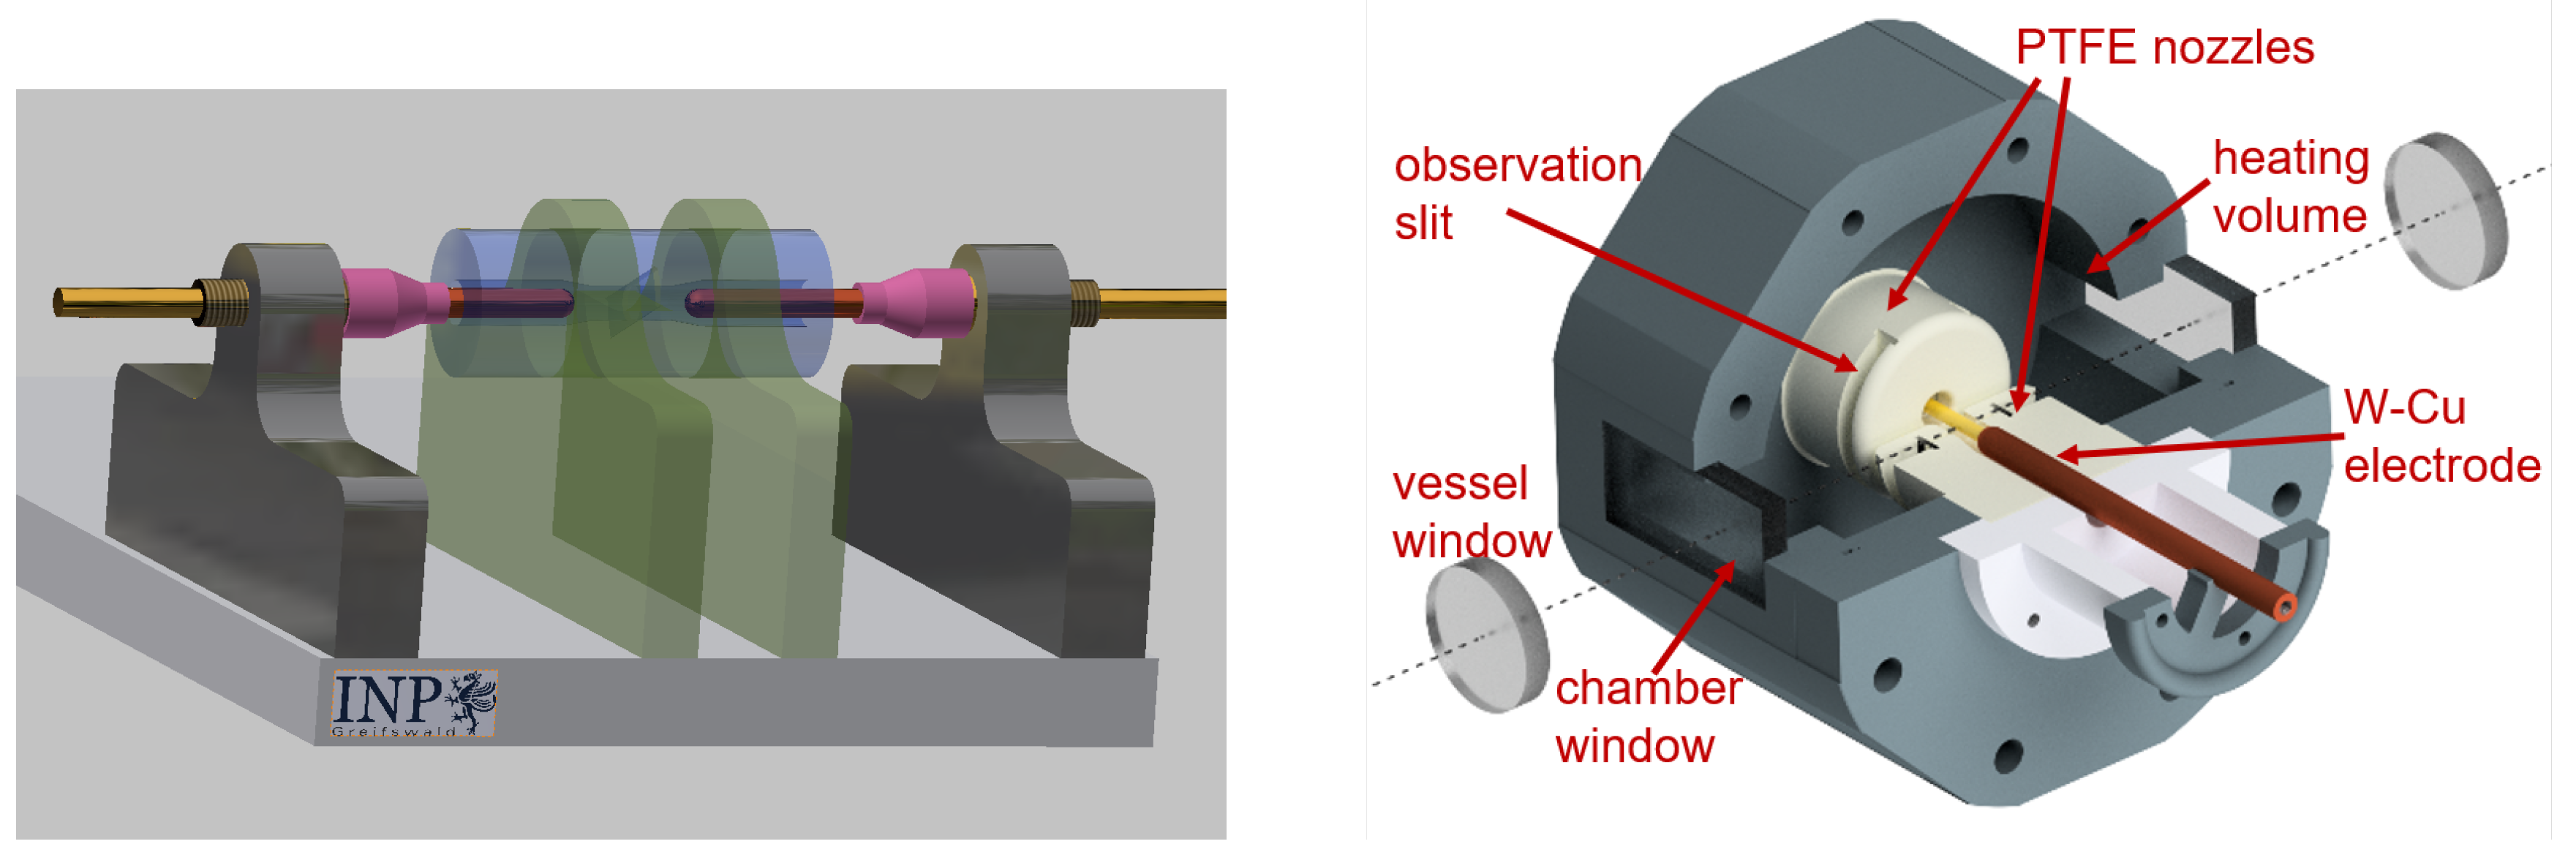
  • The second setup is a model self-blast circuit breaker in a CO 2 atmosphere with optical access via the windows. It consists of two nozzles surrounding the electrodes and forming a heating channel which leads into the heating volume. Earlier experiments were carried out with the optical observation at the position of the heating channel and in the high-current phase [17]. Hence, the plasma emission from the central parts of the arc is influenced by the axial flow of hot gas in the heating channel, i.e., along the line of sight. The gas flow into the heating volume partly forces the plasma into the heating channel and the emission region exceeds the nozzle diameter, showing turbulence and deviation from the expected bi-convex structure that is needed for plasma temperature determination. To overcome these problems, for the experiments reported here the observation position was shifted away from the heating channel and towards the electrodes. As described below, this was realized by insertion of quartz windows into the nozzles.
For the investigation of the arc plasma, OES of atomic and ionic lines is a standard method for experimental determination of temporally- and spatially-resolved profiles of composition, temperature, and partial pressures that are needed for the calculation of thermal and electrical conductivity. However, the applicability of optical emission spectroscopy is limited for low emission levels, e.g., at low currents around CZ or at positions near the nozzle wall. Usually, plasma temperatures below 8000 K cannot be measured due to low line intensity and limited sensitivity of the detector. Thus, spatial temperature profiles cannot be obtained in the close vicinity of the wall region that is of high interest due to the importance of the nozzle ablation [18,19].
An alternative to OES at lower temperatures could be optical absorption spectroscopy (OAS) of resonant lines since the majority of atoms is in the ground state and thus, detectable by absorption. However, corresponding investigations under switching-relevant conditions are rather sophisticated; most resonant lines of carbon, fluorine, and copper need an optical access in the ultraviolet (UV) wavelength region whereas others like O I at 630.03 nm are very weak. Alternatively to atomic and ionic lines, molecules might be investigated. Most molecules dissociate above critical temperatures below 10 000 K. Thus, such analysis has the potential to provide insight into the region close to the wall at lower temperature. Experiments on OAS and investigation of molecule emission and absorption are reported in an accompanying article [20].
In the present paper, several questions should be answered: What can be learned by application of different experimental techniques for instigation of ablation-dominated arcs, partly combined? How far to current zero plasma temperature profiles can be measured with OES? What happens in the low-current phase approaching CZ with these profiles when lower conductivities are needed—mainly a temperature decrease or constriction of the arc diameter?

2. Materials and Methods

2.1. Geometry of Electrodes and Nozzles

As described above, two setups of electrodes and nozzles are used. They are sketched in Figure 1. In both cases, two-pin tungsten-copper (W-Cu) electrodes of 10 mm diameter were placed horizontally with a fixed contact distance of 40 mm. The electrodes were surrounded by either one 126 mm long, tubular-shaped nozzle of 50 mm outer diameter (a), or two separate nozzles of about a 50 mm length and 104 mm outer diameter (b). The general structure of the tubular and separated nozzles were similar. They were made of PTFE doped with <0.5 wt% molybdenum disulfide (MoS 2 ) as usually used in high-voltage circuit breakers (CB). In both cases, the inner diameter was about 12 mm in the central part where the arc discharge was burned and about 16 mm at the electrode side ends of the nozzle to allow an exhaust gas flow along the electrodes. In the vicinity of the electrode tips, a smooth transition was realized from the smaller to the larger diameter.
For the camera observation and spectroscopy, optical access was realized by vertical slits of a 2 mm width. Pairwise placement at opposite positions allowed not only an observation of the emitted radiation but also background illumination and absorption measurement. The slits were mortised directly into the nozzles, ranging over the complete nozzle diameter. Since such slits would be potential exhaust pipes of the plasma causing additional disturbances, 2 mm–thick quartz plates were applied to seal the nozzle. After each shot the sealing plates were checked visually and the transmission was measured regularly. Because of the possible fume deposition on the plates, they were exchanged after each shot but could be recycled after cleaning. With regular exchange, no melting of quartz glass was observed. Generally, it was found that the sealing was very effective and the transmission reduction was controllable. However, few cases were observed with severe, local blackening of the quartz plates indicating problems with the sealing and these shots were repeated. Breaking of the plates occurred only for ones after extremely high currents.
For setup (a) the observation slits were placed in the middle between both electrodes, i.e., about 20 mm away from both electrodes. In setup (b), the distance between the two nozzles was about 4 mm forming a heating channel. The line of sight used in [17] was along the heating channel, i.e., in a central position between the nozzles where turbulent gas flow in a radial direction cannot be avoided and may disturb the observation of radial profiles. Having the opportunity to use quartz-sealed vertical slits, the observation point was positioned in one of the nozzles (the nozzle on the left side) in Figure 1. It was at half distance to the electrode tip and the nozzle exhaust in the heating channel, i.e., about 9 mm away from both.
The arcs were operated under ambient conditions in case of setup (a), i.e., without external chambers. The apparatus shown in the left part of Figure 2 basically comprises of electrically-isolated holders for nozzle and electrodes including ceramic shielding protecting against the hot exhaust plasma. Setup (b) was part of a model circuit breaker that is shown in Figure 2. It was placed in an outer vessel of about 300 L volume that was evacuated and filled with CO 2 before each shot. Additional windows in the model chamber and the vessel allowed a free view through the nozzle. Thus, in this case an observation was also possible from opposite directions as well as absorption measurements.
LC circuits were used to generate sine-like current waveforms of about a 100 Hz frequency and 11 kA peak current for setup (a) and 50 Hz and 5.3 kA for setup (b). The arc discharges were initiated using exploding thin Cu wires. Pressure sensors (603A from Kistler) were positioned in case of setup (a) in the middle of the nozzle, i.e., in 90 ° to the observation slits. In case of setup (b) the pressure sensor was placed in the heating volume of the model circuit breaker.

2.2. Optical Setup

Different methods were applied for the optical analysis. Firstly, high-speed cameras (HSC), the 24bits color Y6 or the 10bits monochrome Y4, both from Integrated Design Tools (IDT), were used to observe the general discharge behavior. Although the available area was reduced to a 2 mm-wide slit, relevant information was obtained regarding gas flow, asymmetry, dust, and droplets. As an example, a special double frame optics (DFO) could be applied between camera and lens that divided the optical path into two ways and produced two images of the same area that could be filtered at different wavelengths.
Secondly, optical emission spectroscopy was carried out by means of an imaging spectrograph with a 0.5 m focal length (Roper Acton SpectraPro SP2500i). The nozzle slit was imaged on the entrance slit of the spectrograph by a focusing mirror to spectrally investigate arc cross sections, i.e., perpendicular to the arc axis. Having the development during arc discharge in the focus, the spectrograph was equipped with a high-speed video camera (Y4 series of IDT). That enabled to record a series of 2D-spectra with typical repetition rates of 100 μ s, allowing approximate exposure times of 98 μ s (frame rate of 10,000 fps). It should be noted that rather long exposure times were necessary due to limited sensitivity of non-intensified HSC. Alternatively, the HSC was replaced by an ICCD camera (PI-MAX4 from Princeton Instruments) with higher sensitivity, allowing only single images but of shorter exposure times and at lower intensities, e.g., around current zero.
In a compromise between light intensity, spectral resolution, and exposure time, the entrance slit of the spectrograph was set to 50 μ m. With gratings of 150 lines per mm for overview and 1800 L/mm for detailed spectra, the spectral range was 150 nm and 10 nm, and a spectral resolution (full width half maximum) of 0.7 nm and <0.1 nm, respectively. The intensity of side-on spectra was calibrated in units of spectral radiance by means of a tungsten strip lamp (OSRAM Wi 17/G) at the arc position. The window transmission of 50–70% was taken into account, mainly resulting from the coating of the quartz plates at the nozzles.
A positioning laser was used to adjust line of sight and check the stability between the shots. However, it was found that the width of 2 mm of the observation slit at the nozzle allowed a stable and free optical path. Usually, no corrections between the shots were needed thanks to the absence of moving parts.

3. Results

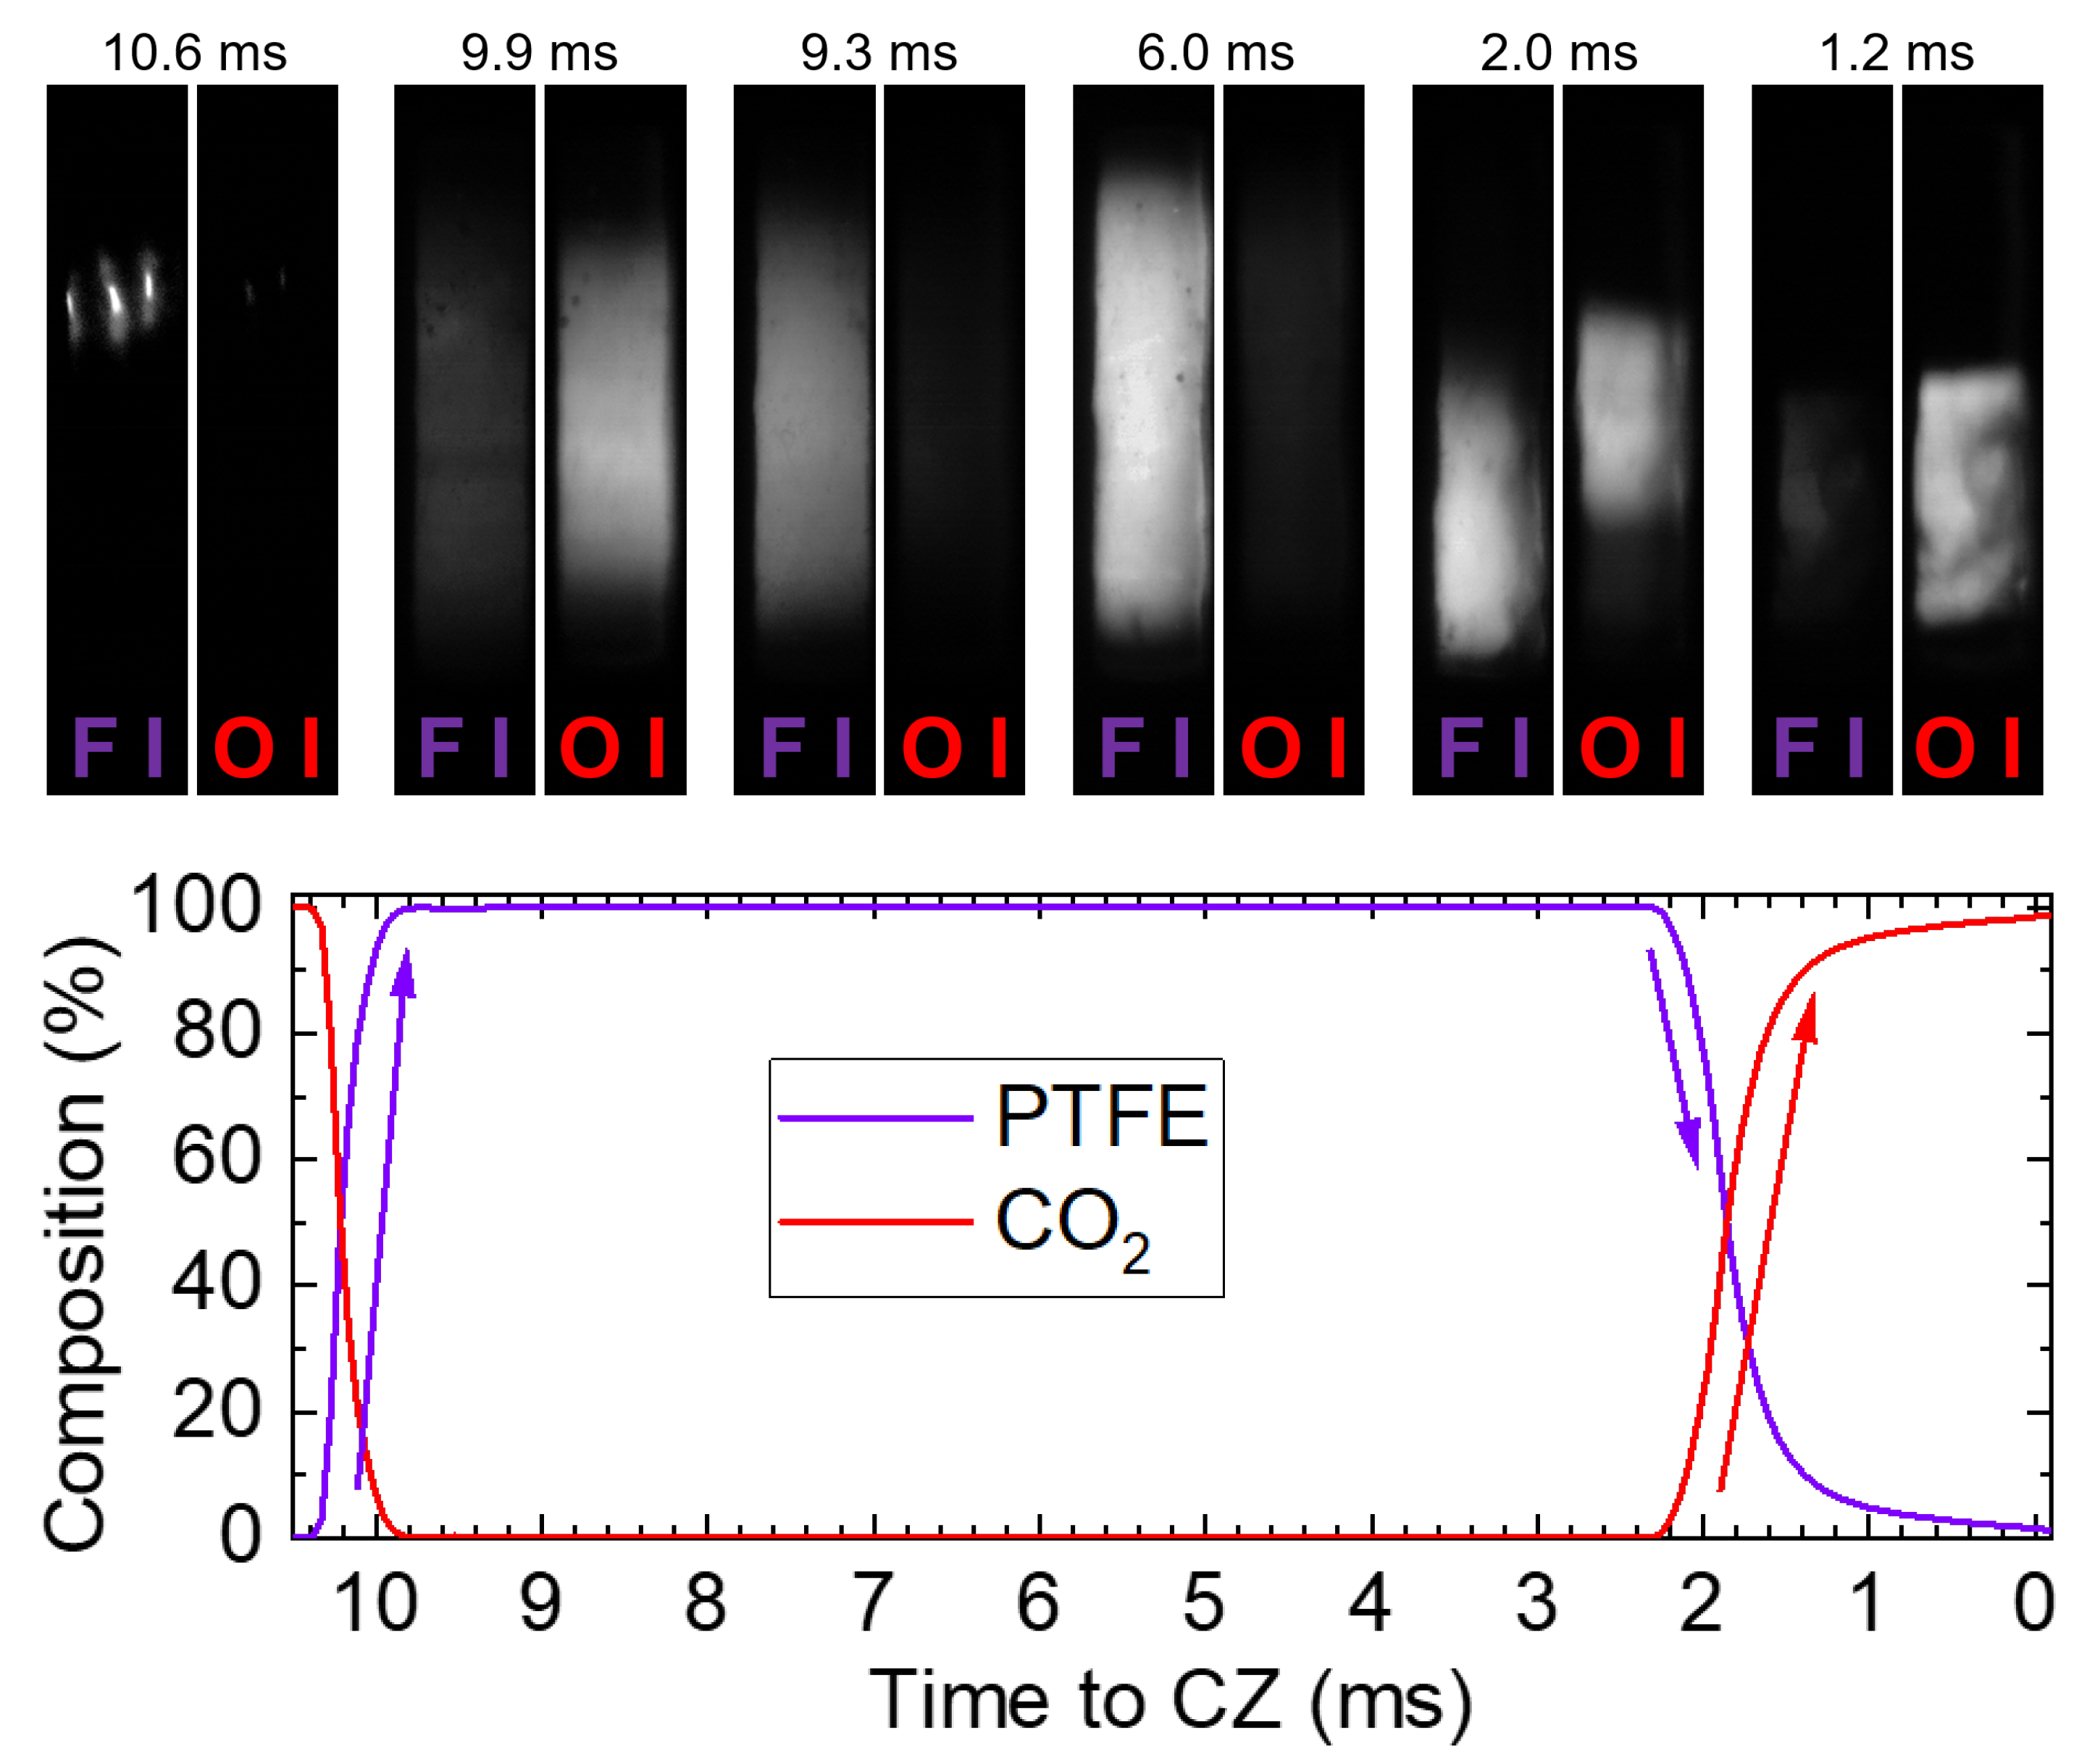
3.1. Video Observation and Flow Reversal

On the left side of Figure 3, a typical current waveform (red) is shown for the discharges in the model circuit breaker with a 5.3 kA peak value (setup (b)). The current does not have the exact shape of a perfect sine and has a slightly longer duration than expected for 50 Hz (∼10.6 ms). In this article the main focus is set on the time around CZ while the starting phase is of minor interest. Consequently, all points in time are given with respect to the current zero crossing for easier comparison. The voltage curve (blue) is characterized by a long period of values around 200 V flanked by two distinct peaks at the explosion of the ignition wire and at the arc extinction near CZ. During the high-current phase of arc discharge, the voltage increases from the local minimum of about 140 V at the end of the ignition peak (10 ms) to a maximum of about 240 V during the peak current (5 ms), and slightly decreases again with lower currents until about 200 V (3 ms before CZ).
The intense radiation emitted from the arc plasma is absorbed by the surface of a surrounding PTFE nozzle where it causes photo–ablation of the wall material [13]. Part of the ablated material is exhausted as vapor by the axial flow, the other part enters the arc and is heated to a plasma temperature by absorption of radiation coming from the arc interior, leading to a discharge that is dominated by the ablation [18]. Both the arc plasma and vapor create an overpressure which causes an axial expansion flow towards the ends of the nozzle. In the middle of Figure 3, three curves of the pressure are shown. The red and black curve were obtained for the slit position inside the PTFE nozzle and the heating volume, respectively, from CFD simulation (CFD-ACE+ software suite by the ESIGroup) of the discharge according to [17]. A comparison of simulation results for the heating volume (black) with our measurements (dashed blue) resulted in a good agreement concerning the shape of the curve. Small deviations of the absolute values were used to adjust the pressure in the model. Although no pressure sensors could be placed directly in the nozzle or heating channel in case of the MCB, values of the pressure at the OES position (slit) could be easily obtained from a comparison with the results from the CFD simulation (red curve). The maximum pressure of 3.5 times the filling pressure is built up close to the peak current. It should be noted that at CZ the pressure is still about two times the filling pressure, which results in a cooling of the arc.
On the right part of Figure 3, a grey scale image is shown to illustrate the area of HSC observation at the position of the nozzle slit. Note that illumination from the backside was applied and the ignition wire can be recognized in the lower part. Finally, an example of a HSC frame of the arc in false colors is given on the far right about 1 ms before CZ. Typically, the arc is constricted at this time to less than half of the nozzle diameter. Here, it is located in the upper part of the nozzle, showing a deviation from rotational symmetry.
The arc in the slit area was further investigated using the double frame optics (DFO). Filters were applied to reveal information on the plasma composition. Any emission from fluorine and oxygen can be clearly dedicated to the nozzle wall (PTFE, C 2 F 4 ) and filling gas (CO 2 ), respectively. Therefore, the left channel was equipped with a metal interference filter (MIF) with maximum transmission at 675 nm to become sensitive for several atomic fluorine lines F I and the right channel with a narrow filter at 777 nm for the atomic oxygen triplet O I. The emission from carbon lines could not be used since both materials contained carbon. On the upper part of Figure 4, six exemplary double frames are shown for significant points in time. Please note that the full video is available as Supplementary Material to this article. In the lower part of Figure 4 the plasma composition as obtained from the CFD simulation is shown as fractions of PTFE and CO 2 .
The first frame from the DFO mainly shows the atomic copper emission from ignition wire that is present on the left side (Cu I line at 674.1 nm). The wire was divided by the explosion into three pieces within the 2 mm slit area. Less than a millisecond later, the emission dominated in the right channel, indicating a discharge in the CO 2 atmosphere (9.9 ms to CZ). Within few hundreds of microseconds, the brightness of the right channel faded while the left part became more intense. Here, the increasing wall ablation started to dominate the discharge, blowing the fill gas out of the nozzle. This is in good agreement with the simulation results. In the following, a long and stable period was observed that was dominated by ablation (cf. frame at 6.0 ms before CZ). Another reversal of flow was found about 2 ms before CZ: When the arc current and thus wall ablation were considerably decreased, the pressure in the nozzle also decreased to values below that of the heating volume, see Figure 3. As a consequence (relatively cold) gas from the heating volume with a high fraction of CO 2 flowed back into the nozzle. There it was heated up by the arc current and its radiation could be seen in the right channel. Interestingly, different intensity distributions were found for the left and right channel at 2.0 ms before CZ. That indicated non-homogeneous gas mixture. Finally, only emission from O I could be seen in the last ms, indicating a plasma composition completely dominated by CO 2 .

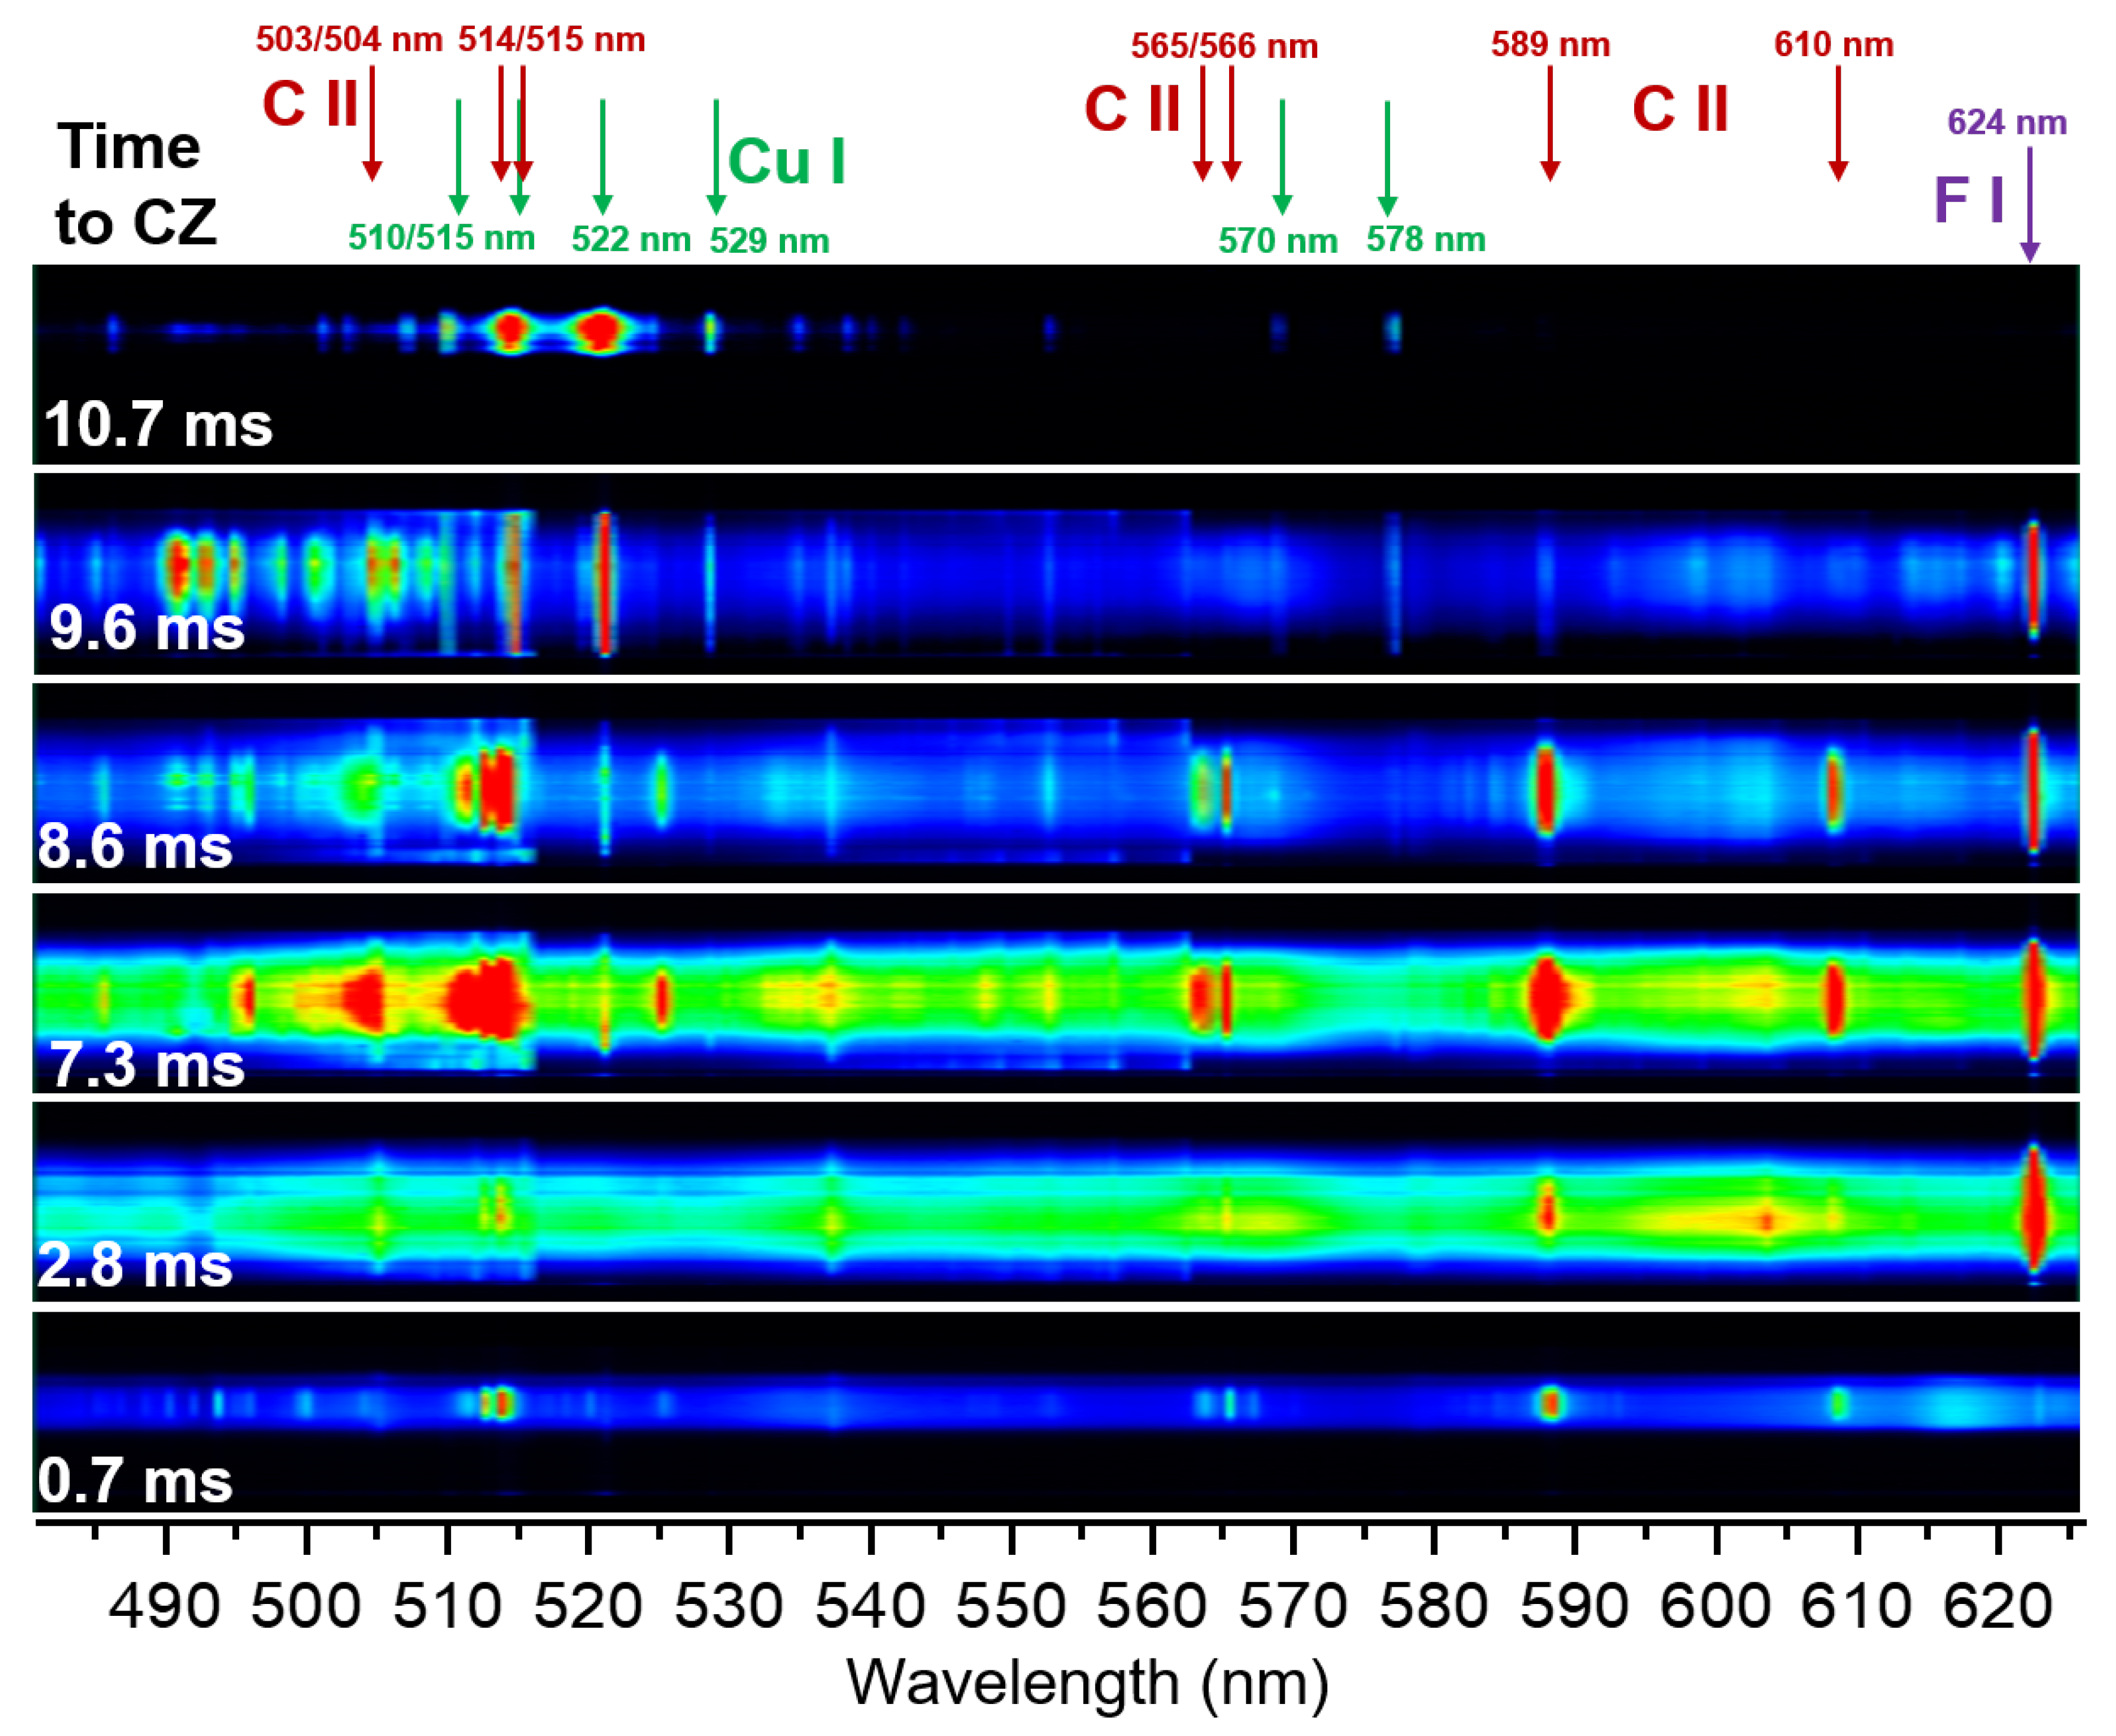
3.2. OES of High-Current Phase Using High-Speed Camera

Series of two-dimensional spectra were obtained by means of video spectroscopy, allowing to investigate the different phases of the discharge within one acquisition (setup (b) with same conditions as above). This is illustrated in Figure 5 where six selected frames of one shot are shown exemplarily. The vertical dimension of each frame is related to the spatial distribution of the arc cross section along the nozzle slit whereas the spectral distribution is represented by the horizontal dimension. Please note that the full video is available as Supplementary Material to this article. The major lines and the time in relation to current zero are labeled above and on the left, respectively. For line classification, energy levels, transition probabilities, and other information on spectral lines the databases from NIST [21] and Kurucz [22] were applied. The spectra are dominated by atomic and ionic line emission from Cu, C, O, and F; the highest intensities are found in the central part of the axis. Temperature profiles can be determined along most of the arc radius based on these lines. In cases of significant nozzle ablation, usually F I or C II lines were utilized [11,12,17].
The first spectrum with detectable light emission acquired during the initial phase (10.7 ms before CZ) is characterized by the exploding ignition wire made of copper. Thus, only atomic Cu I lines are visible (labeled by green arrows). Obviously, the wire position was slightly off-axis for this shot. Although an influence of the ignition wire can be proved to last up to 1 ms, the bright peak is much shorter, typically below 100 μ s [16]. Next, the filling gas CO 2 causes an additional emission of carbon ionic C II lines (red) and of the oxygen lines (O I at 777 nm, not shown here). This emission was found to be visible in OES after 100–220 μ s. Under extreme conditions, i.e., for the setup (a) with the tubular PTFE nozzle exposed to high peak currents of 11 kA at 100 Hz, the lines of Cu I, C II, and O I can have intensity peaks already at 300–400 μ s after ignition, while the F I emission (from PTFE) starts at about 300–400 μ s after ignition [16].
Further emission of Cu I lines can be observed due to erosion of the W–Cu electrode, cf. the second spectrum at 9.6 ms before CZ. Here, the Cu I emission is still intense and distributed over the whole nozzle diameter. Additionally, rather weak carbon ionic as well as much brighter atomic fluorine lines (F I at 624 nm only in this spectral range) are visible. Although the influence of CO 2 is strongly decreased at 9.6 ms to CZ as it is known from the DFO investigation and plasma composition calculation, a ratio in particle density of about 1:2 of carbon to fluorine can be expected (C 2 F 4 are the building blocks of PTFE). The transition probabilities of the line emission are roughly comparable, e.g., summarizing to about 10 × 10 7 s 1 for three C II lines at 609/610 nm and about 3 × 10 7 s 1 for the F I line at 624.0 nm. Considering the much stronger F I emission this means that excitation of F I with upper level at ∼14 eV is much more pronounced than an ionization of carbon atoms and excitation of C II with ∼24 eV.
The third spectrum at 8.6 ms before CZ is acquired in the phase of increasing PTFE nozzle ablation that causes a stronger emission of both atomic fluorine and carbon ionic lines. Furthermore, the C II and F I lines have comparable intensities, indicating more ionization and excitation of the C II levels than before and thus, considerable higher temperatures of the arc. The vanishing Cu I indicates that the metal vapor from electrode erosion is blown “backwards” by the new established flow of hot, ablated nozzle material.
Approaching the peak current (7.3 ms before CZ), continuum radiation can also be observed. On the one hand, there is a very broad continuum over the whole spectral range that is mainly emitting in the center of the arc. On the other hand, there is a pattern of many lines (often not resolved with this spectral resolution) of increasing intensities with increasing wavelengths until rather sharp edges, e.g., at 516 and 563 nm. This structure could be attributed to an emission of diatomic carbon molecules, i.e., the Swan band system arising from transitions between the d 3 Π g and the a 3 Π u electronic states of C 2 molecules. These Swan bands will be discussed later in detail. It should be noted that its spatial distribution ranges over the whole nozzle diameter, partially with peaks near to the nozzle walls.
With decreasing currents, the intensity of ionic C II lines decreases again, the atomic F I line at 624 nm has a much higher intensity at 2.8 ms before CZ whereas the C II lines are much weaker. Similar to the third spectrum at 8.6 ms to CZ, the excitation of ionic states is much less pronounced than that of fluorine atoms with upper levels around 14 eV due to a significantly lowered plasma temperature.
In the following phase of low current, the radiation emitted by the arc plasma no longer causes sufficient wall ablation to sustain the high pressure in the nozzle (cf. spectrum at 0.7 ms before CZ). The consequences are a reversal of the gas flow direction, disappearance of the fluorine line, and a spectrum dominated by C II line emission originating from the back-flowing CO 2 from the heating channel (plus continuum). Furthermore it should be noted that the arc is constricted, i.e., only a rather small part of the radial profile carries a contribution to emission and thus, also to electrical conductance.

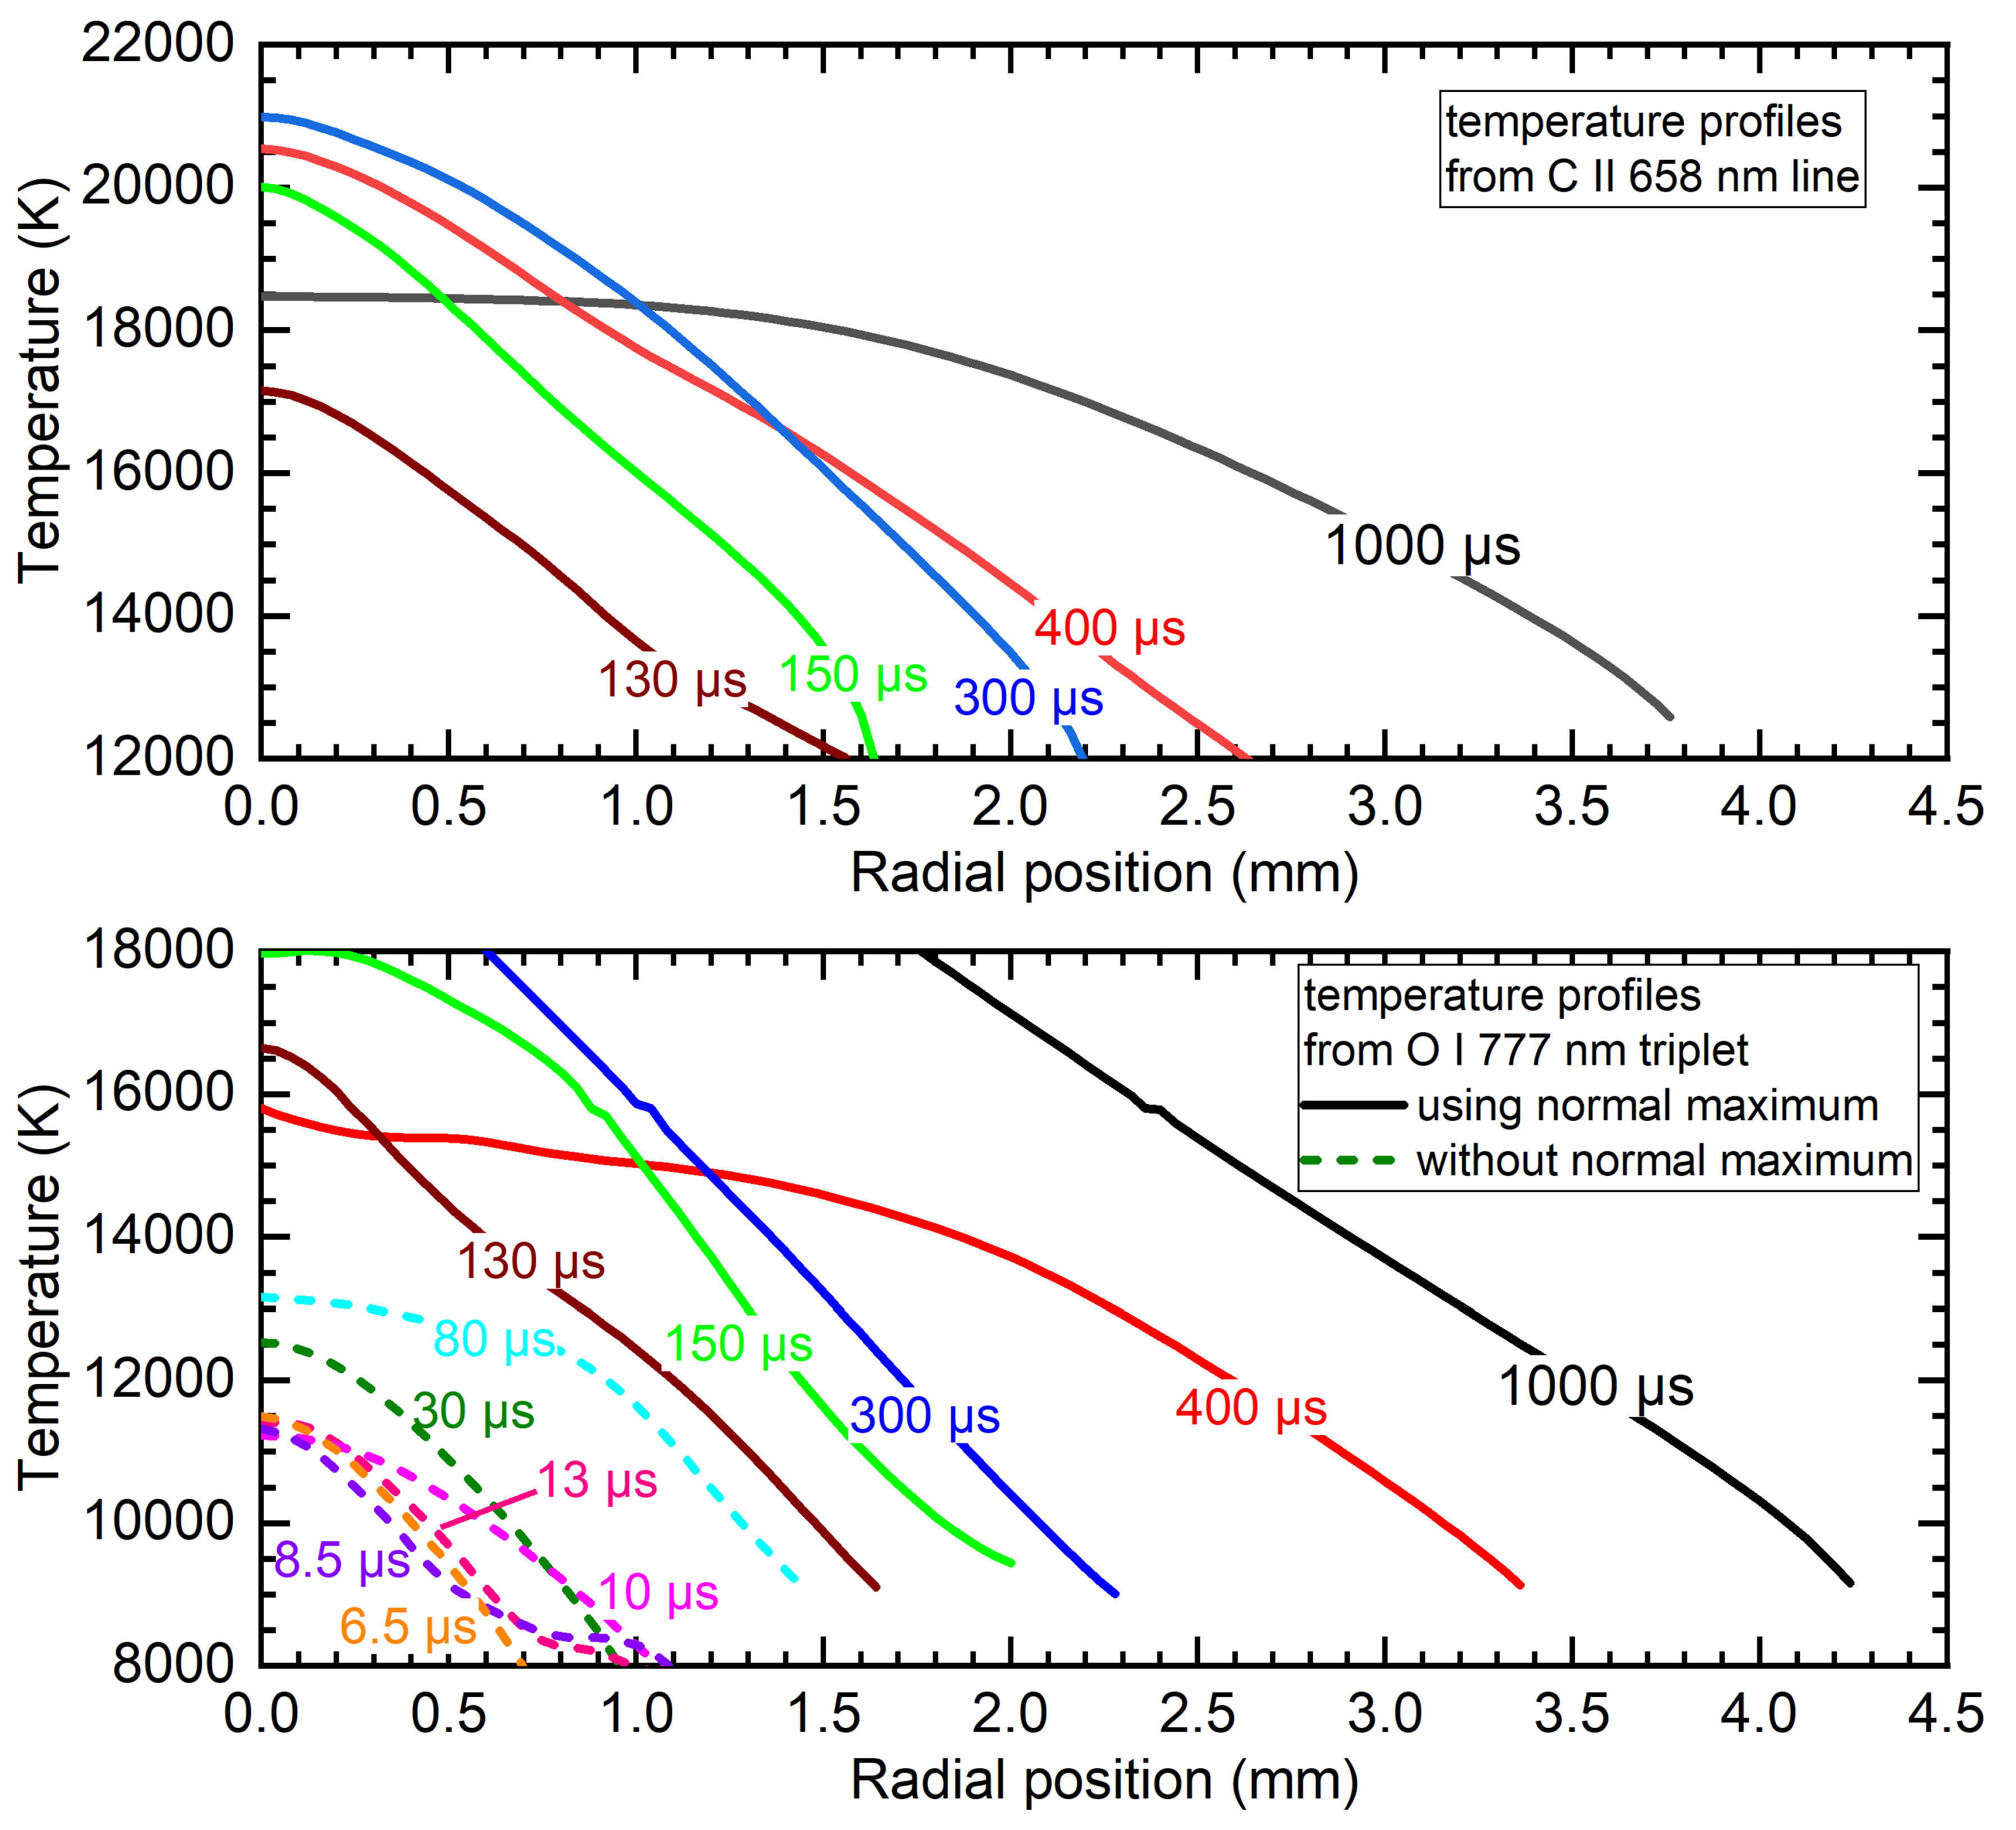
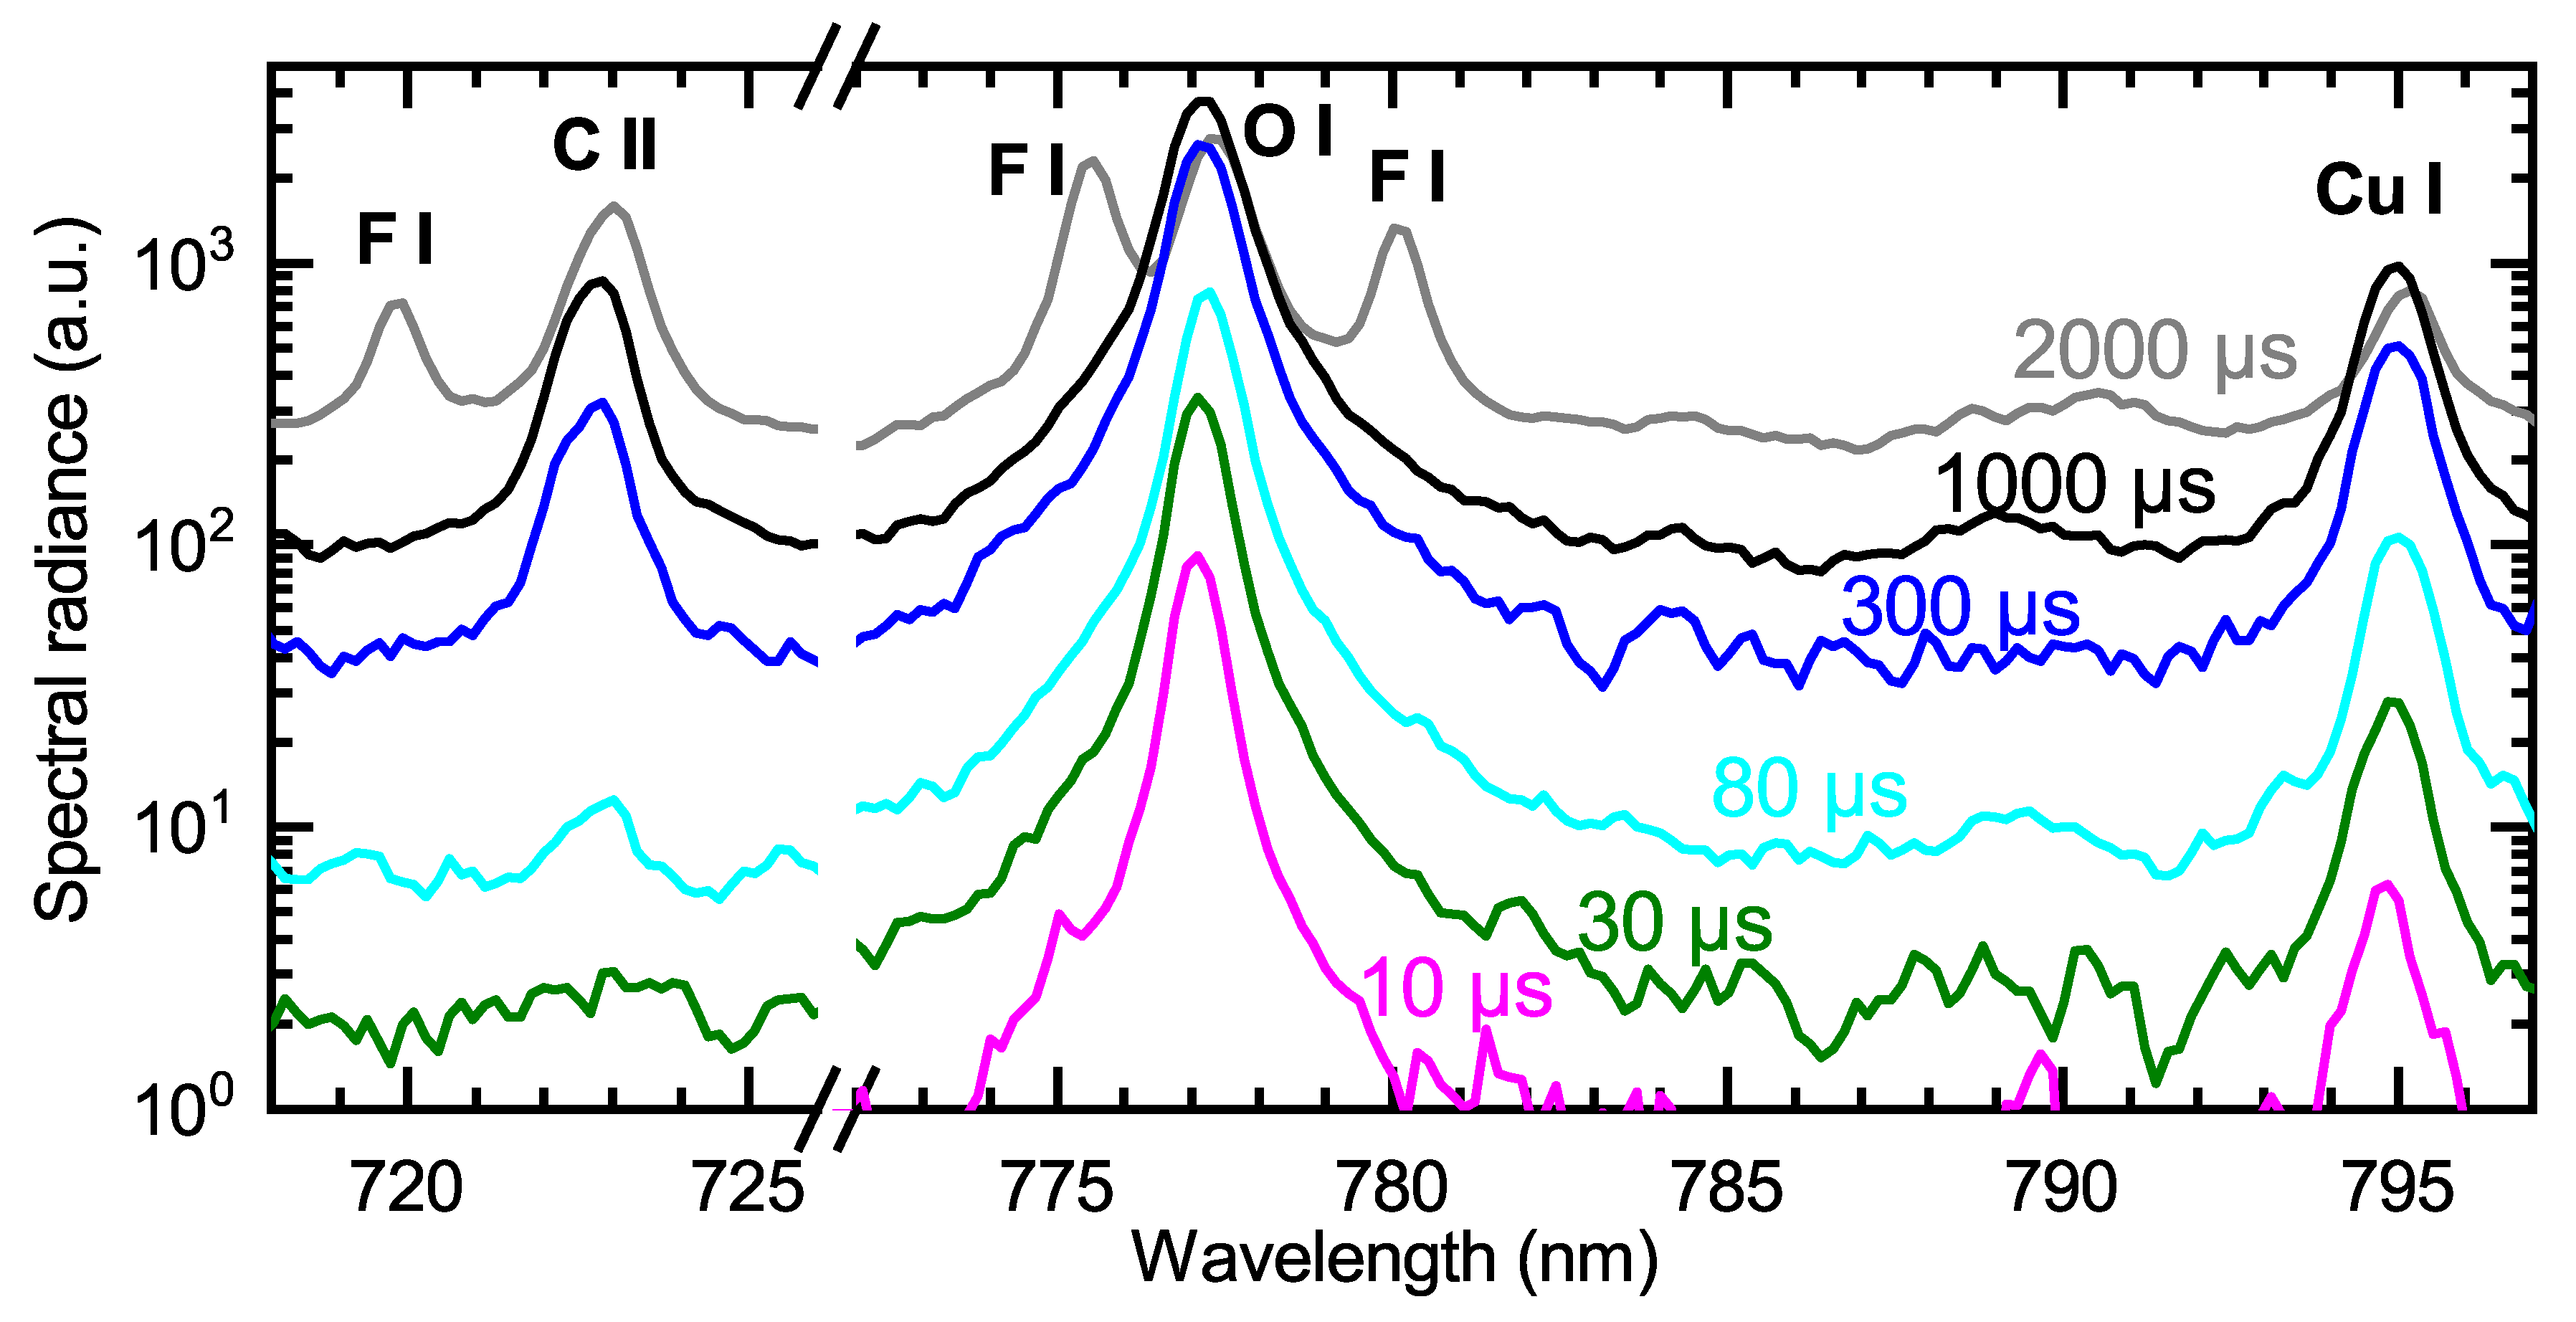
3.3. Optical Emission Spectroscopy near to Current Zero

In the following the phase around current zero will be investigated for both nozzle geometries. Besides, the potential and limits of optical emission spectroscopy shall be discussed. The long, tubular nozzle of setup (a) is used to produce intense and short discharges (11 kA at 100 Hz) that will be analyzed by OES with a high-speed camera (HSC). Investigations with a more realistic setup (b) in the model circuit chamber (5 kA at 50 Hz) will be carried out using OES with an intensified CCD (ICCD) camera to come as close as possible to CZ.

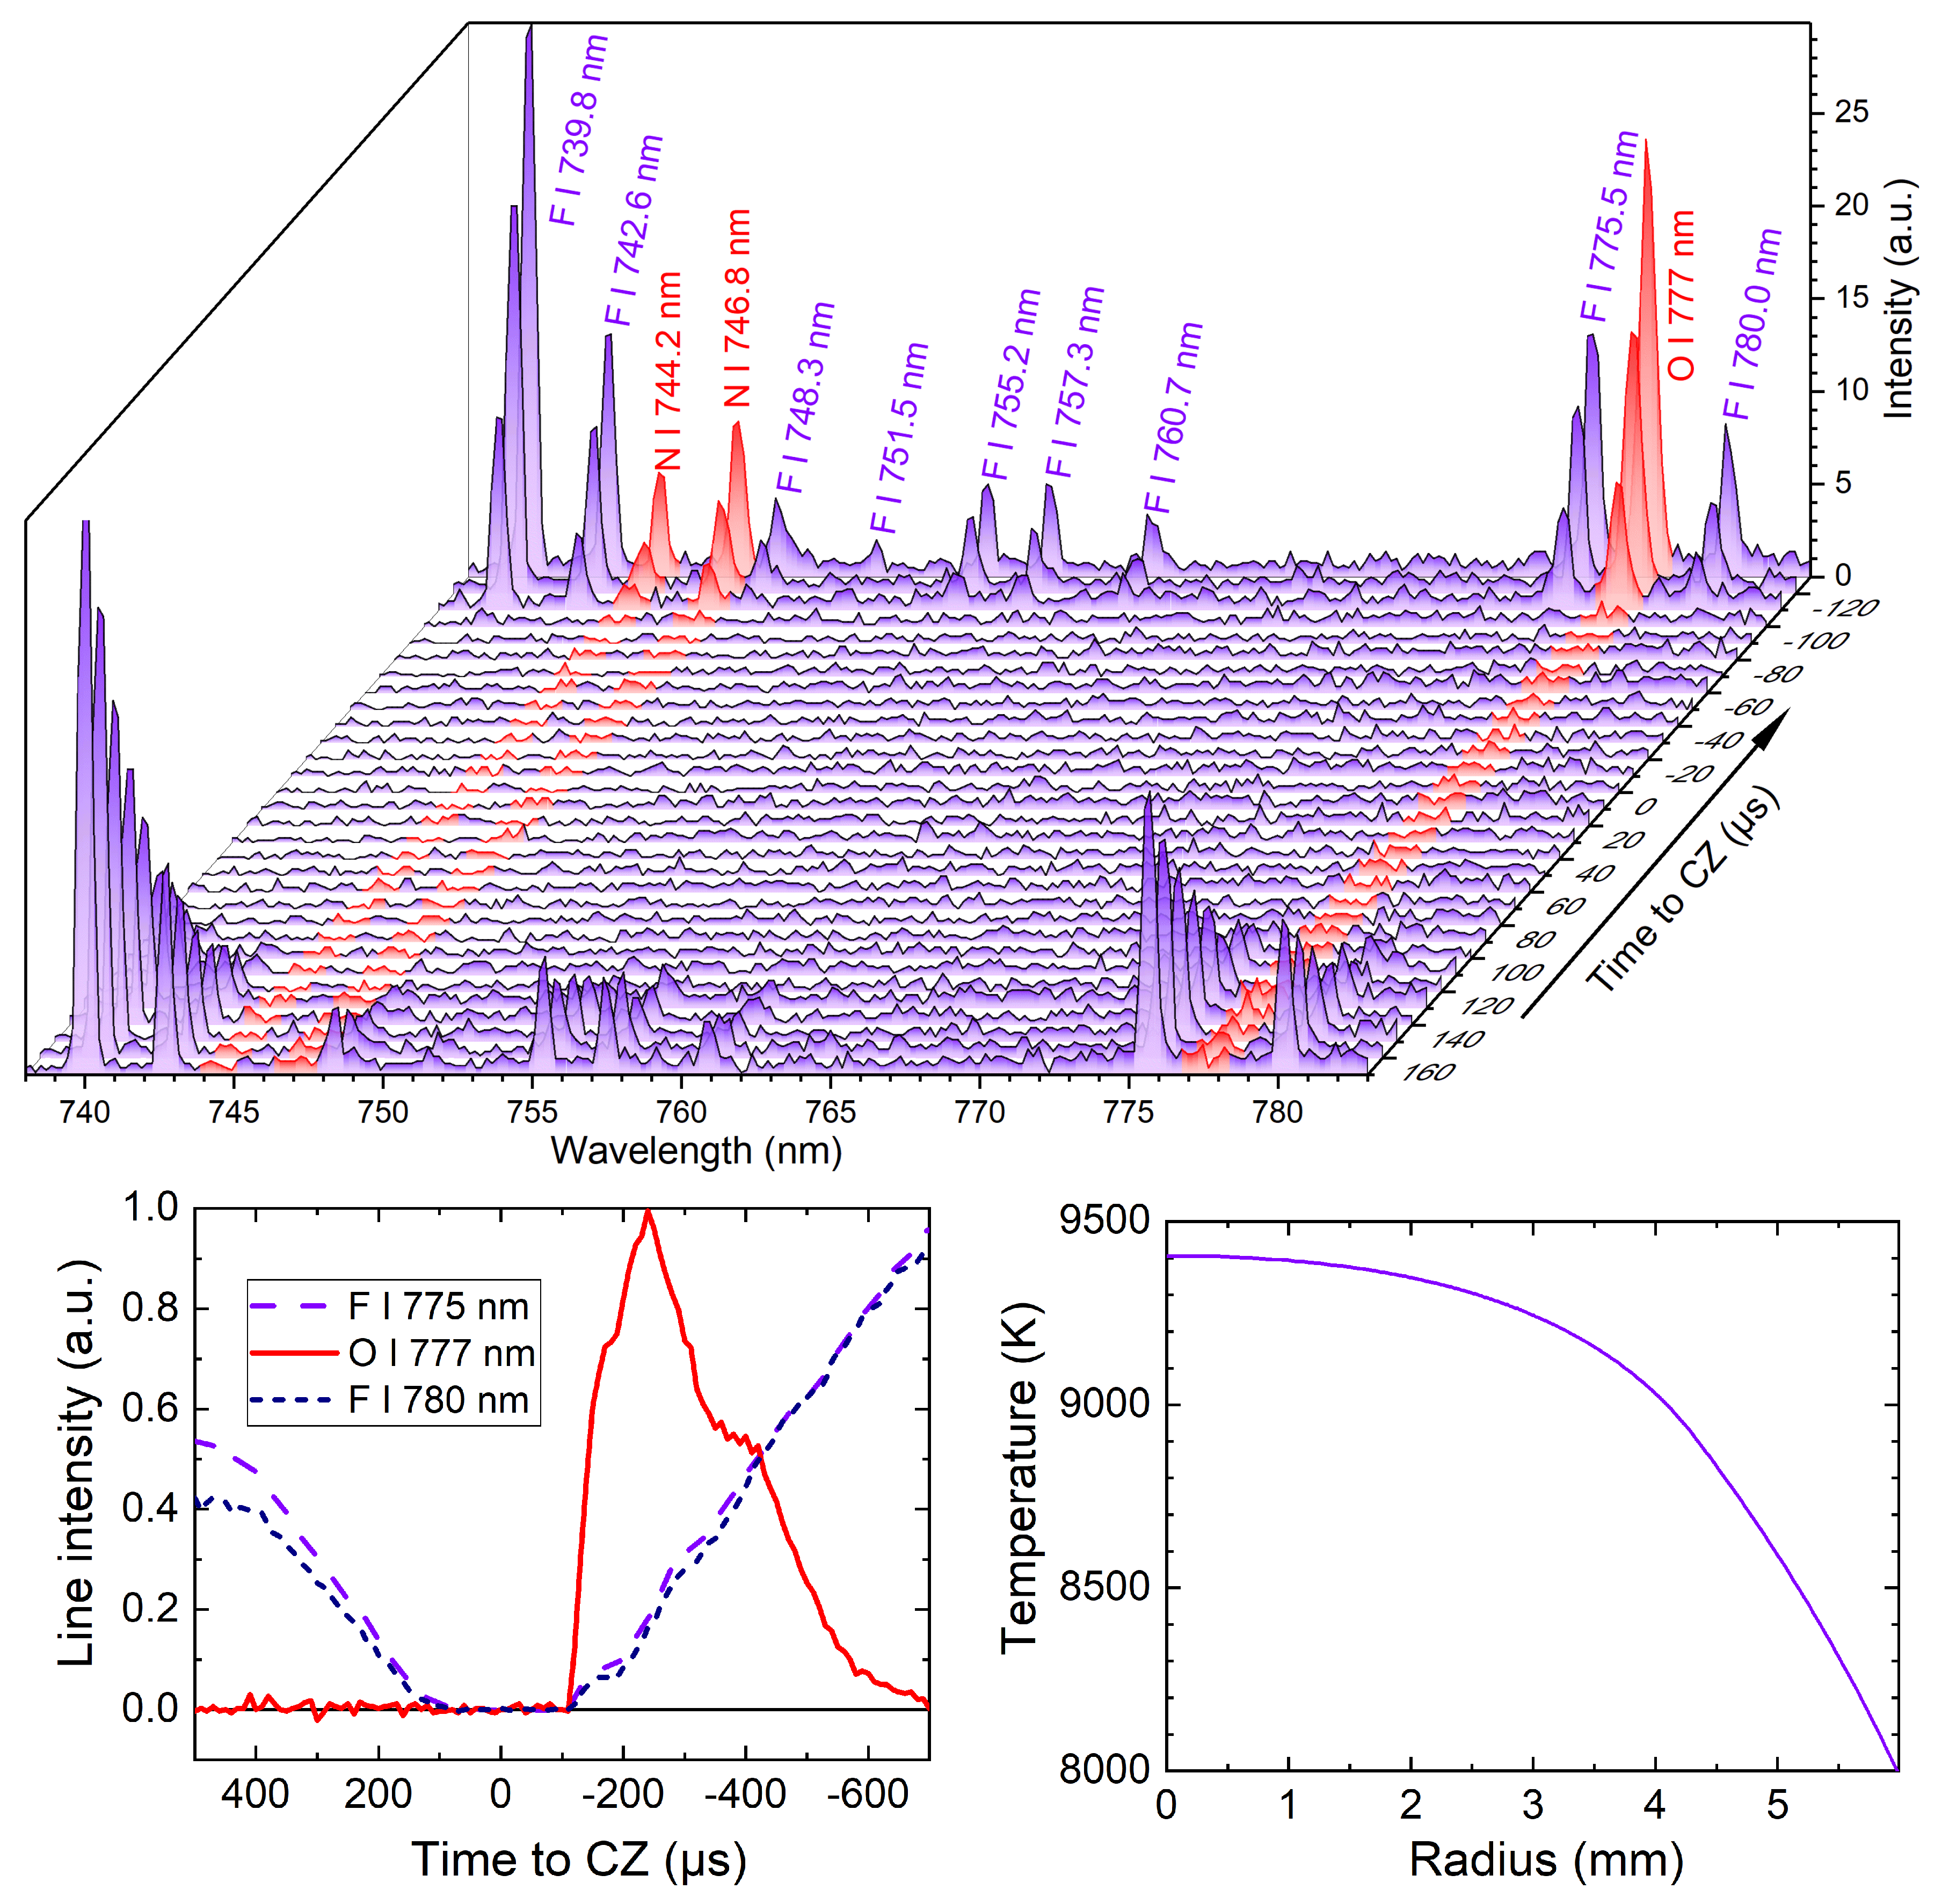
3.3.1. Oes with High–Speed Camera

At first, the case of a current zero phase after an intense arc is considered. A strong PTFE wall ablation and pressure built-up is realized with a higher current of 11 kA peak. Using setup (a), the material flow is directed towards the exhausts at both electrode sides since the tubular nozzle is not interrupted, e.g., by a heating channel. Thus, the plasma is expected to remain relatively hot and dense for a longer time near CZ, at least in the observation position in the middle of the tube. It should be noted that the setup does not perform switching, i.e., the current is continued after CZ with reversed polarity. Additionally, there is only a short period of low current, i.e., it takes only ∼2.5 ms from peak to CZ for 100 Hz. In other words, the best conditions have been chosen for the analysis of the fluorine lines close to CZ.
Concerning imaging spectroscopy with high-speed camera, both temporal and spatial resolution are of interest. However, a limit was given by the detector’s readout rate. Hence, the highest temporal resolution was obtained by a drastic reduction of the number of vertical lines, practically giving up the spatial dimension (side-on information). In the following, only the central position is used to analyze the temporal evolution of the spectrum with a frame rate of 100 kfps (10 μ s repetition rate). In the upper part of Figure 6, the spectral evolution around CZ is shown. It should be mentioned that neither the full spectral range nor all spectra acquired during the discharge are plotted in order to focus on distinguishable lines of the relevant species during the phase around current zero. Some major lines of atomic fluorine as well as oxygen and nitrogen are labeled. Although there were no lines from carbon observed in the diagrammed spectral range (738–783 nm), other lines were checked and confirmed the finding described below, e.g., the ionic carbon lines C II 658 nm and 723 nm.
Among the 30 successive spectra shown in Figure 6, 17 were taken before and 13 were taken after CZ (see timescale at Y-axis and arrow). As expected for an ablation-dominated arc, only the F I lines were found, cf. spectra from 170 μ s to about 100 μ s. The line intensities rapidly faded out due to the low decreasing energy input by the arc. Then a “dark” phase followed without detectable emission starting from about 100 μ s before and lasting until about 100 μ s after current zero. During this dark phase, other spectral techniques would be necessary for investigation of the residual plasma, e.g., intensified cameras for emission spectroscopy or absorption measurements. The first spectra with sufficient intensity after CZ shows a different behavior: Additional lines could be observed, namely the oxygen triplet O I at 777 nm and three N I nitrogen lines around 744 nm. They are marked by red to differ them from the fluorine lines and to prove that they were not detectable before CZ. This demonstrates the back-flow of ambient air containing oxygen and nitrogen into the nozzle after CZ. The temporal evolution of three exemplary lines is shown in the left lower part of Figure 6. It should be mentioned that for this plot first the line integral of each of the three lines was calculated, second the intensity at line edges (lower/higher wavelength) was taken as “line background signal” and subtracted, and finally the intensities of these line integrals were normalized for a better comparison. The two fluorine lines show a very similar behavior, decreasing before and increasing intensity after CZ with comparable falling/rise rates. In contrast, the oxygen lines (triplet 777 nm) have an intensity of background level during all times before and until 100 μ s after CZ. Then they rise up very fast, i.e., from zero to a maximum level within about 100 μ s. A slower decrease follows however, they can be detected until 500–600 μ s. Thus, for both the ignition phase as well as the current zero crossing, it can be stated for the high current and setup (a) that the arc plasma needs about 0.5–1.0 ms to be completely dominated by the ablated wall material and the influence of the surrounding gas can be neglected—at least under ambient conditions of one bar air.
The next step is the determination of radial temperature profiles as close as possible to current zero with HSC. Hence, sufficient spatial resolution is required. Therefore, the number of lines used for the two-dimensional spectra was increased to 600. As a consequence, the repetition rate and thus, the temporal resolution had to be reduced to 133 μ s and 7500 fps, respectively. Hence, the dark phase is reduced to one spectrum only. Furthermore, there are two spectra directly before CZ with an emission sufficient for F I line detection but not for plasma temperature determination due to restrictions in the signal-to-noise ratio. The third spectrum, i.e., 400 μ s before CZ, could be applied. An absolute intensity calibration of the 2D spectrum was done by means of a tungsten ribbon lamp. Then Abel inversion was carried out to obtain radially resolved emission coefficients under the assumptions of an optically thin plasma and rotational symmetry of the arc. Finally, radial temperature profiles were determined assuming a plasma composition of 100% C 2 F 4 at atmospheric pressure (no contribution from electrodes or air) and local thermodynamic equilibrium. Several fluorine lines were applied for comparison, yielding similar results. The temperature profile shown in the right part of Figure 6 has a maximum of 9400 K in the arc center and is rather broad: Even at a radial position of about 4 mm, i.e., 2 mm away from the nozzle wall, the temperature is still around 9000 K. In close vicinity to the wall, it decreases rapidly to values around 8000 K.

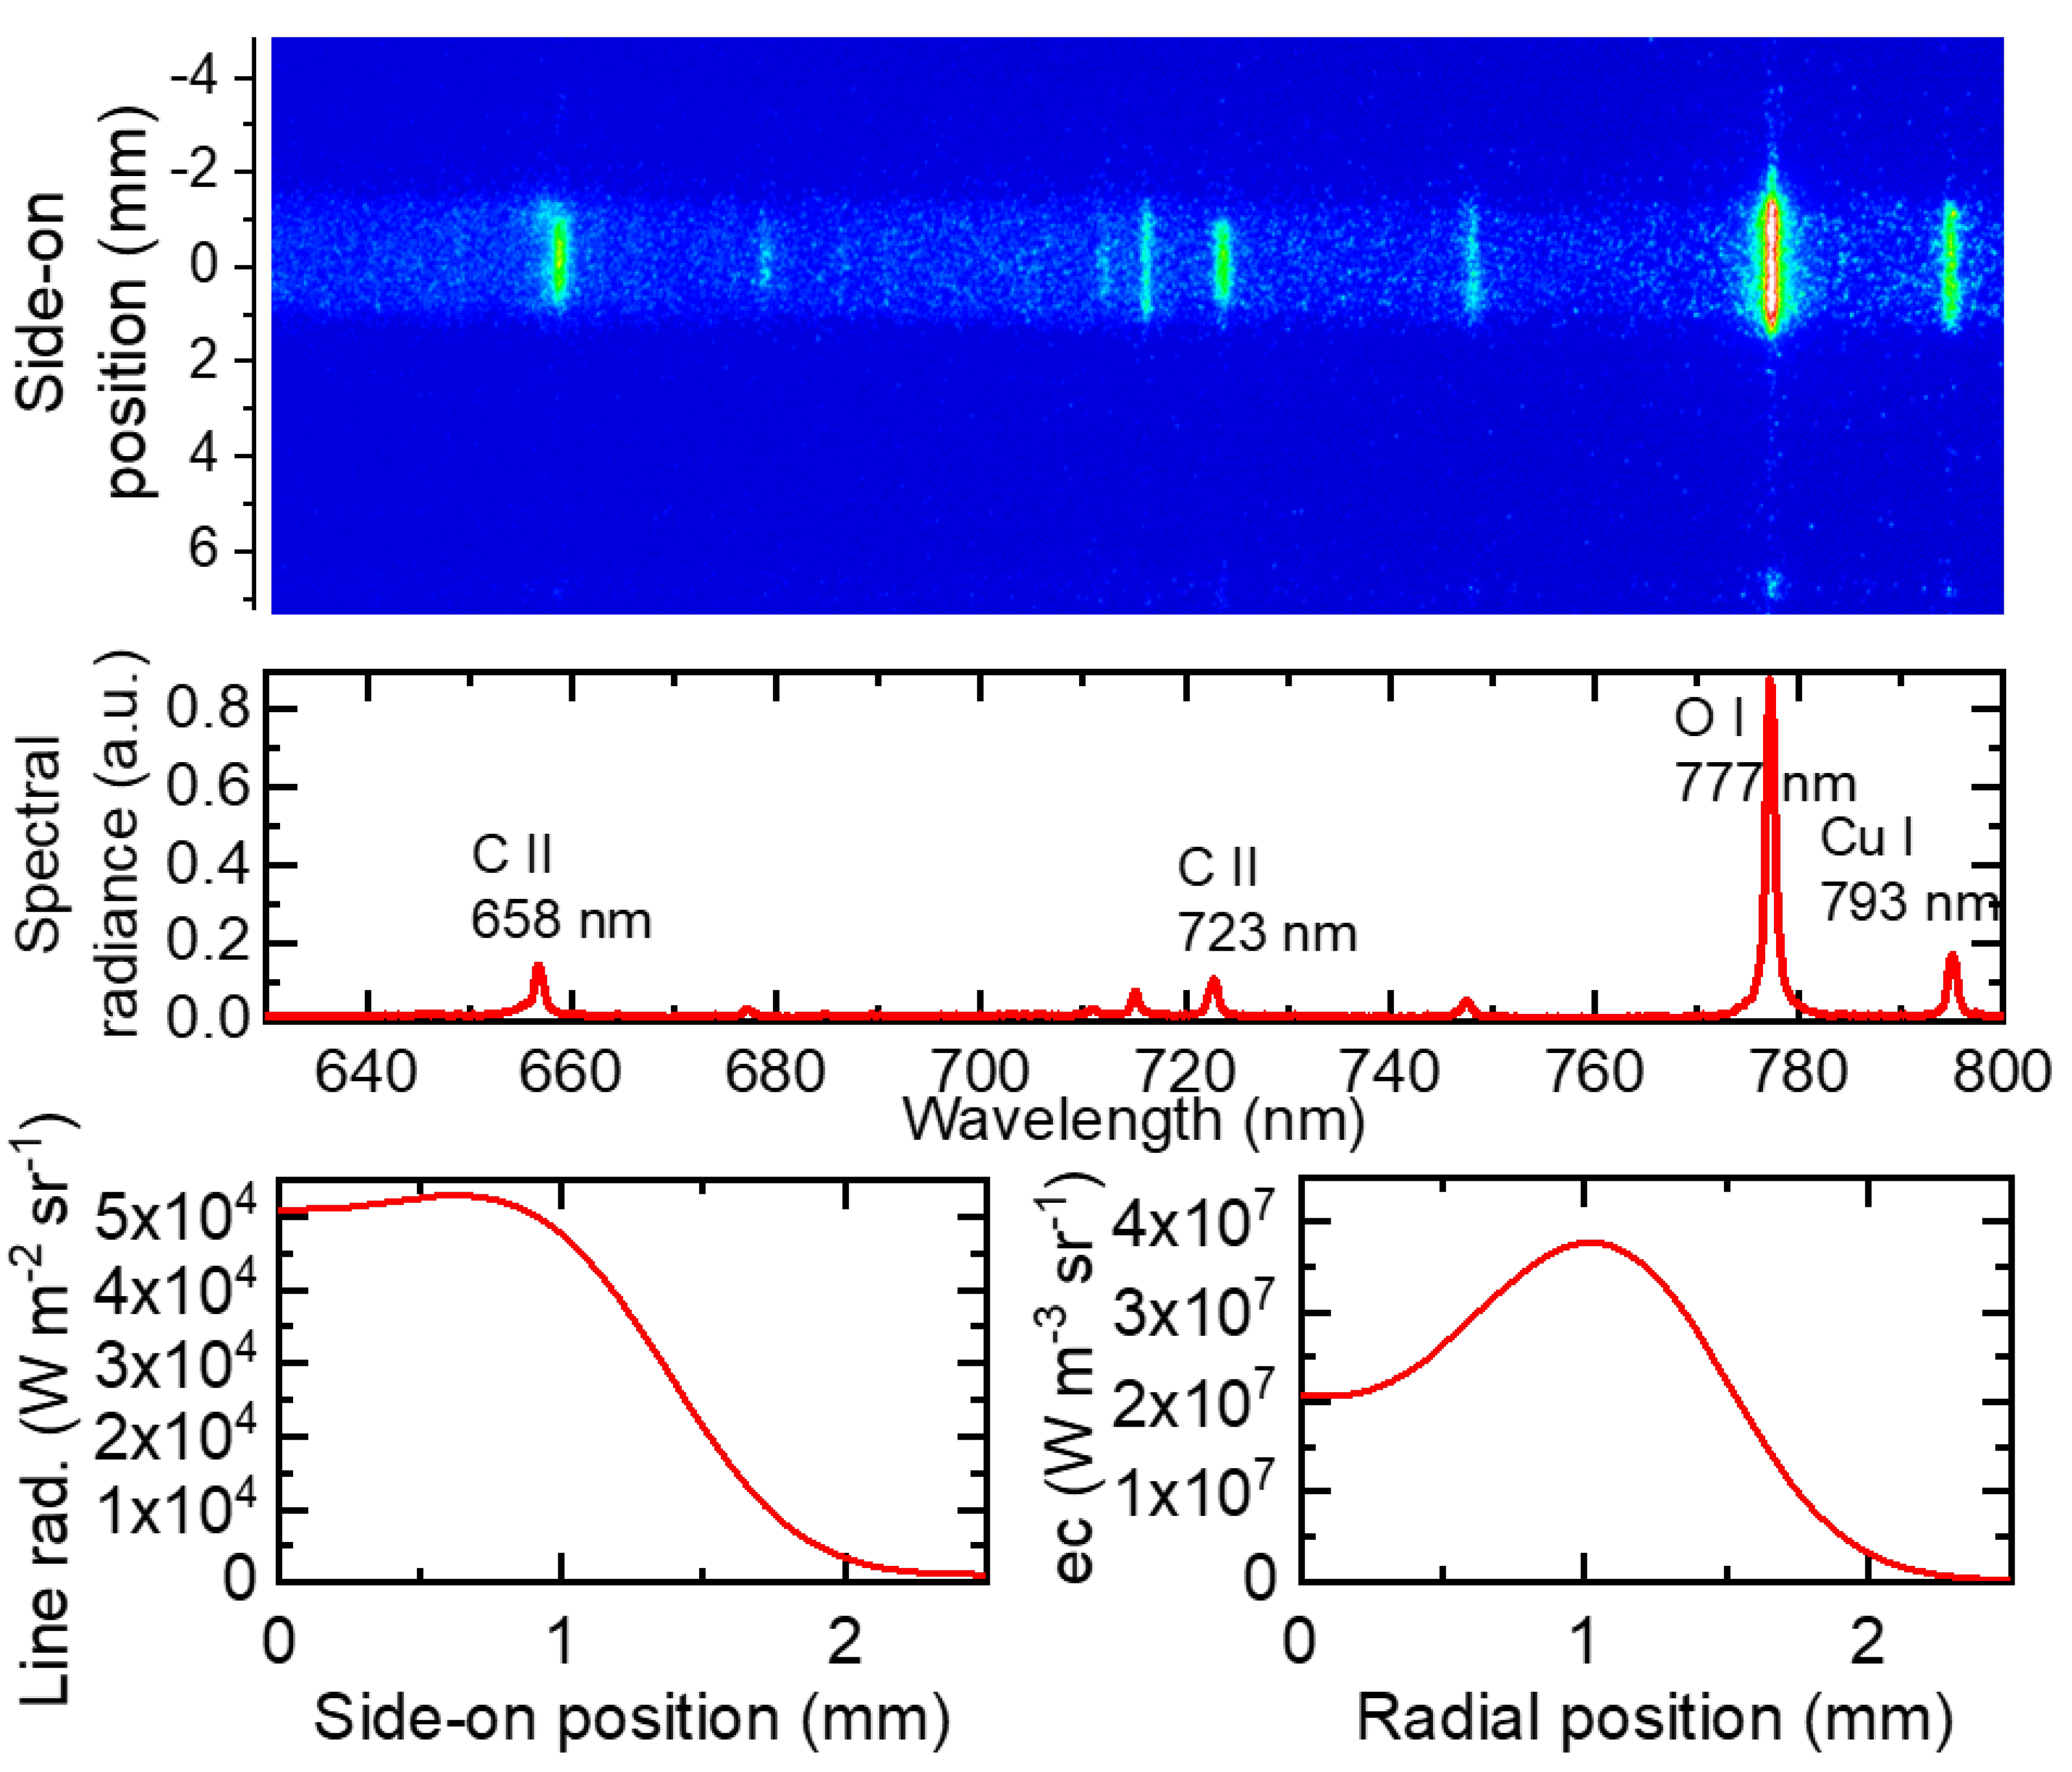
3.3.2. OES with Intensified Camera

The case of a current zero phase shall be investigated under the more realistic setup (b) in the model circuit chamber filled with 1 bar CO 2 (5 kA at 50 Hz). The high–speed camera is replaced by an ICCD camera (Additionally, also a video file was added as Supplementary Material to this article (wavelength range 774.5–781.5 nm). It shows the change from oxygen to fluorine line emission and back, but lacks of temporal resolution and intensity close to CZ). Thus, an improvement in sensitivity can be demonstrated as a side effect. An example of a two-dimensional spectrum is shown in the upper part of Figure 7. It was acquired 300 μ s before CZ with an exposure time of 200 ns. The vertical axis comprises the full nozzle cross section with a diameter of 12 mm.
Obviously, the arc was contracted to a few mm due to the low current (<500 A) and was slightly shifted upwards, i.e., not in the center of the nozzle. For further analysis, the symmetry axis had to be shifted by about 1.5 mm from the nozzle center to the central position of the arc. Thus, symmetrization of the two sides (“upper” and “lower”) can be carried out, providing a side-on spectrum with spatial dependence from central to outer side-on positions. The spectral radiance for the position of the arc center is given as a 1D-spectrum in the middle of Figure 7. Due to the CO 2 gas filling, atomic oxygen (O I 715 nm, 777 nm), and ionic carbon (C II 658 nm, 723 nm), lines are found but none from fluorine, e.g., F I at 775.5 nm and 780.0 nm. In general, F I lines could definitely be detected at 2 ms but never at 1 ms or less before CZ under these conditions. This will be illustrated later, cf. the collection of spectra at different times before CZ in Figure 9. This is a consequence of the different setup and lower arc current compared with the case described above (lower peak current of 5 kA instead of 11 kA, and longer duration of the half-wave of 10.7 ms instead of 5 ms), yielding less vapor from PTFE ablation. Additionally, atomic copper line emission Cu I 793.3 nm was observed.
Both the ionic carbon and atomic oxygen lines were used for the analysis of the radial temperature distribution. In the following, the procedure will be described for the oxygen triplet. At the first step, an absolute intensity calibration was carried out. Secondly, the total radiation flux of the O I 777 nm triplet was obtained by spectral integration over the line (∼775–780 nm with correction using left and right background) for each side-on position and the resulting line radiance in units of W m 2 sr 1 is plotted in the left bottom of Figure 7). This side-on profile was found to be rather flat in the first millimeter beginning from the central position and to decrease practically to zero within another millimeter. Although the arc center was not in the nozzle center, it could be assumed that the main path of current flow has sufficient rotational symmetry for the application of an inverse Abel transformation. Hence, in the third step the radial-dependent emission coefficient ec of the O I triplet could be determined as shown in the right bottom of Figure 7. A distinct maximum of ec was found at a radial position of R m a x 1 mm, towards the arc center ec decreased again though higher temperatures are to be expected there. Such a behavior gives hint that the “normal maximum” of the emission coefficient for a line transition is reached. This maximum results from ionization, which decreases the available number of atoms to be in an excited level with increasing temperature. For a better illustration, the temperature dependence of the emission coefficient is plotted in the left part of Figure 8. It was calculated on the base of NIST data for different pressures of pure CO 2 assuming optically thin plasma. The normal maximum was found to be around 16,000 K with only weak dependence on the pressure, see the right part of Figure 8. It should be noted that the maximum emission coefficient has nearly a linear dependence on the CO 2 pressure since it principally reflects the density of the radiating species.
As a fourth step to temperature profiles, plasma temperatures can be obtained from the experimentally determined emission coefficients by comparison, with the calculated values in Figure 8. Therefore, in the case of experimental ec from the “outer” part of the arc, i.e., values for radial position r > R m a x , the left wing of the curve (“rising” = temperatures below normal maximum) has to be applied, while for the arc center r < R m a x the right wing is valid (“falling” = temperature above normal maximum). Knowing the pressure and plasma composition, an absolute value of the emission coefficient would not be mandatory. Hence, the absolute intensity calibration gives additional information and allows one to validate the experimental methods and assumptions. In general, the highest experimentally determined emission coefficients fitted best to the calculated normal maxima for a plasma composition of pure CO 2 with 1.2 bar total pressure. The ionic carbon line C II at 658 nm shows the normal maximum at around 22,000 K. The experimentally obtained ec did show no indication for temperature above the normal maximum, which proves that double ionization was rather improbable in accordance with earlier studies. Hence, for C II only the left wing with “rising” ec were applied. However, the experimentally obtained emission coefficients are higher than the normal maximum calculated for a pressure of 1.2 bar in pure CO 2 (the assumption used for the evaluation of the O I triplet). This is an indication that an additional amount of carbon is in the gas mixture, eventually originating from the delayed evaporation of carbon soot particles produced during nozzle ablation. Because the gas composition and pressure could not be determined accurately, pure CO 2 but with an enhanced pressure of 2 bar (close to the results of CFD simulations) was assumed for the evaluation of the ec of the C II line.
Spectral radiance for different instants of time before current zero are shown in Figure 9. For a better visibility, only parts of the spectral range, comprising the most relevant lines and six selected spectra are plotted. A logarithmic intensity scale is used to show the enormous decrease of line intensities, e.g., by about 2 orders of magnitude for O I and Cu I. Note that the exposure time had to be increased from 0.2–0.5 μ s to 2.0 μ s for all spectra closer to CZ than 150 μ s due to the decrease of intensity. Fluorine atomic lines were found only in the gray spectrum acquired 2 ms before CZ, proving that under the conditions of this setup and current waveform the influence of ablated wall material was negligible ≤ 1 ms before CZ. Carbon ionic lines could be detected until 80 μ s before CZ whereas atomic oxygen and copper lines were visible in all spectra.
The radial temperature profiles for five shots obtained from the emission coefficient of the C II at 658 nm considering 100% CO 2 gas at 2 bar are plotted in the upper part of Figure 10. Only times of 1 ms or less before CZ were taken into the analysis, i.e., the spectrum at 2 ms was excluded due to the F I lines indicating still PTFE admixtures. The spectrum acquired 1 ms before current zero resulted in a broad and flat temperature profile. The temperature between the arc center and 1.5 mm was more or less constant around 18,000 K. Then it was continued with a slow decrease to about 12,000 K at a radial position of nearly 4 mm, e.g., 2 mm away from the nozzle wall. This is typical behavior of a wall-stabilized arc at moderate current. For the following spectra, i.e., taken after 400 and 300 μ s before CZ, two effects could be observed: (i) A considerable decrease of the arc diameter by nearly a factor of two that was accompanied by (ii) an increase of the core temperature to values above 20,000 K. Hence, a transition from the broad profile due to wall-stabilization to smaller, constricted profiles occurred. Since the arc current did not decrease as quickly as the square of the arc diameter, the core temperature had to be increased to provide a sufficient current density. In the following period, i.e., for times 130–150 μ s before CZ, a further decrease of the arc diameter was found however, the maximum plasma temperature in the arc core could also be decreased due to further current decrease. Spectra acquired at less than 100 μ s before CZ had too low intensities of the C II ionic line to allow for a determination of reliable temperature profiles.
In the lower part of Figure 10, radial temperature profiles for numerous shots obtained from the O I triplet at 777 nm are plotted. Here, an emission coefficient for 100% CO 2 with a 1.2 bar total pressure has been considered for the temperature determination. In agreement with the results for the C II line, the broadest profile with the highest temperatures was obtained for 1 ms. Here, the position of the normal maximum connected with a fairly established temperature of 16,000 K was obtained at about 2.5 mm. Although the maximum temperature exceeded 20,000 K only values till 18,000 K were plotted due to higher uncertainties for the central position. However, the plasma temperature was still about 10,000 K even at a radial position of 4 mm, i.e., the arc was spread over most of the nozzle area (12 mm diameter). For the following profiles, the effect of temperature increase in the core was not as clear as above for C II. Though some profiles do not perfectly fit into the generally smooth decreasing behavior, the general tendency was that both arc diameter and maximum temperature in the center decreased continuously with the decreasing current. The above described method based on the normal maximum of the oxygen triplet could be applied to all spectra taken ∼100–1000 μ s before CZ. For the remaining spectra (<100 μ s) the experimental emission coefficients were below the normal maximum. Hence, the common single-line method was applied using only the left (“rising”) wing of the curve from Figure 8. These temperature profiles are plotted as dashed curves in Figure 10. The tendency to smaller profiles with lower peak temperatures can be followed until about 10 μ s before current zero, i.e., at very low currents of few tens of amperes. Although spectra (of 2 μ s exposure time) were taken at varying times of 13, 10, 8.5, and 6.5 μ s before CZ and the exact acquisition times were measured by a comparison of current waveform and a monitor signal from the ICCD camera, nearly the same results were obtained for all four shots: A temperature maximum slightly above 11,000 K and a decrease to 8000 K within ≤1.0 mm. Here, the experimental limit is reached with possible changes in the temperature profile superimposed by shot-to-shot variation of the discharge itself, window transmission, and uncertainties in determination of the emission coefficient. As a control, another spectrum was acquired at current zero (from 1.0 μ s before CZ to 1.0 μ s after CZ) however, only the noise was recorded.

4. Discussion

4.1. General

An ablation-dominated arc of 5 kA peak current was operated in a model circuit breaker with a CO 2 atmosphere. The application of a slit over the full radius of the PTFE nozzle enabled a direct investigation inside the nozzle. This was substantial progress in comparison with previous measurements that potentially suffered from an influence of turbulent gas flow in the heating channel [17]. Sealing by thin quartz plates proved to be a useful method to obtain reproducible conditions of discharges without significant changes of material flow or plasma conditions. Consequent exchange of the plates after each shot yielded high window transmission with moderate blackening. An averaged overall transmission of about 50% was estimated along the observation axis made of the quartz plate in the nozzle and windows of the MCB chamber as well as the high-pressure vessel. The shot-to-shot variation was usually about 10 %. Nozzle ablation caused a widening of the nozzle diameter and thus a slow reduction of maximum pressures over many shots. Therefore, the PTFE nozzles were exchanged regularly. Only very few cases of reduced sealing quality occurred, easily noticeable after discharges due to increased blackening at the plate’s corners. These shots had be repeated with renewed sealing.
The assets of different methods for optical investigation were demonstrated. Using high-speed cameras the general arc behavior was investigated, e.g., revealing rotational symmetry over the whole nozzle diameter in the high-current phase but not close to current zero when the stabilization by ablation of nozzle wall was lost and the arc was constricted and out of the nozzle center. Besides, the HSC allowed an investigation of many successive points of time within the same shot. Thus, reproducibility was not demanded and dynamic changes, their rising and falling times, and shot-to-shot variation could be easily investigated. Although parameter variation was not the focus of this work, such investigations are rather comfortable using this technique. Furthermore, a combination of HSC with double frame optics was introduced, filtering one channel only for radiation from CO 2 (O I at 777 nm) and the other channel only for emission from PTFE (F I at 675 nm), which allowed us to gain knowledge about the temporal evolution of the plasma composition. In combination with according CFD simulation, gas flow behavior could be analyzed, including the exact determination of the point in time when flow reversal occurred before current zero. In the experiments described here, only qualitative analysis could be carried out. For a quantitative description, more knowledge about plasma composition and absolute intensity calibration would be mandatory [23].

4.2. OES Using HSC

Deeper information was obtained from spatially- and temporally-resolved video spectroscopy using HSC. That comprised of the different phases of discharge and the occurrence of Swan band emission from C 2 molecules that are treated in an accompanying publication [20]. Radial temperature profiles have been determined until 400 μ s before current zero. Assuming a plasma composition of 100% C 2 F 4 at atmospheric pressure, a broad temperature profile has been obtained with a maximum of 9400 K in the arc center and about 9000 K at a radial position of about 4 mm, i.e., 2 mm away from the nozzle wall. Several fluorine lines were applied for comparison, yielding similar results. A “dark window” without detectable emission was observed due to low intensities caused by cold gas flow and low current on the one hand and limitations in the sensitivity of high-speed cameras on the other hand, starting in a best case about 100 μ s before CZ. Furthermore, it could be stated for the high current and setup (a) that the arc plasma needs about 0.5–1.0 ms for both the ignition phase as well as the current zero crossing to be completely dominated by the ablated wall material. The influence of the surrounding gas can be neglected, at least under ambient conditions of one bar air.

4.3. OES with ICCD

The sensitivity of OES was increased by application of OES with an intensified CCD camera, allowing single-shot measurements until a few μ s before current zero. Two lines were used for the determination of temperature profiles of the arc plasma, whereas the ionic carbon line C II at 658 nm has a normal maximum around 22,000 K and therefore better sensitivity concerning temperatures around 18,000–20,000 K, the atomic oxygen triplet O I at 777 nm has its normal maximum around 16,000 K and higher sensitivity at lower temperatures. Off-axis maxima of the radial emission coefficient of the O I triplet were found, indicating temperatures in the arc center above and in the arc fringes below the normal maximum. Hence, the normal maximum can be used for the calibration of the emission coefficient according to the Fowler–Milne method. In addition, the absolute intensity calibration by a radiation normal has been used for verification. The emission coefficient of the C II line was evaluated with absolute intensity calibration only.
As experimental uncertainties of the determined emission coefficients, in particular the window transmission (estimated to 50% ± 10%), adjustment of slit width (50 ± 5 μ m), performing absolute intensity calibration (uncertainty up to 20%), and pressure measurement (uncertainty up to 10%) have to be considered. It is an advantage of the applied method for the O I triplet that the normal maximum is independent from influences by transmission, absorption, and absolute intensity calibration. Therefore, the uncertainty of the temperature determined from O I is low around the normal maximum of 16,000 K as well as in the range of 10,000–14,000 K (up to 10%) due to the exponential intensity rise with temperature. However, reliable temperatures above 20,000 K cannot be determined from the O I triplet. An important factor is the remaining uncertainty of the gas composition and the partial pressure of carbon and oxygen. Pressure measurements showed a shot-to-shot variation between 0.2 and 0.4 bar, and the fitting of the emission coefficients of the C II line and the O I triplet with respect to the corresponding normal maximum in pure CO 2 lead to the different pressures 1.2 and 2 bar. But considering the relatively low variation of the temperatures at the normal maxima with pressure, the uncertainty of the plasma temperatures at least around the normal maximum is below ±200 K. For times closer than 100 μ s to CZ, where the emission coefficient of the O I triplet could be evaluated by absolute intensity calibration only, the uncertainty depends on the rise of line emission coefficient with temperature. For temperatures below 11,000 K, the emission coefficient is possibly underestimated by factor 2 in maximum, which causes an underestimation of temperature by 900 K.
It has been found that the arc was rather broad at 1000 μ s and 400 μ s before CZ in agreement with the observations of wall-stabilization. In the following, arc constriction was observed. Despite the uncertainties discussed above, it can be stated that the maximum temperature decreased from above 18,000 K at 300 μ s to about 11,000 K at 10 μ s before CZ.

5. Conclusions

The main challenge concerning optical investigations of ablation-dominated high-current arcs close to current zero is a low intensity of the emitted radiation. Therefore, different techniques of high-speed camera (HSC) imaging with or without filtering and optical emission spectroscopy (OES) were introduced and their assets and limitations were discussed. It was shown that some important effects can be analyzed even with rather simple nozzle experiments, applicable to other groups and setups.
Two setups were used: With the first setup, experiments with a long, tubular nozzle were applied on to study the CZ transition including new re-ignition of the arc. Using OES with HSC, a dark period of 200 μ s around CZ was observed and the differences in spectra before and after CZ were discussed. Radial temperature profiles could be obtained until 400 μ s before CZ. Here, a typical case of a well-established arc was found with a broad temperature profile, characteristic for an arc stabilized by ablation of the nozzle wall.
For the second setup, a model circuit chamber in CO 2 atmosphere was used to study more realistic, praxis-relevant features including flow reversal, arc behavior around CZ, and arc before vanishing. Using OES with an intensified CCD camera, higher sensitivity was realized allowing the determination of temperature profiles. Whereas ionic carbon lines were applied mainly for quantitative characterization at higher temperatures until 100 μ s, atomic oxygen lines delivered quantitative profiles until a few microseconds before CZ with a higher sensitivity at lower temperatures. Generally, a transition was observed in the arc behavior. Until several hundred microseconds before CZ, the arc was wall-stabilized with a broad and rather flat temperature profile. After vanishing of wall stabilization and inflow of cold gas, a highly dynamic arc appeared that was constricted and asymmetric moving out of center. During the transition, the maximum temperatures in the core increased to yield higher current densities for the constricted arc.
In future work it will be important to combine the experimental results and modeling concerning temperature profiles, composition calculation for a determination of current density.

Supplementary Materials

The following are available online at https://www.mdpi.com/1996-1073/13/18/4714/s1, Video S1 (DFO-fig4.mp4): High–speed imaging using double frame optics according to Figure 4. Video S2 (OES-fig5.mp4):Video S2: High–speed imaging optical emission spectroscopy according to Figure 5. Video S3 (OES-fig7.mp4):Video S3: High–speed imaging optical emission spectroscopy around the O I triplet at 777 nm with higher spectral resolution according to Figure 7.

Author Contributions

Conceptualization, R.M. and D.U.; methodology, validation, and formal analysis, R.M.; investigation with setup (a), R.M. and A.K.; investigation with setup (b), R.M., A.K., and N.G.; writing—original draft preparation, R.M. and D.U.; project administration, D.U. All authors have read and agreed to the published version of the manuscript.

Funding

This research was funded by Deutsche Forschungsgemeinschaft grant numbers UH 106/13-1 and SCHN 728/16-1.

Acknowledgments

The authors would like to thank Steffen Franke for experimental help and fruitful discussions. The calculation of plasma composition was realized by Sergey Gortschakow (all Leibniz Institute for Plasma Science and Technology).

Conflicts of Interest

The authors declare no conflict of interest. The funders had no role in the design of the study; in the collection, analyses, or interpretation of data; in the writing of the manuscript, or in the decision to publish the results.

Abbreviations

The following abbreviations are used in this manuscript:
CBCircuit Breaker
CO 2 carbon dioxide
CFDcomputational fluid dynamics
CZcurrent zero
DFOdouble frame optics
ICCDintensified charge coupled device
HSChigh–speed camera
LTElocal thermal equilibrium
MoS 2 molybdenum disulfide
OASoptical absorption spectroscopy
OESoptical emission spectroscopy
PTFEpolytetrafluoroethylene
PMMApolymethyl methacrylate
SF 6 sulfur hexafluoride
W–Cutungsten–copper

References

  1. Seeger, M. Future Perspectives on High Voltage Circuit Breaker Research. Plasma Phys. Technol. 2015, 2, 271–279. [Google Scholar]
  2. Seeger, M. Perspectives on research on high voltage gas circuit breakers. Plasma Chem. Plasma Process. 2015, 35, 527–541. [Google Scholar] [CrossRef]
  3. Glaubitz, P.; Stangherlin, S.; Biasse, J.; Meyer, F.; Dallet, M.; Pruefert, M.; Kurte, R.; Saida, T.; Uehara, K.; Prieur, P.; et al. CIGRE position paper on the application of SF6 in transmission and distribution networks. Electra 2014, 34, 34–39. [Google Scholar]
  4. Christophorou, L.; Olthoff, J.K.; Green, D.S. Gases for Electrical Insulation and Arc Interruption: Possible Present and Future Alternatives to Pure SF6; NIST Technical Note 1425; Nov. 1997; pp. 1–44. Available online: https://www.nist.gov/publications/gases-electrical-insulation-and-arc-interruption-possible-present-and-future (accessed on 9 September 2020).
  5. Robin-Jouan, P.; Bousoltane, K.; Kieffel, Y.; Trepanier, J.Y.; Camarero, R.; Arabi, S.; Pernaudat, G. Analysis of last development results for high voltage circuit-breakers using new g3 gas. Plasma Phys. Technol. 2000, 33, 2583–2590. [Google Scholar] [CrossRef]
  6. Godin, D.; Trepanier, J.Y.; Reggio, M.; Zhang, X.D.; Camarero, R. Modelling and simulation of nozzle ablation in high-voltage circuit-breakers. J. Phys. D Appl. Phys. 2000, 33, 2583–2590. [Google Scholar] [CrossRef]
  7. Wu, Y.; Wang, C.; Sun, H.; Murphy, A.B.; Rong, M.; Yang, F.; Chen, Z.; Niu, C.; Wang, X. Properties of C4F7N–CO2 thermal plasmas: Thermodynamic properties, transport coefficients and emission coefficients. J. Phys. D Appl. Phys. 2007, 51, 155206. [Google Scholar] [CrossRef]
  8. Seeger, M.; Smeets, R.; Yan, J.; Ito, H.; Claessens, M.; Dullni, E.; Falkingham, L.; Franck, C.M.; Gentils, F.; Hartmann, W.; et al. Recent Trends in Development of High Voltage Circuit Breakers with SF6 Alternative Gases. Plasma Phys. Technol. 2017, 4, 8–12. [Google Scholar] [CrossRef]
  9. Stoller, P.C.; Seeger, M.; Iordanidis, A.A.; Naidis, G.V. CO2 as an arc interruption medium in gas circuit breakers. IEEE Trans. Plasma Sci. 2013, 41, 2359–2369. [Google Scholar] [CrossRef]
  10. Guo, Z.; Liu, S.; Pu, Y.; Zhang, B.; Li, X.; Tang, F.; Lv, Q.; Jia, S. Study of the arc interruption performance of CO2 gas in high-voltage circuit breaker. IEEE Trans. Plasma Sci. 2019, 47, 2742–2751. [Google Scholar] [CrossRef]
  11. Kozakov, R.; Kettlitz, M.; Weltmann, K.D.; Steffens, A.; Franck, C.M. Temperature profiles of an ablation controlled arc in PTFE: I. Spectroscopic measurements. J. Phys. D Appl. Phys. 2007, 40, 2499–2506. [Google Scholar] [CrossRef]
  12. Methling, R.; Franke, S.; Uhrlandt, D.; Gorchakov, S.; Reichert, F.; Petchanka, A. Spectroscopic Study of Arc Temperature Profiles of a Switching-off Process in a Model Chamber. Plasma Phys. Technol. 2015, 2, 163–166. [Google Scholar]
  13. Ruchti, C.B.; Niemeyer, L. Ablation controlled arcs. IEEE Trans. Plasma Sci. 1986, 14, 423–434. [Google Scholar] [CrossRef]
  14. Bort, L.; Schultz, T.; Franck, C.F. Determining the time constant of arcs at arbitrary current levels. Plasma Phys. Technol. 2019, 5, 175–179. [Google Scholar] [CrossRef]
  15. Schultz, T.; Hammerich, B.; Bort, L.; Franck, C.F. Improving interruption performance of mechanical circuit breakers by controlling pre-current-zero wave shape. High Volt. 2019, 4, 122–129. [Google Scholar] [CrossRef]
  16. Methling, R.; Khakpour, A.; Wetzeler, S.; Uhrlandt, D. Investigation of an ablation–dominated arc in a model chamber by optical emission spectroscopy. Plasma Phys. Technol. 2017, 4, 153–156. [Google Scholar] [CrossRef]
  17. Eichhoff, D.; Kurz, A.; Kozakov, R.; Gött, G.; Uhrlandt, D.; Schnettler, A. Study of an ablation–dominated arc in a model circuit chamber. J. Phys. D Appl. Phys. 2012, 45, 305204. [Google Scholar] [CrossRef]
  18. Seeger, M.; Tepper, J.; Christen, T.; Abrahamson, J. Experimental study on PTFE ablation in high voltage circuit-breakers. J. Phys. D Appl. Phys. 2006, 39, 5016–5024. [Google Scholar] [CrossRef]
  19. Seeger, M.; Niemeyer, L.; Christen, T.; Schwinne, M.; Dommerque, R. An integral arc model for ablation controlled arcs based on CFD simulations. J. Phys. D Appl. Phys. 2006, 39, 2180–2191. [Google Scholar] [CrossRef]
  20. Methling, R.; Götte, N.; Uhrlandt, D. Ablation-Dominated Arcs in CO2 atmosphere—Part II: Molecule emission and absorption. Preprints 2020. [Google Scholar] [CrossRef]
  21. Kramida, A.; Ralchenko, Y.; Reader, J.; Team, N.A. NIST Atomic Spectra Database (Version 5.7.1); National Institute of Standards and Technology: Gaithersburg, MD, USA, 2019. Available online: http://physics.nist.gov/asd (accessed on 9 September 2020).
  22. Kurucz, R.L.; Bell, B. Atomic Line Data. Kurucz CD-ROM No. 23. Smithsonian Astrophyical Observatory. 1995. Available online: http://www.cfa.harvard.edu/amp/ampdata/kurucz23/sekur.html (accessed on 9 September 2020).
  23. Methling, R.; Franke, S.; Uhrlandt, D.; Gortschakow, S.; Panousis, E. Spectroscopic measurements of arc temperatures in a model HV circuit breaker. Plasma Phys. Technol. 2015, 2, 167–170. [Google Scholar]
Figure 1. Setups (a) with a closed, long PTFE nozzle for experiments with strong ablation and high pressure built-up and vertical observation slits in the middle and (b) with two separated PTFE nozzles forming a heating channel for plasma flow into a heating volume as used for the model circuit breaker.
Energies 13 04714 g001
Figure 2. Left: Setup (a) was used under ambient conditions (no external chamber). Right: Setup (b) was part of a model circuit breaker placed inside a pressure vessel with vessel windows and the quartz plates in the observation slits. The dotted line indicates the sight through the outer vessel.
Energies 13 04714 g002
Figure 3. Left: Current and voltage waveform—nearly a sine 50 Hz shape and duration (∼10.6 ms). Middle: Pressure simulation for two positions and measurement for heating volume. Right: Photo (grey) of window with ignition wire and example for observation of the general behavior of the discharge about 1 ms before current zero (CZ) (false color representation) showing an asymmetric position of a constricted arc.
Energies 13 04714 g003
Figure 4. Visualization of the flow reversal before CZ for setup (b). Top: Selected frames of high-speed cameras (HSC) imaging using double frame optics; filters were applied for the atomic line emissions of F I 675 nm (left channel) and of O I 777 nm (right channel) to visualize emission from PTFE and CO 2 , respectively. Bottom: Plasma composition as obtained from the CFD simulation.
Energies 13 04714 g004
Figure 5. 2D-optical emission spectroscopy (OES) frames acquired at selected time points during one discharge by video spectroscopy with setup (b). From top to bottom: Ignition phase dominated by atomic Cu I lines from wire, transition to ablation-dominated arc with ionic C II and atomic F I lines from PTFE and close to CZ only C II from CO 2 .
Energies 13 04714 g005
Figure 6. Top: Temporal evolution of spectra around current zero in the arc center for setup (b). Note the direction of the timescale from bottom to top. Bottom left: Temporal evolution of three selected line intensities. Bottom right: Radial temperature profile acquired 400 μ s before CZ.
Energies 13 04714 g006
Figure 7. Two-dimensional spectrum measured 300 μ s before CZ by an intensified CCD (ICCD) camera to gain higher sensitivity in comparison to HSC (top). Vertical axis comprises of a nozzle diameter of 12 mm. After shifting the axis to the central position of the arc and symmetrization, side-on radiance was obtained by integration over the O I 777 nm triplet (bottom left). The deduced emission coefficient (bottom right) shows a distinct maximum at 1 mm caused by the higher ionization degree in the arc center.
Energies 13 04714 g007
Figure 8. Left: Calculated emission coefficient of the O I 777 nm triplet at different partial pressures of CO 2 depending on temperature. Note that the normal maximum is strongly dependent on the pressure but its position is rather stable around 16,000 K. Right: Pressure dependence of emission coefficient and temperature at normal maximum.
Energies 13 04714 g008
Figure 9. Selection of spectra acquired at different instants of time before the current zero.
Energies 13 04714 g009
Figure 10. Radial profiles of plasma temperature obtained from ionic carbon line C II at 658 nm (top) and from atomic oxygen triplet at 777 nm (bottom) with (130–1000 μ s) and without (<100 μ s before CZ, dashed curves) application of normal maximum.
Energies 13 04714 g010

