Article

Non-Directional Earth Fault Passage Indication in Isolated Neutral Distribution Networks

School of Technology and Innovations, University of Vaasa, 65200 Vaasa, Finland
*
Author to whom correspondence should be addressed.
Energies 2020, 13(18), 4732; https://doi.org/10.3390/en13184732
Submission received: 14 August 2020 / Revised: 7 September 2020 / Accepted: 10 September 2020 / Published: 11 September 2020
(This article belongs to the Special Issue Protection and Communication Techniques in Modern Power Systems)

Abstract

:
In this paper, two new methods for locating single-phase to ground faults in isolated neutral distribution networks are proposed. The methods are based on the analysis of symmetrical sequence currents. They are solely based on currents, not requiring voltage measurement. The first method employs only the zero sequence current and the second one utilizes the negative sequence current in combination with the zero sequence current. It is revealed why using only zero sequence current with a simple threshold is insufficient and may lead to false results. Using the proposed methods, earth faults with high resistances can be located in isolated neutral distribution networks with overhead lines or cables.

1. Introduction

Fault location has become an essential supplementary function for utilities as the importance of supply continuity and reliability is constantly increasing in modern distribution networks. With accurate and reliable fault location, faults can be isolated with a minimum number of switching operations. As a result, the duration of outages can be minimized. In general, faulty feeder identification and fault location in distribution networks could be performed at three levels:
(1)
Feeder identification: Only the faulty feeder is identified. This is usually an integral part of the feeder relay protection.
(2)
Fault Passage Indication (FPI): The faulted segment, e.g., lines or cables linking two secondary substations on the feeder, is identified. The purpose of FPI is to indicate whether the fault current has passed through the measurement point at which the FPI device is installed. By installing multiple FPI devices at various points (typically secondary substations) in the network, the faulted segment can be identified and visualized for the operator at the control center.
(3)
Distance estimation: The accurate fault location i.e., its distance from the beginning of the faulted feeder is estimated.
In [1], a method is proposed for identifying the faulted feeder in distribution networks. The method is applicable to isolated and compensated distribution networks. In this method, faulty feeder identification is realized by estimating the fault resistance using the approach proposed in the paper. To estimate the fault resistance, it is assumed that the phase-to-earth susceptance of each feeder prior to the occurrence of a fault is known to the system operator. However, due to the complexity of distribution networks, this assumption is not always valid in practice. In addition, the method appears to be suitable only for faulted feeder identification and is unable to locate the fault point on the faulty feeder. In [2], the faulted feeder identification is realized using the zero sequence admittance which requires measuring the zero sequence voltage U0 and zero sequence current I0. The faulted feeder is identified once the criteria that the method sets out for the zero sequence admittance or its components are met.
In [3], an impedance-based method is presented that falls into the third category i.e., the fault distance from the beginning of the faulted feeder is estimated. The method is developed by analyzing the equivalent sequence model of the distribution network using symmetrical components. In this method also, the assumption is that the capacitance of each feeder under no fault condition is known to the network operator. The effectiveness of the method, however, appears to be limited to fault resistances up to 500 ohms. In addition, a small inaccuracy in the estimated capacitance values of the feeders can result in a large error in the estimated fault distance.
In [4,5], the concept of cumulative phasor summation along with its application in earth fault protection, i.e., faulted feeder identification, is introduced. The same concept can also be applied for fault passage indication. In this concept the admittance at each measurement point is calculated using the cumulative phasors of zero sequence voltage and current. Thus, in addition to current measurement, the voltage measurement is required. The sign of the real part of the calculated admittance indicates whether the measuring point in question is on the fault passage or off the fault passage. In the field tests presented in [4,5], all the measuring points were located only at the primary substation and therefore the method was demonstrated only to identify the faulted feeder.
In [6], the same method is extended to various measurement points in a compensated network in order to enable FPI (level 2). If this method is intended to be used as FPI, three individual phase- to-phase voltage measurements are required at each measurement point in order to calculate the zero sequence voltage, which means extra costs.
In [7], a method is proposed for identifying the faulted feeder in isolated distribution networks. The proposed method attempts to achieve directional faulted feeder identification but without voltage measurement. The zero sequence voltage, which is usually used in directional methods as the reference, is replaced with phase currents in the manner proposed in the paper. However, the method appears to be unable to operate as FPI.
The methods presented in [8,9] are signal processing type of methods and fall into the first category. The initial transient features of the residual currents caused by the earth fault are analyzed using the wavelet transform to determine the faulted feeder. Both voltage and current measurements are required in these methods.
This paper presents two new methods, which fall into the second category, i.e., FPI. They are solely based on current measurements and no voltage input is required. The first method is based on the analysis of the zero sequence current along the faulted feeder and the second one is the improved version of the method introduced in [10]. It combines the zero and negative sequence currents to remedy the shortcomings of the original method. In Section 2, the behavior of zero and negative sequence currents during a fault condition are analyzed in depth in order to gain some insight into sequence currents during a fault. Based on the analysis, two FPI algorithms are formulated. The effectiveness of the proposed methods is investigated through simulations in Section 3. Some practical aspects regarding the implementation of the methods in practice are discussed in Section 4. Conclusions are drawn in Section 5.

2. Proposed Methods

2.1. Theory

An isolated neutral medium voltage (MV) distribution network is shown in Figure 1. It consists of a healthy feeder, the faulted feeder, and an equivalent circuit representing the rest of the healthy feeders which is shown as “Background network” in the figure. The dashed lines on the faulted feeder signify that it could consist of more than only the two secondary substations shown in the figure. Two secondary substations located at points E and G are shown. The choice of these substations is arbitrary which means the following analysis is valid for any point on the feeder between any two consecutive secondary substations.
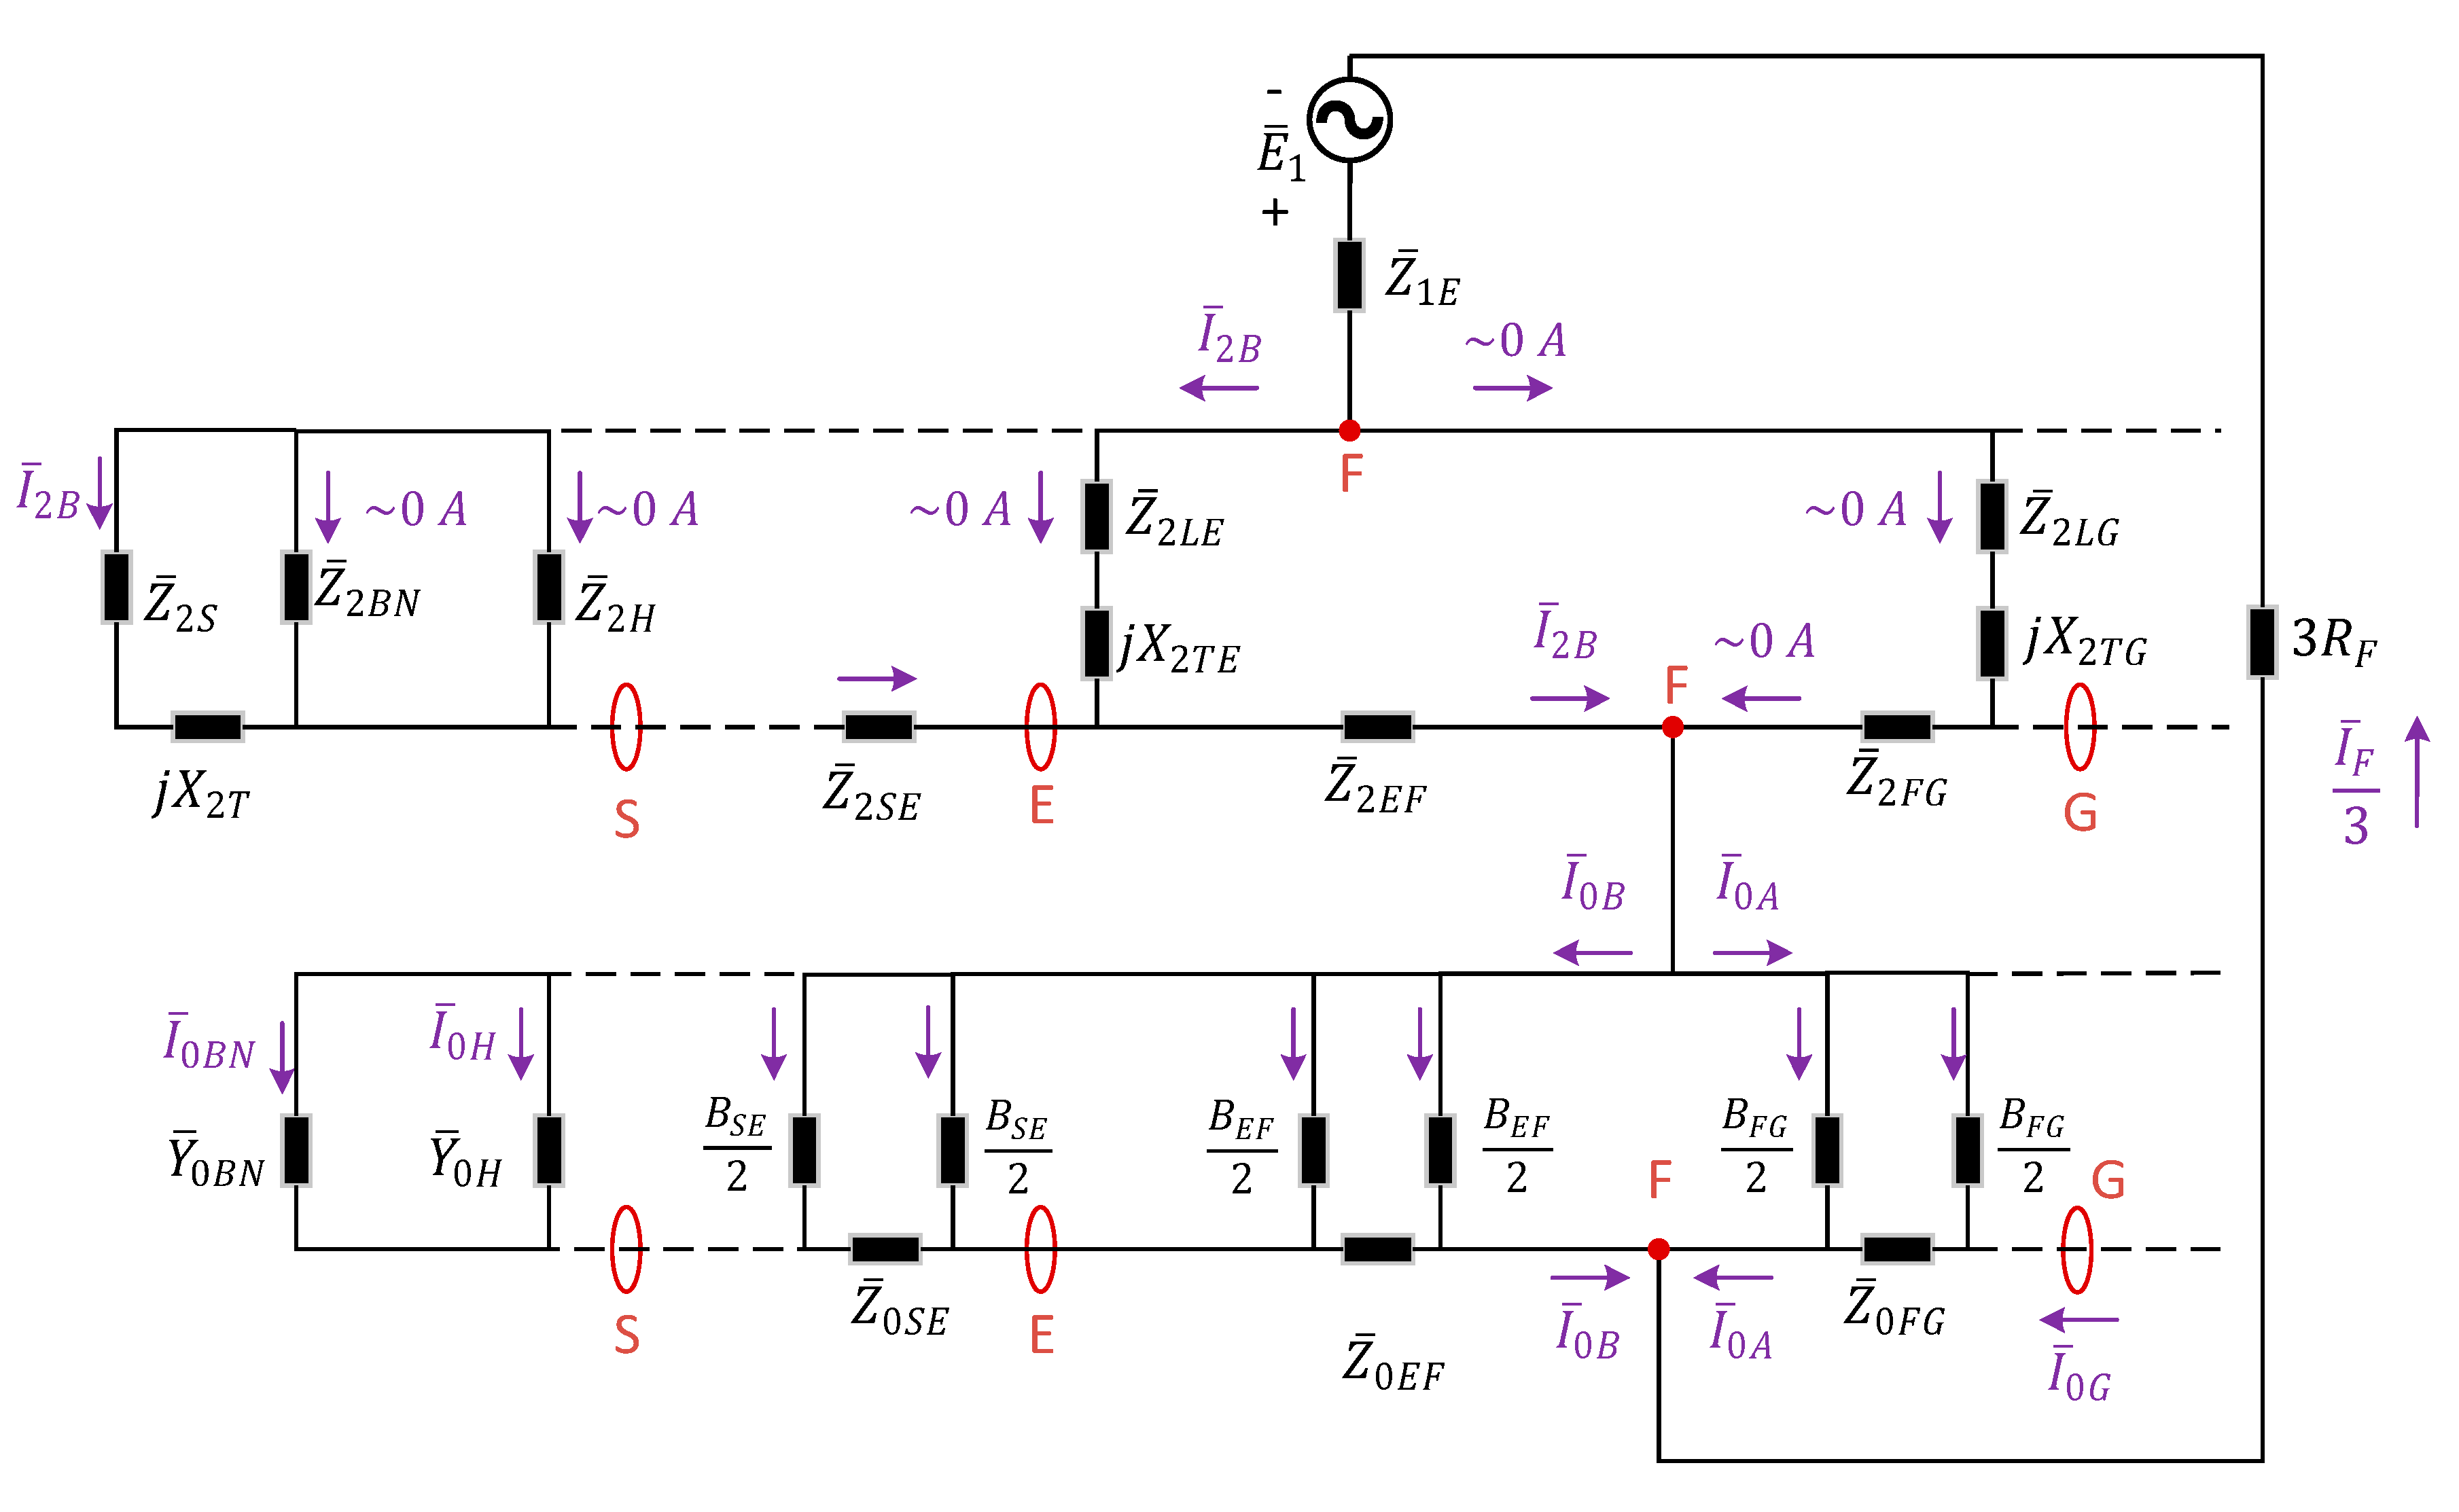
The symmetrical sequence equivalent circuit of this network is shown in Figure 2. In the following, the analysis of the positive sequence current is neglected as this current is not used in the proposed methods. The reason is that in practice, the value and changes of the positive sequence current are dictated mainly by changes in the load. For this reason, only the negative and zero sequence circuits are shown in detail and the positive sequence circuit is simplified as a voltage source E ¯ 1 in series with an impedance Z ¯ 1 E . In addition, the proposed methods and the following analysis are based on steady state currents during the fault and do not consider the transient phenomena. The list of notations is given in the Abbreviations Section.
The negative sequence circuit consists of series impedances representing the line negative sequence impedances and shunt branches representing the negative sequence impedances of the background network, the healthy feeder, and the loads. In practice, load impedances are typically much larger than the system impedances in such a way that their effect on the faulted phase current is insignificant. For this reason, it is common practice in fault studies to neglect load impedances for shunt faults [11]. When the values of the load impedances are assumed to be infinite, then the currents flowing through them in the negative sequence circuit are zero. Therefore, the negative sequence current at points after the fault location is negligible. Similarly, the negative sequence currents flowing through the impedances of the background network and the healthy feeder are negligible in the negative sequence circuit. Almost all the negative sequence current flows through the system branch ( Z ¯ 2 S in series with Z ¯ 2 T ). As a result, the negative sequence current remains to a great extent constant from the beginning of the faulted feeder up to the fault point (from S to F). In addition, as can be seen from the figure, the negative sequence current at any point on the faulted feeder between S and F equals one third of the fault current.
I ¯ 2 B   =   I ¯ F 3
This feature is used in [12] to determine the fault current in order to estimate the fault distance (level 3). In contrast, the shunt reactances in the zero sequence circuit are not negligible as they represent the line to earth capacitances of the feeders. The zero sequence current increases from S to F so that just before the fault point, it reaches its maximum, since at that point it is the summation of all the currents flowing through all the shunt branches from S to F.
I ¯ 0 B N +   I ¯ 0 H + =   I ¯ 0 B
In summary, the negative sequence current at the beginning of the faulty feeder is almost constant for points before the fault locations and one third of the fault current. This current is negligible for points located after the fault point. The zero sequence increases as we move towards the fault point and reaches its maximum just before the fault point. The zero and negative sequence currents (in magnitudes) on the faulted feeder are graphically shown in Figure 3.

2.2. Method I

The first proposed fault location procedure is structured as follows:
(1)
The faulted feeder is indicated first by the operation of the feeder protection relay.
(2)
The zero sequence current for each measurement point (ideally at every secondary substation) on the faulted feeder is calculated and sent to a control center where all calculated zero sequence currents are collected.
(3)
For each measuring point, these values are scaled so that they are divided by the one from the beginning of the feeder. If the scaled value is greater than 1, it is concluded that the measuring point in question is on the fault passage. Otherwise, it is off the fault passage.
(4)
The faulty segment is determined as the segment linking the last secondary substation on the fault passage and the first secondary substation off the fault passage.

2.3. Method II

This method employs the concept introduced in [10]. It is based on the (change in the) negative sequence current in addition to monitoring the zero sequence current. In this method, the fault location procedure is performed locally.
(1)
The procedure at each measuring point is triggered once the magnitude of the zero sequence current exceeds a pre-set threshold.
(2)
The magnitude of the negative sequence current is calculated (ideally at every secondary substation).
(3)
If the calculated value exceeds a low pre-set threshold, a fault indication signal is issued to the control room.
(4)
The faulty segment is determined as the segment linking the last measurement point from which the fault indication signal is received and the first measurement point that sends no signal.

3. Simulation Results

The simulations were carried out with PSCADTM (Winnipeg, MB, Canada) by using a verified model of a Finnish distribution network. The simplified schematic diagram of the network is shown in Figure 4. It is a rural distribution network consisting of multiple feeders. The feeders are mixed i.e., they start from the primary substation as cables and end as overhead lines. Three different scenarios are simulated so that the earth fault occurs in one of the three different locations along the feeder J07. The measurements are taken from various points on the network including the beginning of feeders J07 and J06 at the primary substation and the four secondary substations along the studied feeder (J17, J27, J37, and J47). Fault resistances considered in this study range from 0.01 Ω to 3 kΩ.
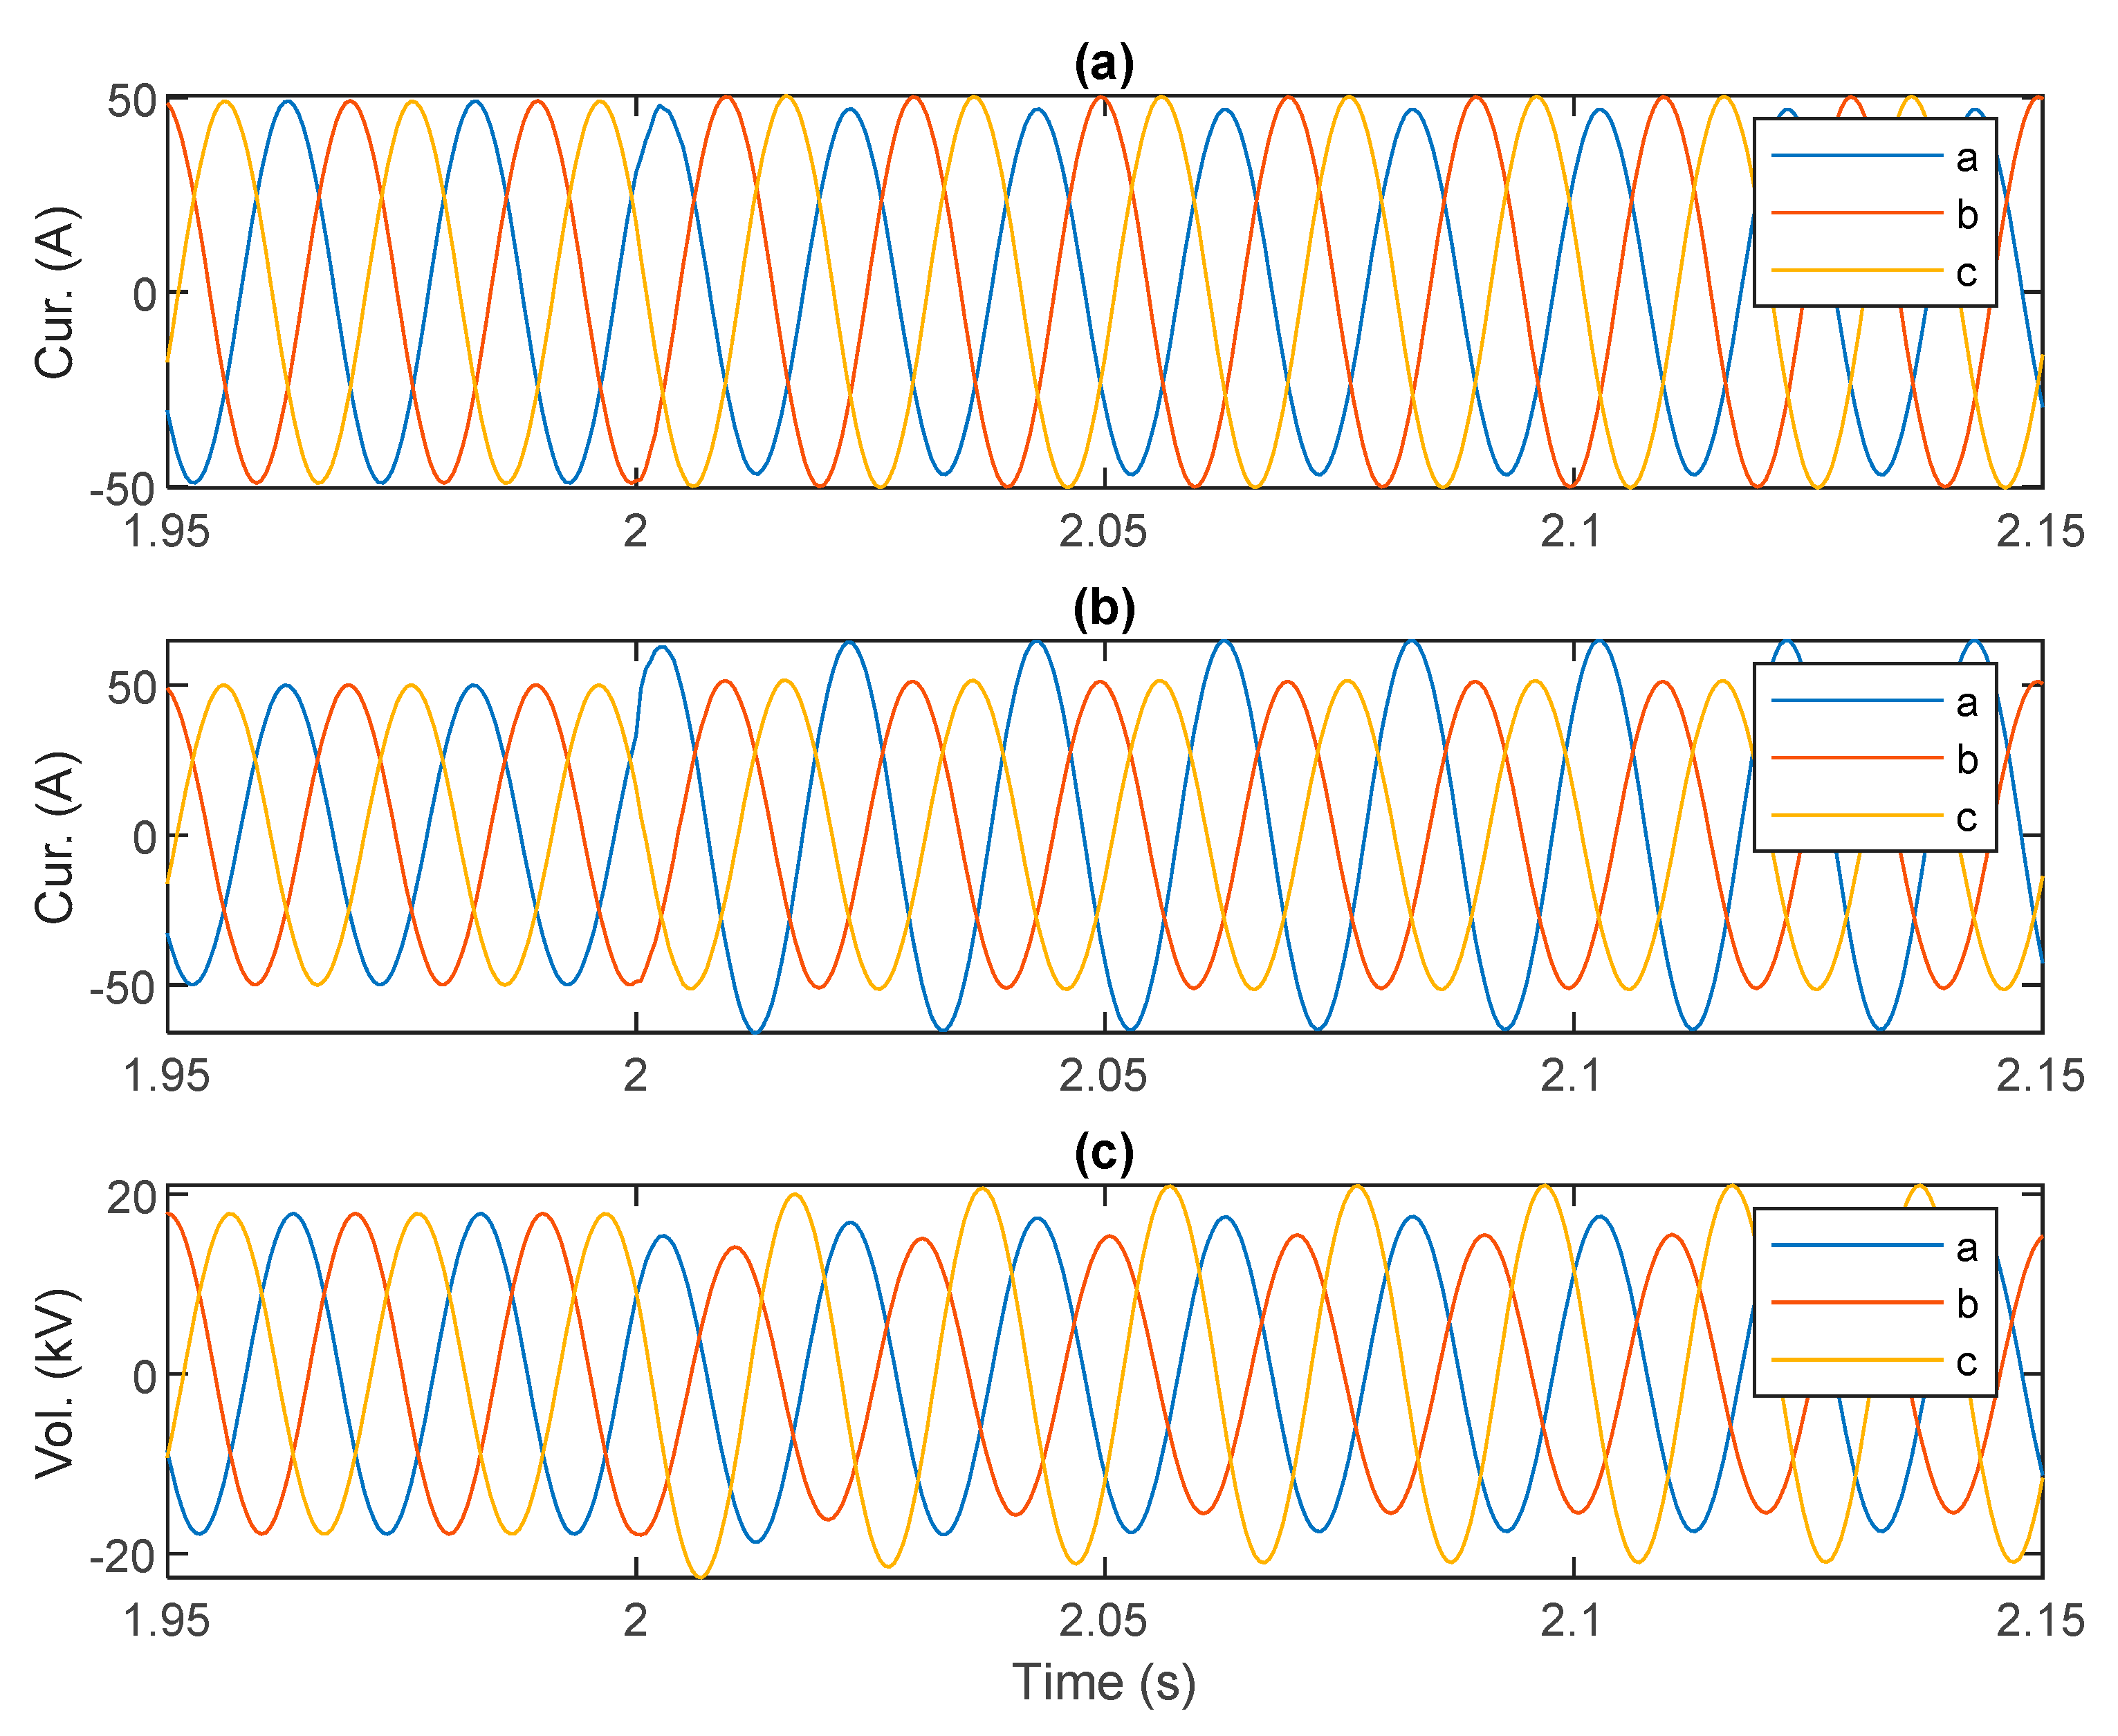
First, consider Fault 1 which occurs at t = 2 s on phase “a” at the section between measurement points J37 and J47 with the resistance of 1 kΩ. The phase voltages measured at the primary substation and currents measured at J07 and J06 are shown in Figure 5.
Let us denote the phasors of phase currents by I ¯ a , I ¯ b , and I ¯ c . The corresponding sequence components can be obtained using the definition of symmetrical components [1] as follows:
I ¯ 2 ( a ) = 1 / 3   ( I ¯ a   +   a 2   I ¯ b +   a   I ¯ c )
I ¯ 0 ( a ) = 1 / 3   ( I ¯ a   +   I ¯ b +   I ¯ c )
where, I ¯ 2 ( a ) and I ¯ 0 ( a ) are the phasors of the negative and zero sequence currents of phase “a”, respectively and the operator a = 1 ∠120°. Note that, by definition, the phasors of sequence currents calculated for all three phases are equal in magnitudes while there is only a 120-degree phase shift between them. As the proposed algorithms are based on magnitudes, the calculations can be made for any phase.
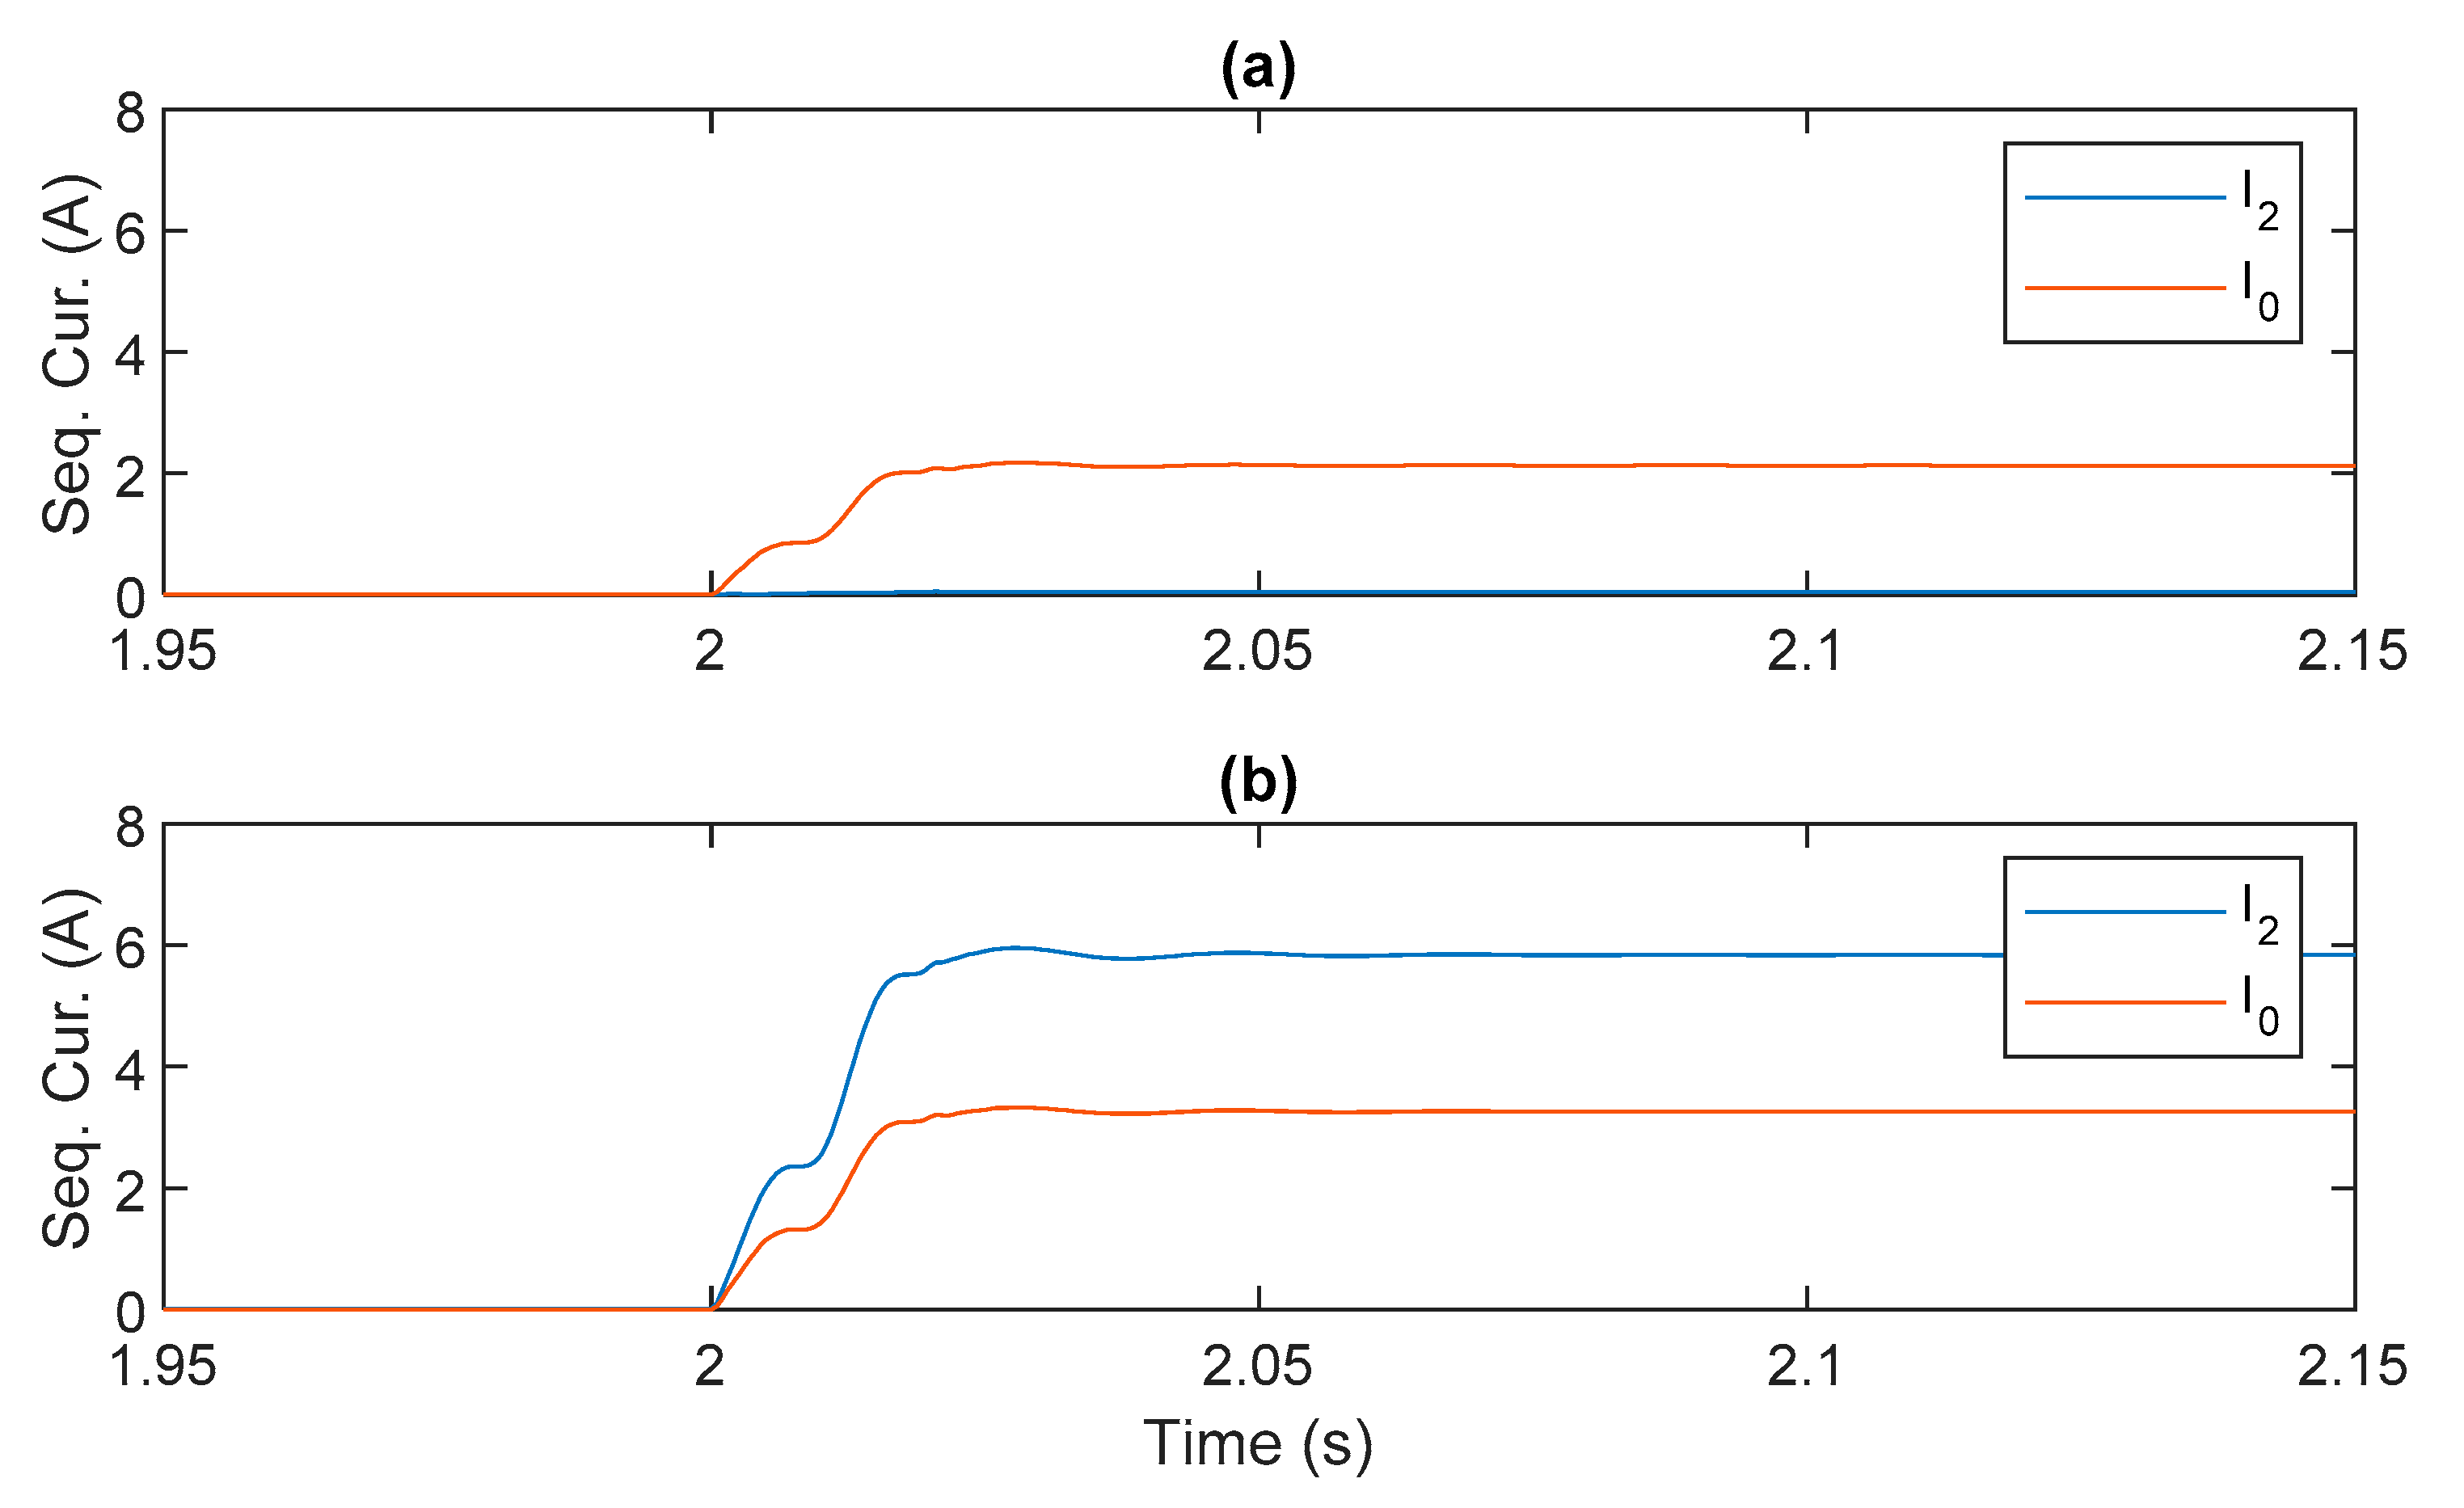
The calculated magnitudes of sequence currents using Equations (3) and (4) are shown in Figure 6 for J06 and J07. For simulations presented in this paper, the threshold is set to be 0.5 A. In Figure 6, the zero sequence current has exceeded the threshold both in healthy and faulted feeders, whereas the negative sequence current is negligible on the healthy feeder J06 and has exceeded the threshold only on the faulty feeder J07. This highlights the fact that the zero sequence current could be significant even on healthy feeders and therefore insufficient for fault passage indication purposes if used alone. In other words, exceeding a pre-set threshold by zero sequence currents is not necessarily indicative of being on the fault passage.
In Table 1, the sequence currents as well as the scaled zero sequence currents are presented for various fault resistances. The presented values are taken at t = 2.06 s, i.e., three cycles after the fault occurrence, as at this point the calculated sequence currents seem to reach the steady state.
For all the points off the fault passage, the zero sequence current is below 5 A. Similarly, for all the points located on the fault passage, the zero sequence current is higher than 1 A. Therefore, one might think by setting a threshold for the zero sequence current, FPI can be realized. However, such an approach may lead to false results. For instance, the zero sequence current at J47 (which is located off the fault passage) with the fault resistance of 0.01 Ω is higher than the zero sequence current at J37 (which is on the fault passage) when the fault resistance is 3 kΩ (green cells in Table 1). Therefore, setting the threshold of 5 A leads to false results. A similar argument can be made for the threshold of 1 A. It should be noted that no threshold can be found with which FPI can be realized. Therefore, the simple threshold method is insufficient to locate faults. However, using either one of the proposed algorithms, the points located on and off the fault passage are identified correctly. In Method I, the scaled zero sequence currents have values above 1 in all points on the fault passage. In Method II, a suitable threshold for negative sequence current can be easily selected in the cases shown.
To investigate the impact of the fault location, consider Faults 2 and 3. The sequence currents as well as scaled zero sequence currents are presented for various fault resistances in the following tables (Table 2 and Table 3). Again, using either one of the proposed algorithms, the points on and off the fault passage can be identified successfully.

4. Discussion

As the proposed methods are based on FPIs, they are able to locate the fault between consecutive FPIs. The accuracy of the fault location thus depends on the density of the FPIs.

4.1. Limitations of the Proposed Methods

The first proposed method was developed only for isolated neutral networks. It is not applicable to compensated distribution networks as in these networks, unlike in isolated neutral networks, the zero sequence current decreases from the beginning of the feeder towards the fault point. This decrease is due to the compensation/Petersen coil. Therefore, the idea of scaling the zero sequence current at each measuring point would be pointless as for every point on the faulted feeder, the scaled zero sequence current would be less than 1 regardless of whether the point in question was off the fault passage or on it.
The other limitation that concerns both of the methods is sensitivity. For the network studied in this paper, the fault resistance of 3 kΩ caused the sequence currents for points located at the fault passage to be as low as 1 A which is still within the acceptable range. However, higher fault resistances would cause lower sequence currents that could be problematic to measure reliably in a real network.

4.2. Effect of Unbalanced Load

For simulations presented in this paper, the network under study was symmetrical. In practice, however, distribution networks are not perfectly symmetrical e.g., due to unbalanced load and therefore there is usually some level of negative sequence current detectable even when there has been no earth fault occurrence. Therefore, in the second proposed method, instead of using the negative sequence current, the “change” in the negative sequence current must be used.
Another concern regarding the second proposed method is that the rise in the negative sequence current could be caused by a sudden unbalanced change in the load and not necessarily by an earth fault. This is a situation where the zero sequence current, which acts as a trigger for both methods, comes into play. The zero sequence current is not affected by unbalanced load due to the type of winding of the secondary transformers on the medium voltage side i.e., delta winding. In other words, an unbalanced change in the load on the low voltage side does not cause zero sequence currents on the medium voltage side. Therefore, the performance of the second method is not affected.

5. Conclusions

Two methods were presented to identify the faulted segment following an earth fault occurrence in isolated neutral distribution networks. The proposed methods fall into the category of FPIs and require no voltage input, which helps to reduce costs when implementing the methods in practice. The first method was solely based on zero sequence currents and the second method combined the zero sequence current with the negative sequence current. The theory behind each proposed method was presented using symmetrical sequence component analysis. The methods were validated using simulations carried out on a verified network model with PSCADTM software. The FPI-based methods presented are non-directional as only the magnitudes of zero and negative sequence currents are required and not their phase angles. For the isolated neutral network studied in this paper, earth faults up to 3 kΩ can be located using either of the proposed methods.

Author Contributions

Conceptualization, L.K.; Formal analysis, A.F.; Funding acquisition, L.K. and K.K.; Investigation, A.F.; Project administration, L.K. and K.K.; Software, A.F.; Supervision, K.K.; Writing—original draft, A.F.; Writing—review and editing, L.K. and K.K. All authors have read and agreed to the published version of the manuscript.

Funding

This work was partly carried out in VINPOWER project which was supported by the European Regional Development Fund (ERDF), Project No. A73094.

Conflicts of Interest

The authors declare no conflict of interest.

Abbreviations

Z ¯ 1 E Equivalent impedance of the positive sequence circuit of the network
Z ¯ 2 S Negative sequence source impedance
X 2 T Negative sequence reactance of the main transformer
Z ¯ 2 B N Equivalent negative sequence impedance of the background network
Z ¯ 2 H Equivalent negative sequence impedance of the healthy feeder
Z ¯ 2 S E Negative sequence impedance of the faulted feeder between S and E
Z ¯ 2 L E Negative sequence impedance of load E
X 2 T E Negative sequence reactance of transformer E
Z ¯ 2 E F Negative sequence impedance of the feeder between E and the fault location
Z ¯ 2 F G Negative sequence impedance of the feeder between the fault location and G
Z ¯ 2 L G Negative sequence impedance of load G
X 2 T G Negative sequence reactance of transformer G
Y ¯ 0 B N Zero sequence admittance of phase to earth capacitances of the background network
Y ¯ 0 H Zero sequence admittance of phase to earth capacitances of the healthy feeder
Z ¯ 0 S E Zero sequence series impedance between S and E
B S E Zero sequence susceptance of phase to earth capacitances between nodes S and E
Z ¯ 0 E F Zero sequence series impedance between E and F
B E F Zero sequence susceptance of phase to earth capacitances between nodes E and F
Z ¯ 0 F G Zero sequence series impedance between F and G
B F G Zero sequence susceptance of phase to earth capacitances between F and G

References

  1. Nikander, A.; Järventausta, P. Identification of High-Impedance Earth Faults in Neutral Isolated or Compensated MV Networks. IEEE Trans. Power Deliv. 2017, 32, 1187–1195. [Google Scholar] [CrossRef]
  2. Lorenc, J.; Marszalkiewicz, K.; Andruszkiewicz, J. Admittance criteria for earth fault detection in substation automation systems in Polish distribution power networks. In Proceedings of the 14th International Conference and Exhibition on Electricity Distribution. Part 1. Contributions, (IEE Conf. Publ. No. 438), Birmingham, UK, 2–5 June 1997; Volume 4, pp. 19/1–19/5. [Google Scholar]
  3. Altonen, J.; Wahlroos, A. Advancements in fundamental frequency impedance based earth fault location in unearthed distribution systems. In Proceedings of the CIRED 19th International Conference on Electricity Distribution, Vienna, Austria, 21–24 May 2007. [Google Scholar]
  4. Wahlroos, A.; Uggla, U.; Altonen, J.; Wall, D. Application of novel cumulative phasor sum measurement for earth-fault protection in compensated MV-networks. In Proceedings of the 22nd International Conference and Exhibition on Electricity Distribution (CIRED 2013), Stockholm, Sweden, 10–13 June 2013; p. 607. [Google Scholar]
  5. Wahlroos, A.; Altonen, J. Application of novel multi-frequency neutral admittance method into earth-fault protection in compensated MV-networks. In Proceedings of the 12th IET International Conference on Developments in Power System Protection (DPSP 2014), Copenhagen, Denmark, 31 March–3 April 2014; pp. 1–6. [Google Scholar]
  6. Altonen, J.; Wahlroos, A.; Vähäkuopus, S.; Oy, E. Application of multi-frequency admittance-based fault passage indication in practical compensated MV-network. CIRED 2017, 2017, 947–951. [Google Scholar] [CrossRef]
  7. Stojanović, Z.N.; Djurić, M.B. An algorithm for directional earth-fault relay with no voltage inputs. Electr. Power Syst. Res. 2013, 96, 144–149. [Google Scholar] [CrossRef]
  8. Elkalashy, N.I.; Tarhuni, N.G.; Lehtonen, M. Simplified probabilistic selectivity technique for earth fault detection in unearthed MV networks. IET Transm. Distrib. Gener. 2009, 3, 145–153. [Google Scholar] [CrossRef]
  9. Elkalashy, N.I.; Lehtonen, M.; Darwish, H.A.; Taalab, A.-M.I.; Izzularab, M.A. Operation evaluation of DWT-based earth fault detection in unearthed MV networks. In Proceedings of the 12th International Middle-East Power System Conference, Aswan, Egypt, 12–15 March 2008; pp. 208–212. [Google Scholar]
  10. Farughian, A.; Kumpulainen, L.; Kauhaniemi, K. Earth Fault Location Using Negative Sequence Currents. Energies 2019, 12, 3759. [Google Scholar] [CrossRef] [Green Version]
  11. Blackburn, L.J. Symmetrical Components for Power Systems Engineering; CRC Press: Boca Raton, FL, USA, 1993; ISBN 978-0-8247-8767-7. [Google Scholar]
  12. Wahlroos, A.; Altonen, J.; Pitkänen, R.; Kauppinen, S. Improving personal safety in MV-networks through novel earth-fault current based feeder protection. In Proceedings of the 25th International Conference on Electricity Distribution (CIRED 2019), Madrid, Spain, 3–6 June 2019; p. 5. [Google Scholar]
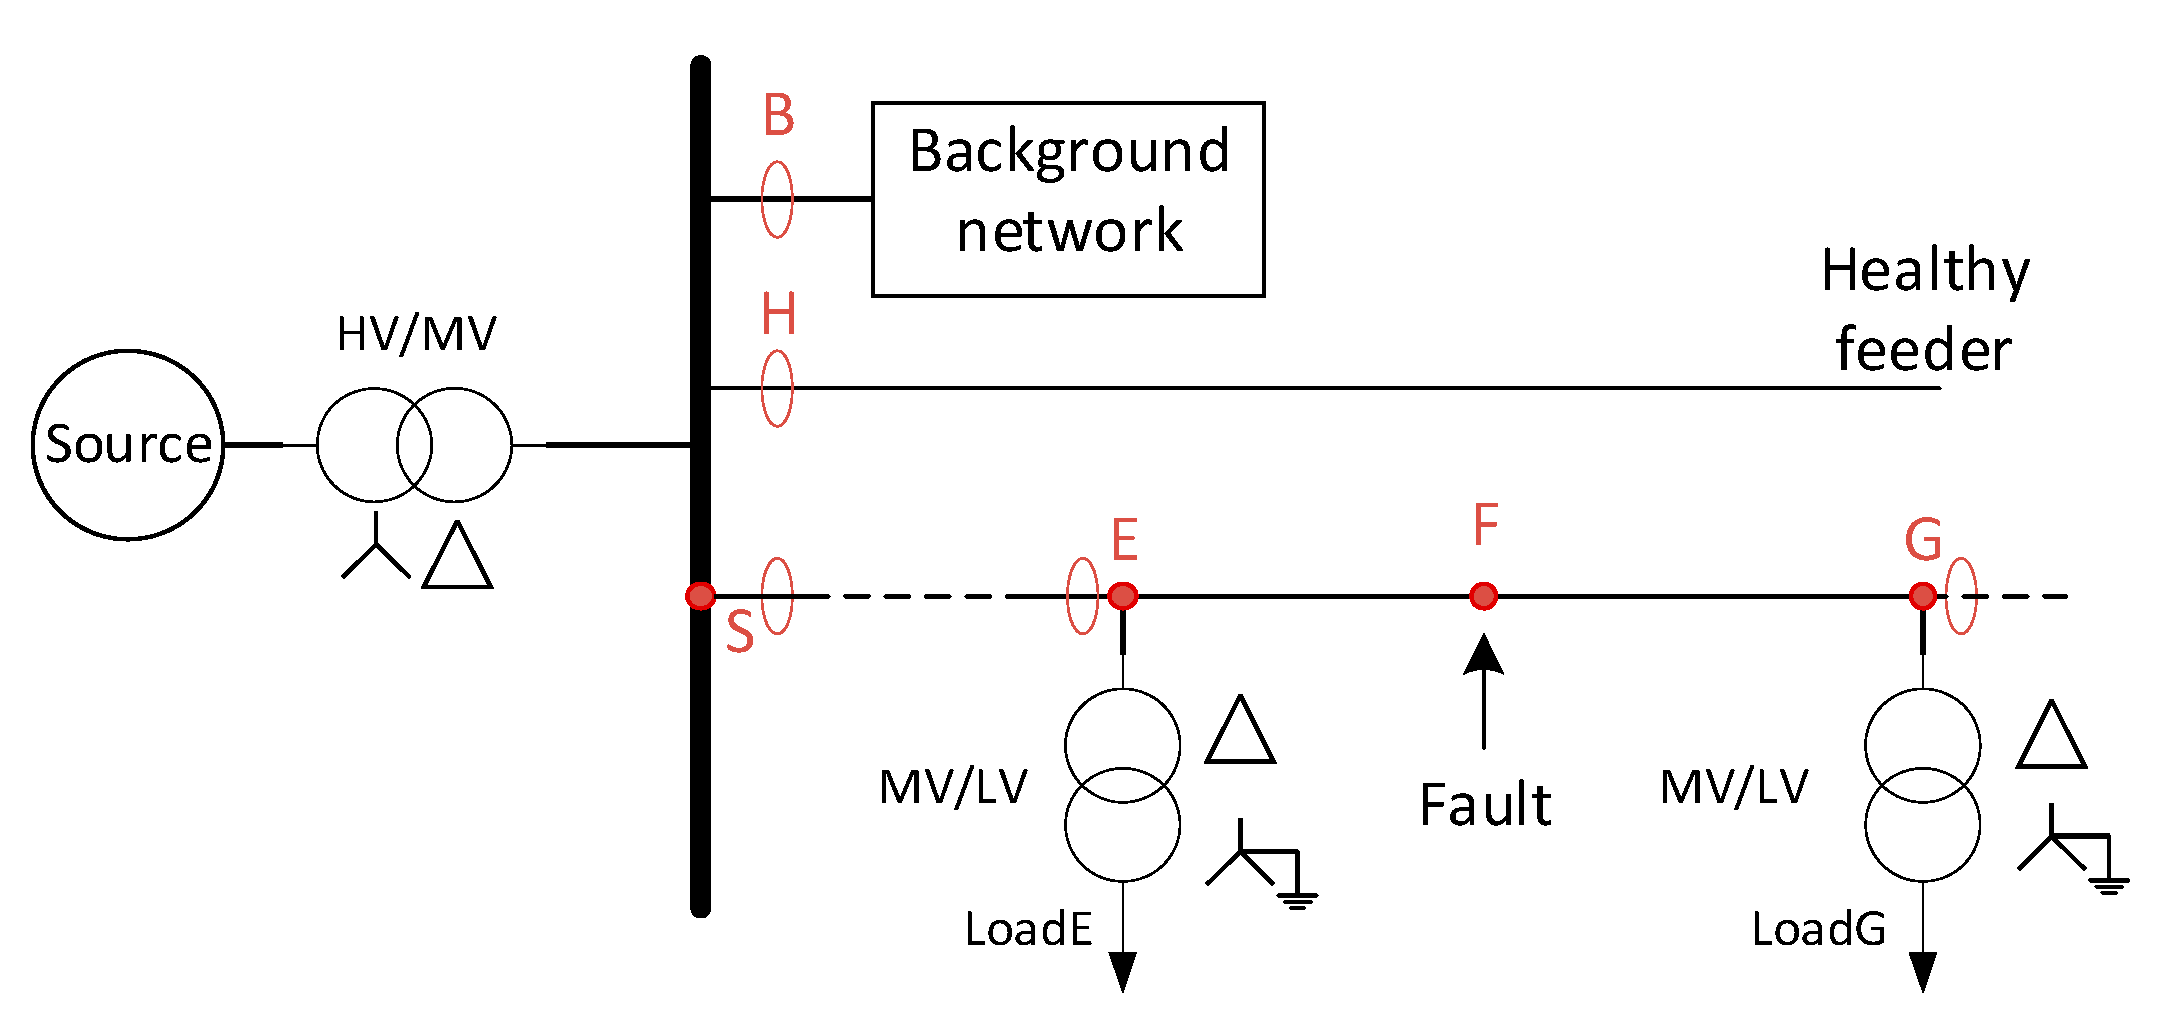
Figure 1. Distribution network with isolated neutral under earth fault condition.
Energies 13 04732 g001
Figure 2. Symmetrical sequence equivalent circuit of the network shown in Figure 1.
Energies 13 04732 g002
Figure 3. Behavior of zero and negative sequence currents on the faulted feeder in an isolated neutral network.
Energies 13 04732 g003
Figure 4. Medium voltage network with isolated neutral under three fault location scenarios with various measuring points along the feeder.
Energies 13 04732 g004
Figure 5. Simulated values during Fault 1, (a) phase currents at healthy feeder J06; (b) phase currents at faulted feeder J07; (c) phase to ground voltages at the primary substation.
Energies 13 04732 g005
Figure 6. Zero and negative sequence currents at (a) healthy feeder J06; (b) faulted feeder J07.
Energies 13 04732 g006
Table 1. Sequence currents at various point during earth fault 1.
R F = 0.01   R F = 100   R F = 3000  
PointsOn/off I 0   ( A ) I 0 / I 0 S I 2   ( A ) I 0   ( A ) I 0 / I 0 S I 2   ( A ) I 0   ( A ) I 0 / I 0 S I 2   ( A )
J07on18.01.032.215.81.028.31.11.02.0
J17on19.91.132.217.51.128.31.21.12.0
J27on21.51.232.218.91.228.21.31.22.0
J37on27.11.532.223.71.528.21.71.52.0
J47off4.50.20.13.90.20.10.30.20.0
Table 2. Sequence currents at various point during earth fault 2.
R F = 0.01   R F = 100   R F = 3000  
PointsOn/off I 0   ( A ) I 0 / I 0 S I 2   ( A ) I 0   ( A ) I 0 / I 0 S I 2   ( A ) I 0   ( A ) I 0 / I 0 S I 2   ( A )
J07on18.01.032.215.81.028.31.11.02.0
J17on19.91.132.217.51.128.31.21.12.0
J27off10.70.60.29.40.60.20.70.60.0
J37off5.10.30.14.50.30.10.30.30.0
J47off4.50.20.13.90.20.10.30.20.0
Table 3. Sequence currents at various point during earth fault 3.
R F = 0.01   R F = 100   R F = 3000  
PointsOn/off I 0   ( A ) I 0 / I 0 S I 2   ( A ) I 0   ( A ) I 0 / I 0 S I 2   ( A ) I 0   ( A ) I 0 / I 0 S I 2   ( A )
J07on18.01.032.215.81.028.31.11.02.0
J17off12.30.70.310.80.70.20.80.70.0
J27off10.70.60.29.40.60.20.70.60.0
J37off5.10.30.14.50.30.10.30.30.0
J47off4.50.20.13.90.20.10.30.20.0