Review

Review on the PV Hosting Capacity in Distribution Networks

Department of Electrical Engineering and Automation, Aalto University, Maarintie 8, 02150 Espoo, Finland
*
Author to whom correspondence should be addressed.
Energies 2020, 13(18), 4756; https://doi.org/10.3390/en13184756
Submission received: 22 July 2020 / Revised: 27 August 2020 / Accepted: 9 September 2020 / Published: 11 September 2020
(This article belongs to the Special Issue Emerging Photovoltaic Technology in Northern Europe)

Abstract

:
The increasing penetration of Photovoltaic (PV) generation results in challenges regarding network operation, management and planning. Correspondingly, Distribution Network Operators (DNOs) are in the need of totally new understanding. The establishment of comprehensive standards for maximum PV integration into the network, without adversely impacting the normal operating conditions, is also needed. This review article provides an extensive review of the Hosting Capacity (HC) definitions based on different references and estimated HC with actual figures in different geographical areas and network conditions. Moreover, a comprehensive review of limiting factors and improvement methods for HC is presented along with voltage rise limits of different countries under PV integration. Peak load is the major reference used for HC definition and the prime limiting constraint for PV HC is the voltage violations. However, the varying definitions in different references lead to the conclusion that, neither the reference values nor the limiting factors are unique values and HC can alter depending on the reference, network conditions, topology, location, and PV deployment scenario.

Graphical Abstract

1. Introduction

European Energy Regulators and network operators characterized the hosting capacity (HC) as a quantification means of the future energy network performance [1]. The photovoltaic (PV) generation as the mature and economical option among other Renewable Energy Sources (RES) is continually gaining importance [2]. Although the PV market is policy-driven, the penetration of PVs is continuously increasing. The Low Voltage (LV) networks have been facing operational issues such as overvoltage and unbalance due to increased rooftop solar PV integration. Thus, the thorough understanding of maximum PV penetration without exceeding any operational and performance constraints referred to as PV HC becomes indispensable [3].
The HC value is directly proportional to the risk that the network operators and customers want to take. HC is, therefore, not a unique value and it greatly depends on the appropriate selection of the performance indices and their limits [4]. HC dependence on PV deployment and size is investigated in [5] by the comparison of two feeders of the same voltage level (15 kV) and serving 8 MW and 6 MW of total load with one feeder as the stiffer one with higher power transfer capability. The authors noticed that the large-scale (MW) PV deployment results in a higher value of most conservative minimum HC of 69% of peak load (8 MW) as compared to 63% in small-scale (residential/commercial) deployment. The PV deployment as small-scale and large-scale is described as the random placement of PV at the customers’ premises and interconnection behind the step-up transformers at primary nodes, respectively. The former considered the customer’s peak load for sizing PV and the latter assumed 500 kW increments in PV sizing. The major portion of the PV capacity is integrated into LV networks and the large-scale PV deployment is limited dominantly by voltage quality problems among others such as unbalance, flicker, harmonics, and ampacity. The authors in [6] similarly corroborated the fact that the LV system is capable of higher relative penetration level as compared to the Medium Voltage (MV) system but this figure can be limited by the MV network voltage issues. The voltage violations as the main limiting factor for HC has been discussed by the authors of [7,8,9,10,11] Similarly, [3,8,12,13,14,15] included ampacity as the limiting factor in addition to voltage violation. The overvoltage has been noticed as the main limiting factor in predominantly rural regions as compared to the ampacity as the most common limiting factor in predominantly urban and suburban regions, respectively [16]. However, the most important and ubiquitous problem concerning voltage volatility is the voltage rise at the end and middle of the feeder due to reverse power flow at high penetration levels [17]. A range of HC values has been investigated by the authors of [11] taking the IEEE 123-bus system as the test network and network overvoltage as the main limiting factor as per ANSI C84.1. The long span and higher impedance values of rural feeders result in more voltage rise issues. The length and impedance of feeders, as well as transformer impedance, are instrumental in voltage rise determination with a penetration level of up to 75% of LV transformer capacity as discussed in [18]. Flicker and harmonics as the limiting constraints are discussed only rarely by [19,20,21,22] and [23,24,25], respectively. Voltage fluctuation in the lower frequency range (0.05–40/s) that originates from the stations equipped with renewable energy generations and propagate into the distribution lines is called flicker [26] whereas harmonics arise from the non-linearity of the loads and inclusion of Power Electronic devices [25].
The voltage control methods can increase the HC but at the expense of some undesirable operations such as increased switching operations and excessive reactive power demand from the substation. The legacy devices for feeder voltage control include Capacitor Banks, Voltage Regulators and On Load Tap Changers (OLTCs), and voltage violations can occur for a short time due to time-delayed response of legacy devices [27]. Therefore, the application of advanced voltage control methods is crucial for accommodating the ever-increasing penetration of PV Distributed Generation (DG) and achieving relatively fast response time as compared to legacy devices. The authors of [28,29,30,31] considered OLTC as a means to increase HC by voltage regulation. PV inverters and battery storages are good alternatives to voltage regulators due to the slow response time of the latter. The OLTC operation integrated with capacitors can increase hosting capacity with only minor operational changes and without prominent additional grid investment costs [32]. The main motivation for using OLTC in [28] is the voltage violation as the limiting factor for the rural and suburban networks thus making OLTC the appropriate option. Moreover, Demand Response (DR) and Battery Energy Storage System (BESS) for HC increase are discussed in [33,34] and [35,36,37], respectively. The DR programs enabled through two-way communication between the utility and end-user can be proved instrumental in improving the voltage quality and thus increase the PV HC. The BESS has been found an efficient way of controlling active power and decreasing the reverse power to improve hosting capacity [36]. Similarly, inverter oversizing for achieving the full potential of PV systems as an active and reactive power source by assigning a certain percentage of PV capacity to support reactive power all time is discussed in [17,38,39,40]. Dynamic loading of components for HC improvement is analyzed in [21,41,42,43] and the authors of [43] found the dynamic loading of Transformer (TF) as an effective approach for reducing the energy loss due to Active Power Curtailment (APC). The dynamic loading of components alleviates the voltage stability issues resulting from cloud movements especially in case of small geographical areas that are otherwise not handled by static load modeling [41]. Moreover, some HC increasing methods employ ancillary devices for voltage regulation such as inverter PF control [3,44], Smart Inverters [2,45,46], Static Compensators [47,48] and Secondary VAr Controllers (SVCs) [10].
The concept of an energy management and consumption system has been established in [49,50] where the authors addressed and employed the concept of prosumer as the active energy users taking part in DR programs through the deployment of RES especially the PVs. A control approach based on short-term forecasting has been proposed in [49] and the authors emphasized that the consideration of deterministic generation and load profiles can be misleading and may not be realistic. Thus, an accurate estimation and forecasting of underlying uncertainties was considered as an instrumental aspect of this work. The DR programs can be benefitted from such forecasting methods along with an added advantage of an increase in PV HC. Moreover, such forecasting is proposed to reduce the system complexity and computational exertions. To begin with, the HC definitions depending on different references are presented in Section 3, followed by the limiting factors and maximum voltage rise standards due to PV penetration for different countries in Section 4. Subsequently, Section 5 presents the estimated HC of different network conditions and geographical areas without any mitigation means leading to the HC improvement methods presented in Section 6.

2. Materials and Methods

This review article summarizes HC reference values, limiting factors and corresponding standards across different countries. Actual statistics of the estimated HC values and the real figures for the HC increase by employing different methods are also given. There are extensive reviews on HC improvement methods and modern emerging methods involving VAR support [51]; however, this review article also entails less investigated means such as inverter oversizing, dynamic loading of components, and Power Quality (PQ) compensation for HC improvement. Initially, 120 publications from the Scopus database were chosen using keywords PV Hosting Capacity, Photovoltaic Hosting Capacity and Hosting Capacity of Distribution Networks extending the research during the subsequent stages for more targeted search employing IEEE Xplore database as well. However, Scopus remained the primary database employed with the time span of the research publications starting from 2013 until now.

3. Hosting Capacity Definitions

The maximum PV penetration limit depends on various factors such as PV connection: single or three-phase, irradiance level, network layout and topology, and load type among many others. Estimated HC can vary from 2.5% to 110% in case of concentrated and distributed PV distribution, respectively [6]. The authors of [52] discussed the locational dependence of PV HC and noticed that dispersed PV installation results in a 19% and 20% increase in HC as compared to single PV installation. The location of PV installation was found to strongly impact the HC in [53].
The HC can be defined in several ways as the ratio of customers equipped with DG, or the rated power from PV as the proportion of the entire load connected or transformer rating, or the present peak demand of the feeder. This section presents varying definitions of HC as listed in Table 1.
Peak load has been found as the most widely used HC reference followed by distribution transformer (TF) Rating and the share of customers equipped with PV, referred to as Customer PVs, as shown in Figure 1.

3.1. Peak Load

The authors of [3,5,9,10,14,24,44,48,54,55,56,57,58,59,60,61,62,63,64] defined PV HC with reference to the peak load of the feeder as the ratio of the maximum capacity of the PV installation to the maximum load of the feeder. In [65], the authors investigated the HC of a rural European three-phase balanced system for two types of simulations that is one-time slot simulation and time series simulation and an estimated HC of 86% of peak load has been observed. Additionally, the HC based on the peak load of a real USA feeder is found to be 35% [7] and 86% HC value is noticed for an 11.4 kV MV distribution feeder in Taiwan [2]. The HC is defined similarly in [45] and the Volt-VAR control (VVC) method employing Smart Inverters is found to be most effective as compared to Volt-Watt control (VWC) for HC improvement. The authors of [28] used the same approach and noticed that HC of balanced PV feed-in is higher than the unbalanced PV feed-in. HC values of 5% to 50% of peak load have been found reasonable to be integrated into the grid in [66]. The research findings of [9] highlighted that the Intelligent approach (73% HC) is more conservative and accurate than the random selection approach (81% HC) for HC assessment of a residential distribution feeder with maximum unbalanced loading of 1477 kW. The PV penetration values with reference to maximum load and minimum load are analyzed as 142% and 400%, respectively, in [17]. The authors used a similar definition in [5] by investigating the HC dependence on PV deployment and found the conservative minimum HC of a feeder for small scale and large-scale PV deployment to be 63% and 69% of peak load, respectively.
Similarly, the authors of [27] investigated EPRI’s 34.5-kV test circuit for the HC analysis with respect to rated load demand. The penetration level is defined using local load reference as PPV/PLocal Load in [67]. The voltage profiles and power flow are well accounted for by defining the HC using peak load as a reference [6]; however, in [68], EPRI discussed that peak load for HC definition should be reconsidered because of a low correlation between both of them. Moreover, it is shown in [69] that HC value can vary between 10% and 100% of peak load under different network conditions, and thus peak load lacks the validity as a standard for HC definition. The problem of peak load as reference is that frequent load variations would result in inconsistent HC values [70].

3.2. Transformer Rating

HC can alternatively be defined with reference to the feeding transformer’s capacity. Here HC is defined as the ratio of total PV production to the transformer rated capacity in [6,8,13,16,34,39,46,70,71,72,73]. HC analysis of a radial LV network in Brazil ended up in a maximum penetration level of 38.2% of transformer capacity in [8]. The HC is more pronounced in the LV systems with more midday loading as per the findings of this study. Moreover, the HC values of a three-phase four-wire unbalanced LV network in Perth, Australia, and radial test feeder in Switzerland was found to be as 63.81 kW (31.9%) and 43 kVA in [39] and [46], respectively. The researchers in [46] investigated the application of the user-defined control and application of the Smart Inverter control for the increase in HC and concluded that the appropriate adjustment of inverter control parameters results in larger HC improvement as compared to fixed parameters. A rural small farm that experiences large variations in local demand from zero to its rated value is analyzed for HC value with reference to the transformer rating in [13]. Defining the HC based on TF rating can be attributed to the fact of large load changes in this network.

3.3. Customers Equipped with PVs

Alternatively, HC definition based on Customers equipped with PV is defined as the ratio of houses equipped with PVs to the total number of houses in the particular area under study in [23,30,31,37,74,75,76,77,78,79]. The HC of a LV UK network and residential radial network in Belgium is found to be 30% and 50% in [76] and [37], respectively. Moreover, the estimated HC values of a UK network with reference to Customer PV are recorded as 30%, 200%, 150%, 30% (summer), considering the limiting factors of reverse power flow, voltage rise, cable loading, and system losses, respectively, in [23]. The authors conducted detailed sensitivity analysis due to the dependence of PV HC on feeder characteristics in [74]. Moreover, HC is defined similarly in [75] while analyzing an underground LV residential network with single-phase customers and the PV panels having a common irradiance profile due to a small geographical area. Defining PV penetration with the reference of customers equipped with PV is a very intuitive approach in the UK context due to single-phase customer connections to the feeder with an adopted capacity of most installations at around 3 kWp–4 kWp. However, this approach of defining PV needs adequate care in the conditions where the households can have different capacities and two or three-phase PV connections [76].

3.4. Energy Consumption, Roof-Space, Active Power
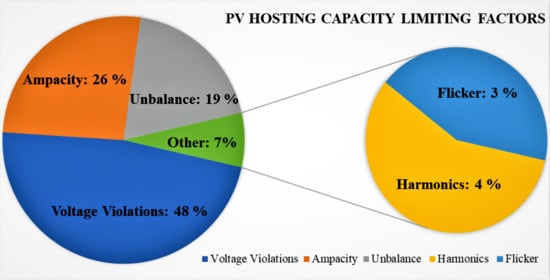
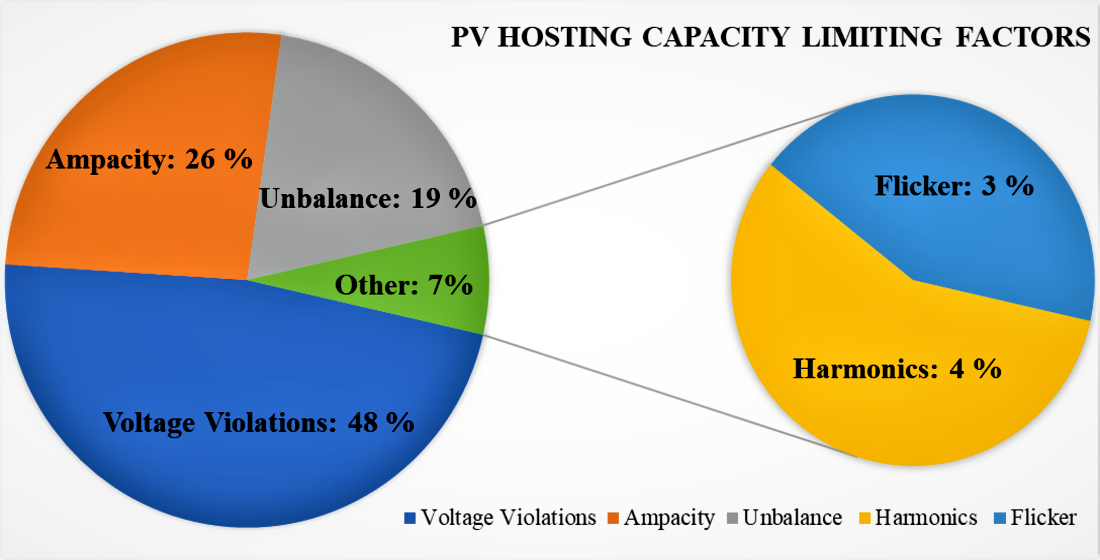
In terms of energy consumption, the HC can be defined as the ratio of total yearly energy generated by the PV system to the overall energy consumption [36,43,47,80]. The estimated HC of a German distribution grid is 88% with reference to annual energy consumption as reported in [47] and the authors discussed the conservative dynamic voltage fluctuations as per EN-50160 standard. In [43], the research findings of PV HC are noticed as 43% of 2.95 GWh of an Urban LV network considering very well-suited rooftops for PV penetration for HC analysis. The research conducted in [80] defines the HC of an IEEE 18-bus system similarly while considering the voltage limits and meeting the IEEE-519 standards for harmonic distortions and 88% HC has been estimated considering current and voltage as limiting factors in [36].
Furthermore, the PV HC, using roof space as a reference, is defined as the roof space of the feeder-connected houses that potentially enable the connection and installation of solar PV panels in [81]. However, the HC based on energy consumption, roof space PVs, and customer PVs do not provide any further information about the exclusive electrical parameters indispensable for DNOs for planning approaches. The HC based on actual active power of the load as the ratio of PV output to the active power of the load is defined in [41,82], and with reference to total generation capacity in [83].

4. Limiting Factors

The Power Quality standards and the feeder’s constraints in terms of thermal limits are the major deciding factors for the determination of maximum permissible PV penetration in LV networks [46]. Different Power Quality limiting factors result in different HC values and thus it is not a single value. In [72], the reverse power flow limits the HC value of the network to 75% and the maximum feeder voltage (1.06 Per Unit (p.u.)) limits the HC to 50%. Generally, HC is limited by voltage violations, voltage unbalance, ampacity, harmonics, and flicker [12,19,25,28]. However, some of the authors also considered element fault current complying with the rating of protection devices [46], reverse power flow [66], network losses [23,30], and utilization level [78] as the limiting factors. The excessive PV penetration beyond the defined performance indices can cause detrimental impacts on the distribution network and thus the standardization becomes vital for accurate determination of HC. Therefore, the HC value is greatly dependent on the limiting factors, either depending on Power Quality indices (over/under voltage) or customer service provisions [1]. This section provides a comprehensive overview of the limiting factors and the limiting range defined by authors. The literature review presents the voltage violations as the most ubiquitously employed limiting factor followed by ampacity and unbalance as shown in Figure 2a. The harmonics and flicker are reported as limiting factors in some studies; however, the harmonic as limiting factor outscore the flicker violations.

4.1. Voltage Level

The excessive PV penetration in the distribution network leads to the issue of reverse power flow consequently resulting in voltage rise. This section presents a comprehensive review of voltage violation limits used by authors for the assessment of permissible HC. There are five widely utilized voltage standards; European Standard EN-50160 (±10% of nominal voltage (Un)) [28], a more restrictive German Standard VDE-AR-N 4105 (+3% of Un) [15], American Standard ANSI C84.1(±5% Un) [14], Australian Standard (−6/+10% Un) [84] and Canadian Standards Association (CSA) (±6% Un) [85]. This section is concentrated solely on the voltage violations taken as the main limiting factor by the authors and the limits defined as per standards. The HC research conducted in [7,9,10,11], [41,45,48,53,54,56,66,67,86,87] defined the voltage violation limits complying with ANSI standard. The ANSI limits defined for overvoltage violation, voltage deviation and voltage unbalance are 0.95 p.u.–1.05 p.u., 0.03 p.u. and 0.03 p.u., respectively [86]. Similarly, voltage violations of real USA feeder [7] have been limited by ANSI C84.1 (±5% Un) with an overvoltage limit of 1.05 p.u. The authors are more concerned about steady-state voltage violations as per ANSI C84.1 2011 standard such as overvoltage, voltage deviation, and reverse power flow in [66].
Apart from other voltage quality constraints such as voltage deviation and voltage unbalance, the authors of [9,11,56,67,87] considered only the overvoltage as the main limiting factor with the maximum value of 1.05 p.u. (105%). Similarly, an IEEE 123-node 4.16 kV distribution feeder having single-phase and three-phase circuits has been investigated for HC determination in [87] and the network is restricted by an overvoltage limit of 1.05 p.u. The research results show that distributed PV installation increases HC as compared to concentrated confirming the claims of [52] as higher HC for dispersed PV installations. The voltage rise issues due to PV penetration have been addressed in [67] with an integrated control strategy of energy storage systems with OLTC and step voltage regulators and the authors considered voltage rise limit as the main performance criteria as per ANSI. Moreover, the HC studies in ([45,53,54,86]) considered voltage deviation and voltage unbalance along with overvoltage as performance criteria as per ANSI C84.1. The voltage quality criterion as the main performance constraint is employed in [45] by investigating an IEEE 33-bus benchmark distribution feeder. Here, the limiting factors are defined for overvoltage limit as 1.05 p.u., voltage deviation limit as 5% Un, voltage unbalance limit as 3% Un and dynamic voltage as 4% Un as per ANSI.
The authors of ([28,30,37,60,65,83,88,89,90]) and ([23,75,76]) considered EN-50160(±10% Un) and BS EN-50160 (−6/+10%Un) standard for voltage limits, respectively. The research conducted in [30] investigated HC of Danish LV network by taking phase voltage magnitude (±10% Un), voltage unbalance factor (2% Un), neutral potential and system losses as limiting factors complying to EN-50160 while considering the first two criteria as the most important. Similarly, the overvoltage criterion as the main limiting constraint with an upper limit of +10% Un(253 V, 1.1 p.u) is employed in ([60,65,83,89]). Moreover, voltage limits by investigating a typical UK LV distribution network [23] complied with the BS EN-50160 standard. The voltage limits as per Australian standard (−6/+10% Un) are taken into account in ([51,84,91]) in which HC has been investigated considering voltage limits as the limiting factor complying with voltage band of 216 V–253 V. Similarly, the voltage violations as the limiting factor are defined as 0.89 p.u.–1.1 p.u. (205 V–253 V) in [92].
The voltage standards in Canada are discussed in ([18,85]) and the voltage variation as the limiting factor for the investigation of a Suburban residential feeder in [18] comply with CAN3–C235 for normal operation. This voltage limit has been adopted by most of the Canadian utilities restraining the voltages for normal operation between (0.917 p.u.–1.042 p.u.). Similarly, the HC estimation of a three-phase unbalanced Canadian feeder in [85] has been restricted by voltage variations as ±6% of nominal voltage as per the Canadian standard. Stochastic analysis of PV integration in 11.4 kV MV feeder in Taiwan [2] considered feeder voltage impact as the main performance criteria with limits of overvoltage as 1.03 p.u. and voltage deviation as 3% Un and [8] considered the overvoltage as the main limiting constraint complying to (0.92 p.u.–1.05 p.u.). The authors of [3] defined voltage limits complying with 95–107 V for investigating a distribution network in Japan. The voltage limits for Japan are most severe due to the lower MV distribution network voltages than many countries. LV network voltage problems constrained by 1.05 p.u. are defined as the main limiting constraint in dictating the HC of MV network in [12]. Voltage rise as the conservative limit of 3% Un or 1.03 p.u. have been taken as limiting constraint in ([15,33,39,61,79]). It is apparent in Figure 2b that 1.05 p.u. and 1.1 p.u. voltage rise limits are the most widely adopted voltage constraints, respectively, followed by the other two standards.

Standards of Voltage Rise Limits across Countries

Central control of voltage is particularly challenging due to location dependency and varying local cloud cover of PVs thus making voltage as the primary constraint. Even if the PV inverter’s employment can alleviate the voltage regulation issues locally, it results in the conflict between the local and system-level operations [17]. Therefore, profound knowledge about the voltage rise limits due to PV penetration is vital for standardization purposes, and this section reviews the voltage level standards of different countries. The widely employed voltage standard EN-50160 and a more restrictive voltage rise standard VDE-AR-N 4105 are discussed by the authors of [93] in the context of voltage rise standard in Germany. The Standard EN-50160 limits the permissible voltage violations within Un ±10% for all 10 min values for 95% of the week with a nominal voltage of 230 V. However, the voltage change due to the integrated effect of all the generators must be ≤3% at the point of common coupling as per the more conservative standard VDE employed in Germany [93]. The voltage rise is limited to 1.03 p.u. in the analysis of the LV grid in a suburban area in Germany [15].
Standard EN-50160 as ±10% Un is used as a benchmark for the maximum voltage rise limit due to PV for Finland [28] and for a typical urban distribution grid in Cyprus analyzed under Monte Carlo Simulations [88]. A three-phase Radial network in South Africa is constrained similarly by voltage limits of ±10% of Un (230 V) in [60]. The voltage rise limit due to PV penetration in a typical Urban network in the UK is limited by BS EN-50160 in the UK context as 253 V (−15/+10% Un) in [23]. Although, the lower limit of the UK standard is extended further to −15% Un instead of −10% Un, the upper voltage limit still complies with the EN-50160. An Italian Urban MV radial distribution network investigated for HC analysis limits the voltage limits as 96–110% of rated MV value as per EN50160 ±10% Un in [21]. However, the lower voltage limit is taken −4% Un as a conservative approach by taking into account the voltage profile of the LV level in this study.
The voltage limits of an Australian Suburban network with 35% PV HC in [71] and LV feeder in Australia [94] are defined as 0.95 p.u.–1.06 p.u. (243 V as voltage rise) and 0.89 p.u.–1.1 p.u. (253 V as voltage rise limit), respectively. A 1.06 p.u. voltage rise limit for Sri Lanka has been established by the analysis of an urban network in Sri Lanka [74] and an urban Sri Lankan LV network with a natural unbalance of 1% Voltage Unbalance Factor (VUF) [72]. The authors of [30] investigated a Danish LV network for coordinated control of OLTC and reactive power control by PV inverters complying to the voltage limits of ±10% Un as per European Standard EN-50160. However, the voltage rise resulting from renewable energy integration is limited to 3–5% in LV grids as the rest is reserved for the MV grid considering MV voltage drop [30]. Moreover, the maximum voltage rise is set as +5% of Un (230 V) in an LV feeder in Denmark for the HC analysis in [77]. PV HC of a radial small-scale industrial network in Qatar is limited by the voltage rise limit of ±6% of the nominal steady-state voltage in [13].
The over-voltage limit is set as 1.05 p.u. defined by ANSI C84.1–2011 as ±5% of the nominal voltage in the USA [7,9,41] and the authors in [24] analyzed a coordinated voltage regulation strategy considering the ANSI C84.1 for 120 V nominal voltage. The customer overvoltage limits are defined as 1.05 p.u. in the investigation of the 25-bus test system in Quezon City, Philippines [12]. The HC of an actual urban 20 kV distribution feeder [95] and real distribution feeder in Godean, Yogyakarta in Indonesia [44] is limited by 1.05 p.u. as the upper voltage limit. The authors of [1] investigated a Swedish regional distribution network that is integrated with mixed DER of wind, bioenergy, hydropower, and solar power and defined the voltage limits as ±5% of nominal voltage. A stochastic analysis of PV integration in 11.4 kV feeder in Taiwan, China considered the voltage rise limit as 1.03 p.u. (3% Un) in [2]. Moreover, the HC assessment of a Swiss suburban 400 V distribution grid in [33] revealed the voltage rise limit as 3% of 230 V nominal voltage. Finally, the voltage limit of Japan (95–107 V) is noticed to be most severe due to the lower MV distribution network voltages than many countries in [3].
The research shows that the maximum permissible voltage rise is 1.1 p.u. in Australia, Italy, Finland, Cyprus, South Africa, and the UK followed by 1.06 p.u. as permitted by Sri Lanka and Qatar. The 1.05 p.u. voltage rise standard is noticed in the USA, Sweden, Denmark, the Philippines, and Indonesia and the most restrictive voltage rise of 1.03 p.u. is practiced in Germany, Switzerland, and China. The maximum permissible voltage rise for Japan is recorded as 107 V and the voltage rise limits are listed in Table 2 and shown in Figure 3.

4.2. Ampacity

The current carrying capacity (ampacity) of cables and overload limits of transformers is the second major limiting factor after the voltage violations for the maximum PV penetration as discussed in the literature. The maximum PV HC with transformer load as reference is reported in [43] as 100% of nominal rating, 150% of rated power in [15], and 187.5% of rated capacity in [8]. Similarly, the maximum cable ampacity limit is defined as 150% of rated power [15] among other limits such as 75% of nominal apparent power [96], 85% of line rating [43], 100% of nominal rating and 105% of nominal line current [58]. This review results reveal the cable overloading limit to be more restrictive than the transformer overloading limit as shown in Table 3. However, the unexpectedly high overloading limit of the transformer must be carefully examined to not decrease the lifetime of the transformer. The 100% PV HC limit defined in [43] is accompanied by certain assumptions such as: N-1 criterion is assumed for transformer that is violated for 13.7% of the time/year and thereby overloading the transformer for 3.95% of total operating time in a year.
The overloading limit is explicitly defined as 100% of the nominal rating in [12,13,25,43,46,64,74,95] and ampere rating of the device in [38,97]. The line loading constrained by 100% of the nominal rating is used as a limiting factor for analyzing the 25-bus test system in [12]. Similarly, [13] considered the voltage limits and overloading of TF and cables as limiting factors for HC assessment of rural small farm in Qatar with limits complying to ±6% of Un and 100% of nominal rating.
A risk-based analysis is carried out in [8] for estimating the HC of 50,000 LV systems in the southeast of Brazil considering voltage limits, transformer overload limited by 187.5% of rated capacity, conductor thermal limits, and voltage unbalance within 3% of Un as limiting factors. The research conducted in [28] and [88] defined the thermal limits of TF and lines as limiting factors in addition to voltage variations for HC estimation of a Finnish LV network and urban touristic network in Cyprus, respectively. Moreover, the authors investigated the HC based on ampacity by considering the conductor overloads complying to ampacity [14], thermal limit as per current rating [3], loading of TF or cable section within 150% of rated power [15], 10-min three-phase loading level of the transformer lower than nominal capacity [98] and thermal violations as per component ampere rating [38]. The overloading constraint complying with the rating of components is defined in [19,95,97,99]. The authors in [96] investigated a real rural network by utilizing actual building roof data for HC and defined voltage limits as per ±10% Un, line loading within 75% of nominal apparent power, and transformer loading complying with 100% of nominal apparent power. The investigation of the Swedish regional distribution network in [1] considered overvoltage and overcurrent as the main limiting factor complying with ±5% Un and 298 A or 480 A, respectively.
Researchers of [58] considered voltage limits, TF, and cable overloading as the main limiting factors for HC determination of an urban network in New Orleans with TF loading as 100% of nominal and cable overload as 105% of nominal line current. The current limits as a limiting factor for HC assessment in [100] and [101] are found as 350 A and 200 A, respectively. The HC assessment of an urban LV network in [43] assumed the cable current ampacity limit to be 85% of line rating and maximum PV HC to be limited to 100% of TF rating along with overvoltage as another limiting factor. Feeder currents limited by protection device rating has been used as a limiting factor for HC in [59]. Finally, the idea of alteration of limiting factor has been established in [102] that investigated the manifestation of limiting factors under different network conditions and noticed that the voltage rise as the limiting factor is replaced by conductor ampacity by changing the substation voltage from 1.05 p.u. to 1.0 p.u.

4.3. Unbalance

The negative sequence unbalance can be regarded as an independent performance index for HC. Voltage unbalance, among many others, is the limiting constraint for HC and studies have shown that this unbalance condition can be mitigated by connecting the PV inverter with the phase having the least phase voltage [16]. The unbalance limit for negative sequence unbalance for LV networks in different countries is defined by IES standard as 2% [4]. It is a significant Power Quality issue in LV networks that increases with unequal loading and it is defined as a limiting factor for HC assessment in [8,23,30,34,35,39,45,54,71,86,90,103]. The authors in [8,45,54,86] defined the unbalance limit complying with ANSI Standards as 3% of Un (0.03 p.u.). The voltage unbalance during maximum load condition exceeds the 0.03 p.u. threshold reaching the 0.05 p.u. value in [86] where the voltage quality criterion is taken as the prime limiting factor for HC assessment. Moreover, in [54], the locational sensitivity of HC has been discussed by analyzing distribution feeders with voltage criteria limited by ANSI. The research conducted in [30,34,71,90] further limited the unbalance value to become 2% of Un (0.02 p.u.). Voltage unbalance in Australia is permissible as the negative sequence voltage up to a maximum of 2% Un and a real three-phase four-wire LV network in Australia has been investigated in [34] complying this limit. The most conservative voltage unbalance limitation is defined in [35,39] as being limited by 1% of Un (0.01 p.u.) for the HC assessment. The estimated HC is 31.9% considering voltage magnitude (±3% Un) and voltage unbalance (1% Un) as performance constraints for the first simulated case in [39]. Moreover, the three-phase optimal power-flow based approach becomes indispensable to be integrated into the HC calculations due to an unbalanced Low Voltage Distribution Network (LVDN) in [35] with voltage unbalance limited by 1% Un. Finally, the authors in [23] limited the unbalance by 1.3% Un. The voltage unbalance limits of different research studies are listed in Table 4 and a percentage representation of unbalance limits of different studies is shown in Figure 4 showing the 3% Un and 2% Un as the most widely employed voltage unbalance limits in literature.
The naturally unbalanced system with 1% Voltage Unbalance Factor (VUF) has an increased unbalance at night peak and voltage unbalance condition is impacted by inverter size and the location of single-phase PV connections [72]. The authors investigated the voltage imbalance phenomenon on a radial residential LV urban network comprising of three-phase feeders and noticed the imbalance increase from 0.36% to 1.84% from beginning to the end of the feeder in [104].

4.4. Harmonics

HC can also be impacted by the harmonics especially arising from the PV inverters and non-linearity of the load that also deteriorate Power Quality (PQ). High switching frequencies of the modern inverters inject supra-harmonics despite having close to sinusoidal outputs. Therefore, utilities are required to upkeep the network performance by limiting the individual and Total Harmonic Distortion (THD) at point of common coupling within limits defined by IEEE-519 [24]. The maximum THD is defined as 6.1% and 5% in [25] and [24], respectively, with a higher value of 6.1% still complying to the upper limit of 8% THD. The effect of load and source nonlinearity has been taken into account for the analysis of an industrial system for the determination of HC with harmonics as the main limiting constraint in [105]. The authors of [25] analyzed the HC of a distorted distribution network considering harmonics as the performance constraint with limit defined as 5% of maximum THD as per IEEE Std. 519–2014. However, the overvoltage remains the major constraint in [25]. Additionally, the authors of this study stated about the importance of inclusion of harmonic based constraining factor in DG penetration studies in the planning problems. The research conducted here also referenced other studies utilizing the harmonic filters that replace the capacitor banks in distorted networks for increasing DG penetration levels. The harmonic pollution not only increases the system losses but results in a reduction in energy transfer capability and transmission Power Factor (PF). A rural low voltage residential distribution network in Mauritius is investigated in [24] for maximum PV penetration with harmonics as the limiting criteria. The initial THD level without PV DG is found as 1.9% so the maximum THD margin for this network is 6.1% considering the upper-level threshold of 8% THD. Besides, this study mentioned about the increase in THD with a penetration level of 30% in research conducted in New Zealand and an Australian network restricting the PV HC by 9.7% considering THD and Individual Voltage Distortion as the main performance constraints. The HC analysis of a UK network for different impact criteria such as voltage rise, system losses, line and TF overloading, voltage unbalance, harmonics and reverse power flow is carried out in [23] and the harmonics as the limiting factor is constrained as 5% THD(voltage).

4.5. Flicker

Fast voltage fluctuations are a result of the frequent changes in production or consumption. IEC 61000-4-15 defines the long term and short-term flicker severity and voltage flicker is defined by IEC 61000-4-30; however, flicker severity requires additional modules for proper definition. The flicker severity is now considered as the secondary performance constraint as discussed in [4] because incandescent lamps are replaced by other alternatives that were the primary indication of flicker severity indices. Clouds’ movement can also induce voltage fluctuations resulting in voltage instability issues in areas with larger PV penetration. This condition might worsen if cloud variations are occurring at an even faster rate than the operation of voltage regulators employed for voltage stability [20]. The research conducted in this study is focussed on investigating the fast voltage fluctuations due to the cloud’s transients on an actual substation at constant PF of 90% lagging. The voltage flicker limit defined as 0.7% voltage sag at 1-min interval is not of significant concern in this study due to the rare occurrence of only once in a 3-days period but can cause issues at a high sampling rate of solar irradiance.
Voltage flicker problems resulting from high DG penetration and their mitigation techniques to combat the adverse effects of excessive DG penetration on the voltage quality are discussed in [26]. The authors discussed the employment of smart loads to regulate and manage the input utility side voltage instead of the output voltage. Dynamic characteristics of EN-50160 impose strict limits on the rapid voltage changes to be less than 0.05 p.u. However, a study on an MV network in Queensland, Australia experienced the rapid voltage fluctuations to be more than 0.05 p.u. in extreme situations in [106]. HC restrictions due to dynamic changes on cloudy days are more pronounced than static characteristics in a study on the German distribution grid in [47]. The research in [22] investigated the impact of rooftop PVs on the distribution system modeled by three distribution feeders considering voltage rise and flicker as the main limiting constraints. The authors defined the flicker constraint complying with IEC 61000-4-15 standard as a higher flicker limit of 0.5 that is midway between the long-term flicker (Plt) standards defined by various distribution utilities (0.25–0.7). Moreover, the flicker as a Power Quality issue has been discussed in [107] considering IEEE 1453–2015 Standard limiting the fast voltage fluctuations and flicker limits as long term: Plt(0.8) and short-term flicker (Pst): Pst(1) that are violated occasionally. The authors in [108] defined two flicker standards as 1 and 0.5 as per EN-50160 and German VDE-AR-N 4105, respectively with the latter being more conservative criteria. They further discussed the flicker limit violation due to the inclusion of flicker inducing loads in addition to cloud movements beyond the stricter German standard. The maximum PV penetration analysis of an urban radial MV network in central Italy [21] defined the limiting factor to be rapid voltage fluctuations as 6% of the rated value as per the non-binding condition of EN-50160. The voltage flicker level as per the tolerance level of 3% is defined as a limiting factor in [19] along with voltage magnitude, transformer, and line loading. This system is investigated under the worst-case scenario and voltage flicker magnitude is defined as the voltage difference between No load/No PV generation and No load/Maximum PV generation.
A summary of PV HC Performance Indices and most widely adopted limiting constraint values for PV hosting capacity evaluation is given in Table 5.

5. Summary of Estimated Hosting Capacities of Present Networks

The traditional distribution networks can accommodate some PV penetration even though they are designed for heavy loads with no PV integration. The HC value of the network without any control strategy is of prime importance in investigating the current capacity and appropriate improvement methods without causing any operational bottlenecks. An overvoltage criterion is considered at minimum load conditions in [66] for HC assessment (w.r.t peak load) and the authors noticed an HC of 38%, 15%, and 105% in the three test circuits. The orientation of the PV panel for HC assessment has been investigated in [96] and increased radiant exposure can be achieved if the PV panel is west oriented. Moreover, the study concluded that the south-facing roofs are the best option for the installation of solar PV panels as they receive at least 80% of yearly radiant exposure. This section presents a summary of HC values in the present networks without any mitigation means in different network conditions and different geographical areas. Moreover, HC dependence on network topologies, load modeling, and different references has been presented considering actual HC values.

5.1. Estimated HC of Urban, Suburban, Rural Networks

The estimated HC values of the rural networks are lower as compared to urban networks pertaining to the topological and electrical properties of the former [63] and due to the voltage rise issues at the end of long weak feeders [38]. HC of 239.7% with reference to the peak load of a Finnish LV balanced urban network for 0% MV change is higher than the HC of 198.1% of balanced rural network despite the similar geographical location of 61.9241° N [28]. The idea of higher HC value of an urban network as compared to rural is further validated by the HC analysis of three network conditions: rural, remote (with an attribute of small farms connection), and urban by taking roof-space as a reference in [81], as shown in Figure 5. The estimated HC values of this research in the urban and rural networks are reported as 45% and 13% with thermal and voltage violations, respectively with the load modeling as active and reactive power profiles that are independent of the voltage and frequency. However, the authors in [28] noticed substantially lower values of HC in the case of unbalanced PV feed-in. The HC drop is reported by changing the PV feed-in from balanced to unbalanced as 239.7% to 95.4% for urban network and 198.1% to 128.9% for the rural network with the former network experiencing a drastic decrease in HC by about 144.3%.
The Monte Carlo based simulations have been performed on an urban unbalanced radial LV network in the southeast of Brazil (14.2350° S) covering 98 cities [8] with PV allocation as the random variable and the HC is recorded as 38.2% of the transformer rating. A 50% penetration level (w.r.t Customer PVs) did not result in any voltage violations and hence defined as HC in the analysis of a residential network in Belgium (50.5039° N) [37]. Similarly, the HC value considering similar reference of Customer PVs has been reported as 394 kW in an Urban LV Sri Lankan network (7.8731° N) [74]. The authors in this study observed two HC levels with feeder voltage and ampacity as the limiting factors resulting in 394 kW as the maximum HC value under the line overloading limit and a conservative value of maximum HC as 164 kW under the feeder voltage limit.
Two urban unbalanced LV networks in Kotte (6.8868° N) and Perth (31.9505° S) can accommodate the maximum HC values with respect to transformer rating as 40% and 31.9% in [72] and [39], respectively. The HC values without any mitigation means of three urban networks in the Northern hemisphere are found as 32 MWp, 522 kW and 4.8 MW (77%) in [88], [63] and [10], respectively. In [88], the authors investigated an uncontrolled and controlled PV deployment scenario for an urban network in Phapos, Cyprus (34.7720° N) under two PF settings of unity and 0.95 and observed that performance indices start violating after 32 MWp. Similarly, [63] discussed the impact of network topology on HC variation by comparing the urban and rural networks in 54.5260° N with urban networks having higher HC value of 522 kW than 132 kW of rural network in the same geographical area. A fairly low PV penetration of 15–30% of peak load (33.69 MW) is noticed in an Urban balanced three-phase network in New Orleans (29.9511° N) with distributed PVs [58]. Additionally, the authors in [62] investigated the maximum HC w.r.t peak load (31.276 MW) of the Middle East sub-grid network in Hebron city, Palestine under the condition of uniform PV distribution. They estimated the HC of LV network as 37.53 MW (120%) that is constrained by the real size of MV/LV substation and MV side HC as 21.89 MW (70%). The allowable PV penetration of an urban Italian MV network (41.8719° N) investigated in [21] is up to 3.07 MW–3.21 MW where the authors modelled the loads as P and Q buses and assumed a PF of 0.9. They further investigated the impact of improvement method for this HC value that will be discussed later in the Section 6.4. Moreover, the first HC of an urban LV network in Zurich (47.3769° N) is reported as 43% of total energy consumption (2.95 GWh) and it is found considering very well-suited rooftops for PV penetration in [43] without encountering any voltage and thermal violations. However, a higher PV HC of 83% has been recorded by considering all scenarios of well and very well-suited rooftops but at the expense of high TF overloading of 100% of the rated power (630 kVA) and permissible cable loading of 85%. The PV penetration limits investigated by the authors of [95] and [73] are reported for two urban networks as 8.8 MW with respect to load and 35.65% of the transformer rating of 500 kVA, respectively.
Furthermore, the three rural networks in the Northern hemisphere recorded the HC values (w.r.t peak load) without any control as 1.2 MW–3.2 MW [3], 86% [65], and 132 kW [63]. In [3], a rural network in Japan (36.2048° N) was investigated and the base HC value of 1.2 MW without PF control was improved to 2.3 MW and 4 MW by controlling voltage using constant PF and distributed control strategies, respectively. The authors of [24] investigated a rural LV residential distribution network in Quatre Cocos, Mauritius in the Southern hemisphere (20.2016° S) for the analysis of maximum PV penetration with reference to network load capacity with harmonics as the limiting criteria and reported 40% HC. Moreover, a rural small farm network in Qatar (25.3548° N) can accommodate the PVs up to an HC of 30% of the transformer rating of 300 kVA as discussed in [13]. The HC assessment of an Australian suburban unbalanced LV network (25.2744° S) shows a base HC of 35% of the transformer rating (200 kVA) in [34] and [71]. The research conducted in [28] reported a high HC value of 233.5% of the peak load of a suburban balanced Finnish LV network. The even PV penetration of a suburban network in Switzerland (46.8182° N) results in an HC value of 28.57% of energy consumption [80].

5.2. HC Dependence on Network Topology, Load Modelling, Geographical Area and References

The HC dependence on network topology, load modeling, and PV distribution has been proved in [55], [60], and [94], respectively. The HC of two UK LV networks (55.3781° N) is reported differently as 200% and 30% with respect to Customer PV in [23] and [76], respectively, that might be attributed to a different network topology that is not explicitly defined in these studies. The approach of different load modeling has been discussed in [60] corroborating the fact that load modeling and network topology can significantly alter HC values. The HC values, by considering feeder design load as a reference, of a radial South African network (30.5595° S) investigated with load modeling as average and variable loads are noticed as 70% and 45%, respectively, in [60]. Moreover, changing the network topology from Industrial to Residential in a distributed three-phase network in Cape Town (33.9249° S) results in a drastic change in HC value with respect to maximum load from 31% to 82–150% in [55]. Geographical orientation of roof has been taken into account in [55] and a 26° and 30° tilt angles are assumed for residential and industrial areas, respectively. Moreover, a difference in PV distribution as concentrated and distributed has significantly changed the HC value from 20% to 40% of the load in an LV Australian network (25.2744° S) in [94]. The distribution feeder in Yogyakarta (0.7893° S) with single-phase load has an HC as 16.48% of peak load in [44] and at least 30% of HC of the two distribution networks in USA (37.0902° N) has been reported as >30% and 35% of peak load in [59] and [7], respectively.
However, it is difficult to generalize HC assessment by conducting a study on a single feeder due to its dependence on multiple factors. The research conducted in the subsequent references focussed on the HC dependence on feeder length and voltage class. The authors in [53] discussed that the long feeders with high impedance have lower HC and a higher value of HC can be achieved by higher voltage class [54,56], and more loads along the feeder length. The authors of [54] compared the HC of 7 test feeders with feeder 1 having the lowest voltage class (4 kV) among others of 12 kV voltage class. Although, the HC value should be higher in case of feeder 1 with lower impedance value but the lower voltage class of feeder 1 resulted in lower HC value validating the HC dependence on voltage classes as well. Two distribution networks in California (36.7783° N) reported substantially disparate HC values as 132% and 15.5% of peak load in [14] and [48], respectively. The prime reason for such drastic change in the HC of two networks despite similar geographical location is attributed to the feeder lengths. The HC of the shortest feeder (888) turned out to be highest as 132% among the five distribution feeders due to the short feeder length and lowest impedance value in [14]. Similarly, authors in [48] attributed the low value of HC, 15.5% of the peak load, to the length of the feeder despite having a higher voltage class. The base HC (w.r.t Customer PVs) without the employment of OLTC of a real LV UK network (55.3781° N) of 9.2 km total length has been reported as 40% in [31] as compared to a 30% PV HC [75] in real LV UK network with same geographical location and HC reference. The HC values of the networks in [46] and [85] have been reported as 43 kVA (46.8182° N) and 5.454 MW (52.9399° N), respectively, and the authors of [46] investigated a radial network considering +3% limit of voltage deviations as the base case for HC estimation.
The reference for HC definition is of significant importance in addition to the network topology and the HC variation depending on reference definition despite having similar network topology and geographical location is shown in [82] and [39]. Two LV unbalanced networks in Western Sydney (33.8048° S) and Perth (31.9505° S) have the estimated HC values of 111% [82] and 31.9% [39] with respect to active power and transformer rating, respectively, thus validating the importance of HC reference. Besides, the HC alteration based on limiting factors is of significant importance and it is confirmed by the analysis of an 11.4 kV MV distribution feeder in Taiwan, China (23.6978° N) with a total load of 4.63 MW considering the overvoltage and voltage deviation as the limiting factors in [2]. The authors noticed two different HC values as 86% of peak load with overvoltage violation as the limiting factor and 65% of peak load with voltage deviation as the limiting factor. The voltage deviation resulted in a conservative HC of 65% in this research. MV feeder in the German Distribution grid is investigated in [47] for the assessment of the RES penetration level of 88% of annual energy consumption. The reactive power control of PVs for a single real three-phase unbalanced distribution feeder with an initial HC as 733 KVA is discussed in [57]. Additionally, the HC definition w.r.t Energy Consumption should be dealt with care when considering the HC of Northern areas where the PV production during winters is practically nominal. Therefore, the HC w.r.t Energy Consumption must be accompanied by HC w.r.t Power to avoid any misinterpretation of HC value.
HC measurement data, besides the above-mentioned attributes, is another important parameter for an accurate estimation of HC. Only 19 research articles [11,27,41,42,44,45,46,48,61,64,67,69,80,83,87,90,100,110,111] out of total reviewed publications in this article employed typical off-the-shelf data for HC measurement including the test networks from the IEEE, EPRI and CIGRE. Whereas, almost half of the articles used the self-measurement data or Distribution System Operators’ (DSOs) provided data. HC calculations, considering it as a probabilistic approach, based on actual measurement data would give a better real-life estimation of possible maximum PV penetration. In addition to truthful load values, measured data allows to include power quality issues caused by the load, and estimate the headroom that is left for PVs. The primary benefit of employing measured data for HC assessment is getting the information about the realistic load values and realistic power quality issues caused by the load (e.g., voltage unbalance caused by asymmetric load and finding out which phase has the biggest asymmetry). Moreover, finally, the impact of different simulation environment on HC values is discussed in [9]. The random simulations and intelligent scheme for HC assessment (w.r.t peak load) of a residential feeder in the USA (37.0902° N) with balanced load modeling generates two different HC values as 81% and 73%, respectively, in [9] with the intelligent scheme as the more conservative.
A summary of PV HC estimates in different areas (latitudes) with the HC reference used and the estimated HC quantity is shown in Table 6.

6. Hosting Capacity Improvement Methods

The PV penetration affects the grid voltages and load profiles in the off-peak periods such as summers due to high PV generation and lower demand resulting in reverse power flow which leads to voltage rise issues [13,93]. The HC improvement has become indispensable due to the unprecedented PV penetration and literature presents many HC improvement methods ensuring the stability of the network that is prone to unexpected generation and consumption profiles. The HC can be increased if the R/X ratio of secondary lines is lower, the substation is strong and the substation bus voltage is adjusted at a lower level to avoid any further voltage rise [112]. The HC improvement, however, depends on varying factors such as maturity of applied technology, cost and benefit analysis, the current grid codes, and line congestion thresholds [1]. Additionally, increased PVHC results in energy/power loss, and thus the idea of maximization of HC and minimization of energy losses is of conflicting nature [113].

6.1. Voltage Control

6.1.1. Supply Transformer Tap Changer

The network voltage profiles can be compensated automatically by the inclusion of OLTC as the most practical means of voltage control methods and this section is focussed on OLTC employment for HC increase. The solid-state OLTC employing modern devices operating at high frequencies results in quick response times as compared to conventional OLTC with long response time in the range of 100 ms to seconds [51]. The OLTC efficacy for HC improvement in balanced three-phase connections as compared to the single-phase connections is proved in [28]. Its employment in balanced PV feed-in in the rural and intermediate regions with voltage as the main limiting factor improved the HC by 17.5% and 43.5% of peak load for 0% and 5% MV change in this study. OLTC installation on the MV side of TF for the HC increase is discussed in [15] with the remote measurement strategies for the estimation of under and overvoltage and thus adjusting the tap settings for voltage regulation. Similarly, the optimized settings of OLTC along with the coordinated operation of Smart Inverters and SVCs resulted in HC improvement of the Keolu substation by the double amount from 77–154% of peak load in [10]. The critical length of feeder has been highlighted in [114] where a voltage band extension and thus PV HC increase is achieved by OLTC operation and reactive power control. An appropriate voltage control can limit the further penetration of PV systems and thus leads toward a situation in which fewer buses experience voltage violations. This idea has been established in the context of a rural European network comprising of a 250 kVA transformer while analyzing the OLTC potential for HC improvement in [65]. The coordination of PV inverters and three-phase OLTC for HC (Customer PVs) increase is discussed in [30] with an increase of 40% to 70% HC of a Danish LV network employed as a case study. The authors discussed the potential of OLTC to increase the voltage rise threshold from 3% to 11% in LV grids in this study. The HC in [31] is defined similarly as the above-mentioned research. It is increased from 40% to 60% and 40% to 100% by OLTC integrated with local and remote voltage regulation, respectively, in a real LV UK network of 9.2 km total length. The voltage regulation issues at 100% PV penetration of 46% of customers without OLTC have been decreased to only 18% of customers with OLTC inclusion. However, in this study, OLTC employment considering economical aspects is found to only be appropriate at high PV penetration levels of above 70%.
The OLTC for voltage regulation has been proven to be effective in comparison to PV Var absorption by investigating a real rural MV/LV Brazilian distribution network through a time-series approach in [79]. The authors highlighted that the PV systems with 0.92 inductive PF and OLTC transformers can increase the PV HC (Customers PV) by 100% in most LV networks. Moreover, a remote voltage estimation in conjunction with OLTC resulted in HC increase from 40% to 100% (Customer PV) with a 1-min cycle as compared to a 70% increase with a longer control cycle in [75] for a real UK residential LV network. Similarly, three control strategies of OLTC for real UK LV network are discussed in [76] and remote monitoring-based control and time-based control have been found comparable concerning HC increase from 30% to 50% of Customer PVs. The coordinated application of OLTC and Smart Inverters improved HC from 9.3 MW to 24 MW as compared to the 17 MW increase with only Smart Inverter’s application in an EPRI’s 34.5-kV test circuit in [27]. The OLTC inclusion in terms of economical constraints and increased network losses is discussed in [29,31,70,114]. The economic aspects of the proposed method need proper consideration and OLTC is discussed as an expensive voltage regulation approach in the LV network in [29] but their operation becomes indispensable in case of increased penetration of PVs. A HC increase of 7.764% with the OLTC tapping of +/−10% is highlighted in [29] from 105.266% to 113.03% of the transformer rating of a rural LV region and the limiting constraint changed to transformer capacity after the voltage regulation. However, the OLTC inclusion into three LV networks in the Netherlands: urban, suburban, and rural, is found to be an economical option as compared to network reinforcement in [70] particularly for long rural and suburban areas where huge future PV potential is expected. The inclusion of OLTC and Reactive Power Control (RPC) of LV networks results in the extension of voltage band from 3% to 8.5% but at the expense of increasing the network losses by almost three times as discussed in [114].

6.1.2. Inverter Q Control: Oversizing

Reactive power control is very efficient in high voltage grids having a high X/R ratio as compared to low voltage grids. The Active Power Curtailment (APC) for maintaining the network stability under high PV penetration has been discussed in some studies [32,89] but the authors of [45] prioritized RPC in terms of voltage compensation as compared to APC. The system works at a unity PF during the normal operation with the network voltages within acceptable limits. However, the authors in [52] stated that the network needs to be operated at a non-unity PF for the reactive power support if the node voltages start to approach limits and active power curtailment is to be avoided. A voltage control strategy by reactive power regulation has been investigated in [88] but such an approach can alleviate only the voltage violations resulting in the thermal limits as main operational constraints.
Similarly, the reactive power absorption has been highlighted to effectively decrease the Electrical Energy Storage System capacity for overvoltage prevention by 30% in [77] by analyzing LV feeders in Bornholm. The integrated operation of APC and RPC for HC improvement has been employed in [73,83,115] for HC improvement. The individual gaps of APC and RPC [115] and HC improvement of a network consisting of single-phase fixed loads [83] are addressed by the coordinated approach of APC and RPC. Moreover, an additional inverter capacity by inverter oversizing of 17.64% is indispensable in the research conducted in [83] for extending the inverter’s operation range. Following the suit, a similar coordinated approach is deployed in [73] for the voltage stability complying to EN-50438 and an HC increase is observed from 35.65% to 66.7% of distribution transformer kVA rating. PV inverter’s ability to inject reactive power is affected by the balancing of PV inverter rating with PV active power that can be handled by oversizing the inverters to retain its ability of reactive power support and thus maintaining the reactive and active power control of inverters. Similarly, inverter oversizing by a factor of 41.4% results in 100% reactive power support at 100% active power generation in [40]. The authors validated the research results by analyzing a 33 kV 16 bus UK distribution system and asserted that a small inverter oversizing at the planning phase is the most promising approach of reactive power control.
However, the cost incurred in inverter oversizing should be carefully evaluated against the reduction in transformer loading while adopting the inverter oversizing for increasing HC [110]. The optimum overrating of inverter sizes considering the upgrade cost of PV inverter leads towards 60% oversizing [39]. Nevertheless, the overrating aspect of PV inverters has been discussed in [57] as the least expensive strategy for PV HC increase and addressing the over-voltage concern. A 120% inverter overrating relative to the real power of the PV system is assumed in this study. The authors, here, highlighted that the local VVC of PV inverters with a 20% margin of kVA capacity relative to the PV system output has increased the HC by 84.4% of peak load.
PV inverters operating at fixed lagging VARs can alleviate from voltage issues thus increasing the HC [17,56] but at the expense of increased system losses. The inverter oversizing by 15% can increase the VAR capacity without substantially increasing the inverter cost as discussed in [17]. As the locational HC of long, lightly loaded feeders is limited by the overvoltage issues so the researchers in [38] revealed that the Smart Inverters with VVC along with oversizing the PV inverters by 10% of PV Direct Current (DC) power rating increase PV HC at some locations by 100%. The authors in [87] analyzed three scenarios; no PV support or tap control as a base case, inverter PV support and inverter PV support plus tap control, and noticed an HC increase from 240 kW to 660 kW employing PV reactive power support plus tap changer. They also discussed the decreased voltage magnitudes with increased PV injection nodes and thus increasing PV HC. Similarly, a 20% scaling factor is found appropriate in the context of uniformly oversizing all the inverters relative to their PV panels for the provision of unity PF in the entire day for reactive power support in [110]. A distributed control approach for improved HC is analyzed here for an IEEE 13-bus feeder system with PV systems sized with respect to load connected. The optimal inverter rating dependent on annual energy yield and the analytical solutions in a grid-connected PV network with a constant tilt angle is discussed in [116]. The study results reveal that the higher power rating inverter can operate for longer periods as compared to a lower power rating inverter.

6.2. Battery Energy Storage System

Centralized BESS is an efficient means to increase PV HC in remote areas standalone off-grid power supply systems. An almost double hosting capacity increase of 19.65% has been noticed from 19.64% to 39.29% by the combined application of BESS and forecasting [117]. This study also mentioned the effect of a centralized BESS control technique on the increased PV penetration and the forecast algorithms combined with PV BESS for increasing the PV hosting capacity by 26% in a German residential network. Similarly, a 60% HC increase (5.5 MW to 8.8 MW) of a distribution network in northwest Saskatchewan, Canada is achieved by the coordinated operation of three voltage regulators and BESS [85]. However, the authors argued the BESS to be a cost-competitive option in case of feeders with weak interconnection with the main grid. A voltage sensitivity analysis based control strategy of Electrical Energy Storage System management is investigated for a three-phase LV feeder of Danish island Bornholm in [118] to address overvoltage issues. An HC increase of up to 50% is achieved by the installation of only 5 kWh battery per customer along with a fixed power limit in this study. However, the proposed approach and dynamic set points determination in this research resulted in a further HC increase of up to 75%.
The optimal size and location of BESS are discussed in ([35,36,119]). An optimal BESS allocation approach in a real LV distribution network in Victoria, Australia increased HC by 281.45 kW of an unbalanced network along with mitigating phase unbalance in [35]. Optimal sizing and location of BESS in conjunction with a quadratic control approach of central BESS have been implemented on two MV feeders in Germany and a comparison between battery size and converter size has been carried out in [36]. The quadratic control (active and reactive power control) in central BESS increases the HC by two times (29.5%) through RPC in conjunction with different sizes of battery and converter. The authors in [119] presented a review on voltage regulation techniques and referenced a study focussed on the optimal size of BESS and the cost-benefit analysis of the employed BESS used for voltage regulation in the context of a distribution system by General Electric (GE). Similarly, this study included the research conducted on optimal allocation and sizing of BESS for the IEEE 8500-Node test feeder under an optimization approach to reduce the voltage deviations minimizing energy loss while also considering the BESS lifetime. Similarly, [119] entailed a study on battery charging for overvoltage mitigation by the application of a BESS approach on an LV distribution feeder in Western Sydney, Australia.
The potential of customer-owned BESS as a distributed control strategy by fully utilizing the active power potential of BESS is discussed in [90]. Different charging schemes are utilized in this research for improving voltage profiles and mitigating the overvoltage issues without compromising the objectives of BESS owners by analyzing a European LV modified IEEE test feeder with load PF set to 0.98. The authors of [120] investigated single wire earth return rural network with the attribute of long and lightly loaded feeders for the effectiveness of BESS for voltage regulation of network. They concluded that the high storage units employed in the network lead towards a better voltage profile and hence a 2.6% and 1.4% improvement in voltage profile has been noticed with 16 and 8 storage units, respectively, as compared to the base case. The authors in [37] highlighted that the voltage violations after 70% PV penetration results in 34% of PV panels shut down. However, the loss of this 291 kWh green energy due to PV shut down can be prevented by installing a BESS of 9 kVA at each house resulting in 16% PVs shut down with an energy loss of the only 121 kWh as compared to 291 kWh. On the other hand, the potential of BESS is not found as an appropriate solution due to unreasonably high size of battery of 6.5 MWh for addressing the TF overloading issue in the analysis of an Urban LV network in [43].

6.3. Demand Response

The network voltage stability can be improved by the implementation of an Optimal Power Flow problem as discussed in [121] and an improper DR application can increase network losses and voltage unbalance [122]. DR is dependent on consumers’ preference, yet its combination with APC can reduce energy loss due to curtailment. The coordinated approach of DR with OLTC with independent phase tap control has been proved efficient in [34] for voltage management of real three-phase four-wire suburban LV network in Australia. The proposed approach increased PV HC from 20% (40 kW) to almost 35% (65 kW) of TF kVA rating and not only improved voltage magnitude and unbalance but decreased the compensation costs and violations of comfort level in case of demand response.
A Swiss suburban 400 V distribution grid with two 630 kVA transformers with evenly distributed PV installations is analyzed in [33] for the DR potential to increase HC. The application of DR through a control approach even with elementary controllability can increase the PV HC as discussed in this study. However, the DR potential in the beforementioned study required the information regarding PV and load distribution and even PV penetration along the feeder length. An HC increase from 28.57% to 52.78% of annual energy consumption is achieved with DR that is applied only beyond PV penetration of 50%. Similarly, an improved HC along with reduced network losses has been observed in [71] by the utilization of the residential DR in tandem with OLTC in a suburban radial LV Australian network with a penetration of 35% of the transformer capacity (65 kW). The authors investigated a single-phase LV distribution feeder with two-way communication supplying 10 loads in [123]. The operations of Heating, Ventilation, and Air Conditioning (HVAC) loads and Electric Water Heater (EWH) are managed in such a way to achieve voltage regulation without compromising the thermal comfort of the customers. The authors compared curtailment of PV generation under different schemes of HVAC loads and EWH and concluded that combined operation of HVAC and EWH results in 91.6% lower curtailment as compared to the base case with a curtailment of 6.9 kWH. They observed a hosting capacity increase of 24.5% (96.9 kWh) with respect to the base case of 77.8 kWH with no HVAC and EWH control.

6.4. Dynamic Network Configuration and Dynamic Loading of Components

The Network Reconfiguration (NR) involves the rearrangement of photovoltaic power and load between phases for a better voltage profile. The optimal configuration of the network by adding two new distribution lines equipped with tie switches is investigated for a 15-bus radial distribution circuit and IEEE 123 bus feeder with an initial HC of 2.92 MW and 8.6 MW, respectively, in [99]. The mean voltage of the feeder is lowered in the newly configured topologies by NR thus increasing HC by 43% and 53%, respectively, in both cases. Static and dynamic network reconfiguration for increasing DG HC of a 34 bus 12.66 kV distribution network is discussed in [124]. The authors discussed that dynamic reconfiguration adaptation with varying operating conditions has more potential to increase HC as compared to static case but at the expense of wear and tear caused due to remote switching actions. Similarly, [100] highlighted the impact of NR for the increase in HC. The authors of this study formulated a multi-period NR problem consisting of 4 stages and investigated a three-phase unbalanced IEEE 123-bus system for determining the effectiveness of the proposed approach. The appropriate opening and closing operations of sectionalizing and tie switches can alter the network topology and thus increase the hourly HC after NR for accommodating more RES for 24 h period. The NR of an urban high voltage distribution network in China resulted in at least a 30% increase in PV accommodating ability after reconstruction [42]. This topology reconfiguration increased PV integration capability by 78% and relieving the network congestion by transferring the loads to the lighter loaded parts of the system. The system reconfiguration of [42] further resulted in a lower security risk of feeder overloading by 5.32%. Feeder reconfiguration can be regarded as an optimization problem to control the distances and primary impedances of PV locations after network reconfiguration along with reduced energy losses and improved voltage profile [53].
Similarly, the dynamic configuration of network changes over time to increase the HC of an urban radial MV distribution network in central Italy [21]. The economic impact of NR to improve the network ability to accept more distributed energy resources is more pronounced than the HC increase with only a 0–20% increase in HC as compared to the base case. Moreover, the energy curtailment of less than 5% of the yearly energy production with a temporary small loss in production for the users is a viable option if PV production surpasses the HC threshold by only a small amount as discussed in [21]. The NR can increase HC with an added advantage of the reduction in network losses and balancing the loading of the transformer as discussed in [101]. The authors in this study investigated an IEEE 123-bus test network for increasing the available delivery capability by selecting optimal topologies of network and NR for accommodating more renewable energy. Besides, the authors referenced a study conducted on NR by feeder reconfiguration coordinated with voltage control and another work done on the reconfiguration approach for decreasing the system losses of balanced and unbalanced networks.
Dynamic loading of components relieves the voltage stability issues and a Swedish regional distribution network in [1] is analyzed for the dynamic performance of a system and its real-time monitoring. The dynamic line modeling is proved beneficial in this study as compared to the power curtailment to increase the HC by extending the current limits otherwise restricted by static line limits. An extended IEEE 24-bus test system and weather statistics from Birmingham, UK are utilized for analyzing the dynamic thermal limits of transmission lines for estimating their maximum capability [111]. The dynamic thermal limit of transmission lines resulted in a 40% increase in transmission capacity as compared to static thermal limits along with reduced line overloading risk. The APC to avoid transformer loading in [43] results in a yearly 21.5% of PV energy loss that can be addressed by utilization of transformer temperature-dependent curtailment strategy for reducing the yearly energy loss due to APC. There has been a reduction of 1.7% energy loss from 21.5% to 19.8% without causing overheating of TF but even then, fairly long periods of energy curtailment have been observed.
APC as an important aspect for HC increase is discussed by authors of [1,32,52,81,89]. A curtailment up to PV HC of 30% and 50% is more profitable as compared to RPC and Storage as discussed in [81]. However, the curtailment alone results in energy losses that can be avoided by the storage in conjunction with small curtailment and reactive power support as an economical solution. Similarly, a Fair Optimal Inverter Dispatch method has been verified for the even curtailment across the tested LV residential network of 12 houses resulting in 13% higher PV HC in [32]. A small PV power curtailment enabled double PV penetration into the LV network with HC value of 88% (142 kWp) of transformer rating by opting for a probabilistic approach in [89]. However, despite the advantages, the power curtailment must be carefully investigated in terms of economic cost and benefit analysis [1].

6.5. Power Quality Compensation (Harmonics, Unbalance, Flicker)

Power quality issues may arise due to the proliferation of rooftop photovoltaics resulting in technical challenges. The HC can be improved by power quality compensation such as adjusting harmonics, unbalance, and flicker. The analysis in [125] proved that HC can be improved by 12% by decreasing harmonic voltage. The authors discussed that the change of PF at the point of common coupling from 0.8 inductive to 0.8 capacitive can increase PV HC by almost 7 times as compared to the case with inverter producing reactive power. Moreover, the HC limited by harmonic constraints of voltage and current distortions arising from the non-linearity of the loads is investigated and the violations are mitigated by C-type passive harmonic filter method to increase the HC as 55.34% [26]. The authors in [25] discussed an optimal filter design of C-type passive filter for HC increase by 100% for all test conditions of a distorted distribution network with harmonics as one of the limiting factors. Although, harmonic filter inclusion in harmonics constrained systems is found as a mean to increase DG penetration in [26] and [25] but [126] concludes that the inclusion of the filter for reducing harmonic contamination may result in increased harmonic resonance.
BESS can be employed by connecting BESS at the same point as PV for HC improvement in case of higher unbalance conditions in rural regions due to an unbalanced PV feed-in system [16]. Similarly, Power Quality issues such as unbalance and voltage fluctuations can be addressed by the optimization strategy of PV inverter control proposed in [39]. The employed strategy is investigated for a three-phase four-wire unbalanced LV network in Perth Solar city proliferated with excessive residential PVs. A power balancing control algorithm employing the concept of community energy storage is implemented on a typical Australian 0.4 KV LV feeder for mitigation of neutral to ground voltages due to unbalanced PV connections in LV distribution networks in [84]. The proposed strategy stored the surplus energy at peak generation and released back during the evening peak load along with restraining the voltages as −6/+10% of nominal voltage as per Australian standards. Equal distribution of single-phase loads among all three phases and network reconfiguration are listed as potential solutions for imbalance minimization in [104]. The authors investigated the voltage imbalance phenomenon on a radial residential LV urban network comprising of three-phase feeders with network load distributed unevenly among the three phases in this study. The coordinated operation of increased feeder cross-section and 15 kVar capacitor installation reduces the imbalance significantly at feeder end (from 1.84% to 1.18%) and beginning (from 0.36% to 0.28%). Besides, a coordinated voltage regulation method employing the APC approach is used in [127] for mitigating the voltage asymmetries and improving overall voltage profile thus resulting in increased PV penetration. The test results of this study are validated by using a heavily unbalanced radial network and thus the proposed strategy is found very effective in managing overvoltage issues in single phase load systems. The authors of [128] noticed a reduction in network losses and VUF thus keeping it less than 0.8% by placing the energy storage system on the same phase as the load and PV.
The DR and control of smart loads for the voltage regulation and mitigation of flicker are discussed in [26]. A 40 kVA Static Compensator dynamically adjusting the rapid voltage changes by reactive power injection/absorption is employed in [47] to reduce the fluctuations from 8% to less than 5% thus improving PQ. Similarly, the Power Quality of a single-phase grid is improved in [129] through a control algorithm based on Amplitude Adaptive Notch Filter. The proposed strategy employs voltage source converters to improve the Power Quality, coupling inductor to decrease harmonics in grid current and RC filter for reducing higher-order harmonics. The inverter’s local voltage control mechanism is discussed in [130] that reacts instantly to minimize the fast voltage fluctuations and hence flicker in the analysis of a 33-bus MV distribution system. The control strategy defined in this study resulted in the maximum long-term flicker index value (0.1938) to be 57% less than the base case value (0.4466) without any control. The flicker control although results in mitigating the fast voltage fluctuations but at the expense of increased losses due to required reactive power support and large deviations of the voltages displaced from the mean value. An Active/Reactive power control approach has been proposed in [108] utilizing the reactive power support in conjunction with momentarily curtailing active power under high irradiance scenario. The proposed approach resulted in the improvement of long-term flicker index by the analysis of Finnish LV networks due to cloud changes as per instructions defined in IEC Standard 61000-4-15. Similarly, a three-fold control strategy utilizes the functionalities of control devices and the optimizations of PV inverter’s smart features for the mitigation of voltage deviations and flicker in [131].
A summary of PV HC improvement means with the estimated percentage increase in HC in different cases is given in Table 7.

7. Discussion

HC is the prime factor of integrating large amounts of RES, especially PVs, into the distribution networks thus leading towards a reduction in Carbon footprint. HC definitions based on differing references particularly peak load, transformer rating and customers equipped with PV permit entirely different HC values. Peak load is the most commonly used HC reference as shown in Figure 1. However, both the peak load and transformer rating lack validity for HC definition in case of frequent load variations. Therefore, an accurate definition of HC has become indispensable for network planning and therefore it should be carefully investigated in terms of references, network topology, loading conditions, PV deployment scenario, and location. An appropriate selection of performance indices, as an additional attribute, for HC assessment dictates different HC values pertaining to the fact that it is not a unique value. The most pronounced limiting factor restraining the network HC is found to be voltage violations, followed by ampacity and voltage unbalance. However, the limiting factors alter depending on location and network topology; the weak rural networks with the attribute of long spans and lightly loaded feeder ends have lower HC with overvoltage as the main limiting factor as compared to urban network with cable ampacity as the primary HC constraint. Moreover, the limit value is critical considering the overvoltage criterion as the main constraint especially at minimum load conditions with already higher system voltages that are exacerbated by the increased PV penetration. The ubiquitously employed voltage rise standards are imperative in dictating the HC in the order of least conservative to most conservative as European EN-50160 (±10% Un), Australian Standard (−6/+10% Un), Canadian Standard CSA(±6% Un), American ANSI C84.1(±5% Un) and German Standard VDE-AR-N 4105 (+3% Un). The traditional distribution networks permit a certain amount of PV penetration even if not designed for RES integration and the HC of balanced feed-in power case is higher than the unbalanced case with negative sequence unbalance as the main limiting constraint.
Different network conditions generate varying HC values despite similar geographical location, and thus HC assessment should not be generalized and a case by case validation is vital for accurate HC calculation. HC assessment should be dealt with probabilistic approach instead of deterministic, considering the uncertainty in location, PV deployment, and network topology. This attribute can be further expanded in terms of the different load modeling in the form of conventional load models from DSOs, IEEE benchmark systems, and load modeling based on actual measurement data. The HC estimation based on actual measurements provides a better real-life approximation of maximum PV penetration. Besides, HC dependency on location and PV deployment is discussed explicitly in this review by noticing a larger HC value of distributed PV with a large number of nodes as compared to concentrated PV injection.
The network stability and Power Quality should be prioritized due to the unprecedented PV penetration into the traditional distribution networks. The establishment of a resilient distribution network utilizing novel HC improvement methods without compromising system stability is indispensable to cope with the future RES penetrations while ensuring the reliability and security of the power supply. Voltage regulators, capacitors, and offload tap changers are traditional approaches for mitigating voltage issues and suited for one-way power flow. However, the introduction of the Smart Grid and the prosumer concept require modern methods corroborating the bi-directional power flow.
The widely employed voltage control methods for improving HC are discussed in detail along with reactive power control methods particularly focussed on the inverter oversizing. The OLTC employment in rural networks with overvoltage as the main performance constraint has been discussed and the coordinated control approaches of OLTC with other mitigation strategies have been included due to inadequacy of OLTC as a standalone voltage control method. Inverter oversizing for VAR injection is another improvement method and a small oversizing at the planning stage can be proved beneficial in the context of reactive power support. However, the cost analysis of the inverter oversizing is essential and the expenses incurred in oversizing must be compared with the potential advantages of adopting the technique. Moreover, the APC as a means to increase HC should be carefully analyzed in the economic context for the PV owner. The increased PV installations without increasing the network capability for accommodating more PVs results in unnecessary shut down of PV panels and energy losses. The BESS for controlling active power and decreasing the reverse power to improve hosting capacity is also discussed in the context of reducing the energy losses due to APC. Nevertheless, the initial investment cost of BESS is of prime concern and, therefore, an optimization strategy for the optimal size and placement of BESS with cost efficiency is indispensable.
Technical challenges arising from the proliferation of Rooftop PVs result in Power Quality issues and voltage unbalance amongst them is caused by asymmetry in load currents or untransposed feeder impedance. The power quality issues can be addressed by BESS, passive harmonic filters, inverter Q control, increasing the feeder cross-section, and the last method reduces the voltage drop to decrease the voltage difference among three phases. In addition to this, APC can be applied in conjunction with other reactive power control strategies for Power Quality compensation. It is worth mentioning here that the voltage control strategies for HC improvement are focussed on only voltage regulation without addressing the ampacity limits that become the main performance criteria even after the voltage regulation. Similarly, extending the line overloading limits can lead to both the voltage violations and line congestion and such contingencies must be taken into account at the planning stage. Real-time monitoring of the system considering the dynamic performance of the system and extending the current limits of the components that are otherwise restricted by static line limits increases the HC. Dynamic thermal limits based on real-time weather states can boost the current carrying capacity of transmission lines thus increasing the penetration limits along with increasing the security of supply, minimizing loading severity, and reduction in the risk level. However, the cost-benefit analysis of the HC improvement methods must be carefully investigated before implementation. Moreover, HC quantification techniques need standardization procedures for consistent values that are otherwise calculated based on varying standards, limits, and network topologies.

Author Contributions

Conceptualization, M.L. and S.F.; methodology, S.F. and V.P.; software, V.P.; validation, S.F., V.P. and M.L.; formal analysis, S.F.; investigation, S.F.; resources, M.L.; data curation, S.F.; writing—original draft preparation, S.F.; writing—review and editing, M.L.; visualization, S.F.; supervision, M.L.; project administration, M.L.; funding acquisition, M.L. All authors have read and agreed to the published version of the manuscript.

Funding

This research was funded by the BusinessFinland project SolarX.

Conflicts of Interest

The authors declare no conflict of interest

Abbreviations

PVPhotovoltaic
HCHosting Capacity
DNOsDistribution Network Operators
RESRenewable Energy Sources
LVLow Voltage
MVMedium Voltage
PQPower Quality
DGDistributed Generation
DRDemand Response
BESSBattery Energy Storage System
TFTransformer
APCActive Power Curtailment
SVCsSecondary VAr Controllers
VVCVolt-VAR Control
VWCVolt-Watt Control
LVDNLow Voltage Distribution Network
VUFVoltage Unbalance Factor
THDTotal Harmonic Distortion
PFPower Factor
PltLong-term Flicker
PstShort-term Flicker
PIPerformance Index
DSOsDistribution System Operators
RPCReactive Power Control
R Resistance
XReactance
DCDirect Current
GEGeneral Electric
HVACHeating, Ventilation, and Air Conditioning
EWHElectric Water Heater
NRNetwork Reconfiguration

References

  1. Etherden, N.; Bollen, M.H.J. Increasing the hosting capacity of distribution networks by curtailment of renewable energy resources. In Proceedings of the 2011 IEEE PES Trondheim PowerTech: The Power of Technology for a Sustainable Society, POWERTECH 2011, Trondheim, Norway, 19–23 June 2011; pp. 1–7. [Google Scholar]
  2. Liu, Y.J.; Tai, Y.H.; Huang, C.Y.; Su, H.J.; Lan, P.H.; Hsieh, M.K. Assessment of the PV hosting capacity for the medium-voltage 11.4 kV distribution feeder. In Proceedings of the 4th IEEE International Conference Applied System Innovation 2018, ICASI 2018, Tokyo, Japan, 13–17 April 2018; pp. 381–384. [Google Scholar]
  3. Kikuchi, S.; Machida, M.; Tamura, J.; Imanaka, M.; Baba, J.; Iioka, D.; Miura, K.; Takagi, M.; Asano, H. Hosting capacity analysis of many distributed photovoltaic systems in future distribution networks. In Proceedings of the 2017 IEEE Innovative Smart Grid Technologies–Asia Smart Grid Smart Community, ISGT-Asia 2017, Auckland, New Zealand, 4–7 December 2017; pp. 1–5. [Google Scholar]
  4. Bollen, M.H.J.; Rönnberg, S.K. Hosting capacity of the power grid for renewable electricity production and new large consumption equipment. Energies 2017, 10, 1325. [Google Scholar] [CrossRef] [Green Version]
  5. Rylander, M.; Smith, J.; Lewis, D.; Steffel, S. Voltage impacts from distributed photovoltaics on two distribution feeders. In Proceedings of the IEEE Power Energy Socoety General Meeting 2013, Vancouver, BC, Canada, 21–25 July 2013; pp. 2–6. [Google Scholar]
  6. Aziz, T.; Ketjoy, N. PV Penetration Limits in Low Voltage Networks and Voltage Variations. IEEE Access 2017, 5, 16784–16792. [Google Scholar] [CrossRef]
  7. Jain, A.K.; Horowitz, K.; Ding, F.; Gensollen, N.; Mather, B.; Palmintier, B. Quasi-Static Time-Series PV Hosting Capacity Methodology and Metrics. In Proceedings of the 2019 IEEE Power Energy Society Innovation Smart Grid Technology Conference ISGT 2019, Washington, WA, USA, 17–20 February 2019. [Google Scholar]
  8. Torquato, R.; Salles, D.; Pereira, C.O.; Meira, P.C.M.; Freitas, W. A Comprehensive Assessment of PV Hosting Capacity on Low-Voltage Distribution Systems. IEEE Trans. Power Deliv. 2018, 33, 1002–1012. [Google Scholar]
  9. Saber, A.Y.; Khandelwal, T.; Srivastava, A.K. Fast Feeder PV Hosting Capacity using Swarm Based Intelligent Distribution Node Selection. In Proceedings of the IEEE Power Energy Society Genery Meeting 2019, 2019-Augus, Atlanta, GA, USA, 4–8 August 2019. [Google Scholar]
  10. Asano, M.; Wong, F.; Ueda, R.; Moghe, R.; Rahimi, K.; Chun, H.; Tholomier, D. On the Interplay between SVCs and Smart Inverters for Managing Voltage on Distribution Networks. In Proceedings of the IEEE Power Energy Society Genery Meeting 2019, Atlanta, GA, USA, 4–8 August 2019; pp. 1–4. [Google Scholar]
  11. Jothibasu, S.; Santoso, S.; Dubey, A. Optimization Methods for Evaluating PV Hosting Capacity of Distribution Circuits. In Proceedings of the IEEE 46th Photovoltaic Specialists Conference (PVSC), Chicago, IL, USA, 16–21 June 2019; pp. 887–891. [Google Scholar]
  12. Navarro, B.B.; Navarro, M.M. A comprehensive solar PV hosting capacity in MV and LV radial distribution networks. In Proceedings of the 2017 IEEE PES Innovation Smart Grid Technology Conference Europe ISGT-Europe 2017, Auckland, New Zealand, 4–7 December 2017; pp. 1–6. [Google Scholar]
  13. Singh, N.K.; Wanik, M.Z.C.; Jabbar, A.A.; Sanfilippo, A. Enhancing PV hosting Capacity of a Qatar Remote Farm Network using Inverters Ability to Regulate Reactive Power-a Case Study. In Proceedings of the 2019 IEEE PES Innovation Smart Grid Technology Conference Europe ISGT-Europe, Bucharest, Romania, 29 September–2 October 2019. [Google Scholar]
  14. Haghi, H.V.; Pecenak, Z.; Kleissl, J.; Peppanen, J.; Rylander, M.; Renjit, A.; Coley, S. Feeder Impact Assessment of Smart Inverter Settings to Support High PV Penetration in California. In Proceedings of the IEEE Power Energy Society Genery Meeting 2019, Atlanta, GA, USA, 4–8 August 2019; pp. 2–6. [Google Scholar]
  15. Stetz, T.; Marten, F.; Braun, M. Improved low voltage grid-integration of photovoltaic systems in Germany. IEEE Trans. Sustain. Energy 2013, 4, 534–542. [Google Scholar] [CrossRef]
  16. Arshad, A.; Püvi, V.; Lehtonen, M. Monte carlo-based comprehensive assessment of PV hosting capacity and energy storage impact in realistic finnish low-voltage networks. Energies 2018, 11, 1467. [Google Scholar] [CrossRef] [Green Version]
  17. Divan, D.; Moghe, R.; Chun, H. Managing distribution feeder voltage issues caused by high PV penetration. In Proceedings of the 2016 IEEE 7th International Symposium Power Electronics Distributed Generation Systems PEDG 2016, Vancouver, BC, Canada, 27–30 June 2016. [Google Scholar]
  18. Tonkoski, R.; Turcotte, D.; El-Fouly, T.H.M. Impact of high PV penetration on voltage profiles in residential neighborhoods. IEEE Trans. Sustain. Energy 2012, 3, 518–527. [Google Scholar] [CrossRef]
  19. Ding, F.; Horowitz, K.; Mather, B.; Palmintier, B. Sequential Mitigation Solutions to Enable Distributed PV Grid Integration. In Proceedings of the IEEE Power Energy Society General Meeting 2018, Portland, OR, USA, 5–9 August 2018; pp. 1–5. [Google Scholar]
  20. Ari, G.K.; Baghzouz, Y. Impact of high PV penetration on voltage regulation in electrical distribution systems. In Proceedings of the 3rd International Conference on Clean Electrical Power: Renewable Energy Resources Impact, ICCEP 2011, Ischia, Italy, 14–16 June 2011; pp. 744–748. [Google Scholar]
  21. Falabretti, D.; Merlo, M.; Delfanti, M. Network reconfiguration and storage systems for the hosting capacity improvement. In Proceedings of the 22nd International Conference on Electricity Distribution, Stockholm, Sweden, 10–13 June 2013; pp. 10–13. [Google Scholar]
  22. Ferdowsi, F.; Mehraeen, S.; Upton, G.B. Assessing distribution network sensitivity to voltage rise and flicker under high penetration of behind-the-meter solar. Renew. Energy 2020, 152, 1227–1240. [Google Scholar] [CrossRef]
  23. Kitworawut, P.B.; Azuatalam, D.T.; Unigwe, O.C.; Collin, A.J. An investigation into the technical impacts of microgeneration on UK-type LV distribution networks. In Proceedings of the 2016 IEEE International Conference on Renewable Energy Research and Applications, ICRERA 2016, Birmingham, UK, 20–23 November 2016; pp. 124–129. [Google Scholar]
  24. Essackjee, I.A.; Ah King, R.T.F. Maximum rooftop photovoltaic hosting capacity with harmonics as limiting factor—Case study for Mauritius. In Proceedings of the icABCD 2019–2nd International Conference Advance Big Data, Computing Data Communication Systems, Winterton, South Africa, 5–6 August 2019. [Google Scholar]
  25. Sakar, S.; Balci, M.E.; Abdel Aleem, S.H.E.; Zobaa, A.F. Increasing PV hosting capacity in distorted distribution systems using passive harmonic filtering. Electr. Power Syst. Res. 2017, 148, 74–86. [Google Scholar] [CrossRef] [Green Version]
  26. Sharma, S.K.; Chandra, A.; Saad, M.; Lefebvre, S.; Asber, D.; Lenoir, L. Voltage Flicker Mitigation Employing Smart Loads With High Penetration of Renewable Energy in Distribution Systems. IEEE Trans. Sustain. Energy 2017, 8, 414–424. [Google Scholar] [CrossRef]
  27. Dubey, A. Impacts of voltage control methods on distribution circuit’s photovoltaic (PV) integration limits. Inventions 2017, 2, 28. [Google Scholar] [CrossRef] [Green Version]
  28. Arshad, A.; Lindner, M.; Lehtonen, M. An analysis of photo-voltaic hosting capacity in finnish low voltage distribution networks. Energies 2017, 10, 1702. [Google Scholar] [CrossRef] [Green Version]
  29. Arshad, A.; Lehtonen, M. A Stochastic Assessment of PV Hosting Capacity Enhancement in Distribution Network Utilizing Voltage Support Techniques. IEEE Access 2019, 7, 46461–46471. [Google Scholar] [CrossRef]
  30. Hu, J.; Marinelli, M.; Coppo, M.; Zecchino, A.; Bindner, H.W. Coordinated voltage control of a decoupled three-phase on-load tap changer transformer and photovoltaic inverters for managing unbalanced networks. Electr. Power Syst. Res. 2016, 131, 264–274. [Google Scholar] [CrossRef] [Green Version]
  31. Navarro-Espinosa, A.; Ochoa, L.F. Increasing the PV hosting capacity of Lv networks: OLTC-fitted transformers vs. reinforcements. In Proceedings of the 2015 IEEE Power and Energy Society Innovative Smart Grid Technologies Conference, ISGT 2015, Washington, WA, USA, 17–20 February 2015; pp. 2011–2014. [Google Scholar]
  32. Lusis, P.; Andrew, L.L.H.; Liebman, A.; Tack, G.; Chakraborty, S. Reducing the unfairness of coordinated inverter dispatch in pv-rich distribution networks. In Proceedings of the 2019 IEEE Milan PowerTech, PowerTech 2019, Milan, Italy, 23–27 June 2019; p. 675318. [Google Scholar]
  33. Li, X.; Borsche, T.; Andersson, G. PV integration in Low-Voltage feeders with Demand Response. In Proceedings of the 2015 IEEE Eindhoven PowerTech, PowerTech 2015, Eindhoven, The Netherlands, 29 June–2 July 2015. [Google Scholar]
  34. Rahman, M.M.; Arefi, A.; Shafiullah, G.M.; Hettiwatte, S. A new approach to voltage management in unbalanced low voltage networks using demand response and OLTC considering consumer preference. Int. J. Electr. Power Energy Syst. 2018, 99, 11–27. [Google Scholar] [CrossRef]
  35. Wang, B.; Zhang, C.; Meng, K.; Liu, B.; Dong, Z.Y.; Wong, P.K.C.; Ting, T.; Qi, Q. Improving Hosting Capacity of Unbalanced Distribution Networks via Battery Energy Storage Systems. In Proceedings of the Asia-Pacific Power Energy Engineering Conference APPEEC 2019, Macao, China, 1–4 December 2019; pp. 1–5. [Google Scholar]
  36. Hasanpor Divshali, P.; Soder, L. Improving Hosting Capacity of Rooftop PVs by Quadratic Control of an LV-Central BSS. IEEE Trans. Smart Grid 2019, 10, 919–927. [Google Scholar] [CrossRef]
  37. Verschueren, T.; Mets, K.; Meersman, B.; Strobbe, M.; Develder, C.; Vandevelde, L. Assessment and mitigation of voltage violations by solar panels in a residential distribution grid. In Proceedings of the 2011 IEEE International Conference on Smart Grid Communications, SmartGridComm 2011, Brussels, Belgium, 17–20 October 2011; pp. 540–545. [Google Scholar]
  38. Reno, M.J.; Broderick, R.J. Optimal Siting of PV on the Distribution System with Smart Inverters. In Proceedings of the 2018 IEEE 7th World Conference Photovoltaic Energy Conversion, WCPEC 2018—A Joint Conference of 45th IEEE PVSC, 28th PVSEC 34th EU PVSEC 2018, Waikoloa, HI, USA, 10–15 June 2018; pp. 1468–1470. [Google Scholar]
  39. Su, X.; Masoum, M.A.S.; Wolfs, P.J. Optimal PV inverter reactive power control and real power curtailment to improve performance of unbalanced four-wire LV distribution networks. IEEE Trans. Sustain. Energy 2014, 5, 967–977. [Google Scholar] [CrossRef]
  40. AlKaabi, S.S.; Khadkikar, V.; Zeineldin, H.H. Incorporating PV Inverter Control Schemes for Planning Active Distribution Networks. IEEE Trans. Sustain. Energy 2015, 6, 1224–1233. [Google Scholar] [CrossRef]
  41. Yan, R.; Saha, T.K. Investigation of voltage stability for residential customers due to high photovoltaic penetrations. IEEE Trans. Power Syst. 2012, 27, 651–662. [Google Scholar] [CrossRef]
  42. Xiong, Q.; Liu, F.; Lv, L.; Liu, Y.; Li, Y.; Zhu, C. Urban power grids dynamic control model with photovoltaic and electric vehicles. In Proceedings of the China International Conference on Electricity, Distribution CICED 2018, Tianjin, China, 17–19 September 2018; pp. 2462–2466. [Google Scholar]
  43. Weisshaupt, M.J.; Schlatter, B.; Korba, P.; Kaffe, E.; Kienzle, F. Evaluation of Measures to Operate Urban Low Voltage Grids Considering Future PV Expansion. IFAC-PapersOnLine 2016, 49, 336–341. [Google Scholar] [CrossRef]
  44. Atmaja, W.Y.; Sarjiya; Lesnanto, M.P.; Pramono, E.Y. Hosting Capacity Improvement Using Reactive Power Control Strategy of Rooftop PV Inverters. In Proceedings of the 2019 7th International Conference on Smart Energy Grid Engineering, SEGE 2019, Oshawa, ON, Canada, 12–14 August 2019; pp. 213–217. [Google Scholar]
  45. Tang, N.C.; Chang, G.W. A stochastic approach for determining PV hosting capacity of a distribution feeder considering voltage quality constraints. In Proceedings of the International Conference on Harmonics and Quality of Power, ICHQP 2018, Ljubljana, Slovenia, 13–16 May 2018; pp. 1–5. [Google Scholar]
  46. Martin, W.; Stauffer, Y.; Ballif, C.; Hutter, A.; Alet, P.J. Automated Quantification of PV Hosting Capacity in Distribution Networks under User-Defined Control and Optimisation Procedures. In Proceedings of the 2018 IEEE PES Innovation Smart Grid Technology Conference Europe, ISGT-Europe 2018, Sarajevo, Bosnia, 21–25 October 2018. [Google Scholar]
  47. Divshali, P.H.; Soder, L. Improving PV hosting capacity of distribution grids considering dynamic voltage characteristic. In Proceedings of the 20th Power Systems Computation Conference, PSCC 2018, Dublin, Ireland, 11–15 June 2018. [Google Scholar]
  48. Padullaparti, H.V.; Jothibasu, S.; Santoso, S.; Todeschini, G. Increasing Feeder PV Hosting Capacity by Regulating Secondary Circuit Voltages. In Proceedings of the IEEE Power Energy Society General Meeting 2018, Portland, OR, USA, 5–9 August 2018. [Google Scholar]
  49. Bruno, S.; Dellino, G.; La Scala, M.; Meloni, C. A microforecasting module for energy management in residential and tertiary buildings. Energies 2019, 12, 1006. [Google Scholar] [CrossRef] [Green Version]
  50. Bruno, S.; Dellino, G.; La Scala, M.; Meloni, C. A Microforecasting Module for Energy Consumption in Smart Grids. In Proceedings of the 2018 IEEE International Conference on Environment and Electrical Engineering and 2018 IEEE Industrial and Commercial Power Systems Europe EEEIC/I CPS Europe 2018, Palermo, Italy, 12–15 June 2018. [Google Scholar]
  51. Haque, M.M.; Wolfs, P. A review of high PV penetrations in LV distribution networks: Present status, impacts and mitigation measures. Renew. Sustain. Energy Rev. 2016, 62, 1195–1208. [Google Scholar] [CrossRef]
  52. Jenicek, D.; Inam, W.; Ilic, M. Locational dependence of maximum installable PV capacity in LV networks while maintaining voltage limits. In Proceedings of the NAPS 2011—43rd North American Power Symposium, Boston, MA, USA, 4–6 August 2011. [Google Scholar]
  53. Ding, F.; Mather, B.; Gotseff, P. Technologies to increase PV hosting capacity in distribution feeders. In Proceedings of the IEEE Power Engineering Society Transmission and Distribution Conference, Dallas, TX, USA, 3–5 May 2016; pp. 1–5. [Google Scholar]
  54. Ding, F.; Mather, B.; Ainsworth, N.; Gotseff, P.; Baker, K. Locational sensitivity investigation on PV hosting capacity and fast track PV screening. In Proceedings of the IEEE Power Engineering Society Transmission and Distribution Conference, Dallas, TX, USA, 3–5 May 2016; pp. 1–5. [Google Scholar]
  55. Steyn, A.F.W.; Rix, A.J. Modelling the technical influence of randomly distributed solar PV uptake on electrical distribution networks. In Proceedings of the ICCEP 2019—7th International Conference on Clean Electrical Power: Renewable Energy Resources Impact 2019, Puglia, Italy, 2–4 July 2019; pp. 690–698. [Google Scholar]
  56. Ding, F.; Mather, B. On Distributed PV Hosting Capacity Estimation, Sensitivity Study, and Improvement. IEEE Trans. Sustain. Energy 2017, 8, 1010–1020. [Google Scholar] [CrossRef]
  57. Seuss, J.; Reno, M.J.; Broderick, R.J.; Grijalva, S. Improving distribution network PV hosting capacity via smart inverter reactive power support. In Proceedings of the IEEE Power & Energy Society General Meeting, Denver, CO, USA, 26–30 July 2015; pp. 1–5. [Google Scholar]
  58. Mohammadi, P.; Mehraeen, S. Challenges of PV Integration in Low-Voltage Secondary Networks. IEEE Trans. Power Deliv. 2017, 32, 525–535. [Google Scholar]
  59. Hoke, A.; Butler, R.; Hambrick, J.; Kroposki, B. Steady-state analysis of maximum photovoltaic penetration levels on typical distribution feeders. IEEE Trans. Sustain. Energy 2013, 4, 350–357. [Google Scholar] [CrossRef]
  60. Gaunt, C.T.; Namanya, E.; Herman, R. Voltage modelling of LV feeders with dispersed generation: Limits of penetration of randomly connected photovoltaic generation. Electr. Power Syst. Res. 2017, 143, 1–6. [Google Scholar] [CrossRef]
  61. Armendariz, M.; Broden, D.; Honeth, N.; Nordström, L. A method to identify exposed nodes in low voltage distribution grids with High PV penetration. In Proceedings of the IEEE Power & Energy Society General Meeting, Denver, CO, USA, 26–30 July 2015. [Google Scholar]
  62. Lazzeroni, P.; Olivero, S.; Stirano, F.; Repetto, M. Impact of PV penetration in a distribution grid: A Middle-East study case. In Proceedings of the 2015 IEEE 1st International Forum on Research and Technologies for Society and Industry, RTSI 2015–Proceedings, Torino, Italy, 16–18 September 2015; pp. 353–358. [Google Scholar]
  63. Henein, S.; Zegers, A.; Übermasser, S. Gap analysis of future energy grids. In Proceedings of the International conference in Europe concerning energy markets, EEM 2015, Lisbon, Portugal, 19–22 May 2015; pp. 31–34. [Google Scholar]
  64. Coogan, K.; Reno, M.J.; Grijalva, S.; Broderick, R.J. Locational dependence of PV hosting capacity correlated with feeder load. In Proceedings of the IEEE Power Engineering Society Transmission Distribution Conference, Washington, WA, USA, 27–31 July 2014. [Google Scholar]
  65. Mawarni, D.E.; Ali, M.M.V.M.; Nguyen, P.H.; Kling, W.L.; Jerele, M. A case study of using OLTC to mitigate overvoltage in a rural european low voltage network. In Proceedings of the Universities Power Engineering Conference, Wollongong, Australia, 27–30 September 2015. [Google Scholar]
  66. Jothibasu, S.; Santoso, S.; Dubey, A. Determining PV hosting capacity without incurring grid integration cost. In Proceedings of the NAPS 2016—48th North American Power Symposium, Denver, CO, USA, 18–20 September 2016. [Google Scholar]
  67. Liu, X.; Aichhorn, A.; Liu, L.; Li, H. Coordinated control of distributed energy storage system with tap changer transformers for voltage rise mitigation under high photovoltaic penetration. IEEE Trans. Smart Grid 2012, 3, 897–906. [Google Scholar] [CrossRef]
  68. EPRI. Stochastic Analysis to Determine Feeder Hosting Capacity for Distributed Solar PV. EPRI Tech. Updat. 2012, 1026640, 1–50. [Google Scholar]
  69. Baldenko, N.; Behzadirafi, S. Determination of photovoltaic hosting capacity on radial electric distribution feeders. In Proceedings of the 2016 IEEE International Conference on Power System Technology–POWERCON, Wollongong, Australia, 28 September–1 October 2016; pp. 2–5. [Google Scholar]
  70. Nijhuis, M.; Gibescu, M.; Cobben, J.F.G. Incorporation of on-load tap changer transformers in low-voltage network planning. In Proceedings of the IEEE PES Innovation Smart Grid Technology Conference Europe, Ljubljana, Slovenia, 9–12 October 2016. [Google Scholar]
  71. Chathurangi, D.; Jayatunga, U.; Rathnayake, M.; Wickramasinghe, A.; Agalgaonkar, A.; Perera, S. Potential power quality impacts on LV distribution networks with high penetration levels of solar PV. In Proceedings of the International Conference on Harmonics and. Quality of Power, ICHQP 2018, Ljubljana, Slovenia, 13–16 May 2018; pp. 1–6. [Google Scholar]
  72. Pukhrem, S.; Basu, M.; Conlon, M.F.; Sunderland, K. Enhanced network voltage management techniques under the proliferation of rooftop solar PV installation in low-voltage distribution network. IEEE J. Emerg. Sel. Top. Power Electron. 2017, 5, 681–694. [Google Scholar] [CrossRef]
  73. Rahman, M.M.; Shafiullah, A.A.; Arefi, A.; Pezeshki, H.; Hettiwatte, S. Improvement of voltage magnitude and unbalance in LV network by implementing residential demand response. In Proceedings of the IEEE Power Energy Society General Meeting 2018, Portland, OR, USA, 5–9 August 2018; pp. 1–5. [Google Scholar]
  74. Chathurangi, D.; Jayatunga, U.; Perera, S.; Agalgaonkar, A.; Siyambalapitiya, T.; Wickramasinghe, A. Connection of solar PV to LV networks: Considerations for maximum penetration level. In Proceedings of the Australasian Universities Power Engineering Conference, AUPEC 2018, Auckland, New Zealand, 27–30 November 2018. [Google Scholar]
  75. Procopiou, A.T.; Ochoa, L.F. Voltage Control in PV-Rich LV Networks Without Remote Monitoring. IEEE Trans. Power Syst. 2017, 32, 1224–1236. [Google Scholar]
  76. Long, C.; Ochoa, L.F. Voltage control of PV-rich LV networks: OLTC-fitted transformer and capacitor banks. IEEE Trans. Power Syst. 2016, 31, 4016–4025. [Google Scholar] [CrossRef]
  77. Hashemi, S.; Ostergaard, J.; Yang, G. Effect of reactive power management of PV inverters on need for energy storage. In Proceedings of the 2013 IEEE 39th Photovoltaic Specialists Conference (PVSC), Tampa, FL, USA, 16–21 June 2013; pp. 2304–2308. [Google Scholar]
  78. Navarro, A.; Ochoa, L.F.; Randles, D. Monte Carlo-based assessment of PV impacts on real UK low voltage networks. In Proceedings of the IEEE Power & Energy Society General Meeting, Vancouver, BC, Canada, 21–25 July 2013; pp. 31–35. [Google Scholar]
  79. Sarmiento, D.A.; Vergara, P.P.; Da Silva, L.C.P.; De Almeida, M.C. Increasing the PV hosting capacity with OLTC technology and PV VAr absorption in a MV/LV rural Brazilian distribution system. In Proceedings of the International Conference on Harmonics and Quality of Power, ICHQP 2016, Belo Horizonte, Brazil, 16–19 October 2016; pp. 395–399. [Google Scholar]
  80. Ravikumar Pandi, V.; Zeineldin, H.H.; Xiao, W. Allowable DG penetration level considering harmonic distortions. In Proceedings of the IECON Proceedings (Industrial Electronnics Conference), Melbourne, Australia, 7–10 November 2011; pp. 814–818. [Google Scholar]
  81. Heinrich, C.; Fortenbacher, P.; Fuchs, A.; Andersson, G. PV-integration strategies for low voltage networks. In Proceedings of the 2016 IEEE International Energy Conference, ENERGYCON 2016, Leuven, Belgium, 4–8 April 2016; p. 2. [Google Scholar]
  82. Alam, M.J.E.; Muttaqi, K.M.; Sutanto, D. Distributed energy storage for mitigation of voltage-rise impact caused by rooftop solar PV. In Proceedings of the IEEE Power & Energy Society General Meeting, San Diego, CA, USA, 22–26 July 2012; pp. 1–8. [Google Scholar]
  83. Demirok, E.; Sera, D.; Teodorescu, R.; Rodriguez, P.; Borup, U. Clustered PV inverters in LV networks: An overview of impacts and comparison of voltage control strategies. In Proceedings of the 2009 IEEE Electrical Power and Energy Conference (EPEC), Montreal, QC, Canada, 22–23 October 2009; pp. 1–6. [Google Scholar]
  84. Alam, M.J.E.; Muttaqi, K.M.; Sutanto, D. Community Energy Storage for Neutral Voltage Rise Mitigation in Four-Wire Multigrounded LV Feeders with Unbalanced Solar PV Allocation. IEEE Trans. Smart Grid 2015, 6, 2845–2855. [Google Scholar] [CrossRef] [Green Version]
  85. Joshi, K.; Gokaraju, R.R. An Iterative Approach to Improve PV Hosting Capacity for a Remote Community. In Proceedings of the IEEE Power Energy Society General Meeting 2018, Portland, OR, USA, 5–9 August 2018. [Google Scholar]
  86. Dubey, A.; Santoso, S.; Maitra, A. Understanding photovoltaic hosting capacity of distribution circuits. In Proceedings of the IEEE Power & Energy Society General Meeting, Denver, CO, USA, 26–30 July 2015. [Google Scholar]
  87. Ceylan, O.; Paudyal, S.; Bhattarai, B.P.; Myers, K.S. Photovoltaic hosting capacity of feeders with reactive power control and tap changers. In Proceedings of the 2017 IEEE PES Innovation Smart Grid Technology Conference Europe ISGT-Europe 2017, Auckland, New Zealand, 4–7 December 2017; pp. 1–6. [Google Scholar]
  88. Patsalides, M.; Makrides, G.; Stavrou, A. Assessing the Photovoltaic (Pv) Hosting Capacity of Distribution Grids. In Proceedings of the IET Mediterranean Conference on Power Generation, Transmission, Distribution and Energy Conversion (MedPower 2016), Belgrade, Serbia, 6–9 November 2016; pp. 2–5. [Google Scholar]
  89. Niederhuemer, W.; Schwalbe, R. Increasing PV hosting capacity in LV grids with a probabilistic planning approach. In Proceedings of the 2015 International Symposium on Smart Electric Distribution Systems and Technologies, EDST, Vienna, Austria, 8–11 September 2015; pp. 537–540. [Google Scholar]
  90. Ranaweera, I.; Midtgård, O.M.; Korpås, M. Distributed control scheme for residential battery energy storage units coupled with PV systems. Renew. Energy 2017, 113, 1099–1110. [Google Scholar] [CrossRef]
  91. Heslop, S.; MacGill, I.; Fletcher, J. Maximum PV generation estimation method for residential low voltage feeders. Sustain. Energy Grids Netw. 2016, 7, 58–69. [Google Scholar] [CrossRef]
  92. Solanki, S.K.; Ramachandran, V.; Solanki, J. Steady state analysis of high penetration PV on utility distribution feeder. In Proceedings of the IEEE Power Engineering Society Transmission and Distribution Conference, San Diego, CA, USA, 22–26 July 2012; pp. 1–6. [Google Scholar]
  93. Ruf, H. Limitations for the feed-in power of residential photovoltaic systems in Germany–An overview of the regulatory framework. Sol. Energy 2018, 159, 588–600. [Google Scholar] [CrossRef]
  94. Kabiri, R.; Holmes, D.G.; McGrath, B.P. Voltage regulation of LV feeders with high penetration of PV distributed generation using electronic tap changing transformers. In Proceedings of the 2014 Australasian Universities Power Engineering Conference, AUPEC 2014, Perth, Australia, 28 September–1 October 2014; pp. 1–6. [Google Scholar]
  95. Rahman, F.F.S.; Adi, K.W.; Sarjiya; Putranto, L.M. Study on Photovoltaic Hosting in Yogyakarta Electric Distribution Network. In Proceedings of the 5th International Conference on Information Technology, Computer, and Electrical Engineering, ICITACEE, Banten, Indonesia, 4–5 September 2018; pp. 240–244. [Google Scholar]
  96. Grabner, M.; Souvent, A.; Suljanović, N.; Košir, A.; Blažič, B. Probabilistic methodology for calculating PV hosting capacity in LV networks using actual building roof data. Energies 2019, 12, 4086. [Google Scholar] [CrossRef] [Green Version]
  97. Reno, M.J.; Broderick, R.J. Statistical analysis of feeder and locational PV hosting capacity for 216 feeders. In Proceedings of the IEEE Power & Energy Society General Meeting, Boston, MA, USA, 21 July 2016. [Google Scholar]
  98. Ballanti, A.; Ochoa, L.F. On the integrated PV hosting capacity of MV and LV distribution networks. In Proceedings of the 2015 IEEE PES Innovative Smart Grid Technologies Latin America, ISGT LATAM 2015, Montevideo, Uruguay, 5–7 October 2015; pp. 366–370. [Google Scholar]
  99. Jothibasu, S.; Dubey, A.; Santoso, S. Two-Stage Distribution Circuit Design Framework for High Levels of Photovoltaic Generation. IEEE Trans. Power Syst. 2019, 34, 5217–5226. [Google Scholar]
  100. Fu, Y.Y.; Chiang, H.D. Toward optimal multi-period network reconfiguration for increasing the hosting capacity of distribution networks. In Proceedings of the IEEE Power Energy Society General Meeting 2018, Portland, OR, USA, 5–9 August 2018; pp. 1–5. [Google Scholar]
  101. Liu, J.; Chiang, H.D. Maximizing Available Delivery Capability of Unbalanced Distribution Networks for High Penetration of Distributed Generators. IEEE Trans. Power Deliv. 2017, 32, 1196–1202. [Google Scholar] [CrossRef]
  102. Shayani, R.A.; De Oliveira, M.A.G. Photovoltaic generation penetration limits in radial distribution systems. IEEE Trans. Power Syst. 2011, 26, 1625–1631. [Google Scholar] [CrossRef]
  103. Data, S.M. Photovoltaic Integration in Smart City Power Distribution. In Proceedings of the IEEE 5th International Conference on Smart Cities and Green ICT Systems (SMARTGREENS), IEEE 2016, Rome, Italy, 23–25 April 2016; pp. 166–178. [Google Scholar]
  104. Shahnia, F.; Majumder, R.; Ghosh, A.; Ledwich, G.; Zare, F. Sensitivity analysis of voltage imbalance in distribution networks with rooftop PVs. In Proceedings of the IEEE PES General Meeting PES 2010, Minneapolis, MN, USA, 25–29 July 2010. [Google Scholar]
  105. Sakar, S.; Balci, M.E.; Aleem, S.H.E.A.; Zobaa, A.F. Hosting capacity assessment and improvement for photovoltaic-based distributed generation in distorted distribution networks. In Proceedings of the EEEIC 2016—International Conference on Environment and Electrical Engineering, Florence, Italy, 7–10 June 2016; pp. 2–7. [Google Scholar]
  106. Krata, J.; Saha, T.K.; Yan, R. Large scale photovoltaic system and its impact on distribution network in transient cloud conditions. In Proceedings of the IEEE Power & Energy Society General Meeting, Denver, CO, USA, 26–30 July 2015; pp. 2–6. [Google Scholar]
  107. Rahman, S.; Moghaddami, M.; Sarwat, A.I.; Olowu, T.; Jafaritalarposhti, M. Flicker Estimation Associated with PV Integrated Distribution Network. In Proceedings of the IEEE SOUTHEASTCON 2018, Charlotte, NC, USA, 19–22 April 2018. [Google Scholar]
  108. Arshad, A.; Lehtonen, M. Instantaneous Active/Reactive Power Control Strategy for Flicker Mitigation under High PV Penetration. In Proceedings of the 2018 IEEE PES Innovative Smart Grid Technologies Conference Europe, ISGT-Europe, Sarajevo, Bosnia and Herzegovina, 21–25 October 2018. [Google Scholar]
  109. Chen, P.; Salcedo, R.; Zhu, Q.; Czarkowski, D.; Jiang, Z.; Spitsa, V.; Zabar, Z.; Uosef, R.E. Analysis of Voltage Pro fi le Problems Due to the Penetration of Distributed Generation in Low-Voltage. IEEE Trans. Power Deliv. 2012, 27, 2020–2028. [Google Scholar] [CrossRef]
  110. Seuss, J.; Harley, R.G. A low-cost distributed control strategy for rooftop PV with utility benefits. In Proceedings of the IEEE Power & Energy Society General Meeting, Vancouver, BC, Canada, 21–25 July 2013. [Google Scholar]
  111. Alharbi, B.; Jayaweera, D. Smart power system operation with dynamic thermal limits on critical transmission lines and integration of large PV systems. In Proceedings of the 8th International Conference on Renewable Energy Research and Applications, ICRERA 2019, Brasov, Romania, 3–6 November 2019; pp. 727–732. [Google Scholar]
  112. Dubey, A.; Santoso, S. On Estimation and Sensitivity Analysis of Distribution Circuit’s Photovoltaic Hosting Capacity. IEEE Trans. Power Syst. 2017, 32, 2779–2789. [Google Scholar] [CrossRef]
  113. Lakshmi, S.; Ganguly, S. Simultaneous optimisation of photovoltaic hosting capacity and energy loss of radial distribution networks with open unified power quality conditioner allocation. IET Renew. Power Gener. 2018, 12, 1382–1389. [Google Scholar] [CrossRef]
  114. Bletterie, B.; Le Baut, J.; Kadam, S.; Bolgaryn, R.; Abart, A. Hosting capacity of LV networks with extended voltage band. In Proceedings of the 2015 International Symposium on Smart Electric Distribution Systems and Technologies, EDST 2015, Vienna, Austria, 8–11 September 2015; pp. 531–536. [Google Scholar]
  115. Xu, Z.; Wang, X.; Yang, J.; Zhang, F. A review on voltage control for distribution systems with large-scale distributed photovoltaic power integration. IOP Conf. Ser. Earth Environ. Sci. 2019, 371. [Google Scholar] [CrossRef]
  116. Demoulias, C. A new simple analytical method for calculating the optimum inverter size in grid-connected PV plants. Electr. Power Syst. Res. 2010, 80, 1197–1204. [Google Scholar] [CrossRef]
  117. Jamal, T.; Carter, C.; Schmidt, T.; Shafiullah, G.M.; Calais, M.; Urmee, T. An energy flow simulation tool for incorporating short-term PV forecasting in a diesel-PV-battery off-grid power supply system. Appl. Energy 2019, 254, 113718. [Google Scholar] [CrossRef] [Green Version]
  118. Hashemi, S.; Østergaard, J. Efficient Control of Energy Storage for Increasing the PV Hosting Capacity of LV Grids. IEEE Trans. Smart Grid 2018, 9, 2295–2303. [Google Scholar]
  119. Chaudhary, P.; Rizwan, M. Voltage regulation mitigation techniques in distribution system with high PV penetration: A review. Renew. Sustain. Energy Rev. 2018, 82, 3279–3287. [Google Scholar] [CrossRef]
  120. Zillmann, M.; Yan, R.; Saha, T.K. Regulation of distribution network voltage using dispersed battery storage systems: A case study of a rural network. In Proceedings of the IEEE Power & Energy Society General Meeting, Detroit, MI, USA, 24–28 July 2011; pp. 1–8. [Google Scholar]
  121. Dong, Y.; Xie, X.; Shi, W.; Zhou, B.; Jiang, Q. Demand-response-based distributed preventive control to improve short-term voltage stability. IEEE Trans. Smart Grid 2018, 9, 4785–4795. [Google Scholar] [CrossRef]
  122. Medina, J.; Muller, N.; Roytelman, I. Demand response and distribution grid operations: Opportunities and challenges. IEEE Trans. Smart Grid 2010, 1, 193–198. [Google Scholar] [CrossRef]
  123. Mahroo-Bakhtiari, R.; Izadi, M.; Safdarian, A.; Lehtonen, M. Distributed load management scheme to increase PV hosting capacity in LV feeders. IET Renew. Power Gener. 2020, 14, 125–133. [Google Scholar] [CrossRef]
  124. Capitanescu, F.; Ochoa, L.F.; Margossian, H.; Hatziargyriou, N.D. Assessing the potential of network reconfiguration to improve distributed generation hosting capacity in active distribution systems. IEEE Trans. Power Syst. 2015, 30, 346–356. [Google Scholar] [CrossRef]
  125. De Oliveira, T.E.C.; Carvalho, P.M.S.; Ribeiro, P.F.; Bonatto, B.D. PV hosting capacity dependence on harmonic voltage distortion in low-voltage grids: Model validation with experimental data. Energies 2018, 11, 465. [Google Scholar] [CrossRef] [Green Version]
  126. Turitsyn, K.; Šulc, P.; Backhaus, S.; Chertkov, M. Options for control of reactive power by distributed photovoltaic generators. Proc. IEEE 2011, 99, 1063–1073. [Google Scholar] [CrossRef] [Green Version]
  127. Kryonidis, G.C.; Kontis, E.O.; Chrysochos, A.I.; Demoulias, C.S.; Papagiannis, G.K. Coordinated phase-based voltage regulation in active unbalanced LV distribution networks. In Proceedings of the 51st International Universities Power Engineering Conference, UPEC 2016, Coimbra, Portugal, 6–9 September 2016; pp. 1–6. [Google Scholar]
  128. Chua, K.H.; Lim, Y.S.; Taylor, P.; Morris, S.; Wong, J. Energy storage system for mitigating voltage unbalance on low-voltage networks with photovoltaic systems. IEEE Trans. Power Deliv. 2012, 27, 1783–1790. [Google Scholar] [CrossRef]
  129. Gupta, T.N.; Murshid, S.; Singh, B. Power Quality Improvement of Single Phase Grid Connected Hybrid Solar PV and Wind System. In Proceedings of the 8th IEEE Power India International Conference-PIICON, Kurukshetra, India, 10–12 December 2018; pp. 1–5. [Google Scholar]
  130. Arshad, A.; Lehtonen, M. A comprehensive voltage control strategy with voltage flicker compensation for highly PV penetrated distribution networks. Electr. Power Syst. Res. 2019, 172, 105–113. [Google Scholar] [CrossRef]
  131. Mahmoud, K.; Lehtonen, M. Three-level control strategy for minimizing voltage deviation and flicker in PV-rich distribution systems. Int. J. Electr. Power Energy Syst. 2020, 120, 105997. [Google Scholar] [CrossRef]
Figure 1. A statistical summary of different reference values used for the photovoltaic (PV) hosting capacity (HC) definitions showing the peak load as the most widely employed HC reference in literature.
Energies 13 04756 g001
Figure 2. (a) Percentages of the statistics of PV HC limiting factors in literature showing voltage violations as the most pronounced limiting constraint; (b) Statistics of overvoltage limits defined in literature as per different studies with 1.05 p.u. as the most widely employed overvoltage limit
Energies 13 04756 g002
Figure 3. Most widely employed voltage rise limits in standards across countries.
Energies 13 04756 g003
Figure 4. Percentages of Voltage Unbalance limits employed in literature depicting 2% Un and 3% Un as the most pronounced limits.
Energies 13 04756 g004
Figure 5. A comparison of HC values of Urban, Suburban and, Rural networks in two different geographical areas with different HC refernces: (a) The implementation of a Model Predictive Control strategy for HC investigation of three Finnish LV test networks by taking peak load as HC reference at 61.9241° N with HC of urban network being most dominating [28]; (b) The investigation of PV integration approaches for three reference distribution grids by taking roof-space as HC reference at 51.1657° N [81].
Energies 13 04756 g005
Table 1. HC definitions based on various references adopted for defining HC.
ReferenceHC Definition
Peak LoadThe ratio of the maximum capacity of the PV installation to the peak load of the feeder.
TF RatingThe ratio of total PV production to the transformer’s rated capacity.
Customer PVsThe ratio of houses equipped with PVs to the total number of houses in the area under study.
Active PowerThe ratio of PV output to the active power of the load.
Roof-space PVsThe roof space of the feeder-connected houses that potentially enable the connection and installation of solar PV panels.
Energy ConsumptionThe ratio of total yearly energy generated by the PV systems to the overall energy consumption.
Table 2. Voltage rise standards due to PV integration of different countries as per different studies.
Voltage RiseCountries
1.1 p.u.Australia [94], Italy [21], Finland [28], Cyprus [88], South Africa [60], UK [23]
1.06 p.u.Sri Lanka ([72,74]), Qatar [13]
1.05 p.u.USA [24], Denmark [77], Sweden [1], Indonesia ([44,95]), Philippines [12]
1.03 p.u.Germany [15], China [2], Switzerland [33]
Table 3. A comparison of PV HC limited by overloading of transformers and cables in literature showing cable ampacity being more conservative as compared to transformer overloading limit.
TF Overloading LimitsCable Overloading Limits
100% of nominal rating in urban, Zurich [43]150% of rated power in suburban, Germany [15]
187.5% of rated capacity in urban, Brazil [8]105% of nominal line current in urban, New Orleans [58]
150% of rated power in suburban, Germany [15]100% of nominal rating in rural, Qatar [13]
100% of the nominal rating in rural, Qatar [13]85% of line rating in urban, Zurich [43]
Table 4. Voltage Unbalance limits applied in different studies.
3% Un2% Un1.3% Un1% Un
[8,45,54,86][30,34,71,90][23][35,39]
Table 5. Summary of Performance Indices (PI) limits for PV HC with voltage violations as the most widely adopted limiting constraint for PV HC calculation.
Article-No.PILimits Defined
[37,60,81,83,89]PI1 1EN-50160; PI1 ≤ +10%Un (253 V) (0.9 p.u.–1.1 p.u.)
[76]PI1BS-EN50160 (−6/+10% Un, 0.94 p.u.–1.1 p.u.)
[84,91]PI1−6/+10% Un (216 V–253 V)
[85]PI1CSA, +/−6% of Un
[7,9,41,56]PI1ANSI C84.1
[11,48,67,77,87]PI1ANSI C84.1; PI1≤ 1.05 p.u. (+/−5% Un)
[33,61,79]PI13% Un, 1.03 p.u.
[28,62,88]PI1, PI2, PI3EN-50160
[8]PI1, PI3, PI4PI1 = 0.92 p.u.–1.05 p.u.; PI3 = 187.5% of TF capacity; PI4 = 3%
[12]PI1, PI2PI1 = 1.05 p.u.; PI2 = 100% of nominal loading
[46]PI1, PI2, PI3PI1 = EN-50160; PI2, PI3 = 100% of nominal rating
[66]PI1PI1 = 1.05 p.u. (ANSI C84.1 2011)
[13]PI1, PI2, PI3PI1 = ± 6% Un; PI2, PI3 = 100% nominal rating
[15]PI1, PI2, PI3PI1 = 1.03 p.u.; PI2, PI3 = 150% of rated power
[64]PI1, PI2PI1 = Range A ANSI C84.1; PI2 = 100% of nominal rating
[54]PI1, PI4PI1 = 1.05 p.u.; PI4 = 0.03 p.u.
[38,97]PI1, PI2, PI3PI1 = ANSI C84.1; PI2, PI3 = Ampere rating of component
[86]PI1, PI4PI1 = 1.05 p.u.; PI4 = 0.03 p.u.(ANSI)
[19]PI1, PI2, PI3,PI5PI1 = (ANSI C84.1); PI5 = Flicker as per tolerance level 3%
[96]PI1, PI2, PI3PI1 = EN-50160 (+/−10% Un); PI2 = 75% Sn; PI3 = 100% Sn
[74]PI1, PI2PI1 = 1.06 p.u.; PI2 = 100% of nominal rating
[30]PI1, PI4PI1 = ± 10% Un; PI4 = 2% VUF
[44]PI1, PFPI1 = 1.05 p.u.; PF limit<0.85
[34]PI1, PI4PI1 = 0.95 p.u–1.06 p.u.; PI4 = VUF < 2%; VUFzero < 5%
[35]PI1, PI4PI1 = 0. 95 p.u.–1.05 p.u.; PI4 = Negative sequence unbalance within 0.01 p.u.;
[25]PI1, PI2, PI6, PFPI1 = 0.95 p.u.–1.05 p.u.; PI2 = 100% of nominal rating; PI6 = 5%; PF range 0.95–1.00.
[21]PI1, PI5PI1 = −4/+10% Un (96–110%); PI5 = 6% of rated value
[24]PI66.1% THD margin due to initial 1.9%THD
[90]PI1, PI4PI1 = EN50160 +/−10% Un; PI4 = 2% UVF
[39]PI1, PI4PI1 = ±3% Un; PI4 = 1% VUF
[22]PI1, PI5PI1 = ±5% Un ANSI C84.1; PI5 = 0.5 Plt upper limit
[71]PI1, PI4PI1 = 0.95 p.u.–1.06 p.u.; PI4 = VUF = 2%; VUFzero = 5%
[23]PI1, PI2, PI3, PI4, PI6PI1 = BS EN-50160 (−15/+10% Un); PI2, PI3 = 100% rated power; PI4 = 1.3% Un; PI6 = THDv as 5%
[45]PI1, PI4PI1 = 1.05 p.u.; PI4 = 3%
[55]PI1, PI2, PI3PI1 = 0.9 p.u.–1.1 p.u. (LV); 0.95 p.u.–1.05 p.u. (MV) as per NRS048-2, PI2, PI3 = 100% of rating
[43]PI1, PI2, PI3PI1 = 0.9 p.u.–1.1 p.u.; PI2 = 100% of line rating;
PI3 = 100% of nominal apparent power
[94]PI10.89 p.u.–1.1 p.u. (205 V-253 V) (−11/+10% Un)
[18]PI10.917 p.u.–1.042 p.u. as per CAN3-C235
[58]PI1, PI2, PI3PI2 = 105% of nominal rating; PI3 = 100% of nominal rating
[103]PI1, PI2, PI4PI1, PI4 = EN 50160; PI2 = IEC standards, DSO requirement
[90]PI1, PI4PI1 = EN50160 +/−10% Un; PI4 = 2% UVF
[102]PI1, PI2, PI3PI1 = 0.95 p.u.–1.05 p.u.; PI2, PI3 = Nominal rating
[109]PI1+/−5% Un (Normal operation), +/−10% Un (Contingency)
1: PI1 = Voltage Violations, PI2 = Cable Ampacity, PI3 = Transformer Overloading, PI4 = Voltage Unbalance, PI5 = Flicker, PI6 = Harmonics.
Table 6. Estimated HC of present networks without adopting any control or mitigation means.
No.Test NetworkLatitudeHC Reference Estimated HC
[95]Urban, Yogyakarta7.7956° SFeeder Load100% (8.8 MW)
[8]Urban radial LV, Brazil14.2350° STF rating38.2%
[37]Residential, Belgium50.5039° NCustomer PVs50%
[81]Urban (Thermal violations)-Roof-space PVs45%
[43]Urban LV, Zurich47.3769° NEnergy Consumption43% (1.258 GWh)
[73]Urban LV-TF rating (500 KVA)35.65%
[58]Urban balanced, New Orleans29.9511° NPeak load (33.69 MW)15–30%
[109]Urban, Manhattan (Best case)40.7831° NMinimum Load95%
[28]Urban balanced, Finland61.9241° NPeak load239.7%
[10]Urban Keolu, Hawaii USA19.8968° NPeak Load (6.3 MW)77% (4.8 MW)
[72]Urban LV unbalanced, Kotte6.8868° NTF rating40%
[39]Urban LV unbalanced, Perth31.9505° STF rating (200 KVA)31.9% (63.81 kW)
[62]Urban, Hebron Palestine31.5326° NPeak Load (31.27 MW)LV 120%, MV 70%
[81]Rural (Voltage violation)-Roof-space PVs13%
[65]Rural LV, European54.5260° NPeak Load 86%
[28]Rural balanced, Finland61.9241° NPeak load198%
[13]Rural small farm, Qatar25.3548° NTF rating (300 kVA)30%
[24]Rural LV, Quatre Cocos20.2016° SLoad capacity 40%
[28]Suburban balanced, Finland61.9241° NPeak load 233.5%
[34]Suburban LV, Australia25.2744° STF rating (200 kVA)35%
[80]Suburban, Switzerland46.8182° NEnergy consumption28.57%
[30]LV, Denmark56.2639° NCustomer PVs40%
[76]LV, UK55.3781° NCustomer PVs30%
[82]LV unbalanced, Sydney33.8048° SActive power of load111%
[39]LV unbalanced, Perth31.9505° S TF rating (200 kVA)31.9%
[44]Distribution feeder0.7893° SPeak Load 16.48% (1349 kW)
[47]German distribution grid51.1657° NEnergy consumption 88%
[48]Distribution grid, California36.7783° NPeak load (16.88 MW)15.5% (2.6 MW)
[14]Distribution network36.7783° NPeak load132%
[55]Distributed 3 phase Industrial33.9249° SPeak load31%
[55]Residential, Cape town33.9249° SPeak load82–150%
[60]Radial, South Africa30.5595° SFeeder’s design load70%
[7]Real feeder, California36.7783° NPeak load35%
[2]11.4 kV MV, Taiwan, China23.6978° NTotal load (4.63 MW)86%
[94]LV, distributed PV25.2744° SLoad 40%
[23]UK network55.3781° NCustomer PVs200%
[59]USA distribution feeders37.0902° NPeak load >30%
[9]Residential USA feeder37.0902° NPeak load81% 1
[9]Residential USA feeder37.0902° NPeak load73% 2
1: Random simulations; 2: Intelligent scheme.
Table 7. Summary of HC improvement methods depicting the percentage increase in HC.
No. HC Increase MethodReferenceInitial HCFinal HC
[75]OLTC (1-min control cycle)Customer PV40%100%
[76]OLTC (Setting of ±8%)Customer PV30%50%
[28]OLTC (Balanced feed-in case of rural and urban)Peak load HC increase by 17.5% and 43.5% for 0% and 5% MV change
[29]OLTC (Rural LV region and OLTC tapping of ±10%)TF rating105.266%113.03%
[30]OLTC + Reactive Power SupportCustomer PV40%70%
[45]Tap changing transformers + Capacitors settingsPeak load 38%64.4%
[27]LTC + Smart Inverters (0.995 and 0.98 lagging PF)Peak load 158% PV HC increase
[114]OLTC (Voltage Band (VB) extension)-VB extension from 3–8.5%
[10]OLTC setting+ 61 SVCs + 514 Smart InvertersPeak load77%154%
[31]OLTC (±8%) + 235 V (1.02 p.u. fixed voltage target)Customer PV40%60%
[31]OLTC (−4/+12%) + 240 V (1.04 p.u. fixed voltage target)Customer PV40%100%
[79]OLTC (−12/+8%) + Local Control ApproachCustomer PV100% PV HC increase
[87]Tap changer + Reactive Power Support-175% PV HC increase
[73]RPC +APC (Urban distribution network)TF rating35.65%66.7%
[44]Lagging PF settings of PV invertersPeak load 95.9% PV HC increase
[45]Smart Inverter (Volt-VAR Control)Peak load 116.4%213.2%
[85]BESS + Voltage regulatorsTF rating 62% PV HC increase
[36]Quadratic operation of BESS + Optimal converter sizingAnnual Energy14.33%29.5%
Consumption
[34]DR + OLTC (Independent phase tap control)TF rating 20%(40 kW)35%(65 kW)
[33]Demand Response Energy 28.57%52.78%
Consumption
[42]Network Reconfiguration (NR) of HVDN-30–78% increase in PV HC
[21]NR (Load modeling as P and Q buses + 0.9 PF lagging)-0–20% increase in HC
[89]APC + Inverter P(U) control (Probabilistic approach)TF rating 142 kWp (88% of TF rating)
[83]APC (Single-phase load)Energy 59.72% of total generation
[48]Static CompensatorPeak load15%100%

