Abstract
Fast detection and isolation of direct current (DC) faults are key issues for DC grids. Therefore, it is very necessary to study the fault protection principle for DC grids. This paper firstly presents the main difficulties in DC fault protection. Then, a local protection and local action strategy for isolating the DC faults is proposed. To illustrate the performance of the proposed protection strategy, a four-terminal DC grid with the hybrid high voltage direct current (HVDC) circuit breakers (HVDC CBs) is constructed in the time-domain simulation software PSCAD/EMTDC as the test system. The systematical comparison between the ordinary protection strategy and the proposed strategy is carried out. The protection selectivity of the proposed local detection and local action strategy is thoroughly studied through complete DC line fault scanning of the test system. The simulation results show that the proposed strategy is of high protection selectivity and speed. In addition, the current rating and the voltage of HVDC CB could be greatly reduced with the proposed strategy, which proves the economic benefits of the proposed strategy.
1. Introduction
Theoretically, the converters in the DC grid can be connected in parallel, in series, or in hybrid mode [1]. For the parallel converters, the DC voltage of each converter is roughly the same, and the power distribution can be achieved by controlling the DC current of each converter. For converters connected in series, the current flowing through each converter is the same, and the power distribution can be regulated by adjusting the DC voltage of each converter. However, the converters connected in parallel are more suitable for DC grids due to the higher reliability, economy, and flexibility. In this configuration, the voltage polarity of each converter is fixed. In the early ages, most high voltage direct current (HVDC) systems were based on the line commutated converters (LCCs), and the DC power flow direction was fixed since the current of the thyristor could not be reversed. Due to this shortcoming in LCC, DC grid has not received much attention in the first 50 years of the HVDC transmission. However, with the development of power electronics, the voltage source converter-based HVDC (VSC-HVDC) [2,3,4,5] has drawn much attention from both academia and industry due to its flexible operation capability, and the advantages of a DC grid can be fully achieved by VSC.Ever since, the DC grid has become a new expectation of the power industry.
There are three main technical bottlenecks in the development of DC grids. One is the fast detection and isolation technology of DC faults [6,7]. The second is the DC voltage transformation technology [8,9]. The third is the power flow control technology of the DC lines [10,11]. This paper mainly deals with the first technical bottleneck and studies the fault protection principle for DC grids.
The difficulties of DC grids in fault protection lie mainly in the following aspects [12,13,14,15]:
- (1)
- The fault current rises very quickly. Generally, the fault current could reach its steady value within 10 ms after the fault;
- (2)
- The steady fault current is very large, and it could reach dozens of times the rated current;
- (3)
- There is no zero-crossing point in the fault current, which makes it difficult for the circuit breakers (CBs) to extinguish the fault arc;
- (4)
- The requirements to fast clear the fault current are extremely high. The fault isolation time in the alternating current (AC) system is generally 50 ms and above, while it is required to clear the DC faults in 5 ms in the DC grid. Otherwise, the equipment safety will be threatened. To achieve the rapidity of DC fault protection in the DC grid, the DC faults are supposed not to be cleared mainly through the relay protection at the AC side.
To this end, this paper proposes a local protection and local action strategy for HVDC grids. This strategy is of high protection selectivity and speed, which is able to solve the above technical problems effectively.
This paper is organized as follows. Section 2 gives the basic structure and operation principle of the hybrid circuit breaker. The local protection and local action strategy is introduced in Section 3. Section 4 describes the test system constructed in this paper. To verify the improved protection speed and selectivity, a performance comparison between the proposed strategy and the conventional relay protection strategy is presented in Section 5. The conclusions are drawn in Section 6.
2. Basic Structure and Operation Principle of DC Circuit Breaker
The HVDC CB adopted in this paper is the hybrid HVDC CB proposed by ABB [16,17], as shown in Figure 1. The HVDC CB is connected between one multi-level modular converter (MMC) and one DC line. When the faults occur on the DC lines, the HVDC CB starts action to isolate the fault line.
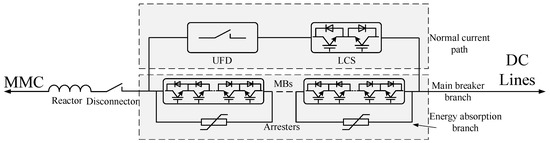
Figure 1.
Structure of the hybrid high voltage direct current circuit breaker (HVDC CB).
The DC circuit breaker is composed of a normal current path, a main breaker branch, and an energy absorption branch. The normal current path consists of a load commutation switch (LCS) and an ultra-fast disconnector (UFD) connected in series. Multiple main breakers (MBs) connected in series constitute the main breaker branch. The basic structure of each part is as follows:
- (1)
- Main breakers (MBs). This is the core component of HVDC CB. It determines the voltage withstand capacity and current breaking capacity. Furthermore, it is composed of multiple parts connected in series. Each part involves multiple semiconductor switches connected in series, together with arresters in parallel. To improve the breaking capacity, a single semiconductor switch can be composed of multiple insulated-gate bipolar transistors (IGBTs) in parallel. MBs need to have bidirectional current interruption capability and withstand the pole-to-ground voltage;
- (2)
- Arresters. Each individual main breaker module is in parallel with the arrester banks. The arresters absorb energy and make the fault current decay quickly;
- (3)
- Load commutation switch (LCS). Its structure is similar to the segmented structure of MBs. It is composed of multiple switches connected in series, which includes several IGBTs connected in series and the anti-parallel diodes. Since LCS does not need to withstand high voltages, only a few power electronic devices are required. Moreover, LCS needs to have bidirectional current breaking capability;
- (4)
- Ultra-fast disconnector (UFD). It needs to quickly disconnect the circuit under zero current state. Furthermore, the breaking time is about 2 ms.
The principle of the hybrid HVDC CB is as follows [18,19,20]:
- (1)
- During the steady state, UFD and LCS are closed, whereas MBs are open. The DC current flows through the normal current path;
- (2)
- When a fault occurs on the DC side, the IGBTs in LCS start action, and then the fault current transfers to the fault current interruption branch after a delay of about 250 μs;
- (3)
- When the current in LCS drops to the residual current, UFD is commanded to open. Moreover, it achieves full contact separation within 2 ms;
- (4)
- After UFD finishes its operation, MBs start action. At the moment MBs are disconnected, the arresters are inserted to the fault line. This causes a sudden change in the flowing path of the fault current. Due to the sudden change of the inductor current, there would be an extremely high overvoltage in the DC grid (which could exceed twice the rated DC voltage). The insertion of the arresters makes the fault current attenuate to zero. Usually, it takes 10–15 ms for the fault current to decay to zero.
3. Two Basic Protection Strategies for DC Grids
For a half-bridge sub-module (HBSM) multi-level modular converters (MMCs)-based DC grid equipped with HVDC CBs, how to quickly detect and isolate the DC faults is a very challenging problem.
The conventional strategy is to follow the practice of the AC grid. The protection action sequence is shown in Figure 2. Firstly, the relay protection system detects the fault location, and then the fault line is isolated by CBs. However, this strategy puts extremely high requirements on the speed and selectivity of the relay protection system. According to the speed of fault detection in conventional two-terminal HVDC systems, the duration for fault detection is about 10 ms [21]. If the fault detection speed in DC grids is the same as that in the conventional two terminal HVDC system, the fault current to be interrupted by the DC breaker will reach a very high level. Furthermore, this will result in huge costs of CBs. In addition, this will severely limit the application of DC grids of this structure.
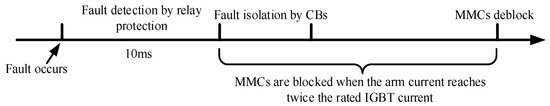
Figure 2.
Protection action sequence of strategy 1.
The other strategy is based on local protection and local action. There could be two aspects to explain local protection. The first is the local protection of the converters. If the arm current reaches twice the rated IGBT current, the converter will then be automatically blocked. Moreover, there is no need for a relay protection signal. The second means the local protection of CBs. When the current flowing through CB is more than twice its rated current, LCS will be activated immediately as well as the whole CB. That is, CBs on both sides of the line independently finish fault detection and tripping, and there is no need for a coordination between CBs. Local action means that CB only operates when the fault occurs at the DC line where CB is located. Define that the positive direction of the CB current is from MMC to the DC line. Then, only when the fault current is the same as the positive direction and reaches twice the rated CB current, CB is activated. Local action guarantees the high protection selectivity. The protection action sequence is shown in Figure 3. Practice has shown that this strategy is very suitable for DC grids. Furthermore, it has high protection speed and protection selectivity, which could greatly reduce the required breaking capacity of CBs, thereby saving the cost.
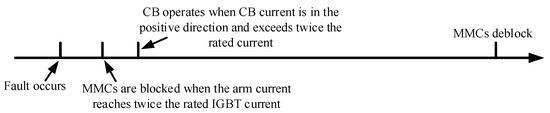
Figure 3.
Protection action sequence of strategy 2.
The two different strategies will be studied separately in the following sections. The first strategy is to deal with the faults by the conventional DC fault relay protection. The second strategy is the local protection and local action strategy.
4. Test System
The two different strategies will be compared through simulations of a test system on PSCAD/EMTDC. The designed test system is shown in Figure 4. Both the AC system at the sending end and the receiving end are connected to a modified two-zone four-generator system [22]. The main parameters of the four-machine system are listed in Table 1. The generator and the control system parameters, as well as the network structure and parameters remain consistent with the original system. Only the load and output of the generator are changed. The DC grid is in the monopole-grounded return operation mode. The model of all DC lines is 4 × LGJ-720. The parameters of DC lines in the simulation are resistance 0.009735 Ω/km, inductance 0.8489 × 10⁻³ H/km, and capacitance 0.01367 × 10⁻⁶ F/km. The parameters of the four MMCs based on HBSMs are shown in Table 2. The control mode is shown in Table 3. Table 4 gives the initial state of the two AC systems. Among them, GA1–GA4 and GB1–GB4 are the generators of the two AC systems A and B, respectively. LA7, LA9 and LB7, LB9 are the loads connected to the No. 7 and No. 9 buses. CA7, CA9 and CB7, CB9 are the reactive power compensators.
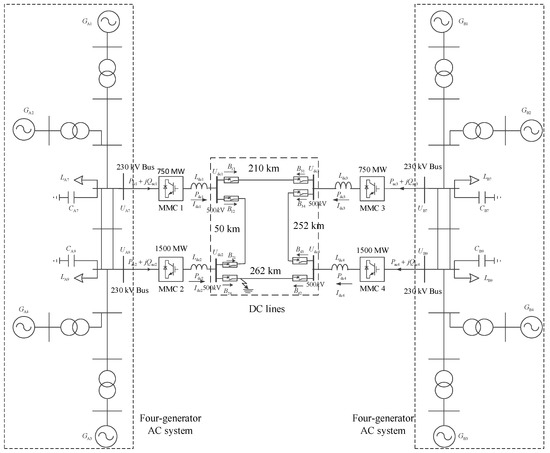
Figure 4.
Structure of the designed test system.

Table 1.
Main parameters of the four-generator alternating current (AC) system.
Table 2.
Main parameters of multi-level modular converters (MMCs) in the test system.
Table 3.
Control mode and reference value of MMCs.
Table 4.
Initial state of the generators, loads, and reactive power compensators in the AC systems.
5. Performances of the Two Strategies
5.1. Strategy 1—Relay Protection
It is assumed that a pole-to-ground fault occurs on the DC line between MMC 2 and MMC 4. At t = 0 s, the test system is in steady state. At t = 10 ms, a pole-to-ground fault occurs on the positive line side of B24. Suppose the relay protection completes fault location detection at 20 ms. LCS of B24 and B42 starts action at the same time. UFD of B24 and B42 opens after 0.25 ms. At t = 22.25 ms, UFD achieves full contacts separation and MBs start action. During the entire process, if the arm current is higher than twice the rated IGBT current, the converter will be blocked. The rated IGBT current of MMC 1 and MMC 3 is 1.5 kA, and the rated IGBT current of MMC 2 and MMC 4 is 3.0 kA. The blocked MMCs deblock at t = 40 ms and operate according to the pre-fault control strategy. Figure 5, Figure 6 and Figure 7 give the responses of B24, B42, and MMCs, respectively.
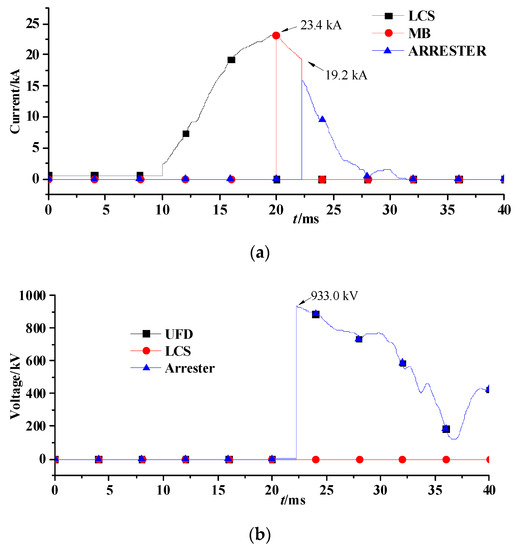
Figure 5.
Responses of B24 under strategy 1: (a) currents flowing through load commutation switch (LCS), main breakers (MBs), and arrester; (b) voltages across ultra-fast disconnector (UFD), LCS, and arrester.
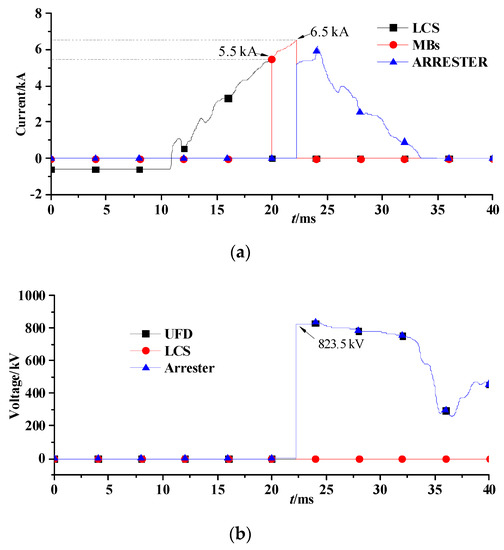
Figure 6.
Responses of B42 under strategy 1: (a) currents flowing through LCS, MBs, and arrester; (b) voltages across UFD, LCS, and arrester.
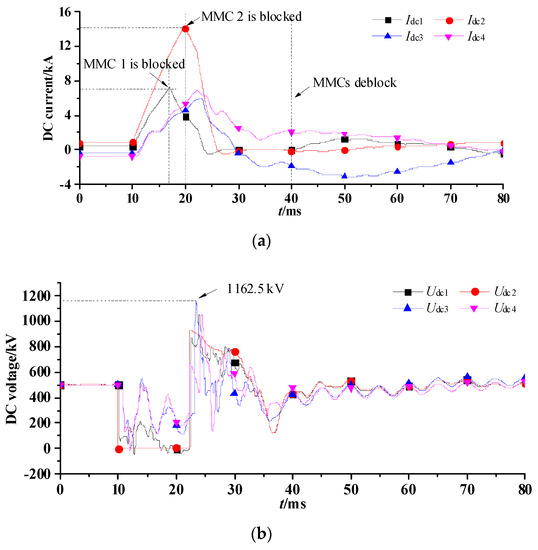
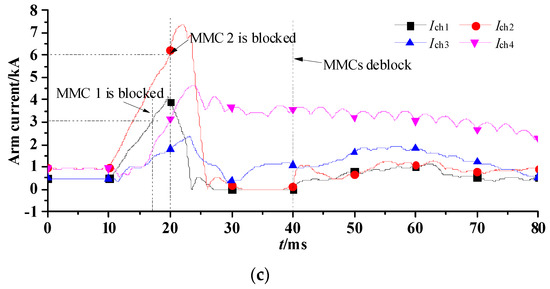
Figure 7.
Responses of MMCs under strategy 1: (a) currents flowing through the smoothing reactors; (b) voltages across MMCs; (c) arm currents.
It can be seen from Figure 5 that for B24 (CB near the fault), the current when LCS starts action is 23.4 kA, and the current when MBs start action is 19.2 kA. After MBs are fully opened, the maximum voltage across them is 933.0 kV, which is 1.87 times the rated DC voltage. It can be seen from Figure 6 that for B42 (CB far from the fault), the current when LCS starts action is 5.5 kA. Furthermore, the current when MBs start action is 6.5 kA. The maximum voltage across MBs when they finish operation is 823.5 kV, which is 1.65 times the rated voltage of the DC grid. It can be seen from Figure 5 and Figure 6 that it takes about 10 ms for the fault current to decay to zero.
It can be seen from Figure 7 that for MMCs near the fault, the currents of the smoothing reactors reach 14.3 kA and 7.3 kA, respectively. The arm currents are also very large, exceeding twice the rated IGBT current, and blocking MMC 2 and MMC 1. After MBs of B24 and B42 are disconnected, the overvoltage of the whole network reaches the peak value instantly. The voltage of MMC 3 reaches 1162.5 kV, which is more than twice the rated DC voltage (the peak value does not appear at the moment when CB is opened).
5.2. Strategy 2—Local Detection and Local Action
In this test system, the rated IGBT current of MMC 1 and MMC 3 is 1.5 kA, and the rated IGBT current of MMC 2 and MMC 4 is 3.0 kA. Therefore, MMC 1 and MMC 3 would be blocked when the arm current reaches 3.0 kA; MMC 2 and MMC 4 would be blocked when the arm current reaches 6.0 kA. The maximum currents of all DC lines in the test system under normal conditions are less than 3.0 kA. The defined positive directions of CBs are marked in Figure 4. Therefore, the HVDC CB is supposed to operate as soon as the current through it is in the positive direction and reaches 6.0 kA.
It is assumed that a pole-to-ground fault occurs on the DC line between MMC 2 and MMC 4. At t = 0 s, the test system is in steady state. At t = 10 ms, a pole-to-ground fault occurs on the positive line side of B24. Figure 8 shows the currents flowing through the eight HVDC CBs. It can be seen that the current through B24 and B42 on both sides of the fault line reaches 6.0 kA. B24 and B42 start action at 1.6 ms and 8.8 ms after the fault, respectively. As a result, the DC currents passing through the other CBs begin to decrease, and the other CBs do not operate.
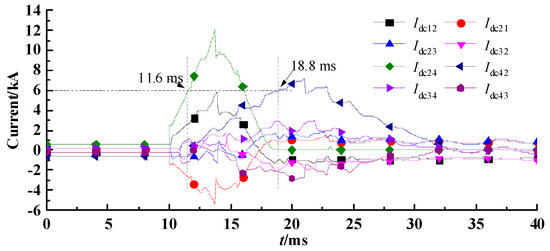
Figure 8.
Currents flowing through eight HVDC breakers.
Then, the speed and selectivity of the proposed strategy is studied by complete line fault scanning of the test system. This is achieved by simulation of DC faults at all typical fault locations. The typical fault locations are selected as the sending end, the receiving end, and the midpoint of all the DC lines. The results are shown in Table 5.
Table 5.
The activated CBs and activated time under different faults.
It is noted in Table 5 that this strategy has high speed and protection selectivity. Take the fault on the positive line side of B24 as an example for explanation. Obviously, CBs closest to the fault site are B24 and B21. Therefore, B24 and B21 should be the first CBs to start action. However, B24 is activated but B21 is not. On the one hand, this is because the fault current through B21 is provided by MMC 1. Due to the smoothing reactors and DC line, the fault current through B21 reaches the operating current more than 2 ms later than B24. Therefore, for B21, it will not start action since the fault disappears once B24 starts action. On the other hand, the fault current through B21 is in the opposite direction, whereas the fault current through B24 is in the positive direction. Therefore, according to the local protection and local action strategy, B21 will not start action.
5.3. Performance Comparison of Two Strategies
To show the complete features of strategy 2, comparisons with strategy 1 are given under the pole-to-ground fault on the positive line side of B24. Figure 9, Figure 10 and Figure 11 give the responses of B24, B42, and MMCs, respectively. It can be seen from Figure 9 that for B24 near the fault, the current when LCS starts action is 6.0 kA. Moreover, the current when MBs start action is 12.6 kA. After MBs are fully opened, the maximum voltage across them is 890.6 kV, which is 1.78 times the rated voltage of the DC grid. It can be seen from Figure 10 that for B42 far from the fault, the current when LCS starts action is 6.0 kA. Furthermore, the current when MBs start action is 7.1 kA. The maximum voltage across MBs after they are disconnected is 831.9 kV, which is 1.66 times the rated DC voltage. Both Figure 9 and Figure 10 show that it takes about 10 ms for the fault current to decay to zero.
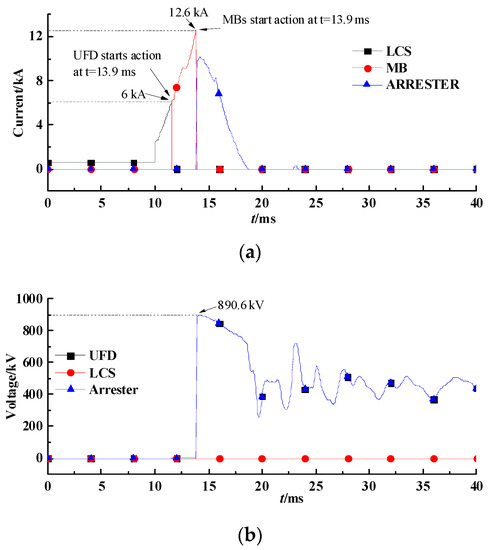
Figure 9.
Responses of B24 under strategy 2: (a) currents flowing through LCS, MBs, and arrester; (b) voltages across UFD, LCS, and arrester.
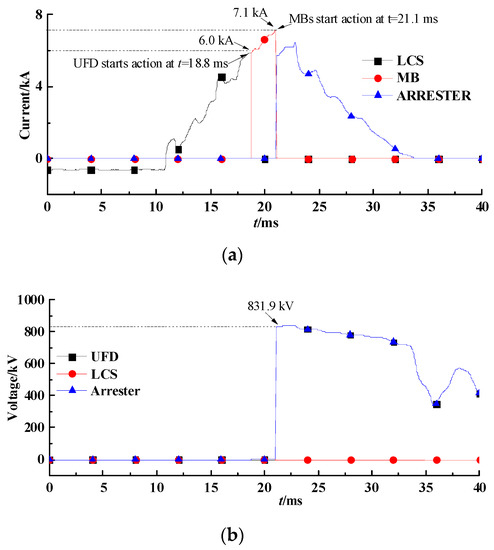
Figure 10.
Responses of B42 under strategy 2: (a) currents flowing through LCS, MBs, and arrester; (b) voltages across UFD, LCS, and arrester.
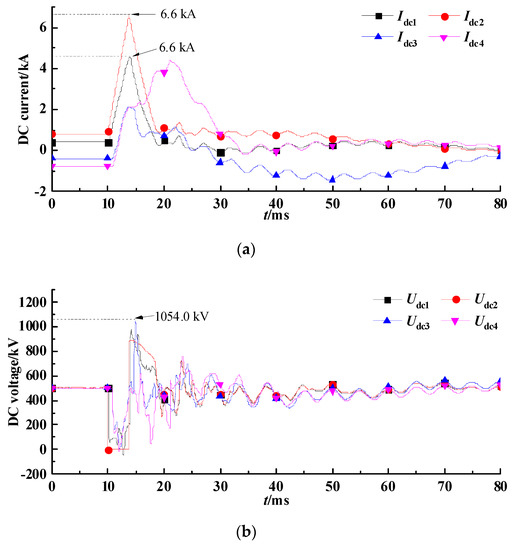
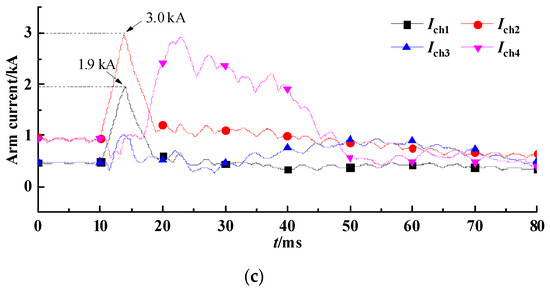
Figure 11.
Responses of MMCs under strategy 2: (a) currents flowing through the smoothing reactors; (b) voltages across MMCs; (c) arm currents.
It can be seen from Figure 11 that for MMC 2 and MMC 1 that are close to the fault, the currents through the smoothing reactors reach 6.6 kA and 4.6 kA, respectively. The arm currents do not exceed twice the rated IGBT currents, and MMC 2 and MMC 1 do not need to be blocked. When B24 and B42 are completely disconnected, the overvoltage of the whole network reaches the peak value instantly. The voltage of MMC 3 reaches 1054.0 kV, which is more than twice the rated DC voltage (the peak value does not appear at the moment when CB is opened).
For the pole-to-ground fault on the positive line side of B24, Table 6 shows the performances of the two strategies. It can be seen from Table 6 that the fault isolation time is earlier in strategy 2. The current level when CBs closest to the fault are activated is much lower in strategy 2 than that in strategy 1. In addition, in strategy 2, the peak currents flowing through the smoothing reactors and the arms are greatly reduced. More specifically, the MMCs in strategy 2 do not need to be blocked, and the impact of the fault is mitigated. Above all, the transient performance of strategy 2 is improved.
Table 6.
Performance comparison of the two strategies.
5.4. Cost Comparison of Two Strategies
Taking the pole-to-ground fault on the positive line side of B24, for example, the device costs of CBs can be computed as follows. LCS is not required to withstand high voltages. MBs should be able to withstand the maximum pole-to-ground voltage as well as the maximum fault current after MBs are activated. Therefore, MBs are the main investment in both the two strategies [23].
Assume that the HiPak 5SNA 3000K452300 (ABB, Lenzburg, Switzerland) is adopted as the IGBT module. The rated collector–emitter voltage of the IGBT module is 4.5 kV. The breaking capability is 3 kA. Since the breaker is designed to break the current in either current direction, the direction index is 2. The peak current of the IGBT module can be obtained from Table 6. Moreover, the required breaking capability of CBs is usually larger than that. The IGBTs should be connected in parallel to guarantee sufficient current breaking capacity. In addition, series IGBTs in MBs need to withstand the pole-to-ground voltage. Furthermore, the series index could be calculated based on the maximum pole-to-ground voltage. In HVDC grids, one converter is usually connected to m (m ≥ 2) DC lines. Therefore, the total required device number of B24 under the two strategies could be computed as listed in Table 7.
Table 7.
Required device number of the two strategies.
It can be seen from Table 7 that as the number of the connected DC lines rises, the number of required IGBTs in strategy 1 increases more. Moreover, it is the same for other CBs. The cost savings will be more conspicuous if there are more DC lines. Therefore, strategy 2 is very beneficial to reduce the investment of CBs in HVDC grids.
6. Conclusions
This paper proposes a local detection and local action strategy for DC grids. Compared with the conventional relay protection strategy, the proposed strategy has the following advantages:
- (1)
- The proposed strategy has good protection selectivity. The difficulties in fault detection of DC grids are well solved;
- (2)
- The proposed strategy has high protection speed, which can quickly isolate the faults, and greatly reduces the impacts of the faults on the DC system;
- (3)
- The proposed strategy can greatly reduce the interrupted current level of HVDC CBs, and can greatly reduce the cost of HVDC CBs.
Author Contributions
Conceptualization, Z.Z. and Z.X.; methodology, Z.X.; software, Z.Z.; validation, J.Y.; formal analysis, J.Y.; investigation, J.Y.; resources, Z.X.; data curation, Z.X.; writing—original draft preparation, J.Y.; writing—review and editing, Z.Z.; visualization, Z.Z.; supervision, Z.X.; project administration, Z.X.; funding acquisition, Z.X. All authors have read and agreed to the published version of the manuscript.
Funding
This research was funded by the Headquarters Research Projects of State Grid Corporation of China, grant number SGJSJY00GHJS1900028.
Conflicts of Interest
The authors declare no conflict of interest.
References
- Zhao, W.J. HVDC Engineering Technology, 2nd ed.; China Electric Power Press: Beijing, China, 2011. [Google Scholar]
- Xu, Z.; Tu, Q.; Guan, M. Voltage Source Converter Based HVDC Power Transmission Systems, 2nd ed.; China Machine Press: Beijing, China, 2013. [Google Scholar]
- Feldman, R.; Tomasini, M.; Amankwah, E.; Clare, J.; Wheeler, P.; Trainer, D.R.; Whitehouse, R.S. A Hybrid Modular Multilevel Voltage Source Converter for HVDC Power Transmission. IEEE Trans. Ind. Appl. 2013, 49, 1577–1588. [Google Scholar] [CrossRef]
- Marquardt, R. Modular multilevel converter: A universal concept for HVDC-networks and extended DC-bus-applications. In Proceedings of the 2010 International Power Electronics Conference (IPEC), Sapporo, Japan, 21–24 June 2010. [Google Scholar]
- Adam, G.P.; Ahmed, K.H.; Finney, S.J.; Bell, K.; Williams, B.W. New Breed of Network Fault-Tolerant Voltage-Source-Converter HVDC Transmission System. IEEE Trans. Power Syst. 2013, 28, 335–346. [Google Scholar] [CrossRef]
- Ara, R.; Khan, U.A.; Bhatti, A.I.; Lee, B.W. A Reliable Protection Scheme for Fast DC Fault Clearance in a VSC-Based Meshed MTDC Grid. IEEE Access 2020, 8, 88188–88199. [Google Scholar] [CrossRef]
- Lv, C.; Tai, N.; Zheng, X. Protection principle for MMC-HVDC DC lines based on boundary signals. J. Eng. 2017, 13, 961–965. [Google Scholar] [CrossRef]
- Kenzelmann, S.; Rufer, A.; Dujic, D.; Canales, F.; de Novaes, Y. Isolated DC/DC Structure Based on Modular Multilevel Converter. IEEE Trans. Power Electron. 2015, 30, 89–98. [Google Scholar] [CrossRef]
- Suo, Z.; Li, G.; Xu, L.; Li, R.; Wang, W.; Chi, Y. Hybrid modular multilevel converter based multi-terminal DC/DC converter with minimised full-bridge submodules ratio considering DC fault isolation. IET Renew. Power Gener. 2016, 10, 1587–1596. [Google Scholar] [CrossRef]
- Wen, J.; Tang, Y.; Xie, C.; Chen, X.; Wang, Y.; An, N. Research on Power Flow Algorithm of Power System with UPFC. In Proceedings of the 2018 International Conference on Power System Technology (POWERCON), Guangzhou, China, 6–8 November 2018. [Google Scholar]
- Rouzbehi, K.; Candela, J.; Luna, A.; Gharehpetian, G.; Rodriguez, P. Flexible Control of Power Flow in Multiterminal DC Grids Using DC–DC Converter. IEEE J. Emerg. Sel. Top. Power Electron. 2016, 4, 1135–1144. [Google Scholar] [CrossRef]
- Wu, Y.; Lv, Z.; He, Z. Study on the protection strategies of HVDC grid for overhead line application. Proc. CSEE 2016, 36, 3726–3734. [Google Scholar]
- Wei, X.; Gao, C.; Luo, X.; Zhou, W.; Wu, Y. A novel design of high-voltage DC circuit breaker in HVDC flexible transmission grid. Autom. Electr. Power Syst. 2013, 37, 95–102. [Google Scholar]
- Li, B.; He, J. Research on the DC fault isolating technique in multi-terminal DC system. Proc. CSEE 2016, 36, 87–95. [Google Scholar]
- CIGRE B4-52 Working Group. HVDC Grid Feasibility Study; International Council on Large Electric Systems: Mel-Bourne, Australia, 2011. [Google Scholar]
- Callavik, M.; Blomberg, A.; Hafner, J. The Hybrid HVDC Breaker-An Innovation Breakthrough Enabling Reliable HVDC Grids; ABB Grid Systems: Zurich, Switzerland, 2012; pp. 1–10. [Google Scholar]
- Hafner, J.; Jacobason, B. Proactive hybrid HVDC breakers-a key innovation for reliable HVDC grids. In Proceedings of the CIGRE 2011 Bologna Symposium, Bologna, Italy, 13–15 September 2011. [Google Scholar]
- Shukla, A.; Demetriades, G. A Survey on Hybrid Circuit-Breaker Topologies. IEEE Trans. Power Deliv. 2015, 30, 627–641. [Google Scholar]
- Li, L.; Zhang, B.; Fang, C.; Li, W.; Ren, X.; Diao, T. Researches on interruption characteristics of a hybrid HVDC circuit breaker. In Proceedings of the 2017 4th International Conference on Electric Power Equipment-Switching Technology (ICEPE-ST), Xi’an, China, 22–25 October 2017. [Google Scholar]
- Lazzari, R.; Piegari, L. Design and Implementation of HVDC Hybrid Circuit Breaker. IEEE Trans. Power Electron. 2019, 34, 7369–7380. [Google Scholar] [CrossRef]
- Song, G.; Gao, S.; Cai, X.; Zhang, J.; Rao, J.; Suonan, J. Survey of relay protection technology for HVDC transmission lines. Autom. Electr. Power Syst. 2012, 36, 123–129. [Google Scholar]
- Kundur, P. Power System Stability and Control; McGraw-Hill Incorporated: New York, NY, USA, 1994. [Google Scholar]
- Liu, G.; Xu, F.; Xu, Z.; Zhang, Z.; Tang, G. Assembly HVDC Breaker for HVDC Grids with Modular Multilevel Converters. IEEE Trans. Power Electron. 2017, 32, 931–941. [Google Scholar] [CrossRef]


© 2020 by the authors. Licensee MDPI, Basel, Switzerland. This article is an open access article distributed under the terms and conditions of the Creative Commons Attribution (CC BY) license (http://creativecommons.org/licenses/by/4.0/).