Article

Process Integration of Green Hydrogen: Decarbonization of Chemical Industries

by
Mohammad Ostadi
1,
Kristofer Gunnar Paso
1,*,
Sandra Rodriguez-Fabia
2,
Lars Erik Øi
3,
Flavio Manenti
4 and
Magne Hillestad
1
1
Department of Chemical Engineering, Norwegian University of Science and Technology (NTNU), 7491 Trondheim, Norway
2
RISE PFI AS, 7034 Trondheim, Norway
3
Department of Process, Energy and Environmental Technology, University of South-Eastern Norway, 3901 Porsgrunn, Norway
4
Department of Chemistry, Materials and Chemical Engineering, Polytechnic University of Milan, 20133 Milan, Italy
*
Author to whom correspondence should be addressed.
Energies 2020, 13(18), 4859; https://doi.org/10.3390/en13184859
Submission received: 20 August 2020 / Revised: 8 September 2020 / Accepted: 16 September 2020 / Published: 17 September 2020
(This article belongs to the Special Issue Advances in Hydrogen Production and Hydrogen Separation)

Abstract

:
Integrated water electrolysis is a core principle of new process configurations for decarbonized heavy industries. Water electrolysis generates H2 and O2 and involves an exchange of thermal energy. In this manuscript, we investigate specific traditional heavy industrial processes that have previously been performed in nitrogen-rich air environments. We show that the individual process streams may be holistically integrated to establish new decarbonized industrial processes. In new process configurations, CO2 capture is facilitated by avoiding inert gases in reactant streams. The primary energy required to drive electrolysis may be obtained from emerging renewable power sources (wind, solar, etc.) which have enjoyed substantial industrial development and cost reductions over the last decade. The new industrial designs uniquely harmonize the intermittency of renewable energy, allowing chemical energy storage. We show that fully integrated electrolysis promotes the viability of decarbonized industrial processes. Specifically, new process designs uniquely exploit intermittent renewable energy for CO2 conversion, enabling thermal integration, H2 and O2 utilization, and sub-process harmonization for economic feasibility. The new designs are increasingly viable for decarbonizing ferric iron reduction, municipal waste incineration, biomass gasification, fermentation, pulp production, biogas upgrading, and calcination, and are an essential step forward in reducing anthropogenic CO2 emissions.

1. Introduction

The unsubsidized levelized cost of electricity generated from solar sources and wind sources has decreased by 89% and 70% between 2009 and 2019, respectively [1]. Continuing advances in renewable energy [2] are reshaping the economic landscape of electrical power generation. Intermittent electricity produced from wind and solar, coupled to rapidly dispatchable electricity produced from natural gas, is displacing coal as a primary energy resource. Concurrently, disruptive technological developments in energy storage [3] and energy efficiency are transforming conventional paradigms in chemical processing [4], power distribution [5], commercial [6] and residential buildings [7], mining, manufacturing, agriculture, transportation [8], street lighting, and consumer products. The diverse technological advancements are collectively mitigating CO2 emissions. For instance, European coal consumption is expected [9] to decrease 87% from 2017 to 2040. Globally, carbon emissions attributed to electricity generation are forecast to peak in the 2020′s [9]. Complete elimination [10] of industrial source carbon emissions will require equivalent advances in CO2 capture. Per today, feasibility of large-scale CO2 capture is dependent upon implementation of economic disincentives [10]. However, political disparities limit geographically uniform disincentives [11]. Hence, the goals of the 2015 Paris climate accord will become more viable if new CO2 capture technologies align with, rather than against, inherent economic forces. CO2 is usually treated as a waste stream, with a substantial negative economic value, reflecting the cost of transport and permanent storage. Development of CO2 capture technology is currently proceeding on the premise that geologic CO2 storage sites will be readily available to receive CO2. As a result, CO2 capture technologies are envisioned primarily for the purpose of sequestration instead of conversion. If new technology imparts value to CO2, latent economic forces will drive implementation of large-scale CO2 capture. A technology revolution in CO2 conversion would therefore eliminate the need for a concerted global political intervention. Considering current developments in electrolysis of water to H2 and O2 [12,13] and renewable energy [9], a rethink of decarbonized process configurations is needed.
In nature, CO2 is a reactant for photosynthesis. CO2 is also a byproduct of respiration. The photosynthesis process consumes CO2 and creates carbohydrates and oxygen. Carbohydrates are stored in vegetation; subsequently, various biological processes of plant and animal life consume the carbohydrates. The natural carbon cycle regulates atmospheric CO2, and homeostasis (i.e., physiologic equilibrium) prevents unconstrained buildup of atmospheric CO2 levels. Instead, carbon is stored in a variety of condensed forms, such as carbonate rock, hydrocarbons, and natural organic matter. In this role, carbon acts as a cyclic energy carrier.
In modern industry, CO2 is primarily generated by hydrocarbon combustion, pulp production, calcination, fermentation, and iron reduction. Hydrocarbon combustion is being gradually replaced by renewable energy in the sectors of transportation and electrical power generation. As such, the focus of future technological development for CO2 mitigation must be directed towards process industries in addition to power generation and transportation. Industrial disciplines often view carbon as an energy source instead of as an energy carrier. Accordingly, industrially produced CO2 is often vented directly to the atmosphere, disrupting nature’s carbon cycle.
CO2 is a valid chemical reactant. The mildly endothermic [14] reverse water gas shift process serves to convert CO2 and H2 to CO and H2O, thereby reducing the oxidation state of the carbon. The required reactant H2 can be sourced from various water electrolysis processes driven by renewable energy. Conversion of CO2 to carboxylates [15] proceeds by reaction with Grignard reagents or organolithium compounds. Endothermic hydrogenation reduces CO2 to CH4. Electro-catalytic conversion of carbon dioxide to form methane or methanol proceeds at transition metal surfaces [16]. In general, Power-to-X (PTX) concepts involve production of chemicals by use of green hydrogen as an intermediate [17,18,19]. Hence, multiple synthetic pathways exist to convert CO2 to chemical products or chemical feedstock components [20]. Ambitions for synthetic CO2 conversion typically target production of intermediates (e.g., CO, urea, and methanol) or final products such as polymers, carbonates, or synthetic fuels. Biological conversion of CO2 targets production of food and fuel. The carbon capture, utilization, and storage (CCUS) discipline often treats CO2 generating processes, CO2 capture processes, and CO2 conversion processes as separate and distinct processes. We show that unifying these processes provides substantial utility in heat integration, mass utilization, separation efficiency, and versatility in harmonizing various sub-process timescales. These processing benefits are essential to overcoming the substantial economic barriers that currently prevent industrial CO2 utilization.

2. Economic Trends

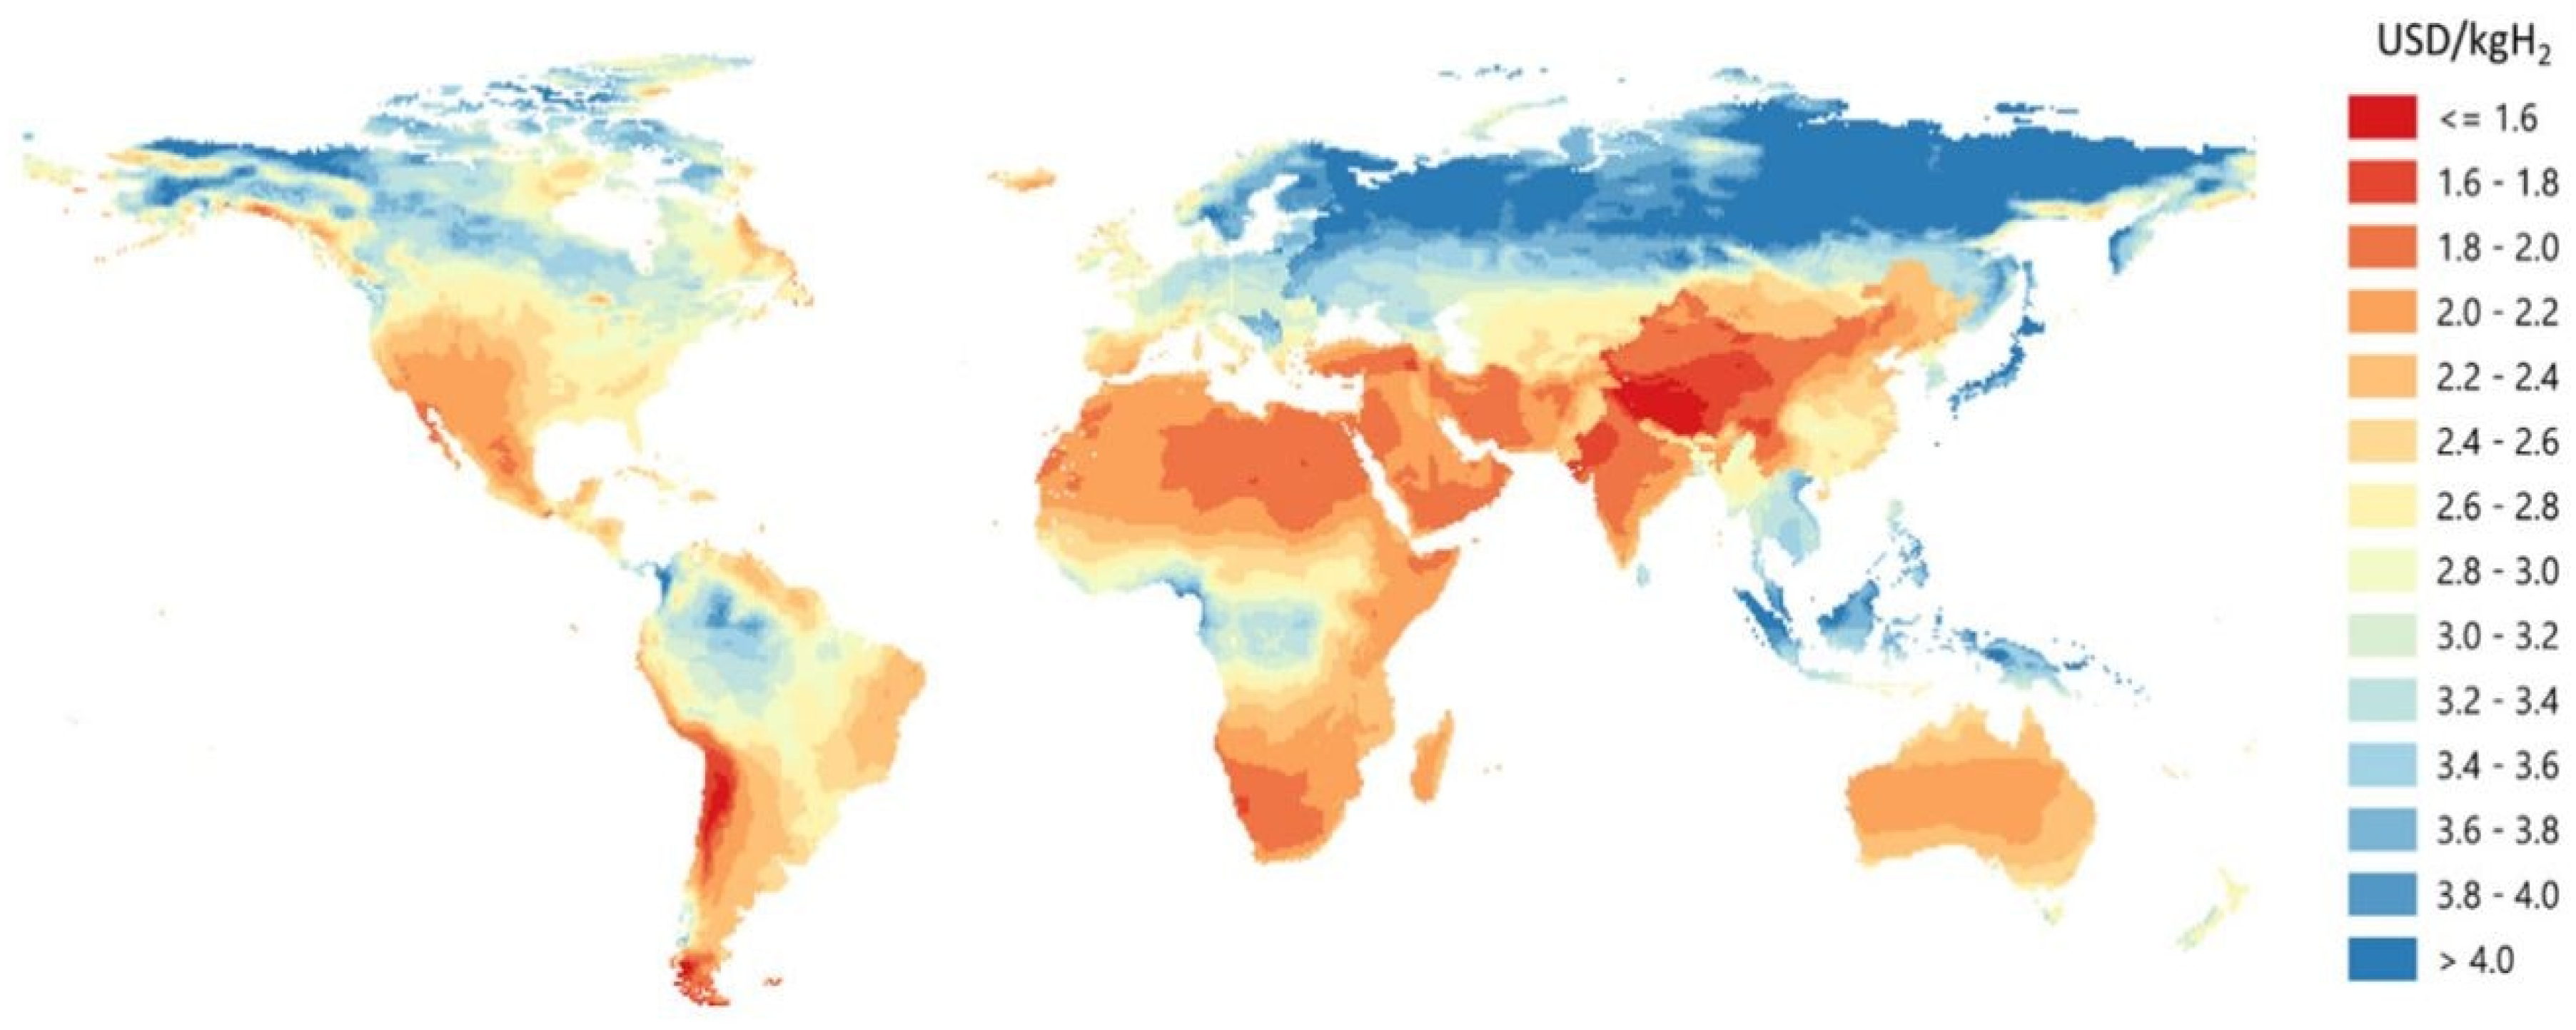
2.1. Renewable Energy

A 2019 assessment report from Bloomberg New Energy Finance (BNEF) forecasts that the levelized cost of a representative photovoltaic (PV) plant will fall 63% from 2019 to 2050 to around USD 25/MWh, meaning that PV becomes substantially cheap everywhere [21]. This trend will carry considerable consequences for the energy sector. Specifically, the displacement of fossil fuels as a primary energy resource will accelerate, and CO2 capture and utilization will become economically attractive because of inexpensive energy. Similarly, wind energy production cost prognoses follow a sharp downward trajectory. From 2009 to 2019, LCOE from wind energy has dropped by 70% [1]. The BNEF report [21] forecasts that from 2019 to 2050, levelized wind energy production costs are forecast to drop by 48% to approximately USD 30/MWh, reinforcing the overall reduction trend in renewable energy production costs.
Photovoltaic solar cells provide remarkably efficient conversion of solar energy to electric energy. Advances in semiconducting materials continue to drive efficiency improvements and cost reductions in photovoltaic panels [22]. As of July 2020, three manufacturers have announced solar panels, expected to reach high volume production, with efficiencies of ~22% [23]. Specifically, solar panels produced by Rec Solar, LG, and Sunfire offer efficiencies of 21.7%, 21.7%, and 22.6%, respectively [24].
Figure 1 shows the near-term hydrogen production cost versus electricity price [25]. With the price of renewable electricity between 30 to 40 USD/MWh in the long-term, H2 production cost would be between 2 to 3.5 USD/kg H2, which is promising. The CapEx for electrolyzer is assumed to be 900 USD/kWe. The full load hours (FLH) of about 4000 h and two different electrolyzer capacity factors of 30% and 70% are considered [25]. Negative electricity prices reflect local intermittent excess production (extrapolated from the original data). Intermittent renewable energy will become inexpensive and abundant, triggering transformations of the energy and industrial sectors. Availability of inexpensive intermittent energy will increase the inherent value of low-energy-density feedstocks, including CO2.
Electrical power generation from renewable resources is becoming more economically competitive with hydrocarbon resources. Figure 2 shows the unsubsidized levelized cost of electricity (LCOE) produced from various sources including solar, wind, gas-combined cycle, and gas peaker power plants. The economic price of electricity produced from solar sources and wind sources decreased by 89% and 70%, respectively, from 2009 to 2019. The ongoing trend of electricity cost reduction is forecast to continue well into the future, supporting usage of green hydrogen as a viable energy carrier. Because of the ongoing declining economic cost trend, hydrogen will be able to be produced economically in several regions of the world with abundant solar and wind resources (Figure 3). In geographic regions with abundant renewable energy and scarce hydrocarbon resources, local production of synthetic hydrocarbons will be favored over import of hydrocarbons.
Hydrogen production from renewable energy resources is currently considered expensive. Analysis by the International Energy Agency (IEA) projects that overall economic costs of producing H2 from renewable energy sources will decrease by 30% from 2019 to 2030 because of the declining economic costs associated with generating renewable energy as well as H2 production scale-up efficiencies [25].

2.2. Electrolysis

A consequence of the coming shift to renewable energy sources will be increased availability of excess electrical energy, corresponding to an increased global market share of wind and solar energy. Generation of excess wind and solar energy occurs on an intermittent, stochastic basis. The excess production is partially predictable, especially on daily, weekly, or yearly cycles. Localized, intermittent over-production stands to become a permanent feature of wind and solar energy generation. Regional spot markets establish the economic value of electrical energy. When power production exceeds consumption within a defined market, spot prices decrease to balance supply and demand. Periods of excess production often yield negative electricity spot prices. On a stochastic and intermittent basis, excess energy is available to industrial consumers at negligible cost. For instance, on windy nights in continental Europe, industrial energy consumers often earn money by receiving excess energy from regional wind power farms. Substantial scientific research focuses on exploiting excess energy for CO2 conversion [20,26,27,28,29]. Currently, the productivity, selectivity, and efficiency of direct catalytic CO2 conversion is insufficient for industrial applications. Conventional CO2 reduction reactions, such as RWGS, remain promising for industrial-scale CO2 conversion.
Hydrogen is a clean energy carrier with potential to displace fossil fuels in several sectors, such as transportation. Electrolysis is suitable to produce H2 from stochastic, intermittent energy sources. Proton exchange membrane (PEM) units for H2 production can ramp up operations in seconds, in rapid response to changes in energy spot prices. On a mass basis, H2 provides an ideal medium for maximizing the quantity of energy stored in a transportable gas and requires only compression to ensure reliable short-term supply. Electrolysis also produces O2. This essential coproduct can be simultaneously used in diverse processes that require O2 of high purity.
According to a 2014 report to the FCH JU public private EU partnership, the energy efficiency [13] of PEM electrolysis units is forecast to surpass 80% by 2030. In addition, capital costs of PEM electrolysis units are expected to decrease 50% by 2030. The advent of inexpensive and abundant wind and solar energy, driving efficient electrolysis processes, enables intermittent production of H2 and O2, supplying intermediate chemical energy storage in the form of compressed gases. In the past, unviable economics prevented large-scale CO2 conversion processes. The advent of abundant renewable energy improves the near-term economic prospects of CO2 conversion in industrial processes.

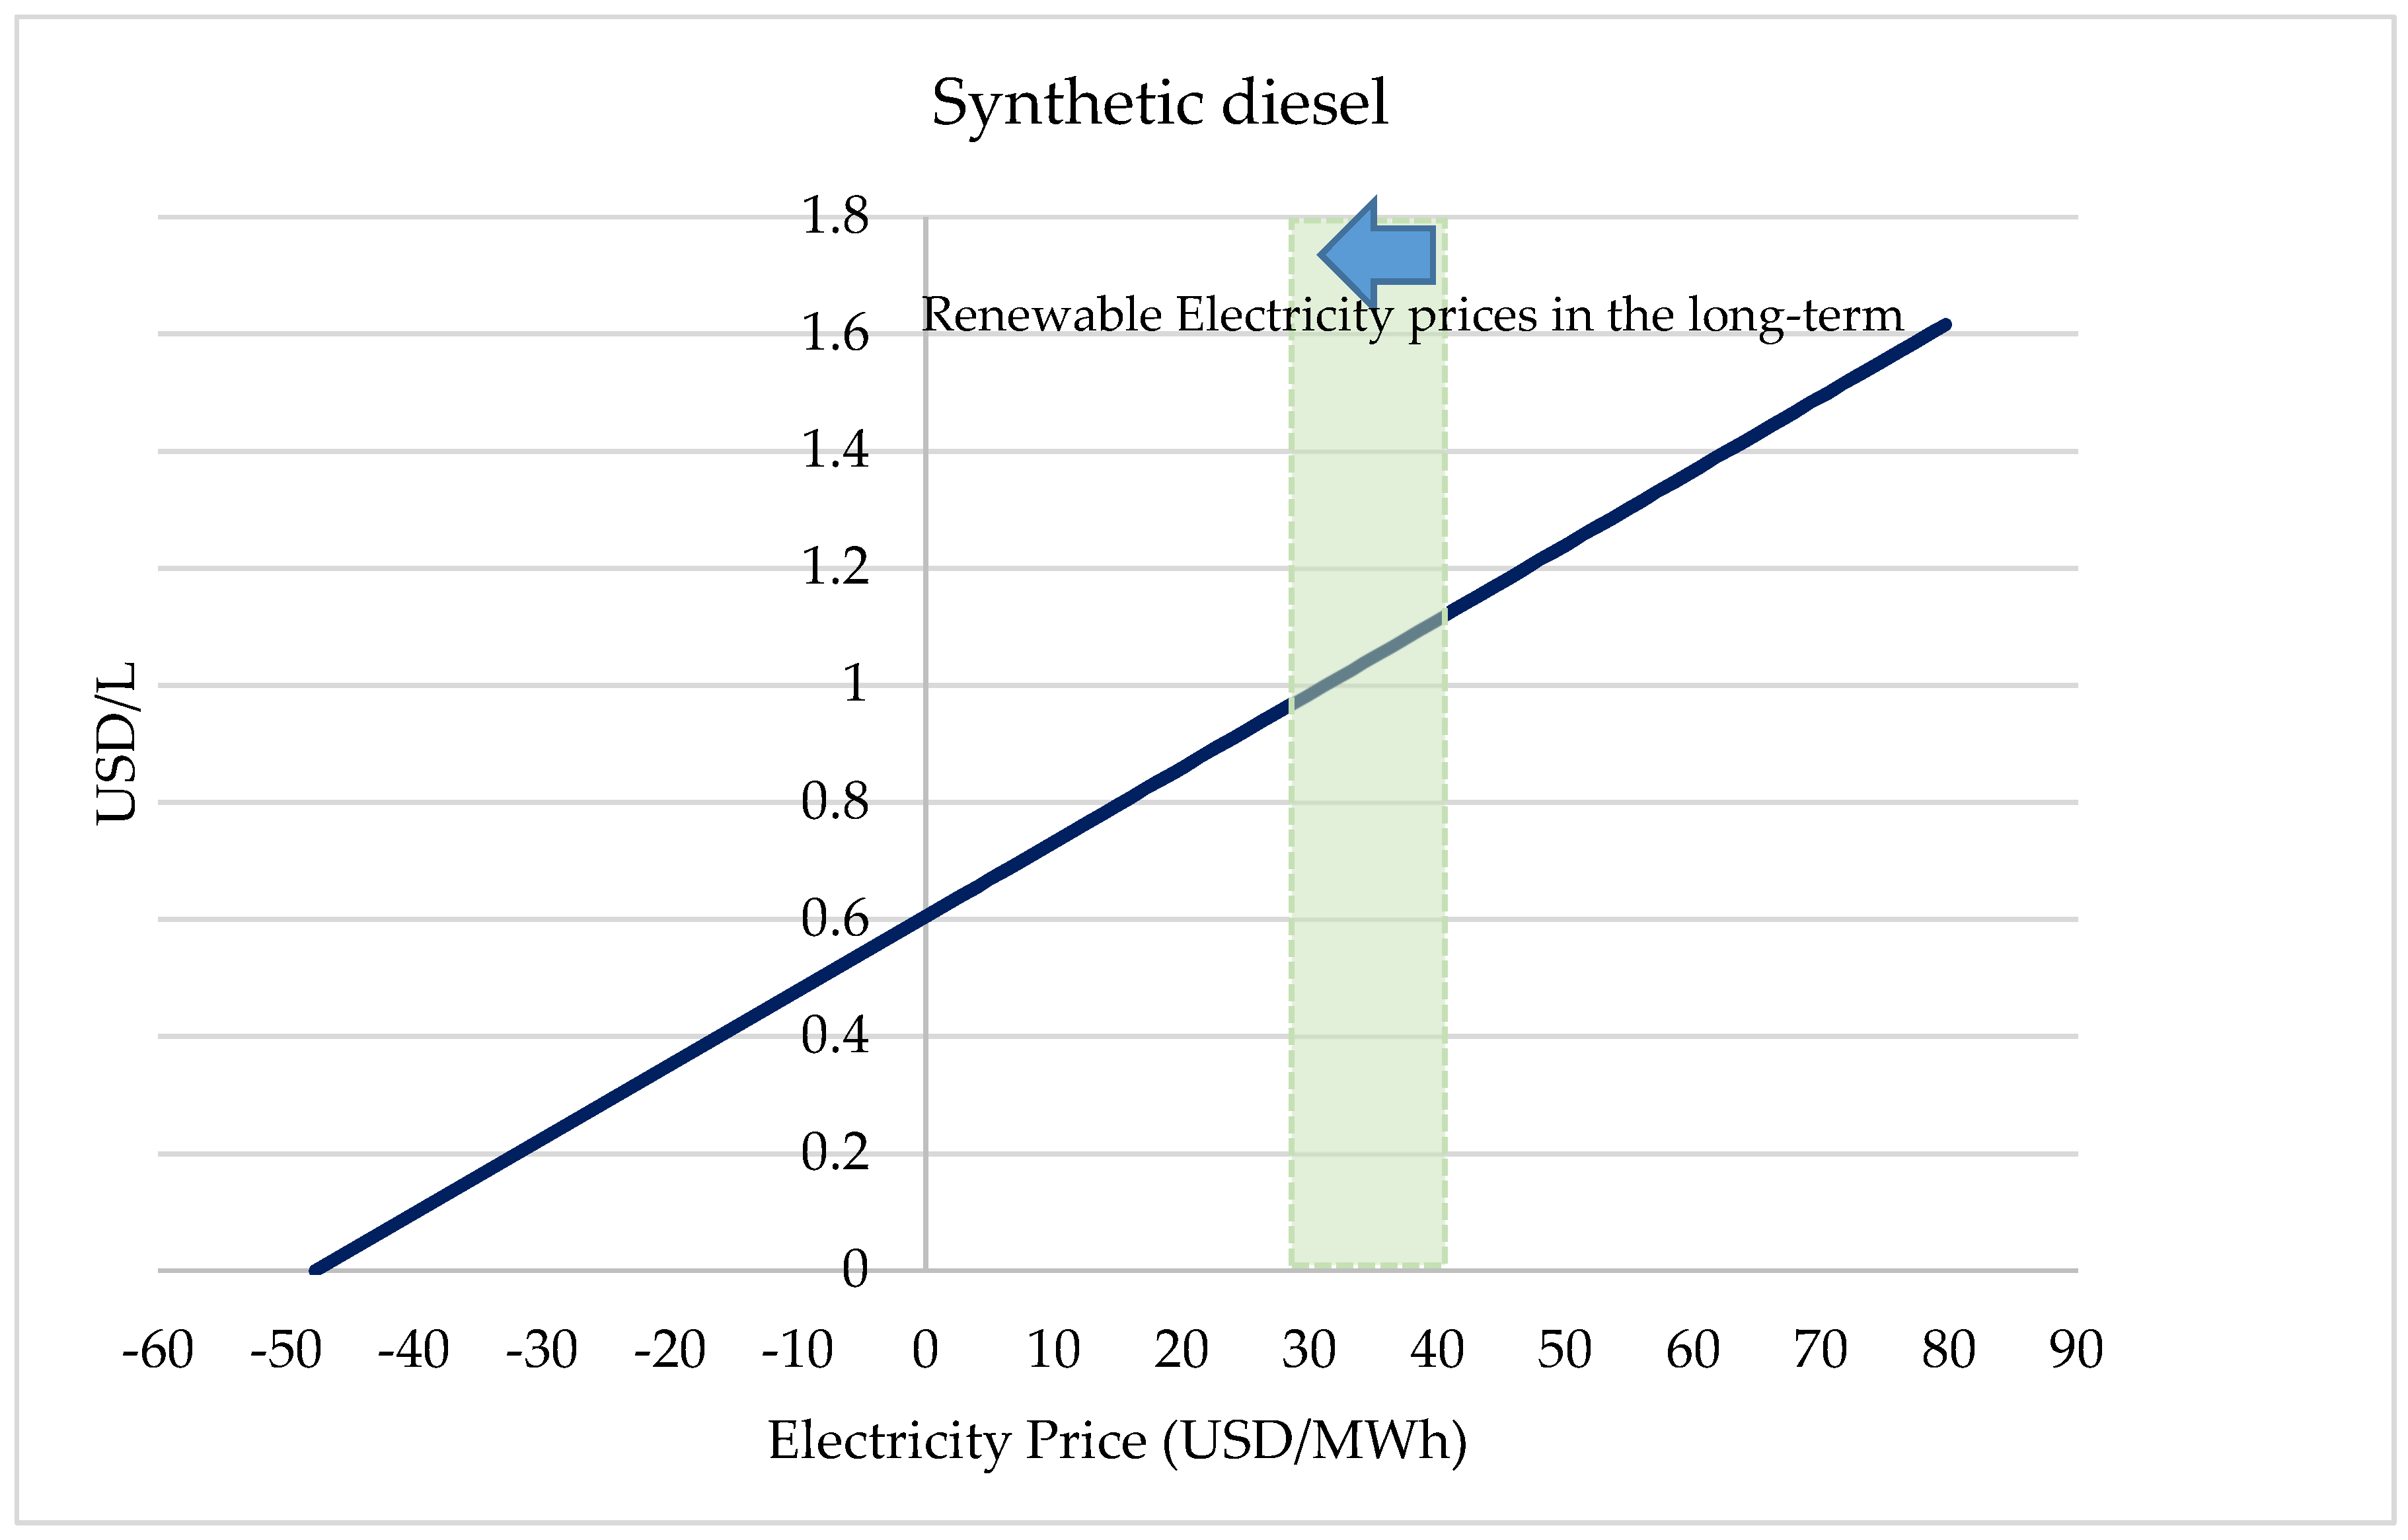
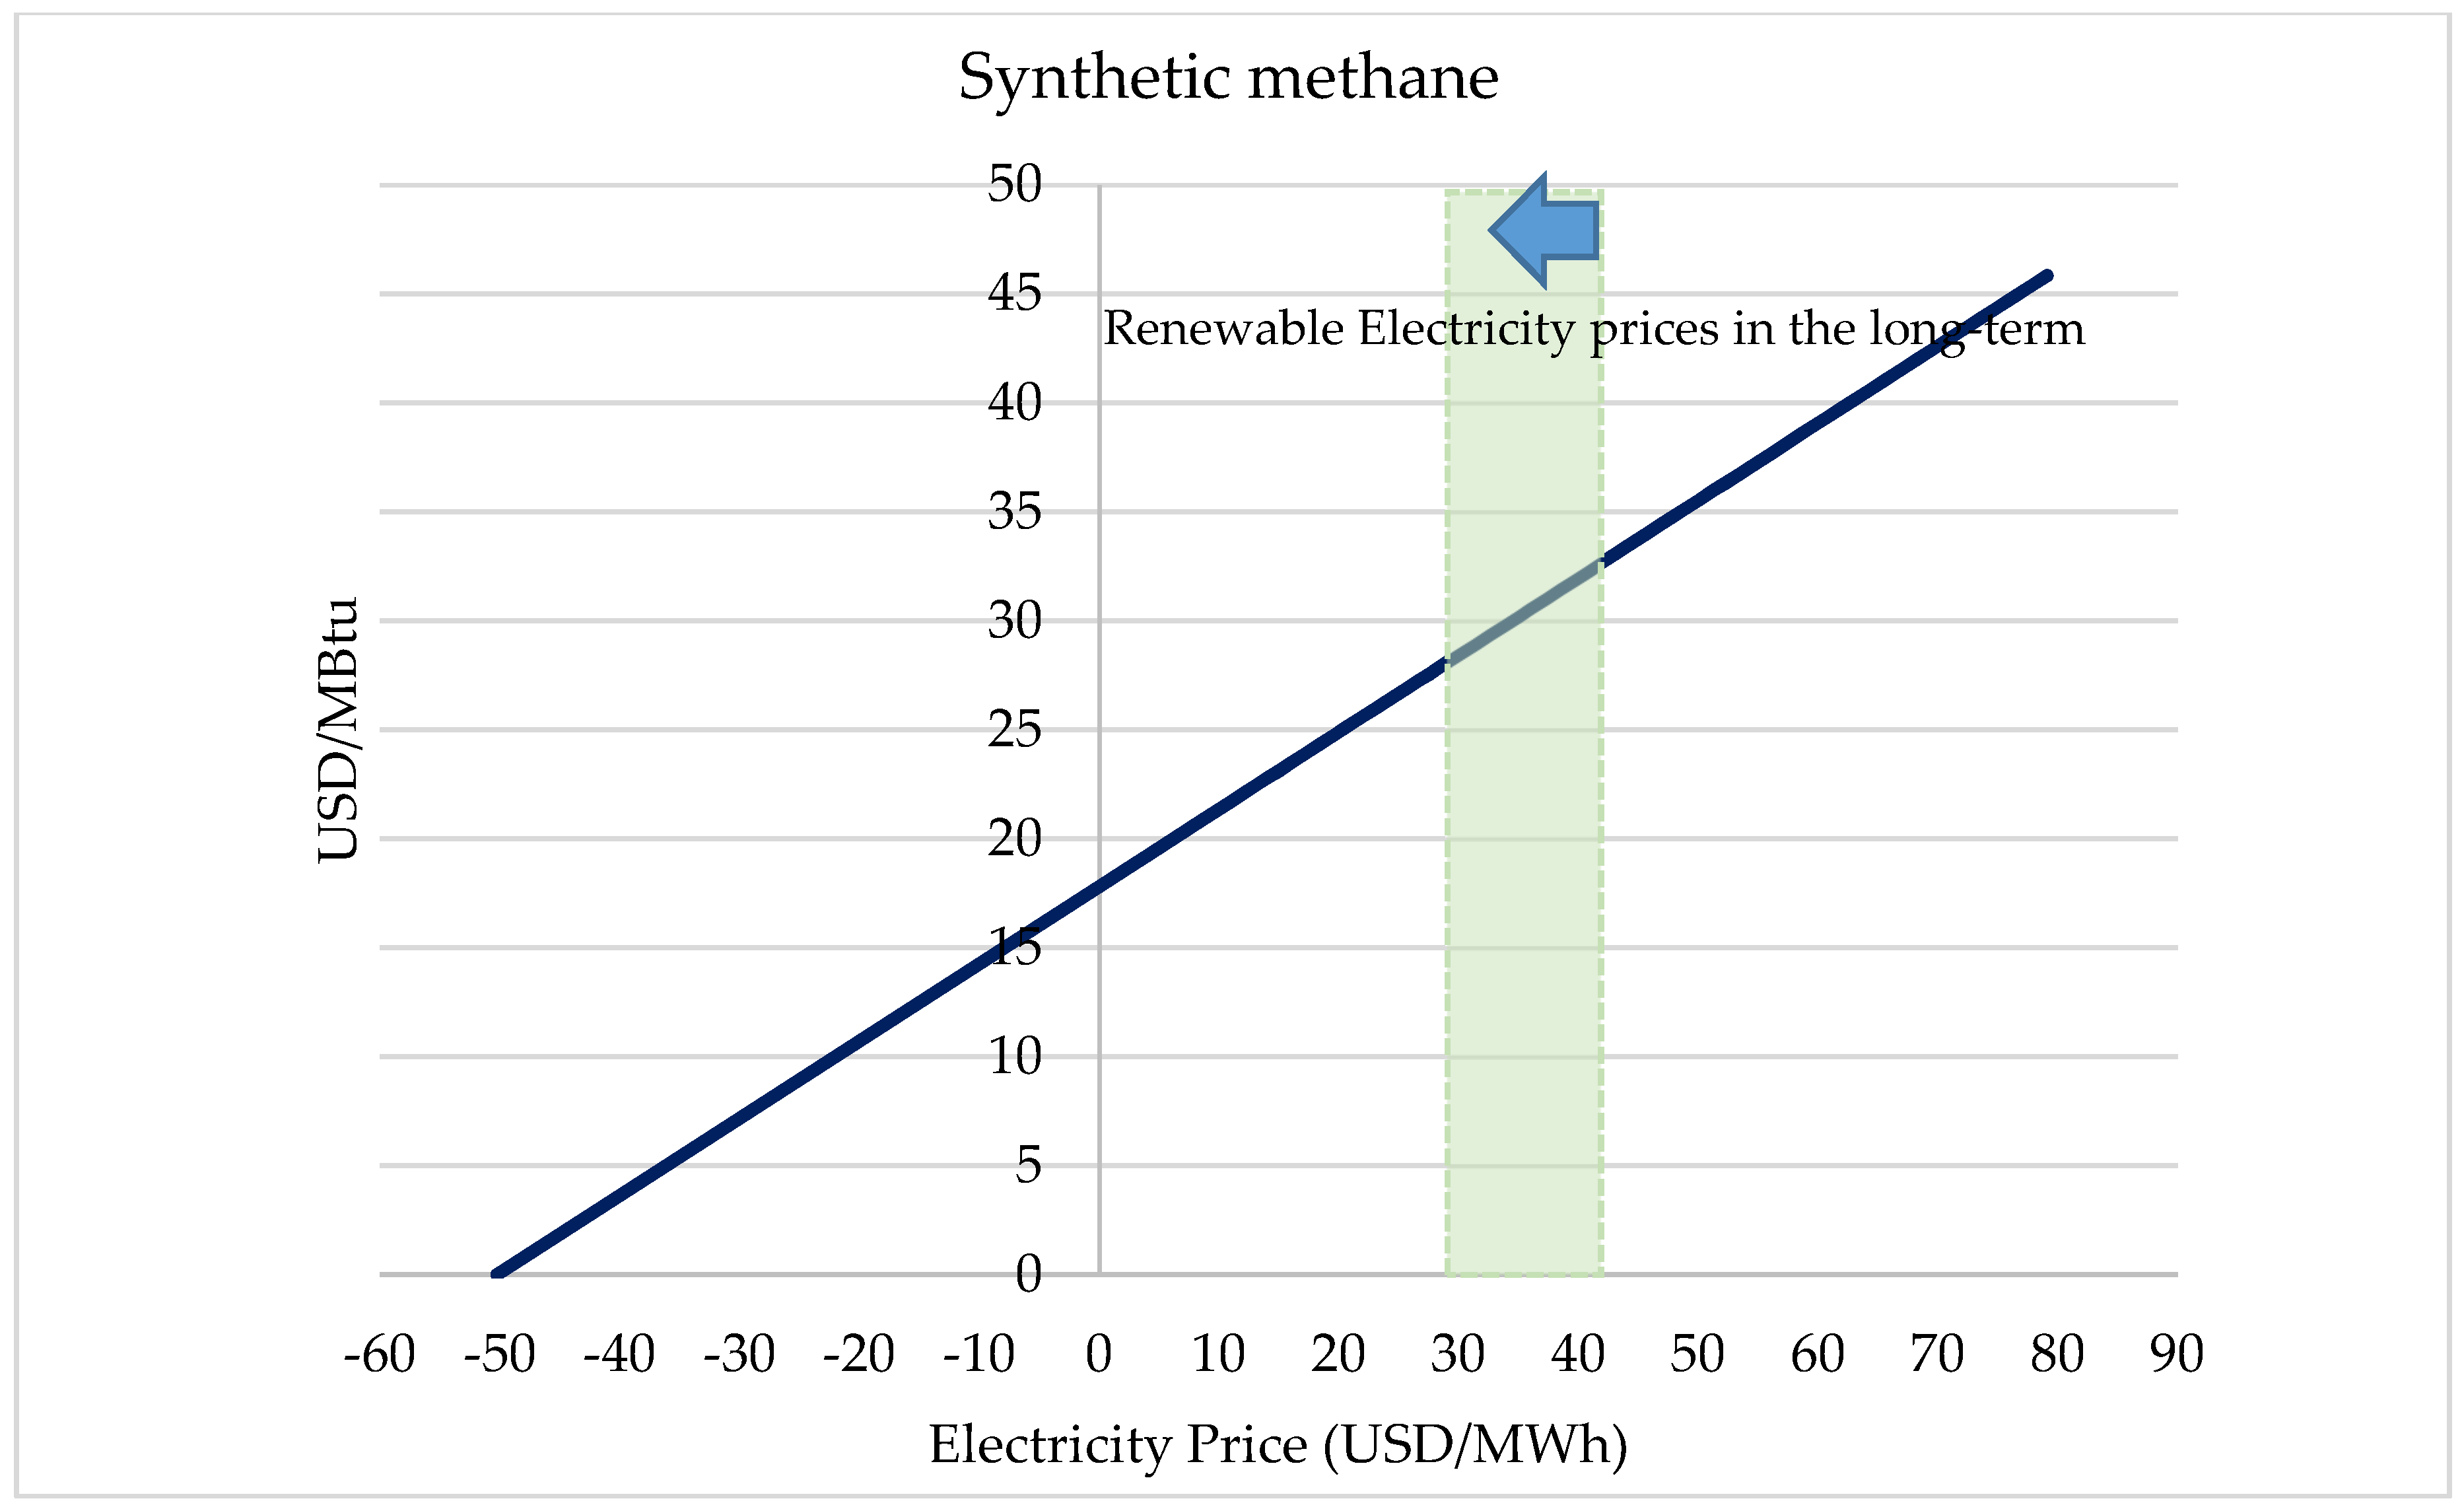
2.3. CO2 Conversion Economics

Innovative companies such as Nordic Blue Crude [30] and Sunfire [31] are planning to build commercial plants to produce Fischer–Tropsch liquid fuels from CO2 and green H2. A substantial portion of production costs for CO2-based synthetic FT fuels derives from CO2 capture costs, which in traditional processes involves the use of amines (chemical solvents), or Selexol (physical solvents).
The IEA (2019) reports long-term costs of synthetic diesel and synthetic methane production, including processing costs for CO2 capture, transport, and storage [25]. The parameters and underlying assumptions for methanation and synthetic fuel production are shown in Table 1. All costs are in USD (2017). Synthetic diesel production cost is shown in Figure 4. The monthly average diesel price in July 2020 in the United States was about 0.64 USD/L [32]. This figure highlights the significance of electricity price on the finished product. These technologies will become more economical as the price of renewable electricity falls. The same is true with the synthetic methane production (Figure 5). The monthly average Henry Hub natural gas price in June 2020 was 1.6 USD/MBtu [33].

3. Process Integration Framework

Historically, the high expense of producing CO2-free hydrogen barred viable green CO2 conversion. Today, hydrogen production occurs predominantly by steam methane reforming of natural gas, cogenerating CO2, while H2 produced via electrolysis accounts for only 4% of global H2 production [34]. However, continuing advances in electrolysis, coupled with inexpensive renewable energy, will enable a near-term revolution in green H2 production and CO2 utilization. Figure 6 depicts our proposed conceptual framework of integrated CO/CO2 production and conversion in various heavy industries, including a centrally located reverse water gas shift (RWGS) reactor. Water/steam electrolyzers generate H2 and O2. When O2 originating from electrolysis is used as an oxidant for iron reduction, municipal solid waste incineration, biomass gasification, calcination, black liquor combustion and biogas upgrading, inert components (primarily N2 from air) are excluded from feedstock reactant streams. Availability of O2 for these processes negates the need for a costly Air Separation Unit (ASU) [35]. The produced CO/CO2 streams are diluted with H2O. In case of high H2O concentrations, subsequent water separation may be obtained via cooling and condensation. As such, high concentration CO2 is available for further chemical conversion. By supplying H2 from a compressed H2 storage tank and reacting with CO2 in an RWGS reactor, syngas (CO and H2) is generated. Mildly endothermic RWGS reaction requires high temperatures (around 1000 °C). The RWGS reactor is thermally integrated within this framework as shown in Figure 6. Syngas is a valuable commodity for chemical processing and is a precursor for the industrial production of synthetic fuels via Fischer–Tropsch reaction, methanol production, methanation, etc. Using this concept, CO2, which is otherwise considered an unwanted byproduct, is a precursor to valuable commodity production, such as synthetic fuel. By adopting an overall system view of the proposed integrated scheme (Figure 6) without requiring expensive membranes or amine processes for CO2 separation, the CO2 feedstock cost for synthetic fuel production can be considered negligible when coupled to low-cost green hydrogen. Hence, the absence of dedicated economic costs for CO2 capture substantially improves the economics and overall feasibility of an integrated concept.
The specific process chemistries of calcination, incineration, gasification, iron reduction, fermentation, and pulp production permit thermal and component (i.e., H2 and O2) integration. Calcination produces CO2 from solid calcium carbonate (CaCO3). Carbonate-derived CO2 mixes with combustion products in the calcination kiln. Elimination of inert reagent gases limits reaction products to CO2 and water, facilitating inexpensive CO2 capture by water condensation. Concurrently, electrolysis-produced H2 drives CO2 conversion to FT liquid products, methane, or methanol. Intermediate gas storage enables continuous calcination and synthetic liquid production, optimizing process efficiency.
In the iron industry, conventional blast furnaces use pre-heated air as an oxidant to convert solid carbon (coke) to CO, facilitating iron reduction. Operation of blast furnaces with pure O2 instead of heated air, combined with top gas separation, eliminates inert N2 from the smelting process, enabling low-cost CO2 separation. Recycling unconverted CO to the blast furnace enables economic coke utilization, minimizing CO2 generation. Electrolysis-fed oxygen blast furnaces produce CO2, which together with H2 enables synthetic liquid fuel production. In the direct reduction of iron (DRI), mixtures of H2 and CO, derived from natural gas reforming, serve as a reducing gas. Use of H2 as a reducing agent establishes a less endothermic process [36], improving the energy efficiency of the blasting furnace. Products of DRI are H2O and CO2, enabling economic CO2 separation and concurrent synthetic fuel production.
In the pulp and paper industry, post-boiling concentrated black liquor (containing of an aqueous solution of approximately 68 wt% solids including lignin residue, various hemicelluloses, and other inorganic products originating from the Kraft process [37]) is typically combusted in air. However, in a new integrated approach, black liquor combustion is performed using oxygen gas originating from the electrolyzer, avoiding the presence of nitrogen in the combustion chamber. As such, the products of black liquor combustion in oxygen are primarily steam and CO2. Subsequently, the CO2 may be efficiently captured via water condensation and subsequently used as a reactant in synthetic fuel production. Another product of black liquor combustion in the recovery boiler is green liquor, which is a dissolved smelt containing sodium carbonate, sodium sulfide, colloidal iron sulfide, and other products of the combustion process. Green liquor is subjected to a causticizing process in a slaker tank together with lime (CaO) in order to regenerate white liquor to drive the Kraft process of converting wood to pulp [37]. In a new integrated process configuration, any available excess oxygen may be utilized in an oxygen bleaching process for the pulp, in conjunction with an alkali, in order to partially remove residual lignin after pulp cooking.
In the fermentation industry, metabolic glucose conversion produces high-purity CO2 and ethanol in an oxygen-sparse environment [38]. Breweries typically recover CO2 for use in beverage carbonation and food preservation. Industrial ethanol production proceeds by fermentation of corn, sugarcane, sorghum, and grapes. Fermentation-produced CO2 is highly pure, facilitating simplified CO2 capture, with minimal mass exchange, for subsequent production of synthetic liquid hydrocarbons.

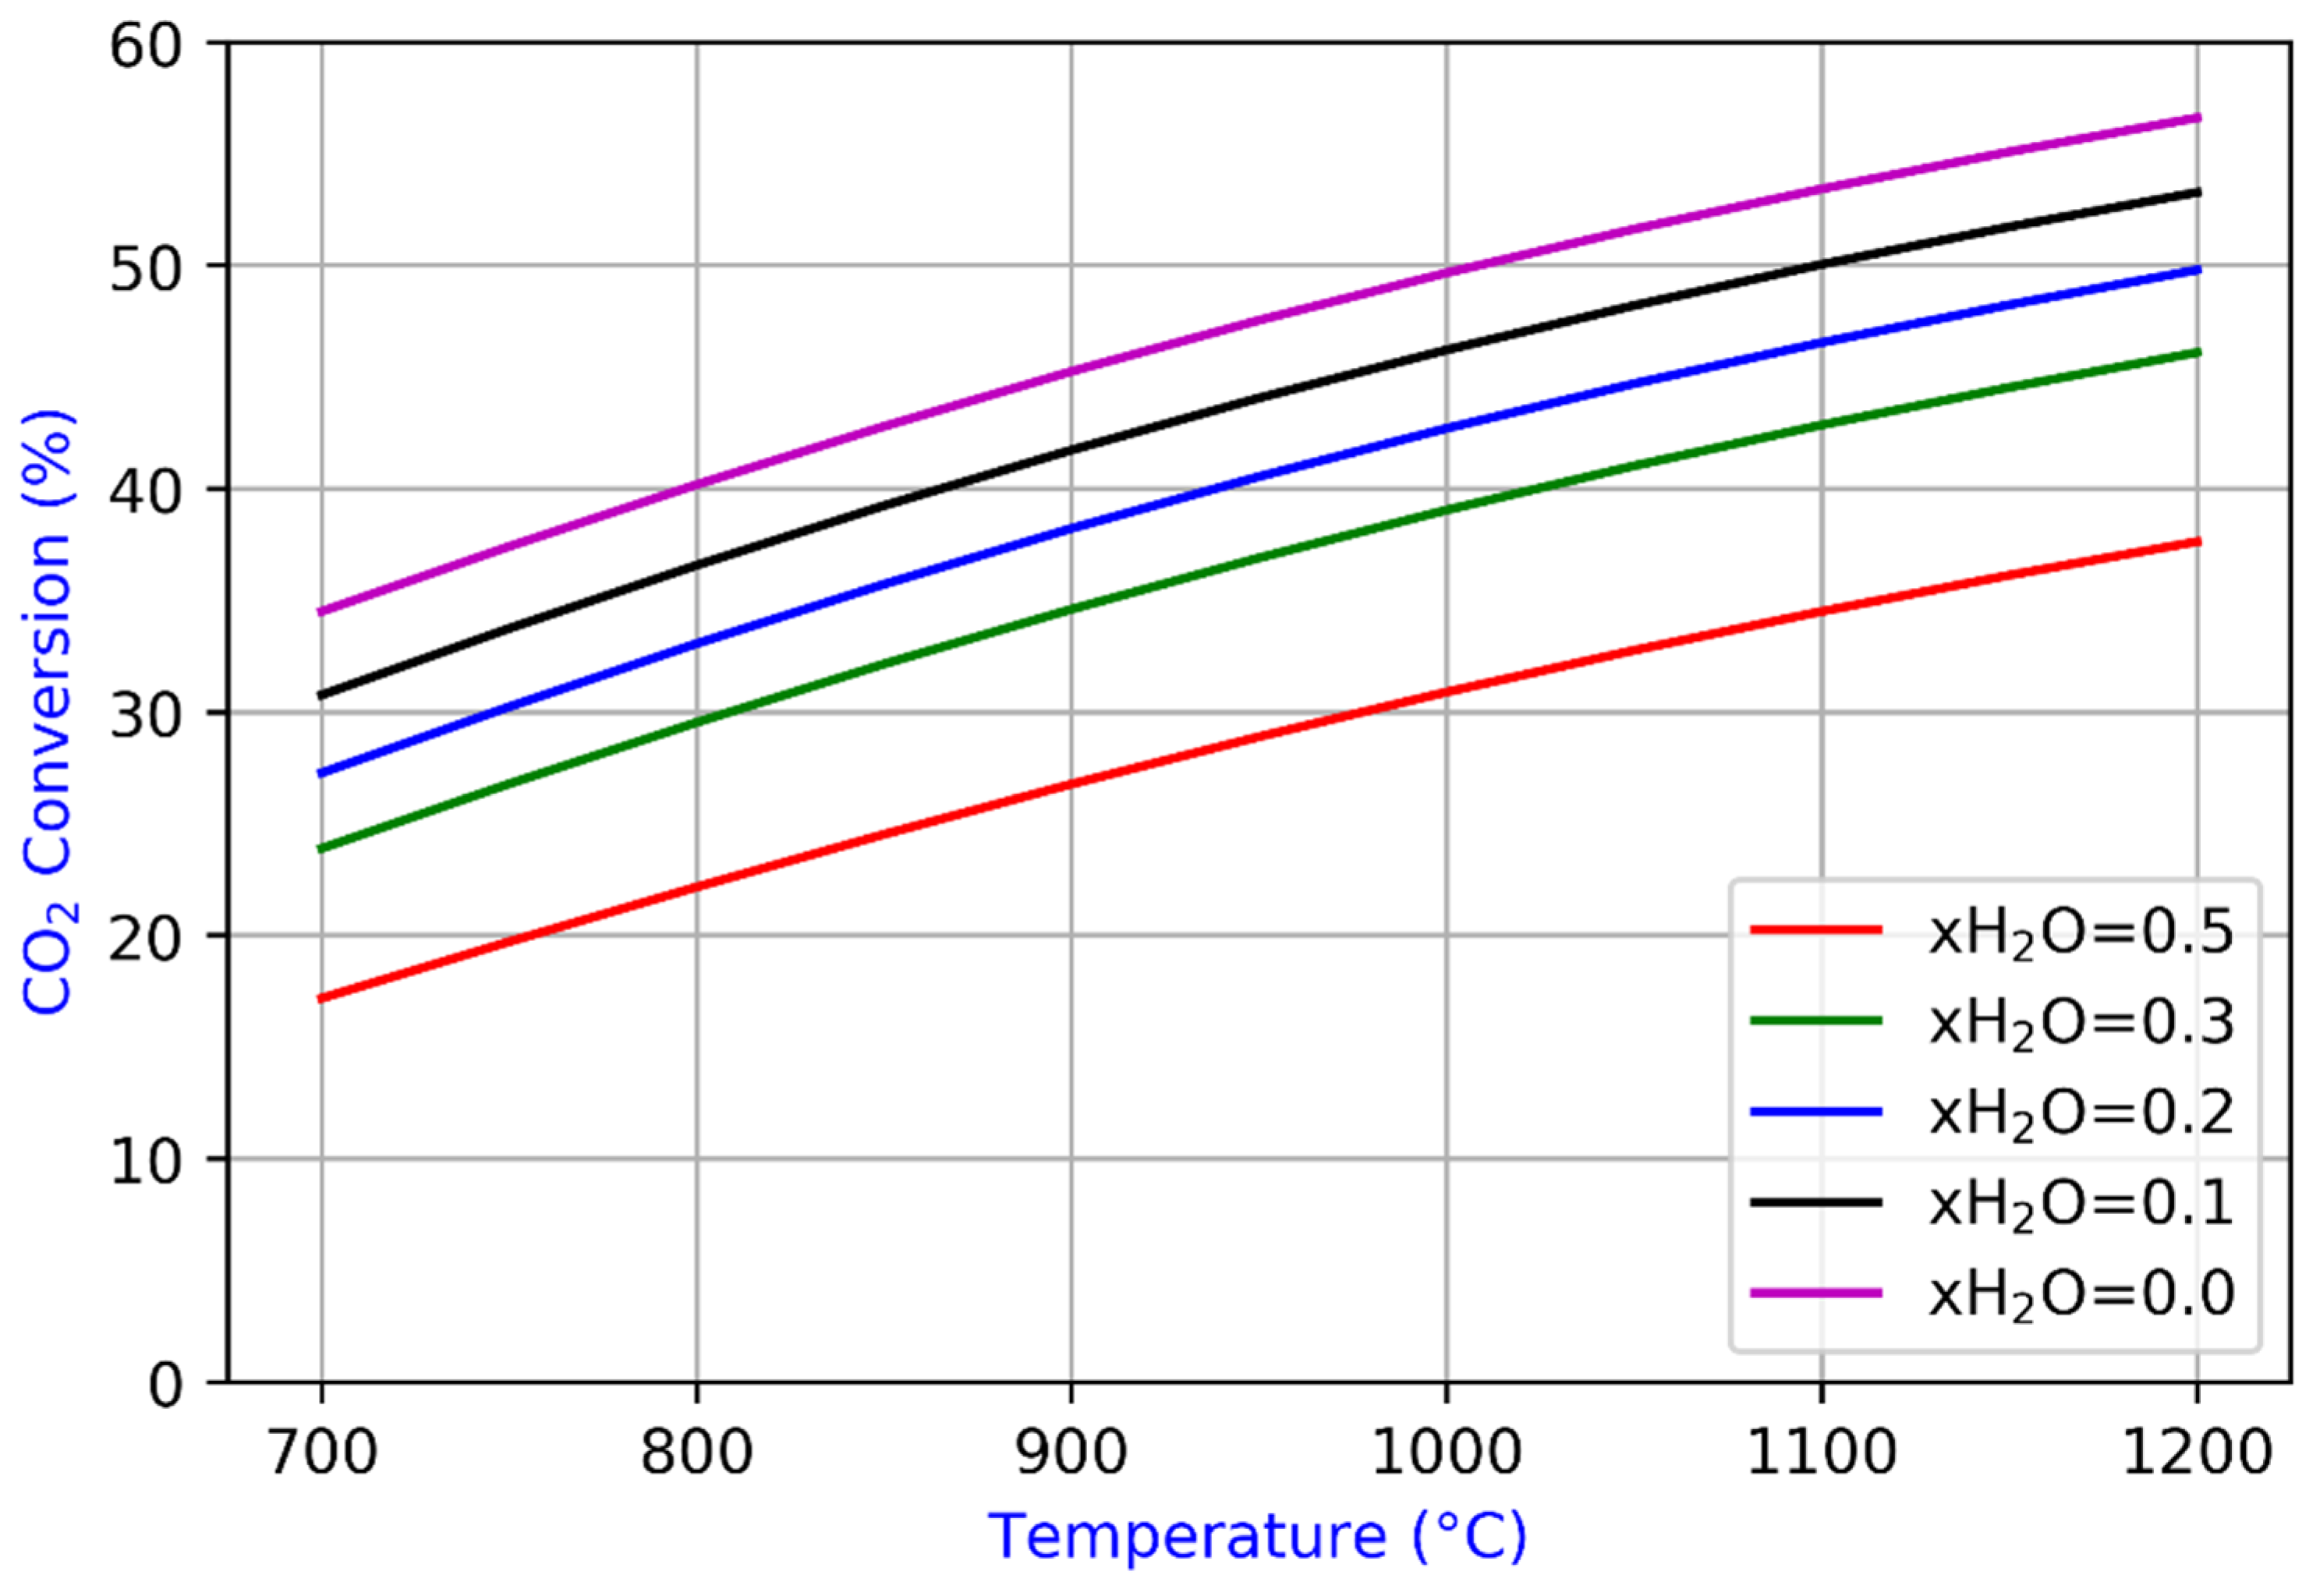
3.1. Reverse Water Gas Shift (RWGS)

At the center of the proposed integration is the RWGS reactor which converts produced CO2 and green H2 to H2O and CO.
CO 2 + H 2 CO + H 2 O
RWGS is an equilibrium reaction and can proceed with or without catalyst. In order to investigate the effects of H2O concentration and temperature on the equilibrium, a case study is performed in Aspen HYSYS V10. A stand-alone equilibrium type reactor is used which means the reaction proceeds to equilibrium. An essential operating assumption is made that the volume of the reactor is sufficiently large to attain thermodynamic equilibrium. Equimolar inlet flows of CO2 and H2 are specified, and only the inlet molar flow of H2O to RWGS is varied, which also alters the inlet molar fractions of CO2 and H2. Figure 7 shows CO2 conversion versus temperature and water concentration. Molar fraction of H2O (denoted by xH2O) varies between 0 and 0.5. Because of the endothermic nature of this reaction, higher temperature results in increased CO2 conversion while higher H2O concentration results in the opposite. In all processes mentioned in Figure 6, except fermentation which does not involve high temperatures, RWGS can be effectively thermally integrated with the remaining process components to lower the external energy requirements. As suggested by Hillestad et al. [39], RWGS reactor can be placed within the gasifier or incinerator to increase CO2 conversion as a result of the increased temperature. High temperature conditions are essential for the reaction kinetics, as it reduces the residence time required to attain equilibrium. This has implication on the required volume for the RWGS reactor. For instance, the RWGS reactor volume required to reach equilibrium decreases 6-fold by simply increasing the RWGS reactor temperature from 1100 °C to 1200 °C [39].

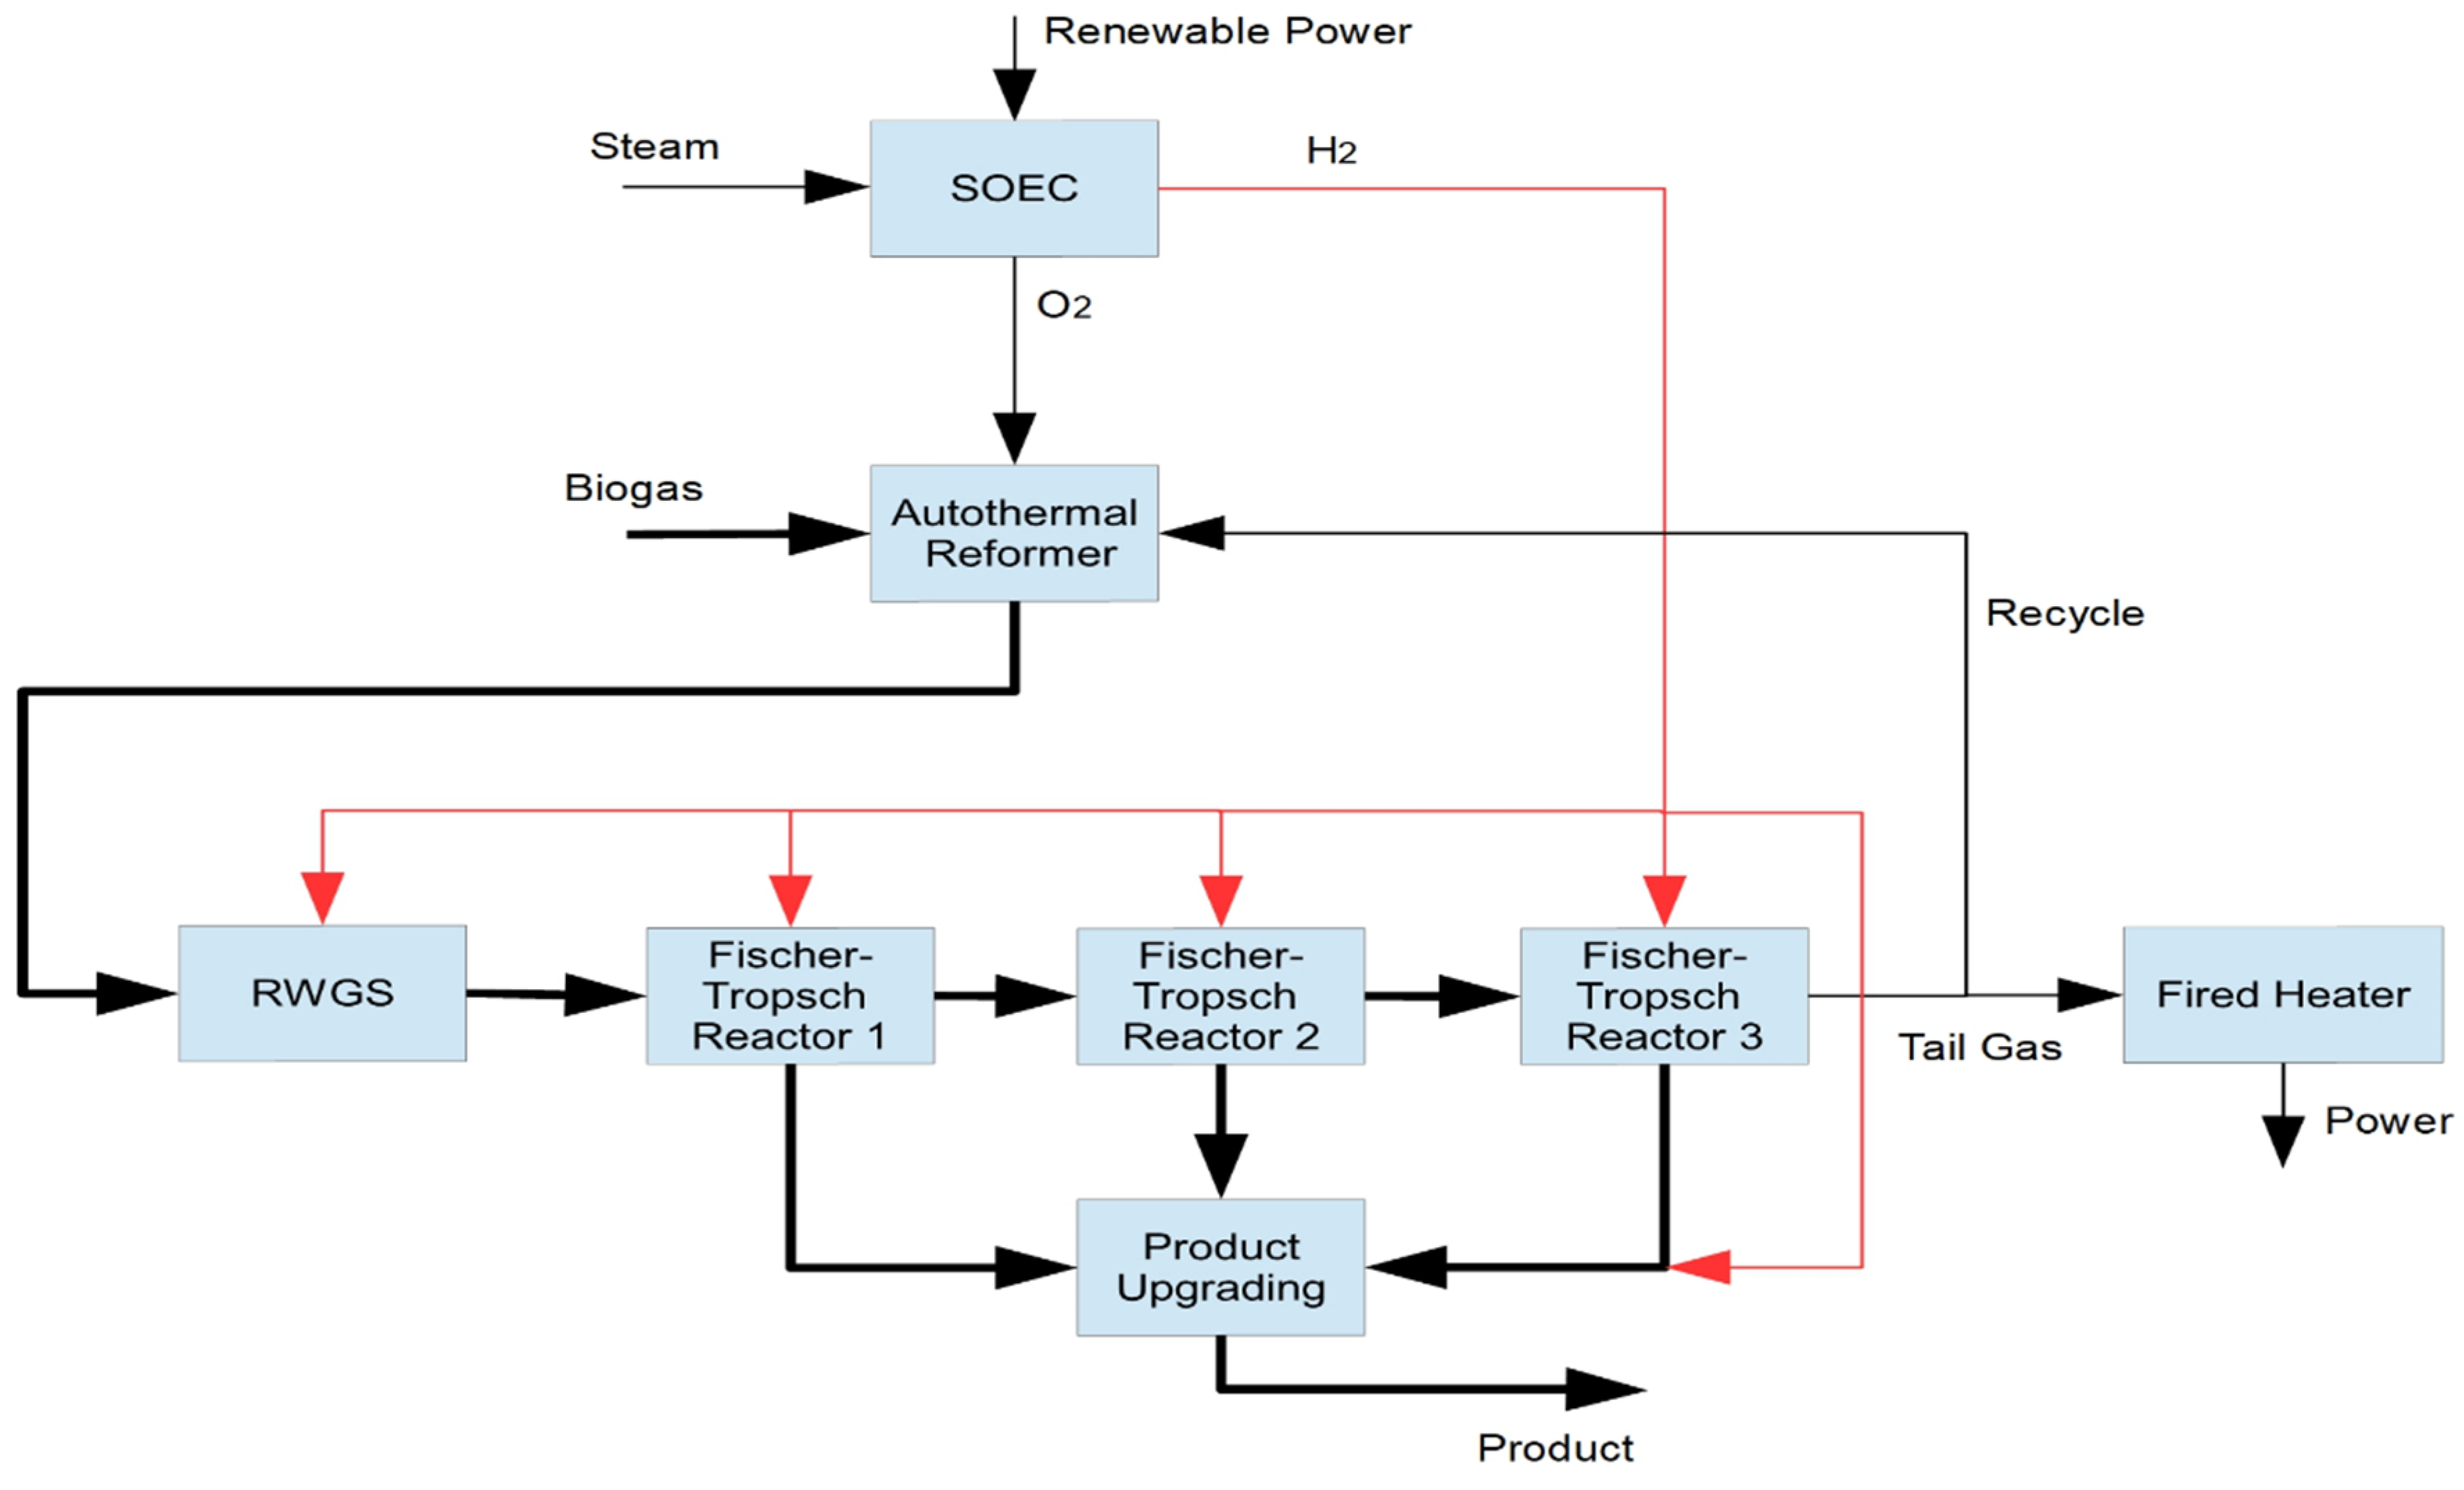
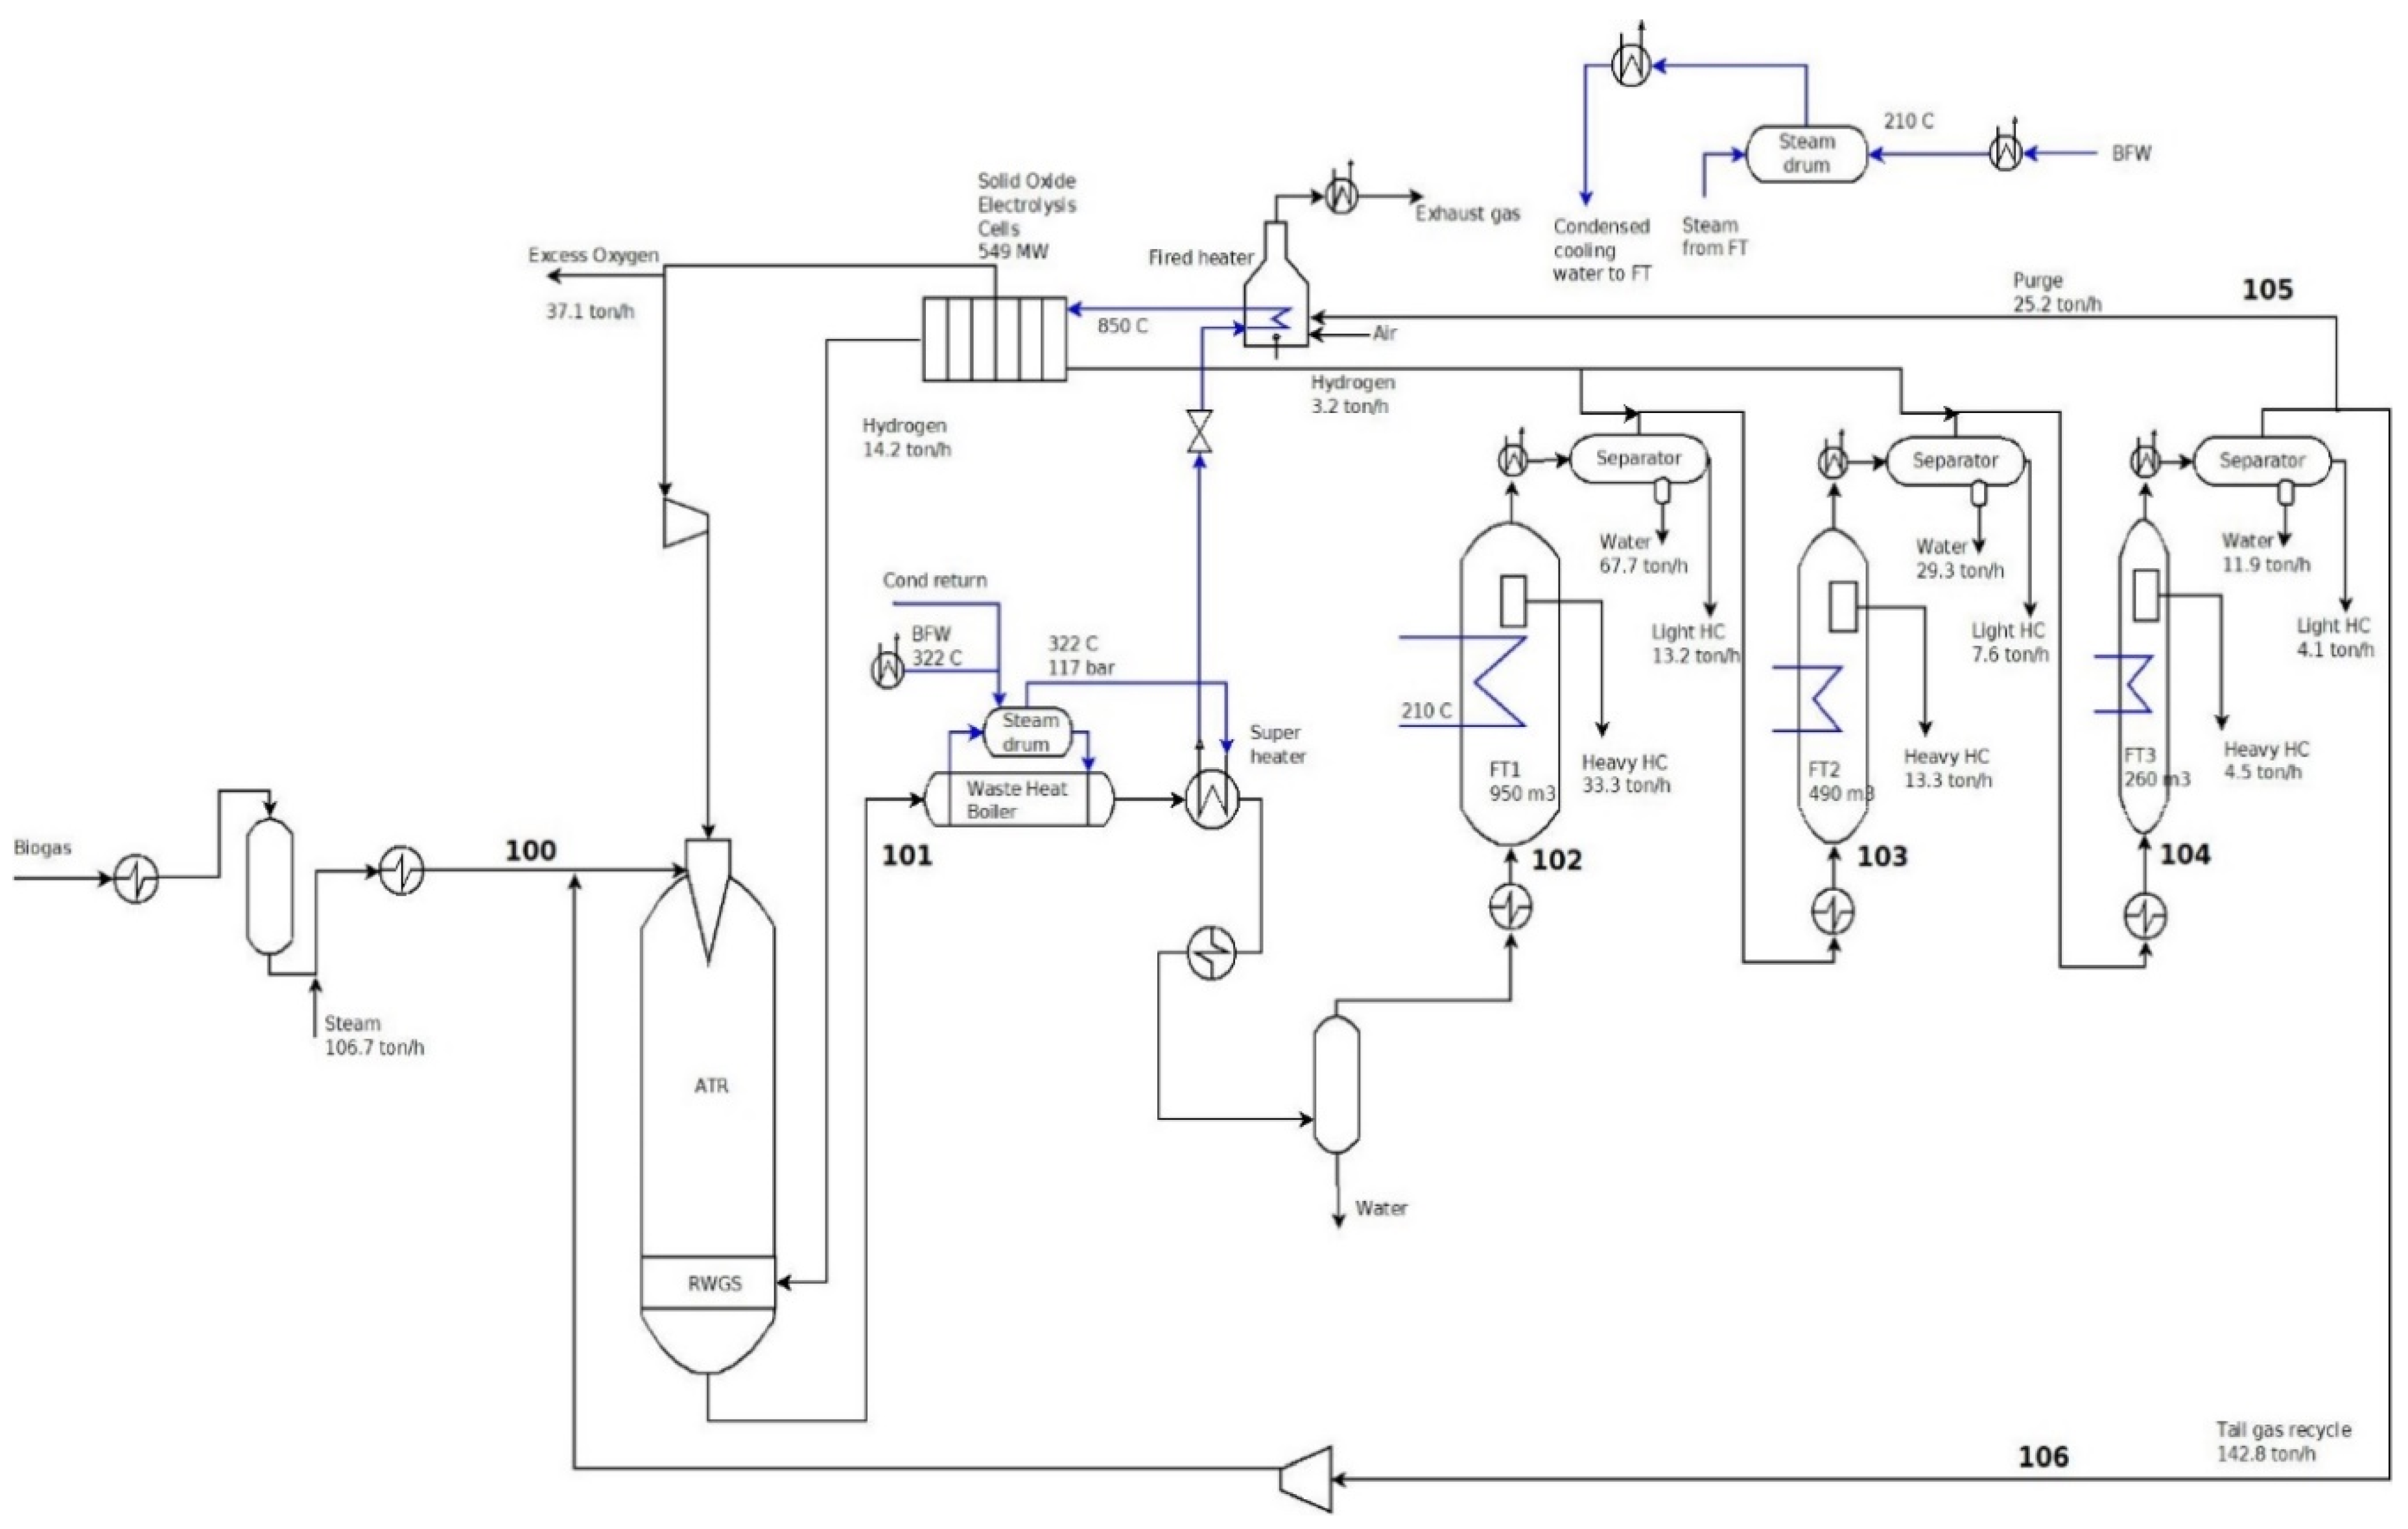
3.2. Example Pathway: Biogas to Liquid Process

The commercial software Aspen HYSYS® V10 was used to simulate the biogas-to-liquid process. Because of a need to implement detailed stoichiometry models and detailed kinetic models for the current study, the Fischer–Tropsch reaction processes were not simulated using modules bundled within the Aspen HYSYS® software. Instead, MATLAB CAPE-OPEN unit operation [40] was implemented within Aspen HYSYS® to simulate the Fischer–Tropsch processes.
Application of our proposed concept in Figure 6 was previously demonstrated for the case of Biomass to Liquids (BTL) [39]. It was shown that sourcing hydrogen from renewable energy can affect an increase in the overall carbon efficiency of a Biomass to Liquid process from 38 percent to over 90 percent. Hence, the produced fuel quantity may be elevated by a factor of 2.4 using an identical amount of biomass material. To further demonstrate the applicability of this concept, another pathway is analyzed, namely the case of biogas upgrading in order to produce liquid synthetic fuel through a Fischer–Tropsch process. Use of biogas for fuel production is investigated in the literature [41,42,43]. With the integration framework given in Figure 6, a novel process design for upgrading of biogas is currently proposed.
On molar basis, biogas is composed of approximately 40% CO2, with the remaining components comprising primarily CH4. CO2 is a greenhouse gas and lacks a heating value, therefore must be removed or converted to saleable products. Fuel produced from upgraded biogas is an archetypical carbon neutral fuel, provided that the conversion process minimizes CO2 emissions. On a mass basis, biomass and biogas have a similar energy density (around 20 MJ/kg). Therefore, the results are expected to be comparable to Hillestad et al. [39]. Figure 8 shows a block diagram of our process. The biogas flow rate is 6000 kmol/h and is pressurized to 40 bar. The biogas comprises 60% methane and 40% CO2 and is assumed to have passed through a desulfurization bed prior to entering the plant. The biogas stream is heated from a temperature of 50 °C to a temperature of 500 °C before entering the autothermal reformer (ATR). Steam is added to the ATR to achieve a ratio of steam to carbon (S/C) value of 0.6 in ATR, appropriate for the cocking potential in the ATR. Solid Oxide Electrolysis Cell (SOEC) is used as an electrolyzer to split steam to make H2 and O2. Although this type of electrolyzer is at its development stage, the advantage of replacing a portion of the energy requirement for steam electrolysis in the form of heat makes this type of electrolysis suitable for biogas upgrading. The simulation model for the SOEC is a single stage adiabatic cell; the associated conversion value is 80%. O2 from SOEC is added to maintain the ATR temperature at 1050 °C. Use of pure O2 enables recycling of a majority of the tail gas, thereby improving the carbon efficiency of the process [35].
Reformed biogas exiting the ATR contains about 16% CO2. In order to convert CO2 to syngas, a RWGS reactor is used. The RWGS reactor is assumed to be thermally integrated into the ATR, mainly for better heat utilization. After the RWGS, high temperature reactive syngas is quenched in a waste heat boiler to a temperature condition in which the syngas is chemically stable. The released heat is further utilized to generate high pressure steam. Specifically, water is evaporated at a pressure of 117 bar and at a temperature of 322 °C. The steam is subsequently heated to a temperature of 730 °C. SOEC is unable to tolerate a pressure value of 117 bar. Hence, a reduction value is implemented to reduce the process pressure to a value of 40 bar [39]. The process steam is subsequently heated to a temperature condition of 850 °C using a fired heater, prior to entering the SOEC. Fifteen percent of tail gas from FT reactors is sent to fired heater, providing heat for the SOEC and avoiding accumulation of inert species. The CO2 conversion in RWGS is 23% in this case. The reverse shifted syngas is cooled to separate H2O and then reheated prior to entering the FT reactors. In the FT section, 3 FT stages are used with product cooling and inter-separation between stages to increase production of heavy hydrocarbons [44]. In the current investigation, a continuous stirred tank reactor model is used to simulate the slurry bubble-column Fischer–Tropsch reactor. Table 2 shows the various design parameters of the Fischer–Tropsch stages. Complete back-mixing is assumed in the slurry reactors. Hence, the composition of the exit gas is identical to the composition throughout the volume of the individual reactors. The slurry reactors provide outstanding heat removal and are also scalable [44]. Other reactor types such as fixed bed reactor and microchannel reactor may also be considered [45].
At each stage, the Fischer–Tropsch reactor volume provides a CO conversion of approximately 55%, yielding a summative once-through conversion value of 90%. Furthermore, an identical H2/CO ratio value of 1.8 is prescribed at the inlet of each individual Fischer–Tropsch reactor. The ratio of H2/CO is an essential parameter in FT synthesis processes. Heavy hydrocarbon production is promoted at low values of the H2/CO ratio. However, low values of the H2/CO ratio serve to reduce the overall production rate [46]. Hence, a production trade-off exists between optimizing to process selectivity towards producing heavy hydrocarbon components and establishing a maximum rate of production. Therefore, the selected H2/CO ratio may be suboptimal and is therefore subject to further optimization. The H2 quantity provided as reactant to the RWGS is prescribed to attain the specified molar H2/CO ratio (i.e., 1.8) at the inlet to FT reactor train. This operational mode has been shown to elevate the overall carbon efficiency of the process [39].
The ATR and RWGS reactor are simulated as equilibrium reactors by minimizing the Gibbs free energy. The reactor volumes are therefore sufficient to ensure thermodynamic equilibrium. The syngas pressure is at approximately 37 bar at the inlet to the first Fischer–Tropsch reactor. The syngas temperature is prescribed to be 210 °C at the inlet of all Fischer–Tropsch reactors. Details of Fischer–Tropsch reactor simulations are provided in Hillestad et al. [39]. The SOEC is simulated by a conversion reactor and a component splitter [39]. Figure 9 shows a detailed flow diagram of the process. Temperature specifications and pressure specifications are labelled on essential streams. Mass flow specifications and stream composition specifications, labelled via bold text tag numbers as shown in Figure 9, are provided in Table 3.
The simulation framework is subject to further optimization. Parametric optimization may increase the profitability of the process [47], based on the location-specific and economy-specific process component parameters, including CapEx and OpEx values.
The overall results for the biogas to FT liquid are shown in Table 4. In total, 88% of inlet carbon entering the plant is converted into saleable products, establishing a carbon efficiency of 88%. By considering an FT liquid density of 800 kg/m3, the required electric power for biogas to liquid process is around 5.78 kWh per liter of syncrude. In order to identify the inefficient portions of the process (thermodynamically), the process currently shown in Figure 9 may be subject to further exergy analysis [48].
The integrated framework is subject to further thermal integration. Figure 10 shows the heating and cooling requirements for the biogas-to-liquid process shown in Figure 9. The minimum temperature difference to generate the composite curves is considered to be 10 °C. There is excess heat available in the process (466 MW) mainly at temperatures below 210 °C, including high temperature steam at 210 °C from FT reactor cooling (266 MW) which can be used for thermal integration within the process. There is need for about 45 MW of high temperature heat, which is rather small compared to the external heating requirement. Increasing the purge stream which is fired in the fired heater satisfies that need.

4. Conclusions

A process integration framework is proposed which couples the renewable power to chemical industries such as iron reduction, gasification, calcination, pulp production, biogas upgrading, and fermentation. O2 and H2 generated from electrolysis are used in these processes which reduces the quantity of inert components (such as N2) in the process streams. This eases the separation and conversion of resultant CO2 to fuels (synthetic hydrocarbons, methanol, methane). Such a design strategy facilitates effective heat integration, mass exchange, intermittent energy exploitation, and CO2 separation by water condensation. Moreover, the intermittency of renewables is harmonized by storing oxygen and hydrogen. In this framework, there is no need for membrane or solvent for CO2 separation. The applicability of this framework is demonstrated for the biogas to Fischer–Tropsch liquid fuel pathway. It is shown that more than 88% of carbon in biogas ends up in the product. The required electric power for FT production from biogas is around 5.78 kWh per liter of syncrude. With the falling trend in renewable power costs, this scheme will become increasingly viable in the years to come.

Author Contributions

Conceptualization, M.O., K.G.P., S.R.-F., L.E.Ø., F.M., and M.H.; methodology, M.O., K.G.P., S.R.-F., L.E.Ø., F.M., and M.H.; writing—original draft preparation, M.O., K.G.P., S.R.-F., L.E.Ø., F.M., and M.H.; writing—review and editing, M.O., K.G.P., S.R.-F., L.E.Ø., F.M., and M.H.; visualization, M.O., K.G.P., S.R.-F., L.E.Ø., F.M., and M.H. All authors have read and agreed to the published version of the manuscript.

Funding

This research received no external funding.

Conflicts of Interest

The authors declare no conflict of interest.

Abbreviations

ASUAir Separation Unit
ATRAutothermal Reformer
BNEFBloomberg New Energy Finance
CapExCapital Expenditure
DRIDirect Reduction of Iron
FLHFull Load Hours
IEAInternational Energy Agency
LCOELevelized Cost of Electricity
LHVLower Heating Value
MBtuMillion British thermal units
OpExOperating Expenditure
PEMPolymer-Electrolyte Membrane or alternatively Proton-Exchange Membrane
PVPhotovoltaics
RWGSReverse Water Gas Shift
SOECSolid Oxide Electrolyser Cell

References

  1. Ray, D. Lazard ’s Levelized Cost of Energy Analysis—Version 13.0; Lazard: New York, NY, USA, 2019. [Google Scholar]
  2. Mitchell, C. Momentum is increasing towards a flexible electricity system based on renewables. Nat. Energy 2016, 1, 15030. [Google Scholar] [CrossRef]
  3. Fumagalli, E. Energy investment: The many lives of energy storage. Nat. Energy 2016, 1, 16096. [Google Scholar] [CrossRef]
  4. Song, C. Global challenges and strategies for control, conversion and utilization of CO2 for sustainable development involving energy, catalysis, adsorption and chemical processing. Catal. Today 2006, 115, 2–32. [Google Scholar] [CrossRef]
  5. Jamasb, T. Electricity storage: Friend or foe of the networks? Nat. Energy 2017, 2, 17092. [Google Scholar] [CrossRef]
  6. Asensio, O.I.; Delmas, M.A. The effectiveness of US energy efficiency building labels. Nat. Energy 2017, 2, 17033. [Google Scholar] [CrossRef]
  7. Hittinger, E. Distributed generation: Residential storage comes at a cost. Nat. Energy 2017, 2, 17006. [Google Scholar] [CrossRef]
  8. Needell, Z.A.; McNerney, J.; Chang, M.T.; Trancik, J.E. Potential for widespread electrification of personal vehicle travel in the United States. Nat. Energy 2016, 1, 16112. [Google Scholar] [CrossRef]
  9. New Energy Outlook 2017; Bloomberg New Energy Finance: New York, NY, USA, 2017.
  10. Ottmar Edenhofer, E.A. Climate Change 2014: Mitigation of Climate Change Technical Summary; Cambridge University Press: Cambridge, UK, 2015. [Google Scholar]
  11. Clémençon, R. The Two Sides of the Paris Climate Agreement:Dismal Failure or Historic Breakthrough? J. Environ. Dev. 2016, 25, 3–24. [Google Scholar] [CrossRef] [Green Version]
  12. Tymoczko, J.; Calle-Vallejo, F.; Schuhmann, W.; Bandarenka, A.S. Making the hydrogen evolution reaction in polymer electrolyte membrane electrolysers even faster. Nat. Commun. 2016, 7, 10990. [Google Scholar]
  13. Bertuccioli, L.; Chan, A.; Hart, D.; Lehner, F.; Madden, B.; Standen, E. Study on Development of Water Electrolysis in the EU; Fuel Cells and Hydrogen Joint Undertaking; E4tech Sàrl: Lausanne, Switzerland, 2014. [Google Scholar]
  14. Bustamante, F.; Enick, R.M.; Cugini, A.; Killmeyer, R.P.; Howard, B.H.; Rothenberger, K.S.; Ciocco, M.V.; Morreale, B.D.; Chattopadhyay, S.; Shi, S. High-temperature kinetics of the homogeneous reverse water–gas shift reaction. AIChE J. 2004, 50, 1028–1041. [Google Scholar] [CrossRef]
  15. Correa, A.; Martín, R. Metal-Catalyzed Carboxylation of Organometallic Reagents with Carbon Dioxide. Angew. Chem. Int. Ed. 2009, 48, 6201–6204. [Google Scholar]
  16. Kuhl, K.P.; Hatsukade, T.; Cave, E.R.; Abram, D.N.; Kibsgaard, J.; Jaramillo, T.F. Electrocatalytic Conversion of Carbon Dioxide to Methane and Methanol on Transition Metal Surfaces. J. Am. Chem. Soc. 2014, 136, 14107–14113. [Google Scholar] [CrossRef] [PubMed]
  17. Rego de Vasconcelos, B.; Lavoie, J.-M. Recent Advances in Power-to-X Technology for the Production of Fuels and Chemicals. Front. Chem. 2019, 7. [Google Scholar] [CrossRef] [Green Version]
  18. Schmidt, P.; Batteiger, V.; Roth, A.; Weindorf, W.; Raksha, T. Power-to-Liquids as Renewable Fuel Option for Aviation: A Review. Chem. Ing. Tech. 2018, 90, 127–140. [Google Scholar]
  19. Dieterich, V.; Buttler, A.; Hanel, A.; Spliethoff, H.; Fendt, S. Power-to-liquid via synthesis of methanol, DME or Fischer–Tropsch-fuels: A review. Energy Environ. Sci. 2020. [Google Scholar] [CrossRef]
  20. Rafiee, A.; Khalilpour, K.R.; Milani, D.; Panahi, M. Trends in CO2 conversion and utilization: A review from process systems perspective. J. Environ. Chem. Eng. 2018, 6, 5771–5794. [Google Scholar] [CrossRef]
  21. New Energy Outlook 2019; Bloomberg New Energy Finance: New York, NY, USA, 2019.
  22. Green, M.A. Commercial progress and challenges for photovoltaics. Nat. Energy 2016, 1, 15015. [Google Scholar]
  23. Svarc, J. Most Efficient Solar Panels 2020; Clean Energy Reviews: Dulwich Hill, Australia, 2020. [Google Scholar]
  24. Most Efficient Solar Panels. 2020. Available online: https://www.cleanenergyreviews.info/blog/most-efficient-solar-panels (accessed on 3 September 2020).
  25. IEA. The Future of Hydrogen; IEA: Paris, France, 2019. [Google Scholar]
  26. Blanco, H.; Faaij, A. A review at the role of storage in energy systems with a focus on Power to Gas and long-term storage. Renew. Sustain. Energy Rev. 2018, 81, 1049–1086. [Google Scholar] [CrossRef]
  27. Al-Musleh, E.I.; Mallapragada, D.S.; Agrawal, R. Continuous power supply from a baseload renewable power plant. Appl. Energy 2014, 122, 83–93. [Google Scholar] [CrossRef]
  28. Gençer, E.; Al-Musleh, E.; Mallapragada, D.S.; Agrawal, R. Uninterrupted renewable power through chemical storage cycles. Curr. Opin. Chem. Eng. 2014, 5, 29–36. [Google Scholar] [CrossRef]
  29. Graves, C.R.; Ebbesen, S.D.; Mogensen, M.B.; Lackner, K.S. Sustainable hydrocarbon fuels by recycling CO2 and H2O with renewable or nuclear energy. Renew. Sustain. Energy Rev. 2011, 15, 1–23. [Google Scholar] [CrossRef]
  30. Nordic Blue Crude. 2020. Available online: https://nordicbluecrude.no/ (accessed on 3 August 2020).
  31. Sunfire. 2020. Available online: https://www.sunfire.de/ (accessed on 3 August 2020).
  32. Retail Prices or Gasoline. Available online: https://www.eia.gov/dnav/pet/hist/LeafHandler.ashx?n=pet&s=emm_epm0_pte_nus_dpg&f=m (accessed on 16 September 2020).
  33. Henry Hub Natural Gas Spot Price. Available online: https://www.eia.gov/dnav/ng/hist/rngwhhdM.htm (accessed on 3 August 2020).
  34. IRENA. Innovation Landscape Brief: Renewable Power-to-Hydrogen; International Renewable Energy Agency: Abu Dhabi, UAE, 2019. [Google Scholar]
  35. Ostadi, M.; Hillestad, M. Enriched Air or Pure Oxygen as Oxidant for Gas-to-Liquid Process with Microchannel Reactors. Chem. Eng. Technol. 2017, 40, 1946–1951. [Google Scholar] [CrossRef]
  36. Bilika, J.; Pustejovskab, P.; Brozovac, S.; Jursova, S. Efficiency of hydrogen utilization in reduction processes in ferrous metallurgy. Sci. Iran. 2013, 20, 337–342. [Google Scholar]
  37. Lawoko, M.; Berggren, R.; Berthold, F.; Henriksson, G.; Gellerstedt, G. Changes in the lignin-carbohydrate complex in softwood kraft pulp during kraft and oxygen delignification. Holzforschung 2004, 58, 603. [Google Scholar] [CrossRef]
  38. Xu, Y.; Isom, L.; Hanna, M.A. Adding value to carbon dioxide from ethanol fermentations. Bioresour. Technol. 2010, 101, 3311–3319. [Google Scholar] [CrossRef]
  39. Hillestad, M.; Ostadi, M.; Del Alamo, G.; Rytter, E.; Austbø, B.; Pharoah, J.G.; Burheim, O. Improving carbon efficiency and profitability of the biomass to liquid process with hydrogen from renewable power. Fuel 2018, 234, 1431–1451. [Google Scholar] [CrossRef]
  40. Amsterchem. 2020. Available online: https://www.amsterchem.com/ (accessed on 3 August 2020).
  41. Peters, R.; Decker, M.; Eggemann, L.; Schemme, S.; Schorn, F.; Breuer, J.L.; Weiske, S.; Pasel, J.; Samsun, R.C.; Stolten, D. Thermodynamic and ecological preselection of synthetic fuel intermediates from biogas at farm sites. Energy Sustain. Soc. 2020, 10, 4. [Google Scholar] [CrossRef]
  42. Marchese, M.; Giglio, E.; Santarelli, M.; Lanzini, A. Energy performance of Power-to-Liquid applications integrating biogas upgrading, reverse water gas shift, solid oxide electrolysis and Fischer-Tropsch technologies. Energy Convers. Manag. X 2020, 6, 100041. [Google Scholar] [CrossRef]
  43. Verbeeck, K.; Buelens, L.C.; Galvita, V.; Marin, G.B.; Van Geem, K.M.; Rabaey, K. Upgrading the value of anaerobic digestion via chemical production from grid injected biomethane. Energy Environ. Sci. 2018, 11, 1788–1802. [Google Scholar] [CrossRef]
  44. Ostadi, M.; Rytter, E.; Hillestad, M. Boosting carbon efficiency of the biomass to liquid process with hydrogen from power: The effect of H2/CO ratio to the Fischer-Tropsch reactors on the production and power consumption. Biomass Bioenergy 2019, 127, 105282. [Google Scholar] [CrossRef]
  45. Ostadi, M.; Dalane, K.; Rytter, E.; Hillestad, M. Conceptual design of an autonomous once-through gas-to-liquid process—Comparison between fixed bed and microchannel reactors. Fuel Process. Technol. 2015, 139, 186–195. [Google Scholar] [CrossRef]
  46. Ostadi, M.; Rytter, E.; Hillestad, M. Evaluation of kinetic models for Fischer–Tropsch cobalt catalysts in a plug flow reactor. Chem. Eng. Res. Des. 2016, 114, 236–246. [Google Scholar] [CrossRef]
  47. Ostadi, M.; Austbø, B.; Hillestad, M. Parametric Optimization of a Power and Biomass to Liquid Process. In Computer Aided Chemical Engineering; Muñoz, S.G., Laird, C.D., Realff, M.J., Eds.; Elsevier: Amsterdam, The Netherlands, 2019; pp. 287–292. [Google Scholar]
  48. Ostadi, M.; Austbø, B.; Hillestad, M. Exergy analysis of a process converting power and biomass to a liquid fuel. Chem. Eng. Trans. 2019, 76, 205–210. [Google Scholar]
Figure 1. Near-term hydrogen production cost versus electricity price [25]. Negative electricity prices reflect local intermittent excess production (extrapolated from the original data). A full load hours (FLH) value of about 4000 h is assumed. For more information on the underlying assumptions refer to [25].
Energies 13 04859 g001
Figure 2. Renewables are getting cheaper. Unsubsidized LCOE (USD /MWh). 2009 to 2019 cost reductions: Solar: 89%, Wind: 70%. Data from LAZARD [1].
Energies 13 04859 g002
Figure 3. Long-Term economic H2 production costs based on hybrid solar PV and onshore wind technologies in various geographical regions [25]. Capital expenses for the electrolyzer are assumed to be USD 450/kWe, the efficiency is assumed to be 74% (LHV). Capital expenses associated with solar PV and onshore wind vary within the range of USD 400–1000/kW and USD 900–2500/kW, respectively, depending on geographical region. The economic discount rate is assumed to be 8%. Refer to [25] for more details of the assumptions.
Energies 13 04859 g003
Figure 4. Synthetic diesel production cost based on 3000 FLH (full load hours) of electrolyser. Negative electricity prices reflect local intermittent excess production (extrapolated from the original data). For more information on the underlying assumptions refer to [25].
Energies 13 04859 g004
Figure 5. Synthetic methane production cost based on 3000 FLH (full load hours) of electrolyser. MBtu = million British thermal units. Negative electricity prices reflect local intermittent excess production (extrapolated from the original data). For more information on the underlying assumptions refer to [25].
Energies 13 04859 g005
Figure 6. Conceptual framework of process integration of Reverse Water Gas Shift Reaction (RWGS). Heat integration (shown with red arrow) provides all or part of the heat for the endothermic RWGS.
Energies 13 04859 g006
Figure 7. Effect of temperature and H2O concentration on CO2 conversion in RWGS reaction. Higher reaction temperature and lower H2O concentration results in higher CO2 conversions.
Energies 13 04859 g007
Figure 8. Block diagram of staged biogas-to-liquids production. Hydrogen generated by steam electrolysis is added to the process at high temperature (i.e., RWGS reactor) as well as at low temperature (i.e., FT reactors).
Energies 13 04859 g008
Figure 9. Detailed diagram of staged biogas-to-liquids production. Steam streams are indicated by a blue color. Table 3 shows the stream specifications, labelled by bold text tag numbers.
Energies 13 04859 g009
Figure 10. Composite curves for the staged biogas to liquid process. The process requires 466 MW and 45 MW of external cooling and heating, respectively.
Energies 13 04859 g010
Table 1. Cost estimation parameters for synthetic fuel and Methane production in the long term [25].
ParameterMethanationFischer–Tropsch
CO2 transport and storage costs for CCUS (USD/t CO2)2020
CapEx (USD/kWliquid)565565
Efficiency % (LHV)7773
Annual OPEX (% of CapEx)44
Lifetime (years)3030
Electricity consumption (GJe/GJprod)0.0130.018
Table 2. Design parameters of different FT stages in biogas to liquid process.
Stage 1Stage 2Stage 3
Volume [m3]950490260
Inlet H2/CO1.81.81.8
H2 addition between stage [kmol/h]01085486
CH4 selectivity [%]44.45
CO conversion [%]565550
Syncrude production [t/h]46.620.98.7
Table 3. Important stream information in Figure 9 with bold tag numbers.
Stream100101102103104105106
Temperature (°C)65010102102102104040
Pressure (bar)4038.536.534.532.530.530.5
Mass flow (t/h)270523.6349.8237.8188.525.2142.8
Molar flow (kmol/h)11,91631,56621,91911,66872317864454
Mole fractions
CO00.2100.3030.2490.1790.1230.123
H200.3790.5450.4480.3220.1830.183
H2O0.4960.3060.0030.0030.0030.0030.003
CH40.3020.0060.0090.0290.0570.0850.085
C2-C40000.0060.0130.0210.021
CO20.2010.0980.1410.2620.4210.5780.578
N20000000
Table 4. Overall results of biogas to FT liquid process.
Overall Results of Biogas to Liquid Process
Conversion of CO in the Fischer–Tropsch section, defined in terms of each single pass (%)90
Carbon efficiency (overall) (%)88
Fischer–Tropsch production (overall) (t/h)76
Fischer–Tropsch production (overall) (L/h)95,000
Fischer–Tropsch Reactor volume (m3)1700
Required power to the SOEC (MW)549
Steam to SOEC (t/h)188
Recycle flow to the ATR (t/h)142
Tail gas compositions (mol%)
H218.3
CO12.3
CH48.5
CO257.8
N20

