Article

Impact of a Composite Trombe Wall Incorporating Phase Change Materials on the Thermal Behavior of an Individual House with Low Energy Consumption

Laboratoire de Génie Civil et géo-Environnement (LGCgE), Université d’Artois, ULR 4515, F-62400 Béthune, France
*
Author to whom correspondence should be addressed.
Energies 2020, 13(18), 4872; https://doi.org/10.3390/en13184872
Submission received: 23 June 2020 / Revised: 8 September 2020 / Accepted: 11 September 2020 / Published: 17 September 2020

Abstract

:
As the heating demands of buildings drop considerably, the use of solar walls makes increasing sense. One of the obstacles to the development of such walls is their need for on-site implementation by specialized companies. On the other hand, a storage wall is generally composed of heavy materials with high inertia, which prevents prefabrication of the solar component. To avoid this problem and allow for solar walls to be prefabricated in the factory, a novel approach to replacing this heavy wall with a lighter storage wall incorporating phase change materials (PCM) has been proposed. This paper aims to demonstrate the impact of PCM on the thermal energy performance once they have been integrated into the storage wall of the composite Trombe wall. Addressed herein will be the heat transfer exchange inside a house located in the northern part of France, where a composite Trombe wall has been fitted without PCM. Three configurations will be investigated—(1) the model house without the solar Trombe wall, defined as the reference configuration; (2) the model house integrating the concrete solar Trombe wall; and (3) the model house integrating the PCM solar Trombe wall. Two setpoint temperatures will be introduced—(a) a constant setpoint of 20 °C, and (b) a variable setpoint of 19 °C (14 h from 7:00 a.m. to 9:00 p.m.) and 16 °C (10 h from 9:00 p.m. to 7:00 a.m.). Furthermore, three different climate conditions will be adopted to run simulations—Paris-Orly, Lyon, and Nice. Dymola/Modelica, a dynamic thermal simulation tool, will be utilized to simulate the thermal performance of these defined configurations. The results obtained, regarding a solar Trombe wall installation that applies two distinct storage walls exposed to the weather of Paris, showed similar minimizations of the one-year energy heating demand inside the bedroom, equal to roughly 20% (i.e., 20.45% of concrete storage wall and 19.90% of PCM storage wall) compared to the reference configuration (i.e., the house with no solar Trombe wall). Based on the imposed setpoint temperature by means of night and day reductions, the resulting heating energy demand in the bedroom, through application of the two storage walls (concrete and PCM) and three different climatic regions could be minimized by 20.34% in Paris, 20.20% in Lyon, and 68.10% in Nice (for the concrete storage wall) vs. the reference configuration; and by 18.79% in Paris, 19.56% in Lyon, and 55.15% in Nice (for the PCM storage wall) vs. the reference configuration.

1. Introduction

Interest has recently been focused on increasing energy demands and the issue of climate change as regards economic development/competition, ongoing deforestation and transportation needs. In Europe, 50% of final energy consumption is allocated for heating and cooling purposes, of which 80% is utilized inside buildings [1,2]. To appropriately address this issue, the 2009 Renewable Energy Directive (RED) assigned a renewable energy target to the building sector of 20% of final energy consumption by 2020; furthermore, EU Member States agreed to this promising target, as part of the EU’s energy and climate goals for 2030, that is, to achieve at least a 27% reduction in final energy consumption by 2030 [1]. Defining an approach to charging and discharging thermal energy with a certain quantity in the form of passive and active storage methodology constitutes the key to successful renewable energy development.
PCMs have been used in various fields for thermal energy storage (TES), especially in the building envelope [3]. Over a period of decades, many researchers have shown interest in integrating PCM as storage elements into the floor, dwelling wall, exterior wall, interior wall, as a partition wall, and so forth. Several works in the literature regarding PCMs and their building applications have thus been reviewed herein: PCM in cooling, heating and power generation [4,5,6,7]; PCM latent heat thermal energy storage (LHTES) systems towards improving building energy efficiency [8]; a summary of 100 references relating to thermal energy storage with PCMs in building application encompassing impregnation methods, thermal performance analyses and numerical simulations [9]; PCM applications in highly energy-efficient houses in relation to an analysis of the system, materials, switching temperatures, containments and design strategies [10]; a review of PCMs integrated into building walls [11]; and a review of PCM-based microencapsulation for building applications [12]. PCMs have been studied by means of—(a) numerical methods: novel composite PCM panels incorporated into an external wall structure [13]; numerical study of a PCM wall in evaluating several heat transfer correlations for natural, mixed and forced convection flows [14]; a year-round simulation of a room integrating a new type of composite wall system embedded with various PCMs for cooling/heating energy savings, plus a PCM-enhanced envelope system providing the potential for thermal energy savings [15,16]; (b) experimental studies—thermal behavior and reduced energy consumption in two residential rooms embedded with a PCM layer in the inner face during heating periods [17]; thermal performance improvement of a building envelope with and without PCM wall unit integration [18]; investigation of a macro-encapsulated PCM position in the concrete walls of model rooms under actual conditions [19]; PCMs incorporated into walls as thin layers to assess thermal performance and determine optimal PCM locations [20]; assessment of residential building walls containing pipe-encapsulated PCMs for thermal performance in summer conditions [21]; and (c) comparative studies of both these cases (i.e., numerical and experimental studies)—a wall composed of five layers of PCM placed on the back wall of the room set up to test thermal performance throughout the whole year in a cold climate [22]; shape-stable nano-PCM composite incorporated into the gypsum wallboard as part of energy-efficient building construction [23]; a study to investigate the effects of various parameters of PCM wallboard, such as phase change temperature, convective heat transfer coefficients and thickness [24]; and gypsum wallboards incorporated with three different PCMs [25]. Other research has applied PCM elements in actual in situ case studies [26,27]. Yannick et al. [28] ran a simulation of the energy performance of a passive wall integrated into twin building zones located in the southern part of France. This passive wall, constituted from the exterior face by a 0.8-cm thick sheet of glass, a 4-cm thick layer of silica aerogel and glass bricks filled with PCM, was expected to simultaneously provide insulation, heat storage, and daylighting to the interior space. The results obtained indicated energy savings during the winter. Stephen et al. [29] embedded PCM into the wallboard of a building in order to reduce the heating required to maintain the space comfortable. The numerical study was modeled by assuming that heat transfer through the building’s multi-layered envelopes was one-dimensional. Its authors stated that 21.38% of energy savings could be realized; consequently, they noted that using an optimized PCM in its optimal placement is fundamental to responding to the various climatic conditions. Alexander et al. [30] investigated a concrete wall integrating PCM in order to assess the annual energy and cost savings of an individual house subjected to two climate conditions, namely those of San Francisco and Los Angeles. They found that PCM integration can reduce the cooling load from 85% to 100% for San Francisco and from 53% to 82% for Los Angeles, while the effects of microencapsulated PCM on the reduction in annual heating demand and cost savings were small. Xu Wang et al. [31] developed a PCM-brick wall (1.6 W × 2.4 H × 0.24 dm3) in the aim of studying PCM efficiency (shape-stabilized phase change material made of high-density polyethylene, expanded graphite and paraffin) relative to the energy consumption performance inside the full-scale room sized 3.25 m (L) × 3.86 m (W) × 2.91 m (H) during three seasons—winter, summer, and midseason. Results showed that the PCM-brick wall can in winter reduce the heating load by 10% to 30%, while the cooling load could be reduced by 24.32% under summer conditions.
A review of the application of Trombe wall systems in buildings by Hu et al. [32] described, for the past 15 years, the most pertinent contents of the solar Trombe walls installed by researchers; moreover, Saadatian et al. [33] reviewed Trombe wall applications in building envelopes. A composite Trombe wall was originally built with element transparency as a glazing/double glazing configuration, with the addition of a few cm to allow for a non-ventilated air gap and a storage wall with/without PCM, as well as another few cm behind the storage wall with an insulating panel that creates a ventilated air gap between the two surfaces (storage and insulating wall) [34]. This type of passive set-up has been studied for decades since its initial application with a storage wall and without PCM by F. Trombe and J. Michel [35]. Subsequently, composite Trombe walls were renovated in the aim of incorporating PCMs to improve the quantity of thermal energy storage. A number of publications related to numerical and experimental studies of composite Trombe wall storage elements feature—(1) a storage wall without PCMs [36,37,38,39,40]; (2) a storage wall with PCMs [41,42]; and (3) a comparison of both cases of storage walls with/without PCMs and another case of a passive wall [43,44,45].
Simulation tools have been built to study the thermal behavior aspects of energy performance inside the building with respect to the heat transfer exchange—radiation, convection, and conduction. These tools further facilitate designers’ efforts in modeling different case studies of thermal energy performance through designing, drawing, inputting thermal properties of elements, connecting between model components (the Functional Mock-up Interface (or FMI)), and even coding or modifying the codes for specific interfaces (e.g., the PCM storage wall). Some of the more widespread programs have been utilized to model and simulate the energy performance of the designated buildings with respect to various configurations studied, namely—(a) EnergyPlus: a lightweight building simulation study [46]; the effectiveness of PCM wallboards on partition walls [47]; a PCM model for opaque walls [48]; a study of building retrofitting based on the impact of PCMs [49]; a simulation of microencapsulated PCM wallboards for summer thermal comfort in buildings [50]; optimization of the PCM melting temperature applied to glass curtain walls for a retrofitted building system [51]; a study of PCM impact on energy consumption and economic analysis [52]; a study of PCM melting temperature to enhance thermal comfort [53]; a study of PCMs in minimizing heating/cooling energy consumption [54]; and a parametric analysis of PCM walls improving thermal comfort [55]; (b) ESP-r: integration of microencapsulated PCMs into interior walls for energy savings [56]; investigating a hybrid adaptable thermal storage (HATS) to reduce heating demands and enhance temperature comfort [57]; a study of PCM-gypsum composites in buildings [58]; and isothermal heat storage systems in buildings [59]; (c) TRNSYS: a study of light wallboards containing PCMs [60]; an approach to the energy simulation of PCM elements in building applications [61]; a study of ceiling panels integrating PCM for lightweight applications in retrofitted buildings [62]; a numerical model of external building walls containing PCM [63]; a study of twin cells separated by a hollow glass brick wall filled with PCM [64]; integration of PCM technologies for net zero energy buildings [65]; the energy performance of a Trombe wall in various building configurations [66]; the effect of PCM in improving the thermal comfort in buildings [67]; (d) Dymola/Modelica: a physical model of HVAC load prediction for urban building districts [68]; an automated IFC (Industry Foundation Classes)-based workflow for building energy performance [69]; a study of district energy demand based on the impact of building geometry [70]; analysis of the impacts of typical envelope models for energy simulation at the district scale [71]; energy saving potential of a two-pipe system in office buildings [72]; a novel concept regarding bidirectional low temperature networks [73]; the agent-based control of building energy systems [74]; multi-floor building heating models [75]; semantic inference-based control for building HVAC systems [76]; equation-based, object-oriented Modelica modeling [77]; energy performance of a PCM-based heat exchanger coupled with a novel HVAC system [78]; a study of district heating and cooling systems [79]; thermal processes in passive solar buildings using an object-oriented environment of Matlab-Simulink and Modelica [80]; and a coupling of fast fluid dynamics and multi-zone airflow models to simulate the dynamics of HVAC systems [81]; and (e) DesignBuilder: [82]; an analysis of energy demands versus comfort levels for buildings integrating PCMs [83], and so forth.
The Modelica language was designed as a non-proprietary, object-oriented and equation-based language for modeling purposes dedicated to complex physical systems, while Dymola uses the Modelica language as an open source, thus making it feasible to create its own model libraries or else extend the existing Modelica libraries. Dymola/Modelica has enabled us to accelerate development by using the Functional Mock-up Interface (FMI). Wetter and Haugstetter [84] published a comparison between an equation-based and procedural modeling language for building energy simulation by two software applications. Modelica and TRNSYS were run for this comparison with respect to implementation of a multi-zone building energy simulation. Their results section stated that the model equation was executed with the Modelica language five to ten times faster than that executed with TRNSYS; moreover, it was easier to construct large models using Modelica rather than TRNSYS due to the fact that Modelica enables models to be built in a hierarchical manner in facilitating the debugging and reuse of sub-models. Moreover, these authors compared the balance of thermal energy performance relative to the annual cooling and heating output by these two software applications, which showed a difference ranging from 5% to 20%. Burhenne et al. [85] studied a building performance simulation using Dymola/Modelica. The purpose of their research was to investigate an application of this tool for building performance simulation (BPS) problems. Their computational results from the Dymola/Modelica program highlighted this modeling language’s flexibility and suitability for tasks within the practical BPS. Gonzaléz and Yebra [82] presented a comparison between Modelica, enabling use of both Dymola and SystemModeler, and DesignBuilder for their functionality as a building simulation tool. A simple building (7 m long, 4.6 m deep and 3 m high) was selected for modeling and simulation over a one-year period in the aim of observing how closely the obtained results could be approximated when the same building simulation systems were employed. The comparative results from these two building simulation tools led them to conclude that Modelica tools provide a real option for thermodynamic simulation modeling within the building sector and moreover are a key incentive for additional applications. Wetter [86] presented a multi-zone building model for thermal building simulations in Dymola/Modelica. The modeled room was analyzed for its connection through airflow or heat exchange by means of conduction as regards both the thermal energy analysis and control analysis. It was specified in the conclusion that the room model for simulation leads to a shorter model development time. Tian et al. [81] presented the integrative model of a building’s heating, ventilation and air conditioning (HVAC) systems, with the assistance of the Dymola/Modelica simulation platform for multi-zone models coupled with computational fluid dynamics (CFD) simulations for airflows. The coupling of three models (static coupling, dynamic coupling and quasi-dynamic coupling) based on Modelica’s “Buildings” library and CFD was studied under two scenarios—(1) implementation with a mass flow rate boundary condition for fast fluid dynamics (FFD); and (2) implementation with a total pressure boundary condition for FFD. Also examined were two case studies for validation—(1) isothermal flow with a non-uniform momentum distribution; and (2) non-isothermal flow with a non-uniform temperature distribution. The simulations results obtained, when compared to the results of measurement experiments, were found to be in good agreement and showed the ability of the coupled simulation models to capture the physics specific to the non-uniformity of a dynamic system.
The scientific gap encountered relates to the model study of a composite Trombe wall both with and without integration of a phase change material in Modelica’s Buildings Library, thus enabling us to study the energy performance of this type of passive wall regarding the heating requirements and comfort temperature available under various climatic conditions. This paper will investigate the impact of integrating PCM into the storage wall. The objectives of this study are twofold—producing results on heating energy, and observing temperature comfort inside the house. The previous study pertains to the model, using the Dymola/Modelica program and components from the Buildings [87] and IDEAS [88] libraries, along with the validation of a composite Trombe wall model compared to measurement data [89]. Heat transfer in this model house is considered in 1D terms everywhere except in the ventilated air gap of the solar Trombe wall, where the vertical airflow is taken into account through enthalpic balances and correlations for the calculation of convective exchange coefficients [90]. The model of the wall incorporating PCM has been compared with a small-scale experiment on a solar wall built in the laboratory. 17% by mass of BASF PCM Micronal® were included in the mixture, generating a latent heat of 17,100 J/kg. The phase change temperature is 25.83 °C. Both the experiment and the method employed to characterize this composite material (mortar + PCM) are described in [91,92].
The purpose of this paper is to study the impact on the heating demands of integrating a solar wall in a single-family dwelling. Of special interest here is the fact that several types of composite solar walls are being considered—a solar wall integrating a cement mortar storage wall (thickness: 4 cm, sensible heat storage); a second wall integrating a cement mortar storage wall that incorporates a PCM (thickness: 4 cm, sensible and latent heat storage); and a third, more conventional, wall integrating a concrete storage wall (thickness: 15 cm, sensible heat storage). On the other hand, all these cases are compared to the reference case, whereby the house does not have a solar wall but instead a conventional opaque wall. The solar wall recovers free solar energy and transmits it to the room where it is located. To accomplish this, it is necessary to investigate the impact of the solar wall in the target room and possibly in the adjacent rooms. An underlying risk is that the solar wall brings too much energy into the room and causes overheating. One way to avoid this risk is to delay the solar gain until those times when heating is needed (especially at night). The phase shifts of the various solar wall configurations have been studied along with the temperatures in the house’s different rooms. To carry out this study, numerical thermal simulations at the scale of a house have been carried out. The studied house is an actual dwelling located in Croisilles (Pas-de-Calais, northern France), from which we recovered the layout drawings, resembling a standard rental house in France. The numerical simulations were run using a multi-zone model from the “Modelica Buildings Library” which includes the Trombe composite wall model.

2. Description of the Model House

The studied house has been awarded the Low Consumption Building (LCB) certification. The LCB level assesses a building’s energy consumption at less than 50 kWh of primary energy per m2 of usable floor area per year (in terms of conventional consumption for heating, cooling, ventilation, domestic hot water production and lighting systems).
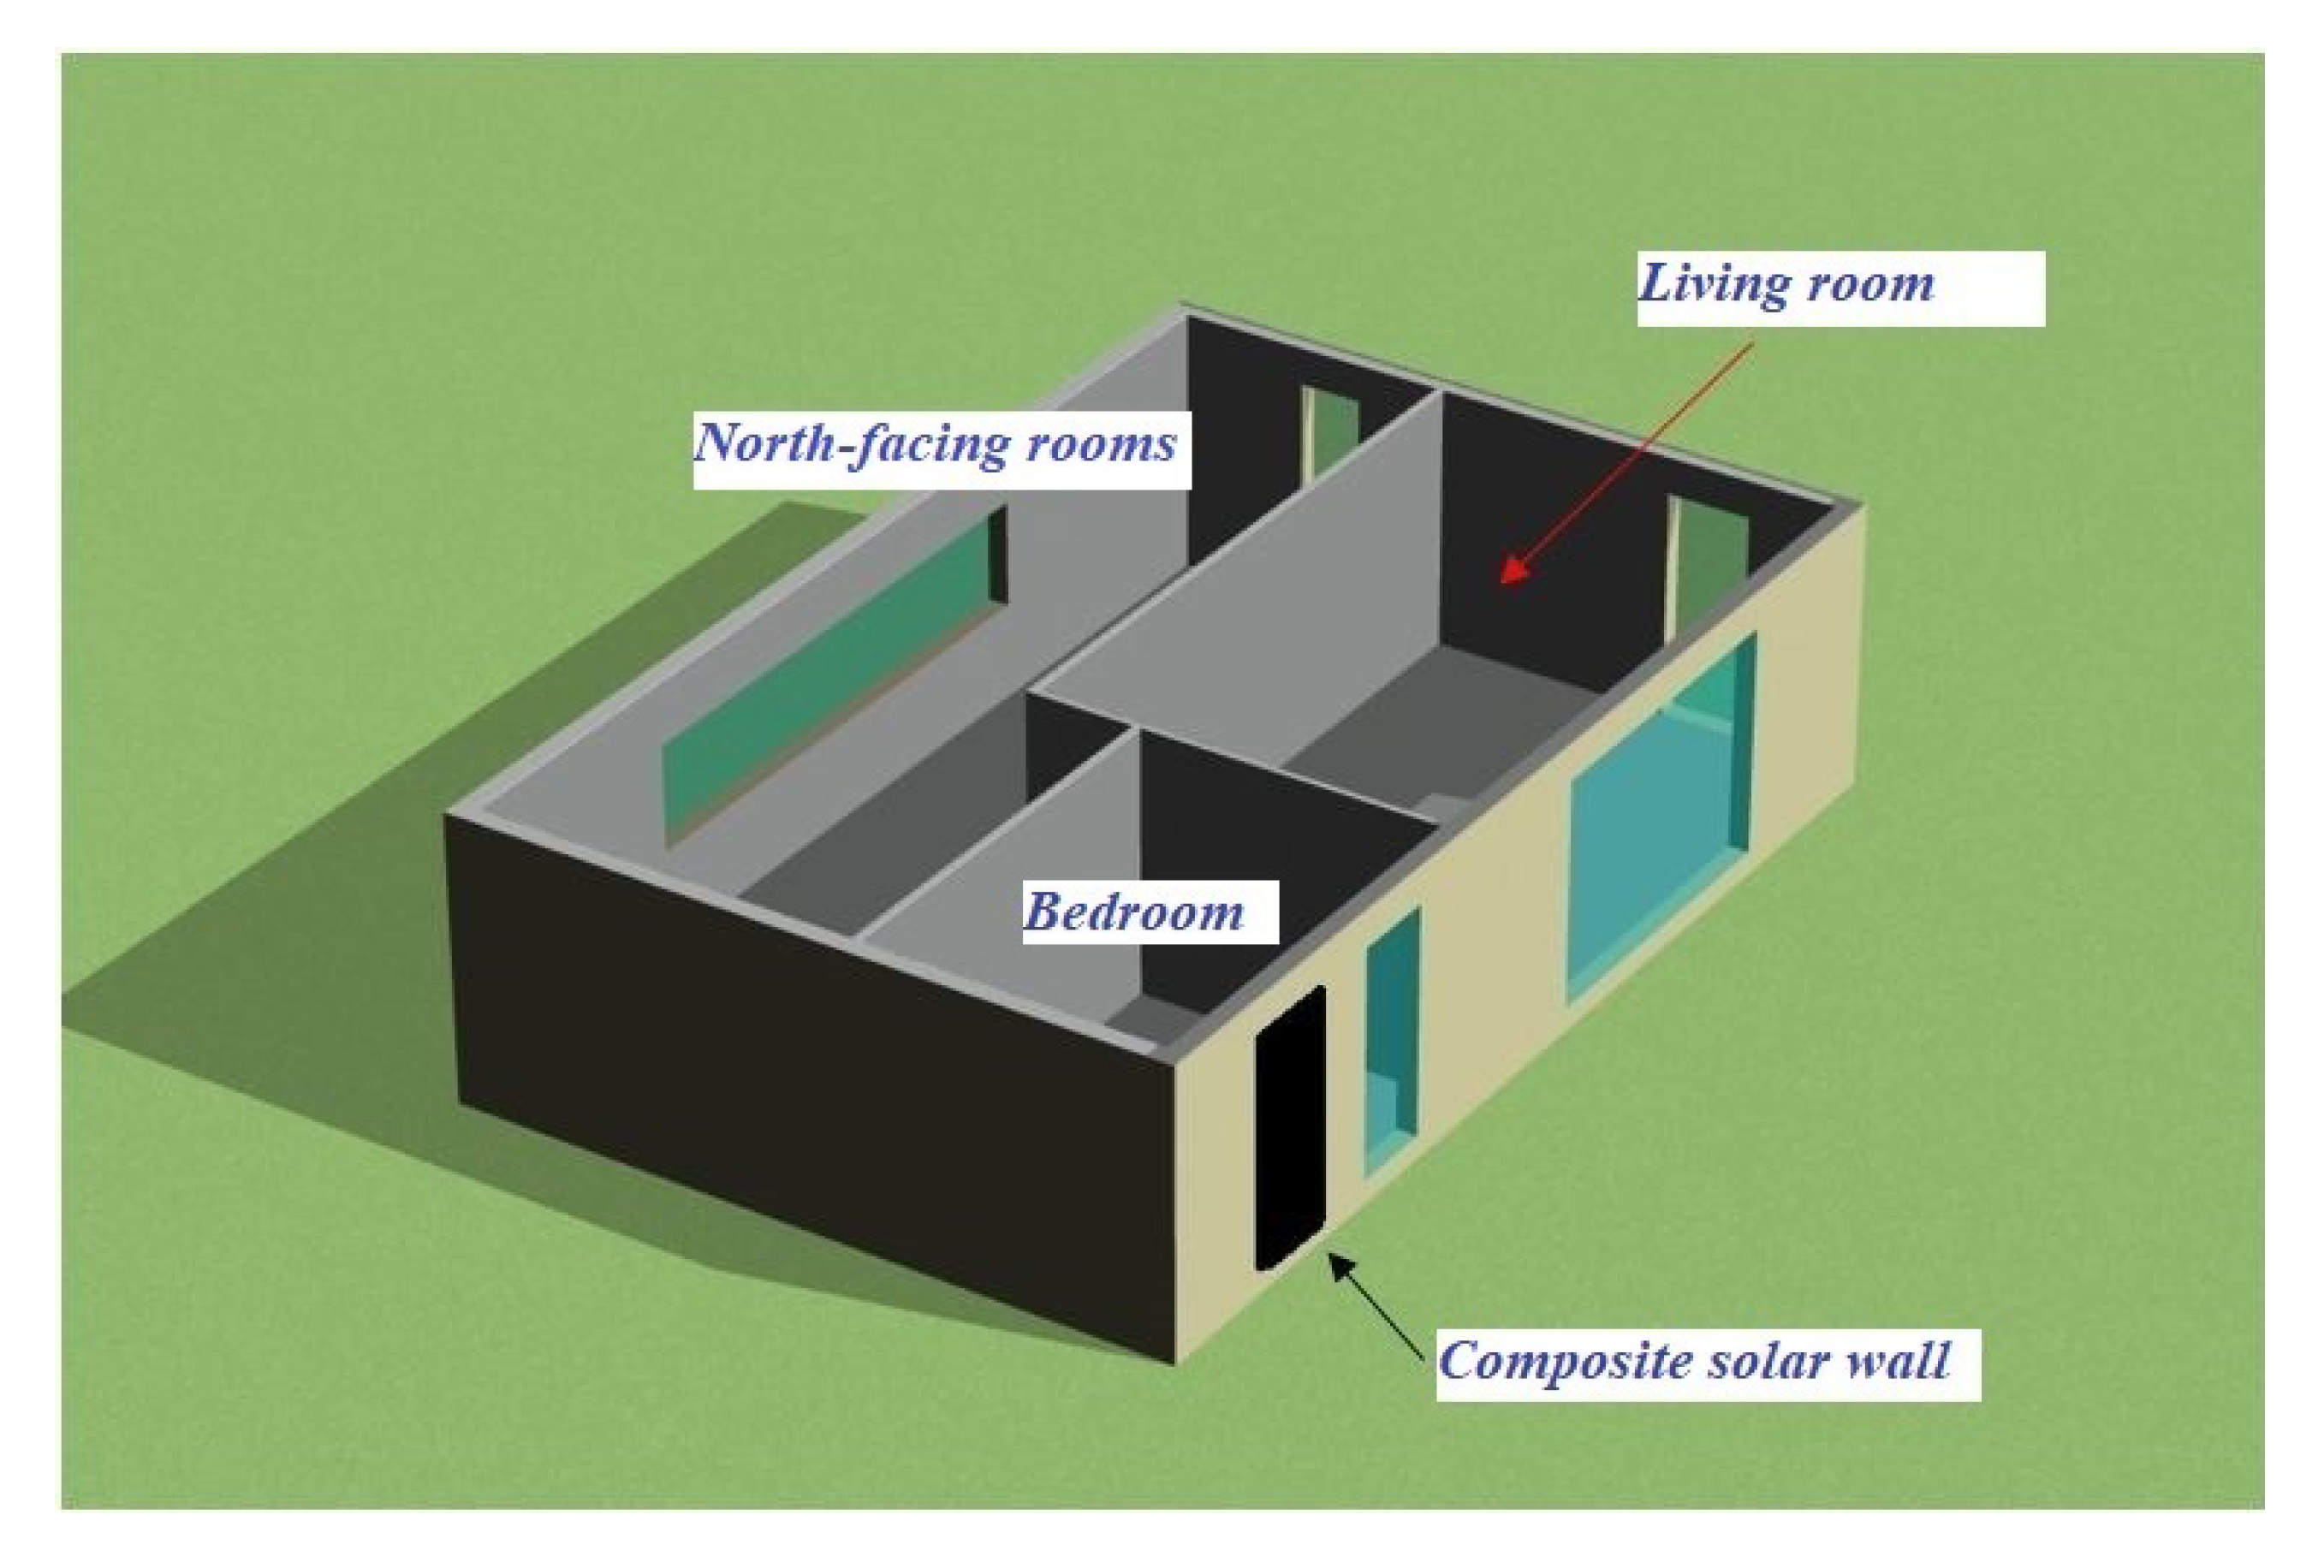
This house is a single-story dwelling whose layout is shown in Figure 1. This type of residential building was considered for the study since its layout is aligned with the objectives of the study, namely—a heating demand comparison, a comparison of the number of thermal comfort hours, an impact assessment of one room equipped with a solar wall on the adjacent rooms, and an array of results related to the changing solar Trombe wall position. Given that the thermal behavior of the bedroom is being studied more specifically, the zoning has been limited to 3 zones, one of which groups all rooms on the north side of the house, with a total floor area of 30.39 m2, while the other zones are limited to just one room (11.13-m2 bedroom, 24.25-m2 living room). The constructive features of the house are reported in Table 1.
The thermophysical characteristics of these components are listed in Table 2.
The windows used in the bedroom, living room and north-facing rooms are double glazed with a 12-mm air gap between 4-mm thick glass panes and a low-emissivity thin coating to minimize the transmission of infrared and ultraviolet light permeating through the glass. The frame area relative to the total window area is 38% (Ufr = 0.38). The dimensions of the windows are indicated in Table 3.

2.1. Numerical Model

Figure 2 shows the model of the studied house, which has been divided into three thermal zones. The model of the solar wall is connected to the bedroom. This model was validated by comparing the data measured from a small experimental solar wall with the simulated data. The differences between energy balances and temperatures were all within 10% [89]. The weather data are stored in the ’weaBus’ component. The defined materials for both the building envelope and solar Trombe wall are stored in the yellow tables on the top left-hand side of the schematic model.
The numerical thermal model of each zone in the individual house (bedroom, living room, north-facing rooms) originates mainly from the ’MixedAir’ component of the ’Building Library’. This component can be used to model a single room with an unlimited number of opaque elements or simulate a multi-zone building model. A strong underlying assumption is that the air circulating inside the room is completely mixed, thus taking into account heat transfer through walls, floors, ceilings and windows. The three models are connected in order to simulate the three zones of the house.
Concerning ventilation, the airflow corresponds to the number of main rooms, including the minimal airflow in the kitchen, 150 m3/h in the present case and fixed in all three zones; moreover, air circulation between zones has not been taken into account [93].
For this study, all results stem from numerical calculations using the same model. It will be assumed that the errors occurring in each case studied are of the same order of magnitude.

2.2. Composite Trombe Wall Description

The composite Trombe wall (Figure 3) has been integrated into the south sidewall of the bedroom, which was originally an opaque wall, 1.34 m wide and 2.15 m high (surface area: 2.88 m2). The operating mode and primary characteristics of this solar wall have been described in a previous study [89]. The thermal properties of the defined storage walls, as well as the double glazing and insulating panel, are all given in Table 4.

2.3. Meteorological Data

The meteorological data used were extracted from the ‘EnergyPlus’ software website [94]. Outdoor temperature, outdoor relative humidity, wind speed and direction, and annual solar radiation were all input into the Dymola model using the ‘ReaderTMY3’ reader in the ‘Modelica Building Library’. Three different climates were considered in this study—Paris-Orly, Lyon, and Nice. Figure 4 and Figure 5 show the monthly maximum values of global solar flux and the monthly average outdoor temperatures for these three regions. It can be observed that the Nice region is hotter since it supplies a solar flux and outdoor temperature higher than those of the other two regions.

2.4. Configuration Studied

Three configurations will be implemented for the thermal model house simulation, as reported in Table 5. Configuration 1 serves as the reference, whereby the model house simulation does not include the solar Trombe wall (composite Trombe wall), but instead an opaque wall similar to the other unglazed walls. The Configuration 2 simulation includes a solar Trombe wall, whose storage wall is made from a 15-cm thick concrete. Lastly, according to Configuration 3, the simulation will be run once again, this time by replacing the concrete storage wall with a 4-cm thick storage wall produced from combining cement mortar and microencapsulated PCM. Three distinct climatic conditions will be utilized to simulate these three configurations—Paris, Lyon, and Nice. Also, two setpoint temperatures will be introduced—(a) a constant setpoint of 20 °C, and (b) a variable setpoint of 19 °C (for 14 h, from 7:00 a.m. to 9:00 p.m.) and 16 °C (for 10 h from 9:00 p.m. to 7:00 a.m.).

2.5. Criteria for Interpreting the Results

To evaluate the benefit of installing a solar wall in terms of energy savings, the main criterion will focus on the heating energy demands recorded based on simulation results compared to the heating energy demands of the reference house. On the other hand, a solar Trombe wall can cause overheating; therefore, it is important to consider thermal comfort in the various thermal zones of the house.
Heating energy demands are calculated based on an integration as a function of both time and power, as follows:
Q = P d t ,
where Q is the heating energy demands (J), P the power (W), and dt the time (s).
Once the solar Trombe wall has performed during the heating period, we are able to observe the comfort criteria within the thermal zone. In summer, a reflective shield placed in front of the glazing blocks the solar gains directed towards the solar Trombe wall. To evaluate the comfort temperature, the notion behind the adaptive comfort method is to be applied. According to this method, for the case when outdoor temperature changes, the perception of comfort in the building also changes because the building’s occupants, as well as their clothing insulation, tend to adapt to climatic conditions.
Standard EN 15251 [95] takes into account this notion of adaptive comfort; it proposes a comfort temperature calculation that depends on a daily temperature calculated as a moving average. The problem with this method is its failure to consider the case of evaluating comfort temperature with low outdoor temperatures (in winter). McCartney and Nicol [96] proposed an adaptive comfort temperature calculation based on measurements conducted in France; it is based on a running mean temperature TRM, which is assessed daily according to its value on the previous day and the value of the daily mean temperature of the day preceding TDM:
T RM = 0.8 T RM j 1 + 0.2 T DM j 1 .
These authors then proposed calculating the comfort temperature as a piecewise affine function of TRM:
T C = 0.049 T RM + 22.58 i f T RM < 10 T C = 0.206 T RM + 21.48 i f T RM > 10 .
It can be thus be considered that 80% of people are satisfied with a temperature within a zone ±3.5 °C on either side of this comfort temperature. For the study on winter comfort, it is therefore stipulated to define an upper limit temperature Tcmax of 3.5 °C above Tc (Tcmax = Tc + 3.5 °C) as a comfort criterion. In this case, such a limit allows calculating, during the heating period with a solar Trombe wall in operation, the number of hours of temperature discomfort, that is, when temperature fluctuations exceed this comfort criterion. For Paris weather, during the heating period, this Tcmax temperature varies from 26 °C during the coldest part of the winter to roughly 28 °C.

3. Simulation of the Base Case—Paris Weather, Constant Setpoint T

3.1. Configuration 1—Reference Case, That Is, without a Composite Trombe Wall

This first configuration, used as the reference case, deals with the simulation of the house model without any solar wall. The aim of this section is to show the temperature and power variations with respect to the various zone areas (i.e., south-facing zones receive more direct sunlight than north-facing zones). Figure 6 displays the temperature fluctuations inside the bedroom, living room and north-facing rooms vs. outdoor air temperature Text. It should be noticed that in both the bedroom and living room, temperatures regularly exceed 20 °C during the heating season, while the inside temperature of the north-facing rooms remains at the constant setpoint temperature during the first 100 days and last 50 days of the yearlong period. This constant temperature is due to the fact that the grouped zone on the north side of the house receives less sunlight, whereas the rooms located on the south side receive much more direct sunlight passing through the windows. The heating energy demands of each model house zone is calculated by integrating power as a function of time, as reported in Figure 7, and Equation (1). Figure 8 shows the energy duration curve in all three zones. Results of the one-year heating energy demands are given in Table 6.
This table shows that the heating energy demands of the south-facing thermal zones (bedroom and living room) are lower than those of the north-facing rooms, which seems logical due to the solar gains passing through the windows. The order of magnitude of the heating energy demands by zone is consistent, in considering the composition of the walls, the indoor setpoint temperature and climatic conditions.

3.2. Configuration 2—Composite Trombe Wall Integrating the Non-PCM Storage Wall

Configuration 2 pertains to the integration of a composite Trombe wall 2.15 m high and 1.34 m wide on the south facade of the bedroom. To fully understand the effect of PCM when compared with Configuration 3, two storage wall compositions have been studied:
  • Configuration 2a: 15-cm thick concrete storage wall;
  • Configuration 2b: 4-cm thick mortar storage wall. This mortar has the same thermophysical properties as the mortar containing PCM in Configuration 3. However, in Configuration 2b, the latent heat (LA = 0) is considered zero since no PCM is present.
Configuration 2b would surely not in practice be considered by designers, but it does allow us to isolate the impact of PCM on its own. Conversely, Configuration 2a is currently used in experimental and numerical studies [38,39]. The thermal properties of these storage walls are given in Table 4.
Let’s recall herein that the simulations are performed under the assumption of no ventilation between the bedroom and the other rooms (living room and north-facing rooms). The heat transfers between zones take place via the internal partitions. Figure 9 shows the comparison curves for the power supplied by the solar Trombe wall fitted with, respectively, the concrete storage wall and the mortar storage wall, as well as the air temperature variations evaluated at the upper vent of the ventilated air gap. When the sun is shining, the solar Trombe wall absorbs a certain amount of thermal energy in its storage wall (concrete or mortar), which accumulates, transfers and then recovers the thermal heat in the ventilated air layer to heat the bedroom. This figure reveals that the power supplied by the mortar storage wall generates a higher phase shift, of approx. 550 watts, for the three days (from Day 98 to Day 100) compared to the concrete storage wall (i.e., roughly 150 watts during the heating period). Conversely, during the period of heating demand, the power supplied by the concrete storage wall remains positive for four days (from Day 98 to Day 101), while the power supplied by the mortar storage wall does not.
Once the wall runs out of power (especially at night), the direction of the exchanges can reverse in the solar Trombe wall. This phenomenon can create an inverse thermo-circulation whenever the temperature in the ventilated air gap is lower than that in the bedroom. In this model, the installation of a component (in practice, a flexible plastic film) has been taken into account to prevent this inverse thermo-circulation [39]. Figure 10 shows the airflow fluctuations inside the ventilated air gap, in indicating that at night or during the day when sunlight is insufficient, the airflow is zero when the flexible plastic film blocks the inverse-circulation air. The air temperature measured at the upper vent of the solar Trombe wall containing the concrete and mortar storage wall is calculated based on the air circulating in the ventilated air gap as well as on the heat transfer exchanges (convection and radiation) between the storage wall and the insulating wall over four sunny days. For this case, the plastic film blocks the inverse-circulation air, and the air temperature at the upper vent of the mortar solar Trombe wall equals the average temperature between the storage wall and the insulating wall.
Figure 11 shows the temperature fluctuations inside the bedroom incorporating the solar Trombe wall fitted respectively with the concrete and mortar storage wall, as compared to that without the solar Trombe wall (reference case). According to the curves plotted relative to temperature variations inside the bedroom, application of the solar Trombe wall with either the concrete storage wall or the mortar storage wall can increase temperature in the bedroom compared to the reference case (no solar Trombe wall). Furthermore, this curve shows that the higher the temperature at the upper vent of the mortar solar Trombe wall, the higher the temperature inside the bedroom compared to the concrete solar Trombe wall. For the reference case, the bedroom temperature slightly increases, in correlation with the direct solar gains passing through the window. The temperature curves in Figure 12 indicate that integrating the solar Trombe wall increases temperature in the bedroom during the day and extends the time when it is above the setpoint temperature. This extension saves energy by delaying the start of heating. Figure 12 also shows a higher temperature during the day inside the bedroom in the case of the mortar solar Trombe wall as compared to the concrete solar Trombe wall.
To observe the thermal impact from the zone equipped with the solar Trombe wall on the adjacent zone, the temperature curves need to be superimposed and the total heating energy demands calculated. Figure 13 and Figure 14 show a comparison of the temperature variations inside the living room and the north-facing rooms. Based on the similarity of temperature curves (Tliv_Trombe wall concrete with Tliv_no Trombe wall, Tnor_Trombe wall concrete with Tnor_no Trombe wall, Tliv_Trombe wall mortar with Tliv_no Trombe wall, and Tnor_Trombe wall mortar with Tnor_no Trombe wall), the heat transfer through the partitions must be low because the implementation of the solar Trombe wall does not influence the inside temperatures in adjacent zones. Table 7 reports the one-year heating energy demands in the bedroom, the living room, and the north-facing rooms for the model house integrating the solar Trombe wall (concrete and mortar) as well as for the reference house.
These numbers confirm the previous conclusions. Implementation of the solar Trombe wall only weakly influences the heating energy demands of the living room and north-facing rooms. However, the reduction in heating energy demand is significant in the bedroom featuring the solar Trombe wall.

3.3. Configuration 3—Composite Trombe Wall Integrating the PCM Storage Wall

Under the same climatic conditions (Paris), in this configuration, the concrete storage wall in the solar Trombe wall is replaced by the 4-cm thick PCM storage wall with the same dimensions as the storage wall installed in Configuration 2 (i.e., 2.15 × 1.34 × 0.04 m3). The thermal properties of the storage wall containing PCM are given in Table 4. Figure 15 presents the curves of power supplied by the solar Trombe wall containing three different storage walls—PCM storage wall, concrete storage wall, and mortar storage wall. It is revealed that the power curve of the PCM Trombe wall increases more sharply during the day and then starts to decline from the end of the day (around 5:00 pm) until the next morning (around 8:00 am), while the power curve of the concrete Trombe wall increases slowly during the day and starts to decrease later (around 8:00 pm), but it remains higher than the PCM Trombe wall (from 8:00 pm to 12:00 am) until the morning before starting to rise again. It is furthermore shown that compared to the power curve for the mortar Trombe wall, variations in the concrete Trombe wall are quite similar, except for an inflection at the beginning of the melting or solidification of PCM. The concrete Trombe wall releases thermal power more moderately and over a longer duration. Based on the temperature curves (Tbed_Trombe wall pcm and Tbed_Trombe wall mortar) inside the bedroom, as indicated in Figure 16, the presence of PCM in the mortar has the effect of lowering maximum temperatures in the bedroom; moreover, Tbed_Trombe wall pcm and Tbed_Trombe wall mortar are much higher compared to the temperature variation (Tbed_Trombe wall concrete) in the concrete Trombe wall.
Figure 17 shows the temperature time lag in the bedroom between the different cases studied versus the reference case. The time lag of the concrete and mortar Trombe walls is one hour longer than that of the PCM Trombe wall (4 h) on Day 98. The heating is switched on later for the bedroom with the concrete Trombe wall (8 h) than the bedroom with the PCM (5 h) or mortar Trombe wall (6 h) on Day 99. The time lag equals 6 h for the PCM Trombe wall on Day 100, while the temperatures of the concrete and mortar Trombe walls exceed the setpoint temperature of 20 °C. These walls have not released all the energy stored the previous day before sunrise. Even though the air temperature inside the bedroom equipped with a PCM Trombe wall is higher than that with the concrete Trombe wall, the results presented in Figure 18, Figure 19 and Figure 20 regarding the variation in air temperature in the living room and north-facing rooms display little difference compared to the other cases. This finding suggests that the rooms are thermally independent and little or no energy transfer occurs from the bedroom to the other rooms.
Table 8 reports the one-year heating energy demands inside the bedroom, living room and north-facing rooms. The demand in the bedroom for Configuration 1 (reference case) is higher than that for the three other configurations: 13.64 kWh/m2/year, equivalent to 20.45% of energy savings, for the concrete solar Trombe wall (Configuration 2a); 12.09 kWh/m2/year, equivalent to 18.13% of energy savings, for the mortar solar Trombe wall (Configuration 2b); and 13.27 kWh/m2/year, equivalent to 19.90% of energy savings, for the PCM solar Trombe wall (Configuration 3). On the other hand, it is worth noting that the integration of PCM compared to the mortar storage wall has a minimal impact on heating energy demands, with a difference of barely more than 1 kWh/m2. For the other two zones (living room and north-facing rooms), the heating energy demands vary little. Furthermore, this table shows the number of hours of temperature discomfort; here, the hours will be counted whenever, during heating time, the temperature inside the thermal zone is above the setpoint thermal comfort Tcmax (i.e., Tcmax = Tc + 3.5 °C) (see Section 2.5). As regards the number of hours of temperature discomfort inside the bedroom, it is shown that the application of a mortar solar Trombe wall can cause a discomfort time of up to 262 h vs. 170 h for the PCM solar Trombe wall, while a much smaller figure of 35 h is found for the case of the concrete solar Trombe wall.
Figure 21, Figure 22 and Figure 23 reflect the bar graphs of monthly heating energy demands in the bedroom, living room and north-facing rooms relative to the studied configurations. It is shown that for Configurations 2 and 3, the heating energy demands are low in May and September, which suggests that installation of the solar Trombe wall could minimize the length of the heating period.

3.4. Variants—Lower Setpoint Temperature During Night and Day, and Climate Zone

The aim of this section is to analyze the energy performance of the model house for the case where a reduced setpoint temperature is applied during both night and day. The reduced setpoint temperature is set at 19 °C for 14 h, from 7:00 am to 9:00 pm, and at 16 °C for 10 h, from 9:00 pm to 7:00 am. The purpose of this specific study is to observe the variation in heating energy demands and thermal dynamics of the building compared to the previous case indicated above with respect to the constant setpoint temperature of 20 °C. This new setpoint will be assigned to the three previous configurations in order to run the thermal house simulation. Table 9 reports the annual heating energy demands and annual energy savings resulting from the studied configurations and the three distinct weather regions—Paris, Lyon, and Nice. Table 10 then shows the ratio of energy savings by virtue of comparing the results obtained on heating energy demands based on the two setpoint temperatures.
The lower setpoint temperature during both night and day yields a slight effect of the solar Trombe wall application, by means of minimizing heating energy demands since results show roughly 9 kWh/m2/year across the three climate conditions (Table 9). It can furthermore be noted that in Table 10, the defined setpoint temperature, derived by a 4 °C reduction at night and a 1 °C reduction during the day, produces a remarkable impact on minimizing heating energy demands compared to a constant setpoint temperature of 20 °C. The ratio of the difference in heating energy demands amounts to about 20% for the weather in Paris and Lyon, and roughly 30% in Nice (with the value differences being small). In sum, application of the solar Trombe wall on the south side of the bedroom can allow the building’s occupants to minimize their heating energy demands by approx. 20% by establishing a setpoint temperature either constant (20 °C) or variable (16–19 °C).

3.5. Variants—Grouping of Thermal Zones and Position of the Composite Trombe Wall

As defined in the modeling Section 2.1, air does not circulate between the thermal zones in the thermal house simulation. According to simulation results, air temperatures inside the bedroom have been able to increase significantly and generate overheating, which constitutes a drawback; moreover, installation of the solar Trombe wall could slightly impact temperature fluctuations in the adjacent thermal zones (i.e., living room and north-facing rooms). It is encouraging therefore to further study, in this section, two other specific cases regarding the position of the solar Trombe wall and the freely-circulated air between bedroom and living room. The purpose of this section is to observe the impact of the solar Trombe wall with respect to the surface area of the thermal zone where it is to be integrated (11.13 m2 for the bedroom, 24.25 m2 for the living room, and 35.38 m2 for the bedroom plus living room), along with their simulation results pertaining to heating energy demands and the number of hours of temperature discomfort.
Based on the results listed in Table 11, in general changing the position of the solar Trombe wall only barely impacts the heating energy demands. Heating energy demands could be minimized for the zone by installing a solar Trombe wall. Furthermore, the specific case of grouping zones also shows a slight impact as regards total heating energy demands. Therefore, improved air circulation between thermal zones would have little impact on heating energy demands.
Figure 24 shows the simulated temperature variations inside the bedroom and living room based on the established position of the solar Trombe wall, as well as inside the grouped zones. It can be seen that for two sunny days (Days 307 and 308), as the outdoor air temperature Text decreased, the setpoint comfort temperature Tcmax (Tcmax = Tc + 3.5 °C) also decreased; however, the indoor temperatures increased due to the sunlight. Based on the temperature variation curves, the thermal zone (either the bedroom or living room) fitted with the solar Trombe wall increases indoor temperatures and generates a temperature discomfort (overheating), that is, exceeding the setpoint comfort temperature Tcmax for the two sunny days (Days 307 and 308). Table 12 reports the number of hours of temperature discomfort inside the bedroom, living room and grouped zones; these figures reveal that the number of hours of discomfort is higher in the zone fitted with the solar Trombe wall. Furthermore, the number of hours of discomfort (reaching 108) is also noteworthy for the specific case of grouping the bedroom and living room zones.

4. Conclusions

This study has conducted the dynamic thermal simulations of a French Low Consumption Building (LCB) house. The objective was to demonstrate the benefit of a solar Trombe wall installation on the annual heating energy demands. The other aspect examined herein consisted of comparing simulation results of the model house with the PCM integrated into the solar Trombe wall; this comparison focused on heating energy demands, energy savings and the number of hours of temperature discomfort. The design house was modeled with the thermal simulation software Dymola/Modelica. Moreover, the numerical model of the solar Trombe wall was developed and validated using experimental data from previous studies [38,89].
To carry out the study, a detached single-family house was divided into three thermal zones, and various configurations were applied. Three distinct climatic conditions were chosen in this study to simulate and analyze energy performance—Paris in the north, Lyon the center, and Nice the south of France. The three specified configurations are as follows:
  • Simulation of the house without a solar Trombe wall—Configuration 1;
  • Simulation of the house with a solar Trombe wall yet PCM (either concrete or mortar storage wall)—Configuration 2;
  • Simulation of the house with a solar Trombe wall integrating the PCM storage wall—Configuration 3.
An analysis of the results has indicated that the installation of a solar Trombe wall, regardless of the configuration (concrete, mortar with or without PCM) makes it feasible to reduce the heating energy demands in the bedroom on the order of 20 to 30% depending on the climate zone. PCM introduction into the mortar has, however, a rather weak effect on heating energy demands (reduction on the order of 2% compared to mortar alone), but the energy heating demands are closely replicated with installation of a concrete storage wall.
For a storage wall with 4 cm of mortar, the overheating generated in the zone containing the solar Trombe wall is very pronounced. It abates somewhat if air is circulating between the rooms of the house. This finding is also valid when integrating PCM microcapsules into the mortar, even though the temperature varies slightly less. The 4-cm thick PCM storage wall does not yield a thermal behavior in the room close to that of the 15-cm thick concrete storage wall. The concrete solar Trombe wall releases and extends the thermal energy much later into the room; therefore, it allows limiting the periods of discomfort while offering the same energy efficiency.
It is important to highlight from the various results reported that the solar wall should not be expected to deliver maximum energy, but instead serve as an energy source when heating is required. It is thus possible to prevent overheating and delay switching on the heating system in order to save energy.
Moreover, it is interesting to note that even if the variable setpoint temperature with night and day reductions were to be applied, the solar Trombe wall would retain its potential to reduce heating energy demands, regardless of the climate zone.

Author Contributions

Methodology, E.L., P.T., L.Z. and S.L.; software, E.L. and P.T.; writing—original draft preparation, E.L.; writing—review and editing, P.T., L.Z. and S.L.; visualization, E.L. and P.T.; supervision, P.T., L.Z. and S.L.; funding acquisition, L.Z. All authors have read and agreed to the published version of the manuscript.

Funding

The authors would like to thank the Hauts-de-France Region and the University of Artois for funding Enghok LEANG’s doctoral contract.

Acknowledgments

The authors are grateful to BASF for the provision of PCM.

Conflicts of Interest

The authors hereby declare no conflict of interest. This study’s financial sponsors had no role in designing the study, nor in the collection, analysis or interpretation of data, nor in writing the manuscript, nor in the decision to publish the results.

Nomenclature

Symbols:
cspecific heat capacity, J/kg K
csolidspecific heat capacity when PCM is in the solid state, J/kg K
cliquidspecific heat capacity when PCM is in the liquid state, J/kg K
ethickness, m
Hheight, m
LAlatent heat, J/kg
Ppower supplied by composite Trombe wall, W
Qenergy, J
Ttemperature, °C
TCcomfort temperature, °C
TRMrunning mean temperature, °C
TDMdaily mean temperature, °C
ttime, s
Wwidth, m
Greek symbols
αabsorptivity
εemissivity
λthermal conductivity, W/m K
ρdensity, kg/m3
Subscripts
bedbedroom
ccomfort
extexterior
flcfloor concrete
frframe
glwglass wool
heaheating
lvlower vent (inlet of ventilated air layer)
livliving room
maxmaximum
nornorth-facing rooms
livliving room
supsupply
uvupper vent (outlet of ventilated air layer)
Abbreviations
M_PCMcomposite material: mortar + PCM
PCMphase change material
Ufactor of frame window

References

  1. Heating & Cooling—Facts and Figures. 2017. Library Catalog: Section: Brochures. Available online: www.euroheat.org (accessed on 17 May 2020).
  2. European Commission. Directive (EU) 2018/884 of the European Parliament and of the Council of 30 May 2018 Amending Directive 2010/31/EU on the Energy Performance of Buildings and Directive 2012/27/EU on Energy Efficiency; Official Journal of the European Union: Brussel, Belgium, 2018; p. 17. [Google Scholar]
  3. Gracia, A.D.; Cabeza, L.F. Phase change materials and thermal energy storage for buildings. Energy Build. 2015, 103, 414–419. [Google Scholar] [CrossRef] [Green Version]
  4. Faraj, K.; Khaled, M.; Faraj, J.; Hachem, F.; Castelain, C. Phase change material thermal energy storage systems for cooling applications in buildings: A review. Renew. Sustain. Energy Rev. 2020, 119, 109579. [Google Scholar] [CrossRef]
  5. Du, K.; Calautit, J.; Wang, Z.; Wu, Y.; Liu, H. A review of the applications of phase change materials in cooling, heating and power generation in different temperature ranges. Appl. Energy 2018, 220, 242–273. [Google Scholar] [CrossRef]
  6. Souayfane, F.; Fardoun, F.; Biwole, P.H. Phase change materials (PCM) for cooling applications in buildings: A review. Energy Build. 2016, 129, 396–431. [Google Scholar] [CrossRef]
  7. Osterman, E.; Tyagi, V.V.; Butala, V.; Rahim, N.A.; Stritih, U. Review of PCM based cooling technologies for buildings. Energy Build. 2012, 49, 37–49. [Google Scholar] [CrossRef]
  8. Soares, N.; Costa, J.J.; Gaspar, A.R.; Santos, P. Review of passive PCM latent heat thermal energy storage systems towards buildings’ energy efficiency. Energy Build. 2013, 59, 82–103. [Google Scholar] [CrossRef]
  9. Zhou, D.; Zhao, C.Y.; Tian, Y. Review on thermal energy storage with phase change materials (PCMs) in building applications. Appl. Energy 2012, 92, 593–605. [Google Scholar] [CrossRef] [Green Version]
  10. Rodriguez-Ubinas, E.; Ruiz-Valero, L.; Vega, S.; Neila, J. Applications of Phase Change Material in highly energy-efficient houses. Energy Build. 2012, 50, 49–62. [Google Scholar] [CrossRef]
  11. Kuznik, F.; David, D.; Johannes, K.; Roux, J.J. A review on phase change materials integrated in building walls. Renew. Sustain. Energy Rev. 2011, 15, 379–391. [Google Scholar] [CrossRef] [Green Version]
  12. Tyagi, V.V.; Kaushik, S.C.; Tyagi, S.K.; Akiyama, T. Development of phase change materials based microencapsulated technology for buildings: A review. Renew. Sustain. Energy Rev. 2011, 15, 1373–1391. [Google Scholar] [CrossRef]
  13. Faraji, M. Numerical study of the thermal behavior of a novel Composite PCM/concrete wall. Energy Procedia 2017, 139, 105–110. [Google Scholar] [CrossRef]
  14. David, D.; Kuznik, F.; Roux, J.J. Numerical study of the influence of the convective heat transfer on the dynamical behaviour of a phase change material wall. Appl. Therm. Eng. 2011, 31, 3117–3124. [Google Scholar] [CrossRef] [Green Version]
  15. Diaconu, B.M.; Cruceru, M. Novel concept of composite phase change material wall system for year-round thermal energy savings. Energy Build. 2010, 42, 1759–1772. [Google Scholar] [CrossRef]
  16. Diaconu, B.M. Thermal energy savings in buildings with PCM-enhanced envelope: Influence of occupancy pattern and ventilation. Energy Build. 2011, 43, 101–107. [Google Scholar] [CrossRef]
  17. Mourid, A.; Alami, M.E.; Kuznik, F. Experimental investigation on thermal behavior and reduction of energy consumption in a real scale building by using phase change materials on its envelope. Sustain. Cities Soc. 2018, 41, 35–43. [Google Scholar] [CrossRef]
  18. Li, Y.; Zhou, J.; Long, E.; Meng, X. Experimental study on thermal performance improvement of building envelopes by integrating with phase change material in an intermittently heated room. Sustain. Cities Soc. 2018, 38, 607–615. [Google Scholar] [CrossRef]
  19. Shi, X.; Memon, S.A.; Tang, W.; Cui, H.; Xing, F. Experimental assessment of position of macro encapsulated phase change material in concrete walls on indoor temperatures and humidity levels. Energy Build. 2014, 71, 80–87. [Google Scholar] [CrossRef]
  20. Lee, K.O.; Medina, M.A.; Raith, E.; Sun, X. Assessing the integration of a thin phase change material (PCM) layer in a residential building wall for heat transfer reduction and management. Appl. Energy 2015, 137, 699–706. [Google Scholar] [CrossRef]
  21. Sun, X.; Medina, M.A.; Lee, K.O.; Jin, X. Laboratory assessment of residential building walls containing pipe-encapsulated phase change materials for thermal management. Energy 2018, 163, 383–391. [Google Scholar] [CrossRef]
  22. Guarino, F.; Athienitis, A.; Cellura, M.; Bastien, D. PCM thermal storage design in buildings: Experimental studies and applications to solaria in cold climates. Appl. Energy 2017, 185, 95–106. [Google Scholar] [CrossRef]
  23. Sayyar, M.; Weerasiri, R.R.; Soroushian, P.; Lu, J. Experimental and numerical study of shape-stable phase-change nanocomposite toward energy-efficient building constructions. Energy Build. 2014, 75, 249–255. [Google Scholar] [CrossRef]
  24. Koo, J.; So, H.; Hong, S.W.; Hong, H. Effects of wallboard design parameters on the thermal storage in buildings. Energy Build. 2011, 43, 1947–1951. [Google Scholar] [CrossRef]
  25. Borreguero, A.M.; Sánchez, M.L.; Valverde, J.L.; Carmona, M.; Rodríguez, J.F. Thermal testing and numerical simulation of gypsum wallboards incorporated with different PCMs content. Appl. Energy 2011, 88, 930–937. [Google Scholar] [CrossRef]
  26. Kuznik, F.; Virgone, J.; Johannes, K. In-situ study of thermal comfort enhancement in a renovated building equipped with phase change material wallboard. Renew. Energy 2011, 36, 1458–1462. [Google Scholar] [CrossRef] [Green Version]
  27. Mandilaras, I.; Stamatiadou, M.; Katsourinis, D.; Zannis, G.; Founti, M. Experimental thermal characterization of a Mediterranean residential building with PCM gypsum board walls. Build. Environ. 2013, 61, 93–103. [Google Scholar] [CrossRef]
  28. Berthou, Y.; Biwole, P.H.; Achard, P.; Sallée, H.; Tantot-Neirac, M.; Jay, F. Full scale experimentation on a new translucent passive solar wall combining silica aerogels and phase change materials. Sol. Energy 2015, 115, 733–742. [Google Scholar] [CrossRef] [Green Version]
  29. Zwanzig, S.D.; Lian, Y.; Brehob, E.G. Numerical simulation of phase change material composite wallboard in a multi-layered building envelope. Energy Convers. Manag. 2013, 69, 27–40. [Google Scholar] [CrossRef] [Green Version]
  30. Thiele, A.M.; Jamet, A.; Sant, G.; Pilon, L. Annual energy analysis of concrete containing phase change materials for building envelopes. Energy Convers. Manag. 2015, 103, 374–386. [Google Scholar] [CrossRef]
  31. Wang, X.; Yu, H.; Li, L.; Zhao, M. Experimental assessment on the use of phase change materials (PCMs)-bricks in the exterior wall of a full-scale room. Energy Convers. Manag. 2016, 120, 81–89. [Google Scholar] [CrossRef]
  32. Hu, Z.; He, W.; Ji, J.; Zhang, S. A review on the application of Trombe wall system in buildings. Renew. Sustain. Energy Rev. 2017, 70, 976–987. [Google Scholar] [CrossRef]
  33. Saadatian, O.; Sopian, K.; Lim, C.H.; Asim, N.; Sulaiman, M.Y. Trombe walls: A review of opportunities and challenges in research and development. Renew. Sustain. Energy Rev. 2012, 16, 6340–6351. [Google Scholar] [CrossRef]
  34. Zrikem, Z.; Bilgen, E. Theoretical study of a composite Trombe-Michel wall solar collector system. Sol. Energy 1987, 39, 409–419. [Google Scholar] [CrossRef]
  35. Mazria, E. Passive Solar Energy Book; Rodale Press: Emmaus, PA, USA, 1979. [Google Scholar]
  36. Ma, Q.; Fukuda, H.; Wei, X.; Hariyadi, A. Optimizing energy performance of a ventilated composite Trombe wall in an office building. Renew. Energy 2019, 134, 1285–1294. [Google Scholar] [CrossRef]
  37. Corasaniti, S.; Manni, L.; Russo, F.; Gori, F. Numerical simulation of modified Trombe-Michel Walls with exergy and energy analysis. Int. Commun. Heat Mass Transf. 2017, 88, 269–276. [Google Scholar] [CrossRef]
  38. Shen, J.; Lassue, S.; Zalewski, L.; Huang, D. Numerical study on thermal behavior of classical or composite Trombe solar walls. Energy Build. 2007, 39, 962–974. [Google Scholar] [CrossRef]
  39. Zalewski, L.; Chantant, M.; Lassue, S.; Duthoit, B. Experimental thermal study of a solar wall of composite type. Energy Build. 1997, 25, 7–18. [Google Scholar] [CrossRef]
  40. Zalewski, L. Etude Thermique Expérimentale et Simulation Numérique d’un mur Solaire Composite: Optimisation des Performances Énergétiques. Ph.D. Thesis, Artois University, Arras, France, 1996. [Google Scholar]
  41. Leang, E.; Tittelein, P.; Zalewski, L.; Lassue, S. Numerical study of a composite Trombe solar wall integrating microencapsulated PCM. Energy Procedia 2017, 122, 1009–1014. [Google Scholar] [CrossRef]
  42. Zalewski, L.; Joulin, A.; Lassue, S.; Dutil, Y.; Rousse, D. Experimental study of small-scale solar wall integrating phase change material. Sol. Energy 2012, 86, 208–219. [Google Scholar] [CrossRef]
  43. Li, W.; Chen, W. Numerical analysis on the thermal performance of a novel PCM-encapsulated porous heat storage Trombe-wall system. Sol. Energy 2019, 188, 706–719. [Google Scholar] [CrossRef]
  44. Shen, J.; Lassue, S.; Zalewski, L.; Huang, D. Numerical study of classical and composite solar walls by TRNSYS. J. Therm. Sci. 2007, 16, 46–55. [Google Scholar] [CrossRef]
  45. Zalewski, L.; Lassue, S.; Duthoit, B.; Butez, M. Study of solar walls—Validating a simulation model. Build. Environ. 2002, 37, 109–121. [Google Scholar] [CrossRef]
  46. Shen, P.; Braham, W.; Yi, Y. Development of a lightweight building simulation tool using simplified zone thermal coupling for fast parametric study. Appl. Energy 2018, 223, 188–214. [Google Scholar] [CrossRef]
  47. Evola, G.; Marletta, L.; Sicurella, F. A methodology for investigating the effectiveness of PCM wallboards for summer thermal comfort in buildings. Build. Environ. 2013, 59, 517–527. [Google Scholar] [CrossRef]
  48. Tabares-Velasco, P.C.; Christensen, C.; Bianchi, M. Verification and validation of EnergyPlus phase change material model for opaque wall assemblies. Build. Environ. 2012, 54, 186–196. [Google Scholar] [CrossRef]
  49. Alam, M.; Sanjayan, J.; Zou, P.X.W.; Ramakrishnan, S.; Wilson, J. A Comparative Study on the Effectiveness of Passive and Free Cooling Application Methods of Phase Change Materials for Energy Efficient Retrofitting in Residential Buildings. Procedia Eng. 2017, 180, 993–1002. [Google Scholar] [CrossRef]
  50. Evola, G.; Marletta, L.; Sicurella, F. Simulation of a ventilated cavity to enhance the effectiveness of PCM wallboards for summer thermal comfort in buildings. Energy Build. 2014, 70, 480–489. [Google Scholar] [CrossRef]
  51. Park, J.H.; Jeon, J.; Lee, J.; Wi, S.; Yun, B.Y.; Kim, S. Comparative analysis of the PCM application according to the building type as retrofit system. Build. Environ. 2019, 151, 291–302. [Google Scholar] [CrossRef]
  52. Mi, X.; Liu, R.; Cui, H.; Memon, S.A.; Xing, F.; Lo, Y. Energy and economic analysis of building integrated with PCM in different cities of China. Appl. Energy 2016, 175, 324–336. [Google Scholar] [CrossRef]
  53. Sage-Lauck, J.S.; Sailor, D.J. Evaluation of phase change materials for improving thermal comfort in a super-insulated residential building. Energy Build. 2014, 79, 32–40. [Google Scholar] [CrossRef]
  54. Alam, M.; Jamil, H.; Sanjayan, J.; Wilson, J. Energy saving potential of phase change materials in major Australian cities. Energy Build. 2014, 78, 192–201. [Google Scholar] [CrossRef]
  55. Fiorito, F. Phase-change Materials for Indoor Comfort Improvement in Lightweight Buildings. A Parametric Analysis for Australian Climates. Energy Procedia 2014, 57, 2014–2022. [Google Scholar] [CrossRef] [Green Version]
  56. Schossig, P.; Henning, H.M.; Gschwander, S.; Haussmann, T. Micro-encapsulated phase-change materials integrated into construction materials. Sol. Energy Mater. Sol. Cells 2005, 89, 297–306. [Google Scholar] [CrossRef]
  57. Hoes, P.; Trcka, M.; Hensen, J.L.M.; Bonnema, B.H. Investigating the potential of a novel low-energy house concept with hybrid adaptable thermal storage. Energy Convers. Manag. 2011, 52, 2442–2447. [Google Scholar] [CrossRef] [Green Version]
  58. Heim, D.; Clarke, J.A. Numerical modelling and thermal simulation of PCM—Gypsum composites with ESP-r. Energy Build. 2004, 36, 795–805. [Google Scholar] [CrossRef]
  59. Heim, D. Isothermal storage of solar energy in building construction. Renew. Energy 2010, 35, 788–796. [Google Scholar] [CrossRef]
  60. Ahmad, M.; Bontemps, A.; Sallée, H.; Quenard, D. Thermal testing and numerical simulation of a prototype cell using light wallboards coupling vacuum isolation panels and phase change material. Energy Build. 2006, 38, 673–681. [Google Scholar] [CrossRef] [Green Version]
  61. Ibáñez, M.; Lázaro, A.; Zalba, B.; Cabeza, L.F. An approach to the simulation of PCMs in building applications using TRNSYS. Appl. Therm. Eng. 2005, 25, 1796–1807. [Google Scholar] [CrossRef]
  62. Koschenz, M.; Lehmann, B. Development of a thermally activated ceiling panel with PCM for application in lightweight and retrofitted buildings. Energy Build. 2004, 36, 567–578. [Google Scholar] [CrossRef]
  63. Kuznik, F.; Virgone, J.; Johannes, K. Development and validation of a new TRNSYS type for the simulation of external building walls containing PCM. Energy Build. 2010, 42, 1004–1009. [Google Scholar] [CrossRef] [Green Version]
  64. Bontemps, A.; Ahmad, M.; Johannès, K.; Sallée, H. Experimental and modelling study of twin cells with latent heat storage walls. Energy Build. 2011, 43, 2456–2461. [Google Scholar] [CrossRef]
  65. Stritih, U.; Tyagi, V.V.; Stropnik, R.; Paksoy, H.; Haghighat, F.; Joybari, M.M. Integration of passive PCM technologies for net-zero energy buildings. Sustain. Cities Soc. 2018, 41, 286–295. [Google Scholar] [CrossRef]
  66. Abbassi, F.; Dimassi, N.; Dehmani, L. Energetic study of a Trombe wall system under different Tunisian building configurations. Energy Build. 2014, 80, 302–308. [Google Scholar] [CrossRef]
  67. Derradji, L.; Errebai, F.B.; Amara, M. Effect of PCM in Improving the Thermal Comfort in Buildings. Energy Procedia 2017, 107, 157–161. [Google Scholar] [CrossRef]
  68. He, X.; Chen, S.; Lv, X.; Kim, E.J. Simplified Model of HVAC Load Prediction for Urban Building Districts. Procedia Eng. 2015, 121, 167–174. [Google Scholar] [CrossRef]
  69. Andriamamonjy, A.; Saelens, D.; Klein, R. An automated IFC-based workflow for building energy performance simulation with Modelica. Autom. Constr. 2018, 91, 166–181. [Google Scholar] [CrossRef]
  70. Jaeger, I.D.; Reynders, G.; Ma, Y.; Saelens, D. Impact of building geometry description within district energy simulations. Energy 2018, 158, 1060–1069. [Google Scholar] [CrossRef]
  71. Frayssinet, L.; Kuznik, F.; Hubert, J.L.; Milliez, M.; Roux, J.J. Adaptation of building envelope models for energy simulation at district scale. Energy Procedia 2017, 122, 307–312. [Google Scholar] [CrossRef]
  72. Maccarini, A.; Wetter, M.; Afshari, A.; Hultmark, G.; Bergsøe, N.C.; Vorre, A. Energy saving potential of a two-pipe system for simultaneous heating and cooling of office buildings. Energy Build. 2017, 134, 234–247. [Google Scholar] [CrossRef] [Green Version]
  73. Bünning, F.; Wetter, M.; Fuchs, M.; Müller, D. Bidirectional low temperature district energy systems with agent-based control: Performance comparison and operation optimization. Appl. Energy 2018, 209, 502–515. [Google Scholar] [CrossRef] [Green Version]
  74. Bünning, F.; Sangi, R.; Müller, D. A Modelica library for the agent-based control of building energy systems. Appl. Energy 2017, 193, 52–59. [Google Scholar] [CrossRef]
  75. Perera, D.W.U.; Winkler, D.; Skeie, N.O. Multi-floor building heating models in MATLAB and Modelica environments. Appl. Energy 2016, 171, 46–57. [Google Scholar] [CrossRef]
  76. Delgoshaei, P.; Heidarinejad, M.; Austin, M.A. Semantic Inference-Based Control Strategies for Building HVAC Systems Using Modelica-Based Physical Models. Procedia Eng. 2017, 205, 1975–1982. [Google Scholar] [CrossRef]
  77. Fu, Y.; Zuo, W.; Wetter, M.; VanGilder, J.W.; Han, X.; Plamondon, D. Equation-based object-oriented modeling and simulation for data center cooling: A case study. Energy Build. 2019, 186, 108–125. [Google Scholar] [CrossRef]
  78. Maccarini, A.; Hultmark, G.; Bergsøe, N.C.; Afshari, A. Free cooling potential of a PCM-based heat exchanger coupled with a novel HVAC system for simultaneous heating and cooling of buildings. Sustain. Cities Soc. 2018, 42, 384–395. [Google Scholar] [CrossRef]
  79. Schweiger, G.; Larsson, P.O.; Magnusson, F.; Lauenburg, P.; Velut, S. District heating and cooling systems—Framework for Modelica-based simulation and dynamic optimization. Energy 2017, 137, 566–578. [Google Scholar] [CrossRef]
  80. Sodja, A.; Zupančič, B. Modelling thermal processes in buildings using an object-oriented approach and Modelica. Simul. Model. Pract. Theory 2009, 17, 1143–1159. [Google Scholar] [CrossRef]
  81. Tian, W.; Sevilla, T.A.; Zuo, W.; Sohn, M.D. Coupling fast fluid dynamics and multizone airflow models in Modelica Buildings library to simulate the dynamics of HVAC systems. Build. Environ. 2017, 122, 269–286. [Google Scholar] [CrossRef]
  82. Gonzaléz, D.F.; Yebra, L.J. Comparison case between Modelica and specialized tools for building modelling. IFAC Pap. 2015, 48, 874–879. [Google Scholar] [CrossRef]
  83. Vautherot, M.; Maréchal, F.; Farid, M.M. Analysis of energy requirements versus comfort levels for the integration of phase change materials in buildings. J. Build. Eng. 2015, 1, 53–62. [Google Scholar] [CrossRef] [Green Version]
  84. Wetter, M.; Haugstetter, C. Modelica versus trnsys—A comparison between an equation-based and a procedural modeling language for building energy simulation. Proc. SimBuild 2006, 2. Available online: http://www.ibpsa-usa.org/index.php/ibpusa/article/view/220 (accessed on 14 July 2019).
  85. Burhenne, S.; Wystrcil, D.; Elci, M.; Narmsara, S.; Herkel, S. Building performance simulation using Modelica: Analysis of the current state and application areas. In Proceedings of the BS2013: 13th Conference of International Building Performance Simulation Association, Chambéry, France, 25–28 August 2013; pp. 26–28. [Google Scholar]
  86. Wetter, M. Multi-zone Building Model for Thermal Building Simulation. In Proceedings of the 5th International Modelica Conference, Vienna, Austria, 4 September 2006; pp. 517–526. [Google Scholar]
  87. Wetter, M.; Zuo, W.; Nouidui, T.S.; Pang, X. Modelica Buildings library. J. Build. Perform. Simul. 2014, 7, 253–270. [Google Scholar] [CrossRef]
  88. Baetens, R. Openideas—An Open Framework for Integrated District Energy Simulations. In Proceedings of the BS2015: 14th Conference of International Building Performance Simulation Association, Hyderabad, India, 7–9 December 2015; p. 8. [Google Scholar]
  89. Leang, E.; Tittelein, P.; Zalewski, L.; Lassue, S. Numerical and Experimental Investigations of Composite Solar Walls Integrating Sensible or Latent Heat Thermal Storage. Appl. Sci. 2020, 10, 1854. [Google Scholar] [CrossRef] [Green Version]
  90. Churchill, S.W.; Chu, H.H.S. Correlating equations for laminar and turbulent free convection from a vertical plate. Int. J. Heat Mass Transf. 1975, 18, 1323–1329. [Google Scholar] [CrossRef]
  91. Joulin, A.; Zalewski, L.; Lassue, S.; Naji, H. Experimental investigation of thermal characteristics of a mortar with or without a micro-encapsulated phase change material. Appl. Therm. Eng. 2014, 66, 171–180. [Google Scholar] [CrossRef]
  92. Zalewski, L.; Franquet, E.; Gibout, S.; Tittelein, P.; Defer, D. Efficient Characterization of Macroscopic Composite Cement Mortars with Various Contents of Phase Change Material. Appl. Sci. 2019, 9, 1104. [Google Scholar] [CrossRef] [Green Version]
  93. Ministry of Urban Planning and Housing. Arrêté du 24 Mars 1982 Relatives a L’aeration des Logements: Aeration Generale ou Permanente, Aeration Permanente Pouvant etre Limitee a Certaines Pieces. Legifrance 1982, R119-2. [Google Scholar]
  94. Weather Data by Location|EnergyPlus. Available online: https://energyplus.net/weather (accessed on 14 July 2019).
  95. Association Française de Normalisation. NBN EN 15251:2007: Critères d’ambiance Intérieure; Afnor éd.: La Plaine-Saint-Denis, France, 2007. [Google Scholar]
  96. McCartney, K.J.; Nicol, J.F. Developing an adaptive control algorithm for Europe. Energy Build. 2002, 34, 623–635. [Google Scholar] [CrossRef]
Figure 1. 3D house layout.
Energies 13 04872 g001
Figure 2. Modeled house using the Dymola Building Library.
Energies 13 04872 g002
Figure 3. Vertical cross-section of the composite Trombe wall.
Energies 13 04872 g003
Figure 4. Monthly maximum horizontal global solar fluxes for the weather of Paris-Orly, Lyon, and Nice.
Energies 13 04872 g004
Figure 5. Monthly average outdoor temperatures for the weather of Paris-Orly, Lyon, and Nice.
Energies 13 04872 g005
Figure 6. Temperature variations inside the bedroom, the living room, and the north-facing rooms for the simulation of the reference case versus Text. Text denotes the variation in outdoor air temperature.
Energies 13 04872 g006
Figure 7. Variations in heating power inside the bedroom, living room and north-facing rooms for the thermal simulation of the reference case.
Energies 13 04872 g007
Figure 8. Duration curve of heating energy inside the bedroom, living room and north-facing rooms.
Energies 13 04872 g008
Figure 9. Comparison of the power supplied and air temperature at the upper vent of the ventilated air gap over four sunny days (from Day 98 to Day 101).
Energies 13 04872 g009
Figure 10. Fluctuations of the airflow rate in the ventilated air gap of the solar Trombe wall fitted with the concrete storage wall (blue) and the mortar storage wall (red).
Energies 13 04872 g010
Figure 11. Temperatures inside the bedroom and air temperatures exiting the upper vent of the composite Trombe walls.
Energies 13 04872 g011
Figure 12. Time lags to recover heating inside bedrooms equipped with the composite Trombe wall vs. the reference case.
Energies 13 04872 g012
Figure 13. Comparison of temperatures in the living room and north-facing rooms for the case of the bedroom equipped both with and without the concrete solar Trombe wall.
Energies 13 04872 g013
Figure 14. Comparison of temperatures in the living room and north-facing rooms for the case of the bedroom equipped both with and without the mortar solar Trombe wall.
Energies 13 04872 g014
Figure 15. Comparison of power supplied from the solar Trombe wall both with and without phase change materials (PCM).
Energies 13 04872 g015
Figure 16. Comparison of temperature variations inside the bedroom both with and without application of the solar Trombe wall.
Energies 13 04872 g016
Figure 17. Time lags of various ending temperatures inside the bedroom fitted with the PCM, concrete, and mortar solar Trombe walls vs. the reference case (no solar Trombe wall).
Energies 13 04872 g017
Figure 18. Comparison of temperatures in the living room and north-facing rooms for the case of the bedroom equipped both with and without the PCM solar Trombe wall.
Energies 13 04872 g018
Figure 19. Comparison of temperatures in the living room and north-facing rooms for the case of the bedroom fitted with the PCM and concrete solar Trombe walls.
Energies 13 04872 g019
Figure 20. Comparison of temperatures in the living room and north-facing rooms for the case of the bedroom fitted with the PCM and mortar solar Trombe walls.
Energies 13 04872 g020
Figure 21. Comparison of monthly heating energy demands in the bedroom.
Energies 13 04872 g021
Figure 22. Comparison of monthly heating energy demands in the living room.
Energies 13 04872 g022
Figure 23. Comparison of monthly heating energy demands in the north-facing rooms.
Energies 13 04872 g023
Figure 24. Temperature discomfort in the bedroom and living room relative to changes in the position of the solar Trombe wall, and temperature discomfort in the grouped zones. Text denotes the outdoor air temperature; Tcmax denotes the setpoint comfort temperature.
Energies 13 04872 g024
Table 1. Constructive characteristics of the studied house.
EnvelopeComposition, from Exterior to Interior
Exterior wall2 cm of wood
3 cm of non-ventilated air gap
15 cm of glass wool
1 cm of OSB.
Interior partition7 cm of plaster tile.
Floor10 cm of glass wool
20 cm of concrete
2 cm of tile.
Ceiling20 cm of glass wool
1 cm of plaster.
Table 2. Thermal characteristics of house envelope components.
MaterialSymbolExplanationUnitsValue
Wood ρ w o o d volumetric densitykg/m3650
c w o o d specific heatJ/kg · K2100
λ w o o d thermal conductivityW/m · K0.23
Air ρ a i r volumetric densitykg/m31
c a i r specific heatJ/kg · K1000
λ a i r thermal conductivityW/m · K0.19
Glass wool ρ g l w volumetric densitykg/m335
c g l w specific heatJ/kg · K1030
λ g l w thermal conductivityW/m · K0.039
OSB ρ O S B volumetric densitykg/m3650
c O S B specific heatJ/kg · K1700
λ O S B thermal conductivityW/m · K0.13
Plaster tile ρ p l a s t e r volumetric densitykg/m31000
c p l a s t e r specific heatJ/kg · K800
λ p l a s t e r thermal conductivityW/m · K0.35
Floor concrete ρ f l c volumetric densitykg/m32300
c f l c specific heatJ/kg · K920
λ f l c thermal conductivityW/m · K1.75
Tile ρ t i l e volumetric densitykg/m32300
c t i l e specific heatJ/kg · K700
λ t i l e thermal conductivityW/m · K1.7
Table 3. Description of the windows used in the studied house.
DescriptionSymbolAreaOrientation
Bedroom window W b e d 0.8 (W) × 2.15 (H) m2south
Living room window W 1 l i v 3 (W) × 2.15 (H) m2south
Living room window W 2 l i v 0.8 (W) × 2.15 (H) m2east
North rooms window W 1 n o r 0.6 (W) × 1.15 (H) m2east
North rooms window W 2 n o r 5 (W) × 1 (H) m2north
Table 4. Thermal properties of the construction materials used in the solar Trombe wall.
MaterialSymbolDescriptionUnitsValue
Glazing ρ g volumetric densitykg/m32500
c g specific heat capacityJ/(kg·K)830
λ g thermal conductivityW/(m·K)1.47
α g absorptivity-0.84
τ g transmissivity-0.76
ε g emissivity-0.84
Mortar + PCM ρ m _ p c m volumetric densitykg/m31329
c s o l i d specific heat in the solid stateJ/kg·K1178
c l i q u i d specific heat in the liquid stateJ/kg·K1150
L A latent heatJ/kg17,100
T A melting temperature of the pure substance°C27.37
T M end of melting temperature°C25.83
e m _ p c m thicknessm0.04
λ m _ p c m thermal conductivityW/(m·K)0.62
α m _ p c m solar absorption coefficient-0.9
ε m _ p c m emissivity-0.9
Concrete ρ c o n c r e t e volumetric densitykg/m31900
c c o n c r e t e specific heatJ/kg·K949
e c o n c r e t e thicknessm0.15
λ c o n c r e t e thermal conductivityW/(m·K)0.82
α c o n c r e t e absorptivity-0.9
ε c o n c r e t e emissivity-0.9
Mortar ρ m o r t a r volumetric densitykg/m31329
c m o r t a r specific heatJ/kg·K1178
e m o r t a r thicknessm0.04
λ m o r t a r thermal conductivityW/(m·K)0.62
α m o r t a r absorptivity-0.9
ε m o r t a r emissivity-0.9
Insulating wall ρ i n s volumetric densitykg/m330
c i n s specific heat capacityJ/(kg·K)880
λ i n s thermal conductivityW/(m·K)0.041
α i n s absorptivity-0.9
ε i n s emissivity-0.9
Table 5. Summary table for the three configurations.
Configuration 1Configuration 2Configuration 3
Simulation time1 year1 year1 year
Composite Trombe wallConcreteMortar + PCM
WeatherParis-OrlyParis-OrlyParis-Orly
LyonLyonLyon
NiceNiceNice
Constant setpoint T20 °C20 °C20 °C
Variable setpoint T19–16 °C19–16 °C19–16 °C
Table 6. One-year heating energy demands inside the bedroom, living room and north-facing rooms for the reference case.
ZoneHeating Energy DemandsUnits
Bedroom66.7kWh/m2/year
Living room68.4kWh/m2/year
North-facing rooms75.7kWh/m2/year
Table 7. Annual heating demands in the bedroom, living room and north-facing rooms, for the Paris weather scenario.
ZoneHeating Energy Demands—House with a Concrete Trombe WallHeating Energy Demands—House with a Mortar Trombe WallHeating Energy Demands of the Reference HouseUnits
Bedroom53.154.666.7kWh/m2/year
Living room66.866.368.4kWh/m2/year
North-facing rooms73.872.975.7kWh/m2/year
Table 8. Comparison of the one-year heating energy demands, one-year energy savings and number of hours of temperature discomfort inside the bedroom, living room and north-facing rooms specific to the studied configurations.
ZoneCase StudyHeating Energy DemandsEnergy of SavingsUnits% SavingNo. Hours of Discomfort
BedroomConfiguration 166.69kWh/m2/year0
Configuration 2a53.0513.64kWh/m2/year20.45%35
Configuration 2b54.6012.09kWh/m2/year18.13%262
Configuration 353.4213.27kWh/m2/year19.90%170
Living roomConfiguration 168.42kWh/m2/year35
Configuration 2a66.781.64kWh/m2/year2.40%37
Configuration 2b66.292.13kWh/m2/year3.11%44
Configuration 366.202.22kWh/m2/year3.25%41
North-facing
rooms
Configuration 175.72kWh/m2/year0
Configuration 2a73.781.94kWh/m2/year2.56%0
Configuration 2b72.982.74kWh/m2/year3.62%0
Configuration 373.072.65kWh/m2/year3.50%0
Table 9. Ratio of energy savings, based on the reduced setpoint temperature of 16–19 °C, for the studied configurations (2a, 2b, and 3), compared to Configuration 1 across all three climatic conditions.
ZoneCase StudyHeating Energy DemandsEnergy-SavingsUnits% Savings
Paris-OrlyConfiguration 152.36kWh/m2/year
Configuration 2a41.7110.65kWh/m2/year20.34%
Configuration 2b42.899.74kWh/m2/year18.6%
Configuration 342.529.84kWh/m2/year18.79%
LyonConfiguration 148.31kWh/m2/year
Configuration 2a38.559.76kWh/m2/year20.20%
Configuration 2b39.279.04kWh/m2/year18.71%
Configuration 338.869.45kWh/m2/year19.56%
NiceConfiguration 113.29kWh/m2/year
Configuration 2a4.249.05kWh/m2/year68.10%
Configuration 2b6.556.74kWh/m2/year50.72%
Configuration 35.967.33kWh/m2/year55.15%
Table 10. Ratio of the difference in annual heating energy demands depending on constant vs. reduced setpoint temperatures, as well as on the various configurations and climatic conditions.
ZoneCase StudyHeating Energy Demands
Tsetpoint = 20 °C
Heating Energy Demands
Tsetpoint = 16–19 °C
DifferenceUnits
Paris-OrlyConfiguration 166.6952.3614.33 = 21.49%kWh/m2/year
Configuration 2a53.0541.7111.34 = 21.38%kWh/m2/year
Configuration 2b54.6042.8911.71 = 21.45%kWh/m2/year
Configuration 353.4242.5210.9 = 20.40%kWh/m2/year
LyonConfiguration 161.2448.3112.93 = 21.11%kWh/m2/year
Configuration 2a47.9738.559.42 = 19.64%kWh/m2/year
Configuration 2b49.4439.2710.17 = 20.57%kWh/m2/year
Configuration 348.9938.8610.13 = 20.68%kWh/m2/year
NiceConfiguration 121.0713.297.78 = 36.92%kWh/m2/year
Configuration 2a6.144.241.9 = 30.95%kWh/m2/year
Configuration 2b9.476.552.92 = 30.83%kWh/m2/year
Configuration 38.645.962.68 = 31.02%kWh/m2/year
Table 11. Comparison of the heating energy demands in Paris weather conditions, for the basic case, the case of the living room fitted with a solar Trombe wall, and the case of grouped thermal zones.
in kWh/m2/YearBedroom Heating Energy DemandsLiving Room Heating Energy DemandsNorth-Facing Rooms Heating Energy DemandsTotal
Bedroom equipped with a Trombe wall54.1366.5073.2167.51
Living room equipped with a Trombe wall64.5261.3773.6567.58
Grouped zones (bedroom equipped with a solar Trombe wall + living room)61.0174.5267.25
Table 12. Number of hours of temperature discomfort in the bedroom, living room and grouped thermal zones during the one-year heating period.
Bedroom Equipped with a Solar Trombe WallLiving Room Equipped with a Solar Trombe WallGrouped Zones with a Solar Trombe Wall
BedroomLiving roomBedroomLiving room
Number of hours of temperature discomfort220444175108

