Abstract
Traditional fault indicators based on 3G and 4G cannot send out fault-generated information if the distribution lines are located in the system across remote mountainous or forest areas. Hence, power distribution systems in rural areas only rely on patrol to find faults currently, which wastes time and lacks efficiency. With the development of the Internet of things (IoT) technology, some studies have suggested combining the long-range (LoRa) and the narrowband Internet of Things (NB-IoT) technologies to increase the data transmission distance and reduce the self-built communication system operating cost. In this paper, we propose an optimal configuration scheme for novel intelligent IoT-based fault indicators. The proposed fault indicator combines LoRa and NB-IoT communication technologies with a long communication distance to achieve minimum power consumption and high-efficiency maintenance. Under this given cyber network and physical power distribution network, the whole fault location process depends on the fault indicator placement and the deployment of the communication network. The overall framework and the working principle of the fault indicators based on LoRa and NB-IoT are first illustrated to establish the optimization placement model of the proposed novel IoT-based fault indicator. Secondly, an optimization placement method has been proposed to obtain the optimal number of the acquisition and collection units of the fault indicators, as well as their locations. In the proposed method, the attenuation of the communication network and the power-supply reliability have been specially considered in the fault location process under the investment restrictions of the fault indicators. The effectiveness of the proposed method has been validated by the analysis results in an IEEE Roy Billinton Test System (IEEE-RBTS) typical system.
1. Introduction
The power distribution network has a wide coverage area and the distribution lines always have complicated topological structures. It will take time and effort to locate faults only by means of manual line inspection, which cannot meet the actual requirements of fast power-supply restoration. For this reason, some fault indicating devices, such as fault indicators, have been widely used in the distribution network to realize fast fault localization [1]. The fault indicator is used to quickly locate the fault section once the fault occurs. It is used to detect the electrical quantity of the distribution line in real-time and give an alarm when the fault occurs through a certain fault discrimination algorithm. For short-circuit faults, the fault indicator determines the fault according to the sudden change of the current and the power failure event caused by the protection action. For single-phase grounding faults, the fault indicator detects the fault according to the fault-generated transient zero-sequence currents [2]. Currently, the main wireless communication modes configured for the fault indicator are General Packet Radio Service (GPRS) and 3G/4G. However, there is limited or no communication coverage in remote mountainous or forest areas. Hence, it is impractical to deploy GPRS-based or 3G/4G-based fault indicators in the power distribution network in the abovementioned areas. It is of paramount importance to deal with this problem.
With the rapid growth of the smart grid, the application of Internet of Things (IoT) technology in the power system is currently dynamically developed [3]. At the same time, with the development of fifth-generation evolution (5G), IoT, and mobile computing, low-power wide-area network (LPWAN) communication technology has received increasing attention in recent years [4]. Among them, the long-range (LoRa) spread spectrum modulation technology is a new type of wireless communication technology, which combines digital spread spectrum, digital signal processing, and forward error correction coding technology. It increases the link budget and anti-interference capability in the process of data transmission, thus it is suitable for the IoT network with long-distance data transmission, strong anti-interference capability, and low power consumption [5,6,7]. The narrowband Internet of Things (NB-IoT) technology is a communication technology for offering low-data-rate communication services. It can be directly deployed in the Global System for Mobile Communications (GSM), Universal Mobile Telecommunications System (UMTS), or Long Term Evolution (LTE) network to reduce deployment cost and realize a smooth upgrade [8,9,10,11]. It can be seen that when LoRa and NB-IoT are combined and applied in the power distribution network, it can be also realized to achieve long-distance data transmission and low power consumption in fault localization [12].
Frank et al. [13] have presented the design and achievement of conventional fault indicators. However, the traditional fault indicator is too lagging, because it only relies on turning over cards during the day and flashing lights at night to transmit fault information. With the continuous development of communication technology, remote communication alarm mode is gradually applied to fault indicators. The expansion of distribution automation with communicating fault indicators can be found in [14]. Teng et al. [15] have proposed ZigBee-based fault current indicators because it has the characteristics of easy installation and maintenance, long battery life, and low cost. However, ZigBee has short communication distance, a complex protocol stack, and a long development period. Therefore, it is not suitable for application in overhead line fault indicators. Reference [16], as our former work, has introduced the use of LoRa and NB-IoT technologies for fault indicators. As the two most popular wireless communication technologies, LoRa is much cheaper than NB-IoT, but its quality of service, such as data transmission rate, is not as good as NB-IoT. Therefore, based on the characteristics of application scenarios, which the number of acquisition units is much more than collection units and the quality of service of collection unit is required to be better, we can combine the LoRa and NB-IoT, which is acquisition unit with LoRa and collection unit with NB-IoT to achieve better results. However, the optimal configuration of fault indicators has not been considered in [16]. In order to improve the reliability and reduce the outage time, some studies have focused on the issues of optimal number and position of fault indicators. Nevertheless, the above-mentioned literatures have only focus on the optimal number and position of fault indicators [17,18,19,20] or performance of the communication network [21,22] individually.
The cyber-physical system (CPS) is a kind of more complex large-scale system that can integrate physical processes, computing resources, and communication capabilities [23]. The fault indicator based on LoRa and NB-IoT applies the IoT communication technologies to the traditional power grid, which can be categorized as a kind of CPSs. For the optimal configuration of it, we need to consider the influence of communication reliability and power-supply reliability together. As a result, the determination of the number and position of fault indicators considering communication reliability and power-supply reliability is the goal of the optimization process of fault indicator placement. The solution must achieve two conflicting goals. On the one hand, if a few fault indicators are placed in the network, the communication is unreliable, which will lead to greater power outage losses. On the other hand, if a large number of fault indicators are placed in the network, the power-supply reliability and communication reliability can be guaranteed, thus causing less power failure loss. For this reason, a balance needs to be considered in the fault indicator placement to achieve the minimum economic cost. The reasonable number and location configuration scheme of the acquisition unit and collection unit of the fault indicator on the line has become an urgent problem to be solved to maximize economic benefits on the basis of satisfying power-supply reliability and communication reliability. Therefore, in this paper, a system model considering power-supply reliability and communication reliability will be established and used to obtain the optimal placement of the fault indicators to improve reliability indices with minimum economic cost.
The rest of the paper is organized as follows: In Section 2, the system model and the main working principle are introduced. In Section 3, the objective function and constraint conditions of optimization are described. In Section 4, a case study and simulation results are presented and discussed. Finally, Section 5 concludes the paper.
2. System Module
2.1. The Layout and Working Principle of Fault Indicator Based on LoRa and NB-IoT
Consider a power distribution system that crosses the mountainous or forest areas. In these types of areas, there are some zones with the poor or lack of coverage of communication networks. In such areas, using the traditional fault indicators is impossible. In this paper, an intelligent fault indicator based on LoRa and NB-IoT is introduced. It is composed of the acquisition unit and collection unit. The layout of the acquisition unit is shown in Figure 1. It includes clamping wire structure, indicator light, and circuit board composed of a LoRa chip, single chip microcomputer, and other components. It supplies power through the cooperation of a large-capacity dry battery and line induced current. The layout of the collection unit is shown in Figure 2. There are circuit boards composed of a NB-IoT chip, LoRa chip, single chip microcomputer, and other components inside. It is powered by solar cells and backup batteries. This new type of fault indicator cannot only indicate the fault section by flipping the card but also sends the fault information of the line to the monitoring center in time through the LoRa and NB-IoT communication technologies. As a result, the staff can know exactly which section the fault occurs on in the monitoring center, which can greatly reduce the outage time to improve the reliability and reduce the labor intensity of workers.

Figure 1.
The layout of the acquisition unit of the proposed fault indicator.

Figure 2.
The layout of the collection unit of the proposed fault indicator.
The working principle of the intelligent fault indicator based on LoRa and NB-IoT is shown in Figure 3. The acquisition unit of fault indicator samples current waveform of the line continuously at a frequency of 4 kHz. When a fault occurs on the line, the short-circuit and grounding fault measuring module of the acquisition unit measures the fault signal on time and sends an interrupt signal to the single chip microcomputer, the single chip microcomputer responds to the interrupt, calibrates the fault occurrence time and makes the acquisition unit store the data of 10 cycles before and after the fault occurrence time. Based on this data, the fault location can be judged whether it is upstream or downstream of the fault indicator. Then the acquisition unit sends the judgment information to the nearby collection unit by LoRa communication technology. The collection unit needs to summarize the judgment information sent by the acquisition unit to realize the fault location. The collection unit has LoRa and NB-IoT communication functions and can send the fault information of line to the monitoring center by NB-IoT communication technology. Therefore, the staff can know the fault information of the entire distribution network in the monitoring center.
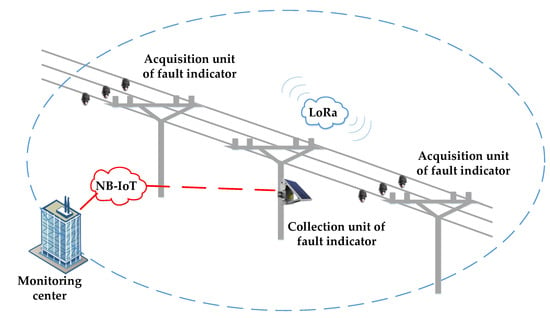
Figure 3.
The working principle of fault indicator based on LoRa and NB-IoT.
2.2. The Placement of Fault Indicator Based on LoRa and NB-IoT
Currently, power companies often install a fault indicator every fixed distance, which lacks scientific and effective methods. The installation method seems simple and effective, and the higher the number of installations, the more accurate the fault localization. However, in fact, the method wastes a large number of manpower and material resources, and the actual effect of fault localization is not obviously improved with the increasing number of installations. Therefore, in the proposed method, the placement of the acquisition unit and collection unit is crucial and needs to be optimized.
The acquisition unit of the fault indicator includes a current acquisition function and a wireless communication function of which the current acquisition function is mainly considered. By adding the number of acquisition units of fault indicators in the distribution network, the location interval of fault section will be smaller and the inspection time will be less, so the outage time will reduce and users of distribution networks will benefit from it. However, it will increase the economic cost. Meanwhile, the more acquisition units are configured, the more collection units need to be configured. Some communication constraints are imposed on the optimization problem due to the need for reliable communications between acquisition units and collection units. Although a collection unit can communicate with acquisition unit within a radius of 10 km (the further the signal is transmitted, the less reliable it is) [24], increasing the acquisition unit number will lead to an increase in the amount of data that the collection unit needs to transmit. However, the communication performance of NB-IoT is certain. Therefore, in order to ameliorate communication reliability, we need to add the number of collection units, which is less economical. Therefore, we need to consider a balance to reasonably configure the number and location of acquisition units and collection units of fault indicators on the line to ensure power-supply reliability and communication reliability together.
3. Problem Formulation
The aim of our work is to present an optimization framework for the optimal number and position of the IoT-based fault indicator in power distribution systems in rural areas. The objective function of this optimization problem is given by
where represents the total cost, which is composed of two main parts: interruption cost () and cost for installing and maintaining the fault indicator (). Therefore, the goal of fault indicator optimization is to minimize the objective function.
The interruption cost () refers to the economic loss caused by the power-supply interruption once the fault occurs. The power loads connected to the faulted section and the downstream sound sections would lose their power supply during the fault seeking and fault resection process. Hence, the consists of and . represents the economic loss caused by the load interruption connected to the faulted section. represents the economic loss caused by the load interruption connected to the downstream sound sections. Thus, the is given by
In addition, the caused by the load interruption connected to the faulted section is given by
where is the time for fault seeking of faulted section , is the time for the fault resection, is failure probability of distribution line consisted of all sections, is electricity price per kWh, represents the amounts of loads connected to the faulted section , represents the number of sections in the distribution lines.
For the faulted section , the caused by the load interruption connected to the other downstream sound sections is given by
where represents the amounts of loads connected to the downstream sound sections, k = l+1, l+2, …, n.
Among them, , , , and the amount of power loads connected to each section are all fixed value, is a variable value, which can be calculated by Equation (5).
where represents the speed of patrolling the line, is the length of subsection in the faulted section , represents the total number of the subsections in the faulted section . Hence, is the total length of all subsections in the faulted section . It is calculated from the upstream subsection where the last fault indicator detects an over-current status to the downstream subsection where the first fault indicator detects an under-current status and includes the subsections where no fault indicator is installed between them.
It should be noted that the fault may occur at any point in the faulted section. We should patrol the faulted section from the beginning to the end, which is identified by two adjacent fault indicators. When the fault point is further located, we do not need to patrol the remaining subsections in the faulted section. Therefore, the actual distance of the section being patrolled will be shorter than the whole length of the faulted section. However, we cannot predict the particular fault position in the faulted section. Hence, we can only use the whole length of all subsections in the faulted section to calculate the fault seeking time. In this way, we get the maximum distance of each subsection in the faulted section needed to be patrolled, which is described as . Then the total distance of the faulted section needed to be patrolled is described as .
Therefore, the total interruption cost (IC) can be expressed by
In addition, in order to consider the influence of communication attenuation, the probability of error in information transmission () is added, which can be expressed by
where is the position of the acquisition unit, is the position of the collection unit, is effective communication distance of LoRa.
As we all know, if the distance between the acquisition unit and the collection unit is farther, the probability of transmission error will be higher. In fact, there is a nonlinear relationship between the probability of error and distance. However, it is difficult for us to obtain the optimal configuration results under the complex nonlinear function. Therefore, we simplify it to a linear model in our proposed model, which is within a distance of 10 km. We also study the impact of the relationship between probability of error and distance on the optimal configuration scheme in 4.4, which shows that the simplified linear relationship between probability of error and distance is appropriate to be used in the optimal configuration scheme of fault indicators.
Equation (7) is obviously a function of the position of the acquisition unit and the collection unit. Therefore, the optimal placement of the acquisition unit and the collection unit helps to keep the communication quality of the collection unit above a certain predetermined level.
Moreover, the interruption cost will be influenced by changing the value of p. If the distance is too long, there will be an error in communication, and the fault indicator will not work properly. As a result, we need to expand the domain of patrolling if we want to locate the fault accurately. Therefore, the length of line that needed to be patrolled will increase and the probability of its increase is p. We assume that the original length of line that we need to patrol is loriginal-a, and the increased length of line that we need to patrol is laddition-a, so the interruption cost will be changed to be expressed by
In order to satisfy the constraints, we assume that loriginal-a ≈ laddition-a = la, so the interruption cost will be expressed by
According to Equation (5), the interruption cost will be expressed by
The second part of the objective function is the cost of fault indicator based on LoRa and NB-IoT, which includes the cost of acquisition unit and collection unit. Therefore, the cost of fault indicator can be expressed by
where
As Equations (12) and (13) indicates, the cost of acquisition unit consists of the cost for LoRa module of acquisition and other parts of acquisition, the cost of collection unit consists of the cost for LoRa module of collection, NB-IoT module, and other parts of collection.
Furthermore,
where is the number of acquisition units that are installed, is the number of collection units that are installed, is the installing price of a LoRa module, is the installing price of an NB-IoT module, is the service life of a LoRa module, is the service life of an NB-IoT module, is the cost of maintaining a LoRa module, is the cost of maintaining an NB-IoT module. is communication fee per year. is present worth factor, which can be expressed by
where is inflation rate and is interest rate.
Moreover, the relationship between the number and location of installed acquisition units and collection units can be expressed by
where is set of the acquisition unit, is set of the collection unit, is 0/1 variable, which is equal to 1 if the acquisition unit is installed and is 0/1 variable, which is equal to 1 if the collection unit is installed.
Finally, in order to ensure the power-supply reliability, the constraint can be expressed as
where is the outage time of the distribution network.
The proposed optimization problem (Equations (1)–(20)) is a mixed-integer nonlinear programming (MINLP) problem, which can be solved by using different optimization methods [25,26]. In this paper, we use the genetic algorithm to solve the objective function to obtain the optimal placement of the IoT-based fault indicator in the power distribution network without acceptable communication coverage. The flow chart of the proposed optimal configuration method is shown in Figure 4.
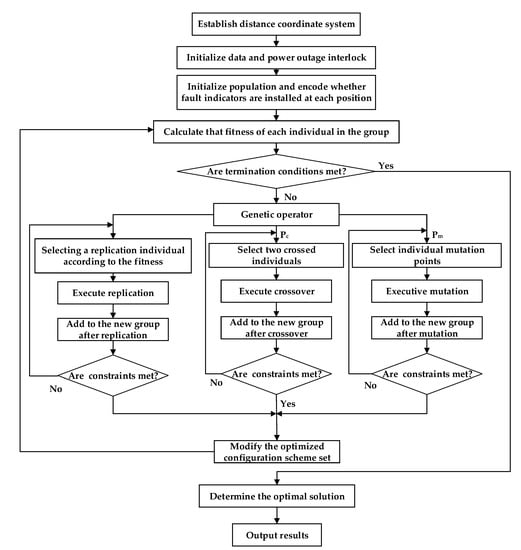
Figure 4.
The flow chart of the proposed optimal configuration method.
As shown in Figure 4: (a) According to the original geographical location map, the distance coordinate system between nodes is established, and the nodes are labeled. (b) According to the relationship between nodes, the load matrix after power failure and the tabu domain searched after power failure are established. (c) Initialize whether the node has collecting devices or not, and initialize the number of collecting devices according to the limiting conditions. (d) The fitness of each individual is calculated according to the load and the cost of the device, and the optimal individual is recorded. (e) Judge whether the optimal individual has not changed within several times or reaches the maximum iteration times. (f) If yes, output the optimal individual data and stop the cycle. (g) If not, the population is copied, crossed, and mutated, and the useful individuals are screened according to the restriction conditions to ensure the constant population size and recycle (d)–(g).
In this algorithm, we update the individual in the population through replication, crossover, and mutation in each cycle. Through this circulation, the optimized configuration scheme set is continuously updated until the cost obtained has almost no change after 10 evolutions. Therefore, we can get the optimal results.
4. Simulation Results and Discussion
In order to assess the suitability of the proposed optimization framework, it is tested on the feeder 4 connected to bus 6 of the IEEE RBTS, which is taken as an example [27]. The test system is a typical power distribution network in rural areas, which includes residential and agricultural loads. Figure 5 shows this test system. As shown in Figure 5, some areas of this feeder cross mountainous or forest zones with the poor or lack of coverage of communication networks (dashed line). Consequently, installing the traditional fault indicators based on GPRS and 3G/4G in these types of areas is impossible. Therefore, the intelligent fault indicator based on LoRa and NB-IoT can be installed here.
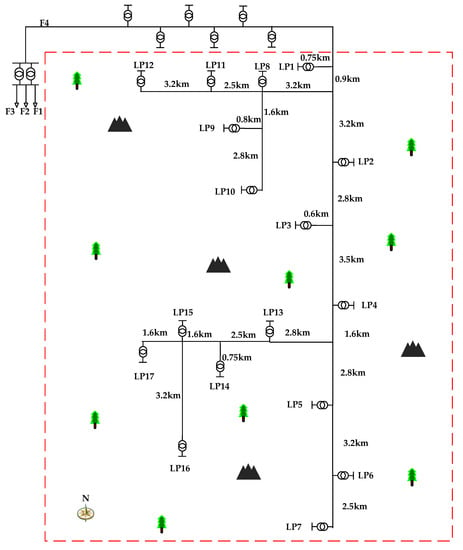
Figure 5.
Feeder of the test system with poor or lack of coverage of communication networks.
According to the statistical analysis and historical data, the relevant model parameters are set as follows: The time for fault resection is 5 min, the fault rate of the line is 0.125, the electricity price is 0.15 USD/kWh, and the speed of overhead line inspection is 4km per hour. The unit price of the LoRa module is 5 USD, and the unit price of the NB-IoT module is 10 USD. The annual communication fee of the NB-IoT module is 6 USD per year. The unit price of other parts of the acquisition unit is 6 USD, and the unit price of other parts of the collection unit is 40 USD. The annual operation and maintenance expenses are calculated to be 8% of the unit price of each part. The service life of LoRa module and NB-IoT module is both 10 years. Inflation rate is assumed to be 6% and interest rate is assumed to be 7%. The outage time of the distribution network is assumed to be 2 h.
By solving the optimal configuration model, the optimal installation number of the acquisition unit of fault indicator is 14, and the corresponding installation position is 3, 5, 6, 8, 9, 10, 11, 12, 13, 15, 18, 19, 22, and 23, as shown in Figure 6. The optimal installation number of the collection unit of fault indicator is 1, and the corresponding installation position is 7, as shown in Figure 6.
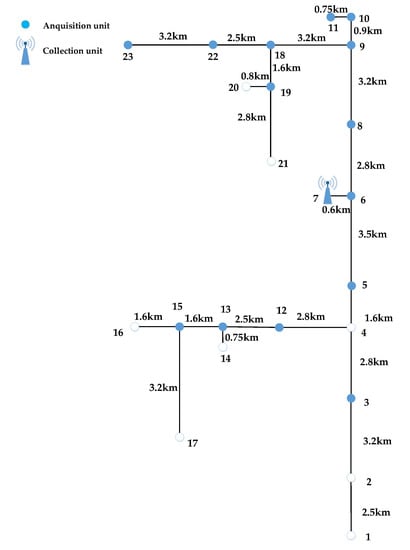
Figure 6.
The installation position of IoT-based fault indicator.
In this optimized configuration, the time required for any fault point to be accurately located is shown in Figure 7. The location number of fault points can be seen in Figure 5. For example, when the fault occurs at point 1, after locating the corresponding fault section through the fault indicator and patrolling the line at a certain speed, the locating time is 1.5 h. Similarly, when the fault occurs at point 10, the fault location can be accurately located within 0.1 h.
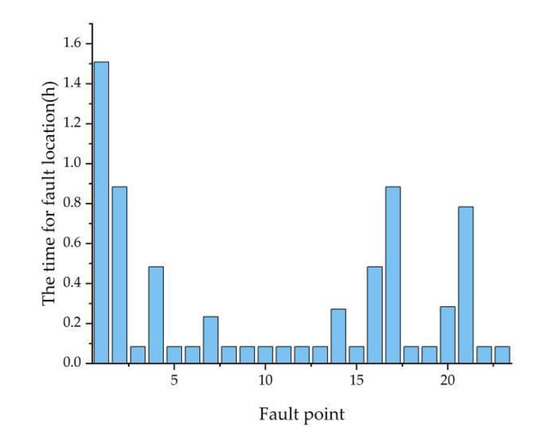
Figure 7.
The time required for any fault point to be accurately located.
In order to verify the effectiveness of the proposed scheme, the optimal scheme is compared with the random scheme. The random configuration scheme is set as Scheme 1, and the optimal configuration scheme of the model proposed in this paper is set as Scheme 2. It can be seen from Table 1 that when the same number of fault indicator acquisition units and collection units are installed, the average time for fault location of the Scheme 1 is 0.332 h, and the average time for fault location of the Scheme 2 is 0.303 h, therefore the average time for fault location will be shortened by 0.029 h. In addition, the total cost of Scheme 1 is 237.38 USD, while the total cost of Scheme 2 is 228.48 USD, which is lower than that of Scheme 1. That is to say, under the premise of ensuring the reliability of communication and power supply, the economy of the scheme proposed in this paper is better.

Table 1.
Comparison of two configuration schemes of fault indicator.
4.1. Influence on Fault Indicator Configuration Scheme by Changing Some Set Parameter Values Related to the Proposed Model
In the actual distribution system, due to the influence of various factors, some parameters related to the model are often not fixed, so we can observe the impact on the configuration scheme of fault indicator by changing some set parameter values.
4.1.1. Speed of Patrolling the Line
When the staff patrols a line, the speed of inspection will be different because of weather conditions, traffic conditions, and other factors, which directly affect the time of fault location. At the same time, with the continuous development of intelligent line patrol equipment, the speed of patrolling the line will continue to improve. Taking the optimized configuration scheme of fault indicator solved in this paper as an example, the configuration scheme of fault indicator under the different speed of overhead line inspection is shown in Table 2. It can be seen from Table 2 that the total cost has gradually decreased from 270.74 USD to 163.05 USD.

Table 2.
Optional placement of fault indicators under different speed of patrolling the line.
In order to more intuitively reflect the changing trend of the number of fault indicators to be installed and the average time for fault location with the change of speed of patrolling the line, a line chart is shown in Figure 8.
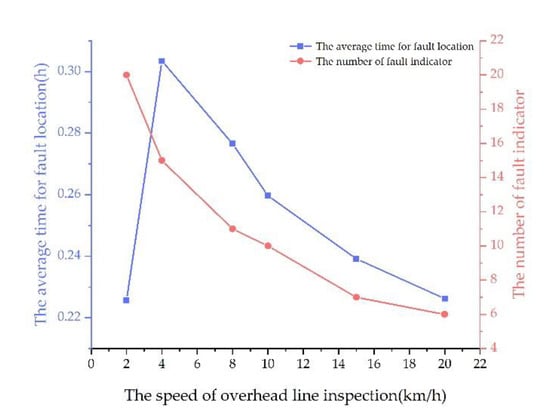
Figure 8.
The number of fault indicators and the average time for fault location under different speeds.
As shown in Table 2 and Figure 8, with the increase in speed, the total cost is on the decrease, and the number of fault indicators and the average time required for accurate location of the line fault point is gradually reduced, which greatly improves the system operation safety and power-supply reliability. Therefore, under the condition of a certain number of collecting units, the research and development of advanced automatic line inspection equipment to improve the speed of line inspection is an effective way to quickly locate the fault point.
Interestingly, when the speed is 2 km/h, the average time for fault location does not conform to this rule, because we need to install 2 collecting units under this condition, which greatly reduces the average fault location time, but it costs a lot. Due to the number of collecting units under the condition of 2 km/h is different from other cases, the installation position of fault indicator based on LoRa and NB-IoT when the speed is 2 km/h is especially shown in Figure 9.
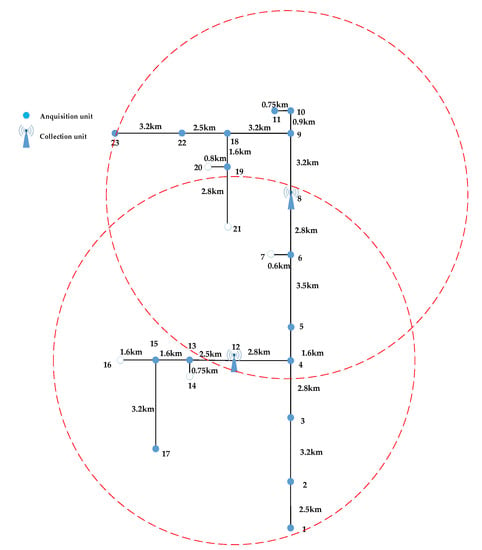
Figure 9.
The installation position of IoT-based fault indicator when the speed is 2 km/h.
4.1.2. Outage Time of System with Fault
When a fault occurs on the line, the fault signal is detected by the fault measuring module of the fault indicator and is also detected by the protection device on the feeder. After a certain time delay, the feeder where the fault occurs will be cut off by the protection device. As a result, the feeder loses power at this time. Then, according to the fault section information located by the fault indicator, the staff can quickly locate the fault point by patrolling the line from upstream to downstream, cut off the fault point, and close the circuit breaker. Consequently, the feeder resumes power supply at this time. The time from the feeder loses power to the feeder resumes power supply is called outage time. In this paper, the fault indicator is optimized according to the outage time of system with fault is less than 2 h, but in actual operation, the less the outage time of system with fault is, the earlier the fault point is accurately located, the higher the reliability of the system. Therefore, the change of configuration scheme of fault indicator can be observed by setting different outage time of distribution system with fault as shown in Table 3. When the outage time is assumed as less than 1.5 h, the average time for fault location is 0.234 h, which is less than the average time for fault location when the outage time is assumed as less than 2 h. However, the total number of fault indicators is 17 (when the outage time is 1.5 h), which is more than 15 (when outage time is 2 h), and the total cost is 262.29 USD (when the outage time is 1.5 h), which is more expensive than that of 2 h.

Table 3.
Optional placement of fault indicators under different outage time of the system with fault.
Moreover, the time required for any fault point to be accurately located under different outage time of the system with fault is shown in Figure 10. For example, when the fault occurs at point 1, after locating the corresponding fault section through the fault indicator and patrolling the line at a certain speed, the locating time is about 1.5 h when outage time is assumed as less than 2 h, while the locating time is about 0.7 h when outage time is assumed as less than 1.5 h, which is much less.
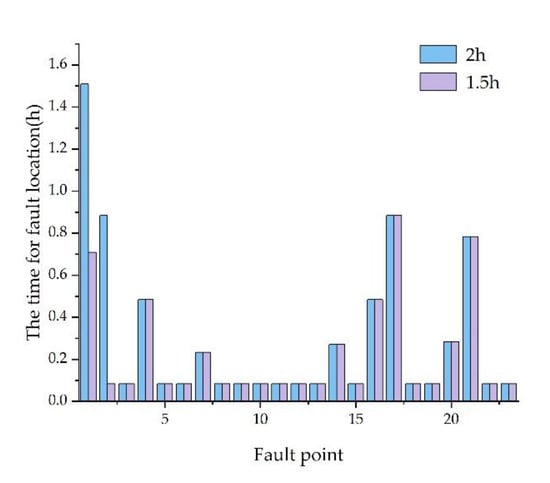
Figure 10.
The time required for any fault point to be accurately located under different outage time.
It can be seen from Table 3 and Figure 10 that if the outage time of the system with fault is shorter, the total installation number of acquisition unit and collection unit will be more, and the total cost will be higher. However, the shorter the outage time of the system with fault is allowed, the earlier the fault point is located accurately, and the higher the security of the system is. Therefore, in the case of sufficient capital budget, increasing the number of installations of fault indicators on the line reasonably is conducive to the rapid removal of fault points and power-supply recovery.
4.2. Influence on Fault Indicator Configuration Scheme by Changing Some Parameter Values Related to the Different Power Lines
The situation will be different for different power lines configurations. In order to analyze the results related to the cost savings for different power lines, we can observe the impact on the configuration scheme of a fault indicator by changing some parameter values related to different power lines.
4.2.1. Effect of the Power Line Length
By doubling the length of each line of the test system (feeder 4 connected to bus 6 of the IEEE RBTS), we can study the impact of the length of the power line on the optimal fault indicator configuration scheme and the influence of the total cost, which is shown in Table 4.

Table 4.
Optimal placement of fault indicators under different power line lengths.
As shown in Table 4, with the increase in the length of the power line, the installation number of acquisition units will increase from 14 to 17, and the installation number of collection units will increase from 1 to 3. As a consequence, the total cost will increase from 228.48 USD to 274.67 USD. It is because the time for patrolling the line will become longer with the increase in the length of power line when the speed of patrolling the line is constant. Consequently, if a fault occurs, the outage time will increase, so we need to install more acquisition units and collection units of fault indicators to ensure the reliability of the power supply. Therefore, for different power lines, the longer the length is, the higher the total cost will be.
4.2.2. Effect of the Junction Nodes of the Power Line
The number and position of nodes are usually different for the power lines with different topologies. In order to study the influence of the junction nodes of the power line on the total cost, we add a branch with a load in the middle of each section of the test power line, which is the feeder 4 connected to bus 6 of the IEEE RBTS. The adding nodes are numbered from 24 to 45 accordingly, and the load power is set as the average power value of the test system. Using the same method to solve the optimal configuration model, the optimal installation number of the acquisition unit of the fault indicator increases from 14 to 29, and the corresponding installation position is point 2, 3, 4, 5, 6, 8, 9, 10, 11, 12, 13, 15, 18, 22, 25, 26, 27, 28, 30, 31, 32, 33, 34, 35, 40, 42, 43, 44, and point 45, as shown in Figure 11. The optimal installation number of the collection unit still equals 1, but the corresponding installation position changed to point 28, as shown in Figure 11. The impact of the junction nodes of the power line on the optimal configuration scheme and the influence of the total cost is shown in Table 5.
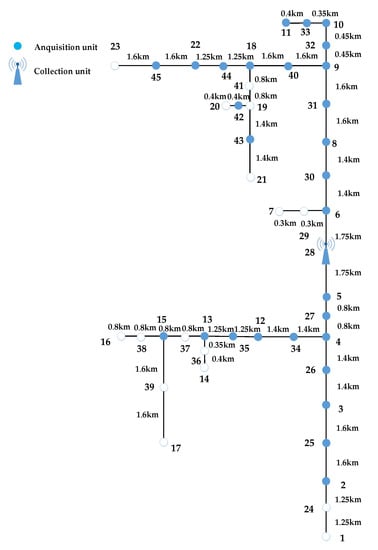
Figure 11.
The installation position of IoT-based fault indicator when the junction nodes of the power line change.

Table 5.
Optimal placement of fault indicators under different junction nodes of the power line.
It can be seen from Figure 11 and Table 5 that the number of IoT-based acquisition units of the fault indicators will increase with the increment of the power line junction nodes. The total cost will increase from 228.48 USD to 429.36 USD when the number of junction nodes increases from 23 to 45. The reason is that with the addition of nodes and loads, the interruption cost, which is given by Equations (2)–(4) will increase greatly. Hence, it is necessary to install more fault indicators to ensure the reliability of power supply and the investment performance at the same time. In conclusion, for different power lines, the total cost will be higher with the addition of nodes.
4.3. Influence on Fault Indicator Configuration Scheme by Environment
There is a large amount of electromagnetic interference in the power system. In our proposed method, the acquisition unit adopts LoRa wireless communication technology and it is installed on the wire, and the collection unit adopts LoRa and NB-IoT wireless communication technology and it is installed on the pole as shown in Figure 3. Therefore, the communication qualities of the acquisition unit and collection unit will be affected by the electromagnetic interference environment and the weather conditions, such as temperature.
4.3.1. Electromagnetic Interference in the Power System
As mentioned in [28], LoRa adopts Frequency-Hopping Spread Spectrum (FHSS) technology, which not only keeps the characteristics of low power consumption and long communication distance but also improves the anti-interference ability of electromagnetic compatibility (EMC). Moreover, Wang et al. [29] have tested the LoRa technology in the substation, which is in the complex electromagnetic environment, and the test results show that LoRa performed steady communication. Similarly, Tomlain Juraj [30] has proposed a custom hardware platform that is suitable for implementation of Internet of Things networks in Smart Grid systems. The communication range, reliability, and consumption testing results show that NB-IoT technology works well.
4.3.2. Weather State
Níbia Souza Bezerra et al. studies the influence of temperature on LoRa communication performance in [31]. Ikpehai Augustine et al. [32] found that extreme weather conditions will affect the service life of LoRa and NB-IoT. Moreover, Michal Wydra et al. have applied LoRa to time-aware monitoring of overhead transmission line sag and temperature and verified its working state in [33]. Roberto Vega-Rodríguez et al. [34] have presented a low-cost LoRa-based network, which is able to evaluate the level of fire risk and the presence of a forest fire. The system has been tested in a real environment and the results show that it works well. Similarly, Feng et al. [35] has adopted the LoRa and NB-IoT in the agriculture industry. The experimental verification shows that the weather state such as temperature has a certain influence on the communication performance of LoRa and NB-IoT, but it does not affect its normal work.
4.4. Influence on Fault Indicator Configuration Scheme by Changing the Relationship between Probability of Error and Distance
In order to prove the fitness of the simplified linear relationship between probability of error and distance, we studied the impact of the relationship between probability of error and distance on the optimal configuration scheme by changing the Equation (7) to
By solving the model, the result is shown in Table 6.

Table 6.
Optional placement of fault indicators under different relationships between probability of error and distance.
As shown in Table 6, the installation number and position of the acquisition unit and collection unit have no change under different relationships between probability of error and distance. Hence, the simplified linear relationship between probability of error and distance is appropriate to be used in the optimal configuration scheme of fault indicators. It is worth mentioning that it would be interesting to further study the relationship between probability of error and distance in the proposed model. We set this aside for our future work.
5. Conclusions
In this paper, a cyber-physical model is constructed by integrating the Internet of Things (IoT) technology into the fault indicator to solve the problem that the traditional fault indicator cannot communicate in mountain or forest areas. Due to the communication attenuation characteristic of the IoT communication technology, both communication reliability and power-supply reliability should be considered in the optimal configuration of the fault indicator. In this paper, an optimization framework has been formulated to obtain the optimal numbers and locations of acquisition and collection units of the fault indicators. The effectiveness of the proposed optimization framework has been validated by the simulation results under feeder 4 connected to bus 6 of the IEEE RBTS.
- As shown in Table 1, we can spend only 228.48 USD to quickly locate the fault that occurred on feeder 4 within 1.5 h using the proposed IoT-based fault indicators.
- The optimal placement of the IoT-based fault indicators is affected by many factors in the field. With the increase in patrol speed, the total cost and the time required for accurate fault location are both gradually reduced, which greatly improves the power-supply reliability, as shown in Table 2 and Figure 8. In the case of sufficient capital budget, increasing the number of installations of fault indicators on the line reasonably is conducive to the rapid removal of fault points, thus improving the reliability of power supply, the corresponding results are shown in Table 3 and Figure 10.
- The optimal placement of the IoT-based fault indicators is different with each distribution line. The effects of the power line length and junction node on the optimal placement scheme have been discussed in this paper. The results show that the cost will rise up with the increase in line lengths and the number of junction nodes, which is shown in Table 4 and Table 5 and Figure 11.
At present, the research of fault location in the distribution network based on unmanned aerial vehicle (UAV) has received the attention of scholars, such as [36] and [37]. They are essentially another cyber-physical system to locate the fault section in the distribution system. Although there are some differences between the fault location based on UAV and our proposed location method based on IoT-based fault indicators, such as a UAV-based fault indicator to UAV (UFI-to-UAV) channels module, our proposed optimization framework combining the power-supply reliability and communication reliability is also applicable to obtain the optimal placement scheme in such cyber-physical systems. The effectiveness of the proposed method will be validated in these novel fault location methods in our future work.
Author Contributions
Conceptualization, J.L. and J.T.; methodology, J.L. and J.T.; software, X.W.; hardware, S.Z., Z.Z., W.Q. and Z.L.; validation, J.L. and H.H.; investigation, J.L.; data curation, S.Z., Z.Z., W.Q. and Z.L.; writing—original draft preparation, J.L.; writing—review and editing, J.T. and B.X.; supervision, J.L.; project administration, J.L.; funding acquisition, J.T. and J.L. All authors have read and agreed to the published version of the manuscript.
Funding
This research was funded by National Natural Science Foundation of China, grant number 51707139, by National Natural Science Foundation of China, grant number 61703318, and by Wuhan University of Technology 2020 Independent Innovation Research Foundation of China, grant number 2020-ZDH-B1-18.
Conflicts of Interest
The authors declare no conflict of interest.
References
- Teng, J.H.; Huang, W.H.; Luan, S.W. Automatic and Fast Faulted Line-Section Location Method for Distribution Systems Based on Fault Indicators. IEEE Trans. Power Syst. 2014, 29, 1653–1662. [Google Scholar] [CrossRef]
- Zhang, H.B.; Yuan, Q.C. Application of Fault Indicator in Smart Grid. Energy Technol. Econ. 2011, 23, 16–20. [Google Scholar]
- Ou, Q.H.; Wang, Z.; Zhen, Y.; Zhen, L.X.; Si, Z. Status Monitoring and Early Warning System for Power Distribution Network Based on IoT Technology. In Proceedings of the 2013 3rd International Conference on Computer Science and Network Technology, Dalian, China, 12–13 October 2013. [Google Scholar]
- Raza, U.; Kulkarni, P.; Sooriyabandara, M. Low power wide area networks: An overview. IEEE Commun. Surv. Tutor. 2017, 19, 855–873. [Google Scholar] [CrossRef]
- Zhou, Q.H.; Zheng, K.; Hou, L.; Xing, J.; Xu, R. Design and Implementation of Open LoRa for IoT. IEEE Access 2019, 7, 100649–100657. [Google Scholar] [CrossRef]
- Zhao, W.; Lin, S.; Han, J.; Xu, R.; Hou, L. Design and implementation of smart irrigation system based on LoRa. In Proceedings of the 2017 IEEE Globecom Workshops (GC Wkshps), Singapore, 4–8 December 2017. [Google Scholar]
- Lee, H.C.; Ke, K.H. Monitoring of Large-Area IoT Sensors Using a LoRa Wireless Mesh Network System: Design and Evaluation. IEEE Trans. Instrum. Meas. 2018, 67, 2177–2187. [Google Scholar] [CrossRef]
- Chen, X.; Li, Z.; Chen, Y.; Wang, X. Performance Analysis and Uplink Scheduling for QoS-Aware NB-IoT Networks in Mobile Computing. IEEE Access 2019, 7, 44404–44415. [Google Scholar] [CrossRef]
- Andres-Maldonado, P.; Lauridsen, M.; Ameigeiras, P.; Lopez-Soler, J.M. Analytical Modeling and Experimental Validation of NB-IoT Device Energy Consumption. IEEE Internet Things J. 2019, 6, 5691–5701. [Google Scholar] [CrossRef]
- Jia, G.Y.; Zhu, Y.J.; Li, Y.H.Z. Analysis of the Effect of the Reliability of the NB-Iot Network on the Intelligent System. IEEE Access 2019, 7, 112809–112820. [Google Scholar] [CrossRef]
- Chen, J.M.; Hu, K.; Wang, Q.; Sun, Y.; Shi, Z.; He, S. Narrowband Internet of things: Implementations and applications. IEEE Internet Things J. 2017, 5, 2309–2314. [Google Scholar] [CrossRef]
- Sinha, R.S.; Wei, Y.; Hwang, S.H. A survey on LPWA technology: LoRa and NB-IoT. ICT Express 2017, 3, 14–21. [Google Scholar] [CrossRef]
- Muench, F.J.; Wright, G.A. Fault indicators: Types, strengths & applications. IEEE Trans. Power Syst. 1982, PAS-103, 3688–3693. [Google Scholar]
- Smallwood, C.L.; Lattner, M.; Gardner, T. Expansion of distribution automation with communicating faulted circuit indicators. In Proceedings of the IEEE Rural Electric Power Conference (REPC), Chattanooga, TN, USA, 10–13 April 2011. [Google Scholar]
- Teng, J.H.; Hsieh, C.H.; Luan, S.W.; Lan, B.R.; Li, Y.F. Systematic Effectiveness Assessment Methodology for Fault Current Indicators Deployed in Distribution Systems. Energies 2018, 11, 2582. [Google Scholar] [CrossRef]
- Tang, J.R.; Li, J.; Zhong, A.; Xiong, B.; Bian, X.; Li, Y. Application of LoRa and NB-IoT in Ubiquitous Power Internet of Things: A Case Study of Fault Indicator in Electricity Distribution Network. In Proceedings of the 2019 4th International Conference on Intelligent Green Building and Smart Grid (IGBSG), Hubei, China, 6–9 September 2019. [Google Scholar]
- Li, B.; Wei, J.; Liang, Y.F.; Chen, B. Optimal Placement of Fault Indicator and Sectionalizing Switch in Distribution Networks. IEEE Access 2020, 8, 17619–17631. [Google Scholar] [CrossRef]
- Almeida, M.C.; Costa, F.F.; de Souza, S.X.; Santana, F. Optimal placement of faulted circuit indicators in power distribution systems. Electr. Power Syst. Res. 2011, 81, 699–706. [Google Scholar] [CrossRef]
- Usida, W.F.; Coury, D.V.; Flauzino, R.A.; da Silva, I.N. Efficient placement of fault indicators in an actual distribution system using evolutionary computing. IEEE Trans. Power Syst. 2012, 27, 1841–1849. [Google Scholar] [CrossRef]
- Farajollahi, M.; Fotuhi-Firuzabad, M.; Safdarian, A. Deployment of fault Indicator in distribution networks: A MIP-based approach. IEEE Trans. Smart Grid 2018, 9, 2259–2267. [Google Scholar] [CrossRef]
- Gezer, C.; Niccolini, M.; Buratti, C. An IEEE 802.15.4/ZigBee based wireless sensor network for energy efficient buildings. In Proceedings of the IEEE 6th International Conference on Wireless and Mobile Computing, Networking and Communications, Niagara Falls, ON, Canada, 11–13 October 2010. [Google Scholar]
- Yi, P.; Iwayemi, A.; Zhou, C. Developing ZigBee deployment guideline under WiFi interference for smart grid applications. IEEE Trans. Smart Grid. 2011, 2, 110–120. [Google Scholar] [CrossRef]
- Rana, M.M.; Bo, R. IoT-based cyber-physical communication architecture: Challenges and research directions. IET Cyber-Phys. Syst. Theory Appl. 2020, 5, 25–30. [Google Scholar] [CrossRef]
- Mekki, K.; Bajic, E.; Chaxel, F.; Meyer, F. A comparative study of LPWAN technologies for large-scale IoT deployment. ICT Express 2019, 5, 1–7. [Google Scholar] [CrossRef]
- Barbosa, M.A.S.; Gouvêa, M.M., Jr. Access Point Design with a Genetic Algorithm. In Proceedings of the 2012 Sixth International Conference on Genetic and Evolutionary Computing, Kitakushu, Japan, 25–28 August 2012. [Google Scholar]
- Li, Y.; Vilathgamuwa, M.; Choi, S.S.; Xiong, B.Y.; Tang, J.R.; Su, Y.X.; Wang, Y. Design of minimum cost degradation-conscious lithium-ion battery energy storage system to achieve renewable power dispatchability. Appl. Energy. 2020, 260, 114282. [Google Scholar] [CrossRef]
- Billinton, R.; Jonnavithula, S. A Test System For Teaching Overall Power System Reliability Assessment. IEEE Trans. Power Syst. 1996, 11, 1670–1676. [Google Scholar] [CrossRef]
- Li, R.; Shang, X.Y.; Zheng, C.F.; Meng, H.; Yu, N.H.; Su, Y.D.; Cau, R.F.; Ma, Y.X.; Luo, F.C.; Huang, S.Y. Applications of LoRa Technology in Smart Distribution Grid. In Proceedings of the 2019 IEEE 4th Advanced Information Technology, Electronic and Automation Control Conference (IAEAC), Chengdu, China, 20–22 December 2019. [Google Scholar]
- Wang, F.Q.; Lan, X.S.; Tang, M.; Li, S.P.; Hou, G.Y.; Wang, X.H.; Zhou, Y.Q.; Liu, H.Z. Monitoring System of Substation Boundary Noise based on LoRa Communication Technology. In Proceedings of the 1st International Conference on Environment Prevention and Pollution Control Technology (EPPCT), Tokyo, Japan, 09-11 November 2018. [Google Scholar]
- Tomlain, J.; Teren, O.; Tomlain, J. Communication Technologies and Data Exchange Possibilities for Smart Energy Solutions. In Proceedings of the International Conference on New Trends in Signal Processing (NTSP), Demanovska Dolina, Slovakia, 10–12 October 2018. [Google Scholar]
- Bezerra, N.S.; Ahlund, C.; Saguna, S.; de Sousa, V.A. Temperature Impact in LoRaWAN—A Case Study in Northern Sweden. Sensors 2018, 19, 4414. [Google Scholar] [CrossRef] [PubMed]
- Ikpehai, A.; Adebisi, B.; Rabie, K.M.; Anoh, K.; Ande, R.E.; Hammoudeh, M.; Gacanin, H.; Mbanaso, U.M. Low-Power Wide Area Network Technologies for Internet-of-Things: A Comparative Review. IEEE Internet Things J. 2019, 6, 2225–2240. [Google Scholar] [CrossRef]
- Wydra, M.; Kubaczynski, P.; Mazur, K.; Ksiezopolski, B. Time-Aware Monitoring of Overhead Transmission Line Sag and Temperature with LoRa Communication. Energies 2019, 12, 505. [Google Scholar] [CrossRef]
- Vega-Rodríguez, R.; Sendra, S.; Lloret, J.; Romero-Díaz, P.; Garcia-Navas, J.L. Low Cost LoRa based Network for Forest Fire Detection. In Proceedings of the 2019 Sixth International Conference on Internet of Things: Systems, Management and Security (IOTSMS), Granada, Spain, 22–25 October 2019. [Google Scholar]
- Feng, X.; Yan, F.; Liu, X.Y. Study of Wireless Communication Technologies on Internet of Things for Precision Agriculture. Wirel. Pers. Commun. 2019, 108, 1785–1802. [Google Scholar] [CrossRef]
- Derakhshandeh, S.Y.; Mobini, Z.; Mohammadi, M.; Nikbakht, M. UAV-Assisted Fault Location in Power Distribution Systems: An Optimization Approach. IEEE Trans. Smart Grid. 2019, 10, 4628–4636. [Google Scholar] [CrossRef]
- Zormpas, A.; Moirogiorgou, K.; Kalaitzakis, K.; Plokamakis, G.A.; Partsinevelos, P.; Giakos, G.; Zervakis, M. Power Transmission Lines Inspection using Properly Equipped Unmanned Aerial Vehicle (UAV). In Proceedings of the 2018 IEEE International Conference on Imaging Systems and Techniques (IST), Krakow, Poland, 16–18 October 2018. [Google Scholar]
© 2020 by the authors. Licensee MDPI, Basel, Switzerland. This article is an open access article distributed under the terms and conditions of the Creative Commons Attribution (CC BY) license (http://creativecommons.org/licenses/by/4.0/).