Article

Modeling and Evaluation of Energy Efficiency of New Hybrid Turning-Burnishing Process in Terms of Surface Properties

1
Department of Manufacturing Technology, Le Quy Don Technical University, 236 Hoang Quoc Viet, Ha Noi 100000, Vietnam
2
Department of Mechanical Engineering, Imperial College London, Exhibition Road, South Kensington, London SW7 2AZ, UK
*
Author to whom correspondence should be addressed.
Energies 2020, 13(18), 4929; https://doi.org/10.3390/en13184929
Submission received: 17 July 2020 / Revised: 2 September 2020 / Accepted: 17 September 2020 / Published: 20 September 2020
(This article belongs to the Special Issue Modelling of Industrial Processes)

Abstract

:
The combination of the turning and burnishing process is an efficient approach to improve machined quality and productivity. This paper aims to optimize energy efficiency (EF), improved hardness ratio (IHR), and decreased roughness ratio (DRR) of a new hybrid turning-burnishing process. The machining parameters are the feed rate (f), turning speed (v), depth of cut (a), burnishing pressure (p), and the diameter of the compressing ball (d). A new turning-burnishing tool using compressed air has been designed and fabricated. A set of experiments for Aluminum Alloy 5083 were performed using the Taguchi method. The weightage principal component analysis (WPCA) and Technique for Order of Preference by Similarity to Ideal Solution (TOPSIS) were applied to obtain the weight values and optimal outcomes. The results indicated that optimum values of the depth of cut, pressure, diameter, feed rate, and speed are 1.00 mm, 0.4 MPa, 16.00 mm, 0.084 mm/rev, and 120 m/min, respectively. The improvements in the EF and IHR are by 20.75% and 8.23% respectively, while the DDR is decreased by 19.05%, as compared to common values.

1. Introduction

Improving surface properties is the primary purpose of industrial manufacturers and researchers, in which the roughness, residual stress, hardness, and the depth of the hardened layer are important criteria. Different machining approaches, such as turning and milling processes, were employed to boost surface properties [1]. The linear model of the machined roughness (MR) was developed in terms of the depth of cut (a), feed (f), spindle speed (S), and flow rate (FR) of the lubrication for the turning of AISI 1045 steel [2]. Three different types including the dry, minimal, and flood lubrications were analyzed. The outcomes indicated that minimal a, maximum S, and maximum FR were contributed to a smoother surface. Jafarian et al. optimized the machining speed (v), a, and f to decrease the MR and tensile stress (TS) for the Inconel 718 [3]. The neural network (NN) and genetic algorithm (GA) were employed to propose performance models and select optimal parameters. The authors emphasized that the neural network could be applied to model technical performances. A Taguchi-based approach was utilized to select optimal inputs to decrease the MR and improve the hardness (H) for the milled magnesium alloy [4]. The results indicated that the f is the highest effective parameter for the performance models. The impacts of the v, f, workpiece thickness, and inclination on the surface characteristics for the milled Inconel 718 were analyzed [5]. It can be stated that the machining path in the horizontal direction could be used to enhance the surface quality. The influences of the turning parameters, grinding factors, and tool properties on the MR and machining stress (MS) were explored in the work of Reference [6]. The authors stated that an increased v causes a reduction in the roughness. Moreover, the compressive stress (CS) was produced with the aid of the grinding operation.
The measuring tools were designed and fabricated to decrease the cycle time and improve the machining accuracy [7]. The quadratic model of the form error was developed in terms of process parameters. The results indicated that the profile accuracy of a cosine curve was enhanced with the aid of the developed tool. The deviation less than 4% revealed that the developed model was accurate. Similarly, a metrology-integrated machining platform was developed to improve the measuring accuracy for the ultraprecision turning machine [8]. The experimental results indicated that the proposed system was significantly contributed to minimizing surface error and measuring time. Unfortunately, the aforementioned processes cause various limitations, including the high roughness and tensile stress on the machined surface [9]. To deal with the drawbacks, several treating processes were developed to provide low roughness, compressive stress, and increased hardness.
Burnishing is a prominent manufacturing process to improve the surface properties, in which the profile irregularities will be burnished under the effects of balls or rollers. This operation brings some attractive advantages, including the low roughness, high hardness, the high depth of the affected layer, and compressive stress [10]. The surface properties and the component’s functionality have been greatly improved, contributing significantly to increase in the mechanical strength and resistances. Moreover, this process can be considered as a greener manufacturing due to the removal of the machined chip and saving raw materials.
Enhancing characteristics of different burnishing processes has been widely attached to many former investigators. The common characteristics, such as MR, H, CS, and the depth of the hardened layer (DL) were extensively analyzed to exhibit the strength of the burnishing operations. The mathematic formulas of the MR, H, and profile irregularities (PI) were developed in terms of the v, f, and depth of penetration (p) [11]. The results indicated that the MR and PI were decreased by 81% and 34%, while the H was increased by 17%, respectively. An optimization effort was made to improve the surface properties of the burnished EN-9 alloy [12]. The optimal outcomes exhibited that the improvements in the MR and H were 94.5% and 41.7%, respectively. The mathematical formulas of the MR, H, and DL were developed in terms of the S, f, and p for the carbon steel [13]. The results indicated that performance models were mainly affected by the S, p, and f. Similarly, the selection of process parameters of the internal burnishing was performed to enhance the hardness and roughness properties [14]. The findings showed that the MR was decreased by 95.80% and the H was improved by 45.44%. Sachin et al. proposed a new burnishing tool having a diamond tip to investigate the impacts of the v, f, and burnishing force (F) on the MR and H [15]. The results revealed that the optimal values of the MR and H were 0.07 µm and 363 HV, respectively. The surface properties were analyzed with the variety of the burnishing paths and process parameters for the burnished martensitic steel [16]. The findings revealed that the F and raster path were contributed to a reduction in roughness criteria.
In practice, mechanical processes (i.e., turning and milling) and treating operations (i.e., burnishing) are separately performed to enhance the surface properties [17]. This causes an increase in total machining time due to the setting time for each operation. To improve the production rate, different hybrid turning-burnishing operations have been developed. The summarized findings of related publications are described in Table 1. A turning-burnishing tool using a hydraulic unit was designed by Axinte and Gindy [18]. The experiments were performed for the Inconel 78 to prove the effectiveness of the conceptual design. The authors revealed that the MR was decreased by 68% and the DL could be reached to 300 μm for the burnished surface. Mezlini et al. proposed a new turning-burnishing tool using a spring to improve the surface characteristics of the treated C45 steel [19]. The impacts of the v, f, and p on the MR and total machining time (TP) have been explored. The authors emphasized that the MR and TP were decreased by 77% and 51%, respectively. A simulation model was developed to describe the behavior of the turning-burnishing operation [20]. The variety of the residual stress under the impacts of the F, v, and f was investigated using the numerical approach. The outputs revealed that the three-dimensional (3D) model could bring a high precision of the stress. The selection of optimal values of the v, f, F, d, and a was obtained to improve the MR, H, and CS for the treated AISI 4140 steel [21]. The outcomes revealed that the surface properties were significantly improved, in which the MR was decreased by 70%. However, all attempts have been made to improve the surface characteristics. The optimal selection of the varied factors to solve the trade-off analysis between energy efficiency and surface characteristics has not been thoroughly addressed in the published works. To achieve sustainable production, the optimal parameters have to be selected to satisfy the social, economic, and environmental aspects.
In this paper, an optimization of the turning-burnishing operation of the Aluminum Alloy 5083 has been addressed to obtain improvements in energy efficiency (EF), improved hardness ratio (IHR), and decreased roughness ratio (DRR). The chosen material is employed due to the high resistance to the negative impacts of the seawater and chemical environments. This material is typically applied in the marine and automotive industries for manufacturing components, such as rail cars, vehicle bodies, tip truck bodies, mine skips, and cages. Firstly, the concept of a new hybrid turning-burnishing process has been developed. The turning-burnishing tool is then proposed to conduct the experimental trials. The weight principle component analysis (WPCA) is employed to estimate the weight values of the machining performances. Finally, the Technique for Order of Preference by Similarity to Ideal Solution (TOPSIS) is applied to select the optimal solution.

2. Development of a New Hybrid Turning-Burnishing Tool

A new hybrid turning-burnishing tool using the compressed air has been developed and fabricated, as depicted in Figure 1. The primary components of the hybrid tool are the holder, turning insert, turning shank, pneumatic cylinder, burnishing head, and position bolts. The turning insert and burnishing tool are integrated into one device, which can be installed in the tool-turret of the lathe machine. The turning insert CCGT09T302-AZ is mounted on the turning tool shank SCLCR1616H09. The hardness of 62 HRC and roughness of 0.05 μm are employed in the compressing ball. Three support balls are used to aid the motion of the burnishing ball. The burnishing ball and turning insert can be easily replaced with various shapes and/or dimensions. Moreover, this device can be used to perform different operations, including turning, burnishing, and turning-burnishing.
As the design of a new turning-burnishing tool, the turning insert is set ahead of the compressing ball. The turning operation is immediately followed by the ball burnishing process and two machining operations are simultaneously performed on the path. The burnishing pressure or force is adjusted using compressed air with the aid of a pneumatic cylinder. The turned chips are prevented from being entangled/pressed by the compressing ball. The dominance of a new turning-burnishing tool is to allow to precisely control the burnishing pressure and force, as compared to using the calibrating spring in the works of References [19,20,21]. This effectively supports deep understanding of the impacts of the burnishing force. Moreover, the use of the compressed air also decreases the negative impacts on the environment, as compared to the hydraulic unit [18].

3. Optimization Framework

3.1. Optimization Issues

In the current work, three machining responses, including energy efficiency, improved hardness ratio, and decreased roughness ratio are simultaneously optimized using a hybrid method.
For the hybrid process, the turning and burnishing are sinuously performed. We assumed that these operations are combined into one operation. Therefore, the total consumption of the hybrid process is used. The energy efficiency of the turning-burnishing operation (EF) is defined as the ratio of the average turning-burnishing energy consumed (TBECav) to the average machined energy consumed (MECav) in the machining period. The value of the EF is calculated as:
E F = T B E C a v M E C a v = A T B P a v × t T B M P C a v × t T B = A T B P a v M P C a v = 1 n A T B P i 1 n M P C i
where
ATBPi—the average active turning-burnishing power at the ith elapsed time.
MPCi—the average machine power consumed at the ith elapsed time.
tTB—the turning-burnishing time.
Practically, each combination of the machining parameters leads to the variety of the active turning-burnishing power, machine power consumed, and machining time. In this work, ten maximum values of the active turning-burnishing power and machine power consumed are taken into account to calculate the average outcomes. The similar definitions are computed in the works of References [22,23].
The decreased roughness ratio (DRR) is calculated as:
D R R = R T B R I
where
RTB—the arithmetic roughness after turning-burnishing.
RI—the initial arithmetic roughness.
The improved hardness ratio (IHR) is calculated as:
I H R = H T B H I
where
HTB—the Vicker hardness after turning-burnishing.
HI—the pre-machined Vicker hardness.
For the hybrid turning-burnishing process, three kinds of parameters are considered, including turning factors (machining speed, depth of cut, and feed rate), burnishing factors (pressure and diameter of the compressing ball), and common inputs (machining speed and feed rate). Process parameters and their ranges are exhibited in Table 2. The values of the varied inputs are selected based on the recommendations of the manufacturers for the turning tool, pneumatic cylinder, and workpiece properties. Consequently, the optimizing issue is defined as:
Find X = (v, a, f, p, and d).
Maximize EF as well as IHR and minimize DRR.
Constraints: 60 ≤ v ≤ 140 (m/min), 0.50 ≤ a ≤ 1.50 (mm), 0.056 ≤ f ≤ 0.168 (mm/rev.),
0.2 ≤ p ≤ 0.6 (MPa), 8 ≤ d ≤ 16 (mm).

3.2. Optimization Approach

The systematic procedure for the selection of optimal inputs is shown in Figure 2.
Step 1: The experimental trials are conducted in order to collect the necessary data [24,25,26].
Step 2: Normalization of the experimental data.
For lower, the better approach is
I * ( k ) = min I i ( m ) I i ( m )
For higher, the better approach is
I * ( k ) = I i ( m ) max I i ( m )
Step 3: Determining the weight values of performances using the WPCA [27,28].
In the current work, the weight value is directly calculated from the experimental data and it does not depend on the operator’s choice. The important role of the weight value is to objectively reflect the importance of each response. The weight calculated is assigned to each response when the optimization process is performed.
The correlation coefficient is calculated as:
S j l = [ C o v ( I i ( j ) , I i ( l ) ) σ I i ( j ) × σ I i ( l ) ]
where
Cov(Ii(j),Ii(l))—the covariance of sequences Ii(j) and Ii(l). Additionally,
σIi(j)—the standard deviation of sequences Ii(j).
σIi(l)—the standard deviation of sequences Ii(l).
The eigenvalues and consequent eigenvectors are calculated as:
( S λ k J m ) V i k = 0
where
λk—the eigenvalues.
Vik—the eigenvectors.
Jm—the identity matrix, respectively.
The major principal coefficient is calculated as:
P C m = i = 1 n I m ( i ) × V i k
where
Im(i)—the normalized response.
PCm—the principal component.
Step 4: Determining the optimal parameter setting using the TOPSIS method [29,30].
The weighted value of each response is calculated as:
V i j = I i w i
where
wi—the weight value calculated.
Vij—the normalized response.
The positive ideal solution (S+) and the negative ideal solution (S-) are determined as:
V + = ( v 1 + , v 2 + , v 3 + , v n + )   maximum   values
V = ( v 1 , v 2 , v 3 , v n )   minimum   values
S i + = j = 1 m ( v i j v j + ) 2
S i = j = 1 m ( v i j v j ) 2
The best solution is determined based on the highest desirability (D) value. The desirability value is calculated as:
D = S i S i + + S i

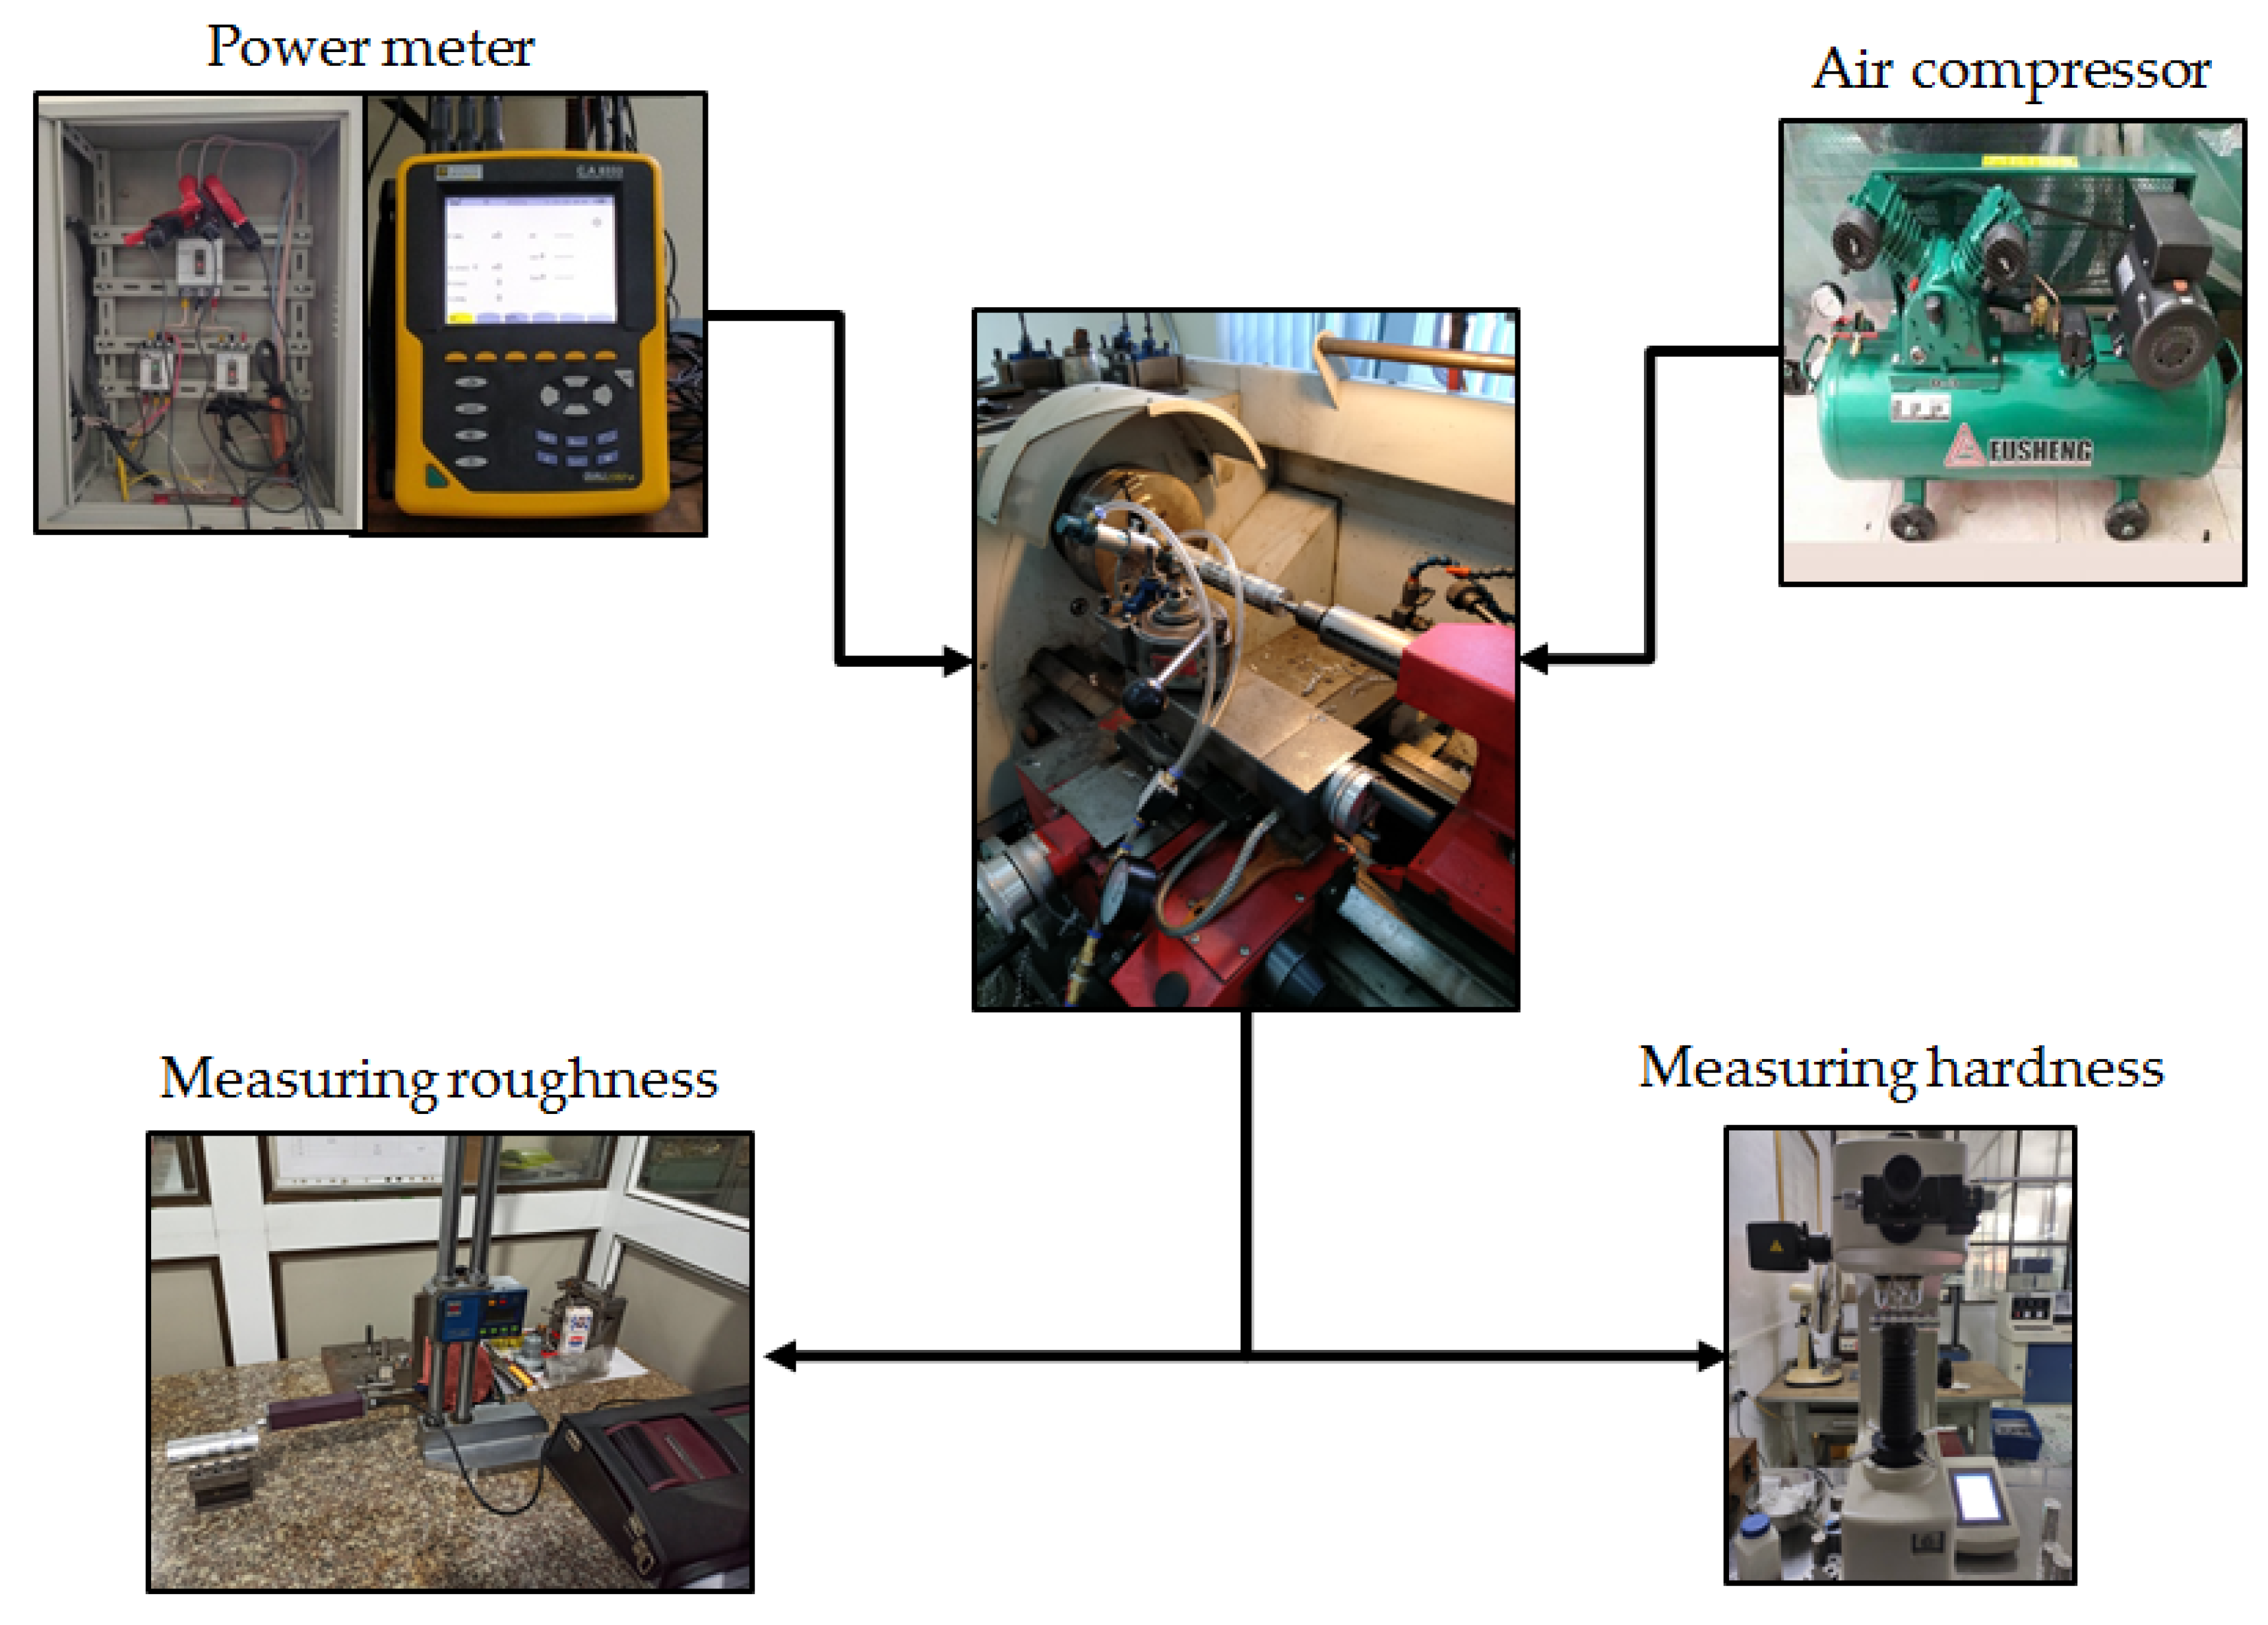
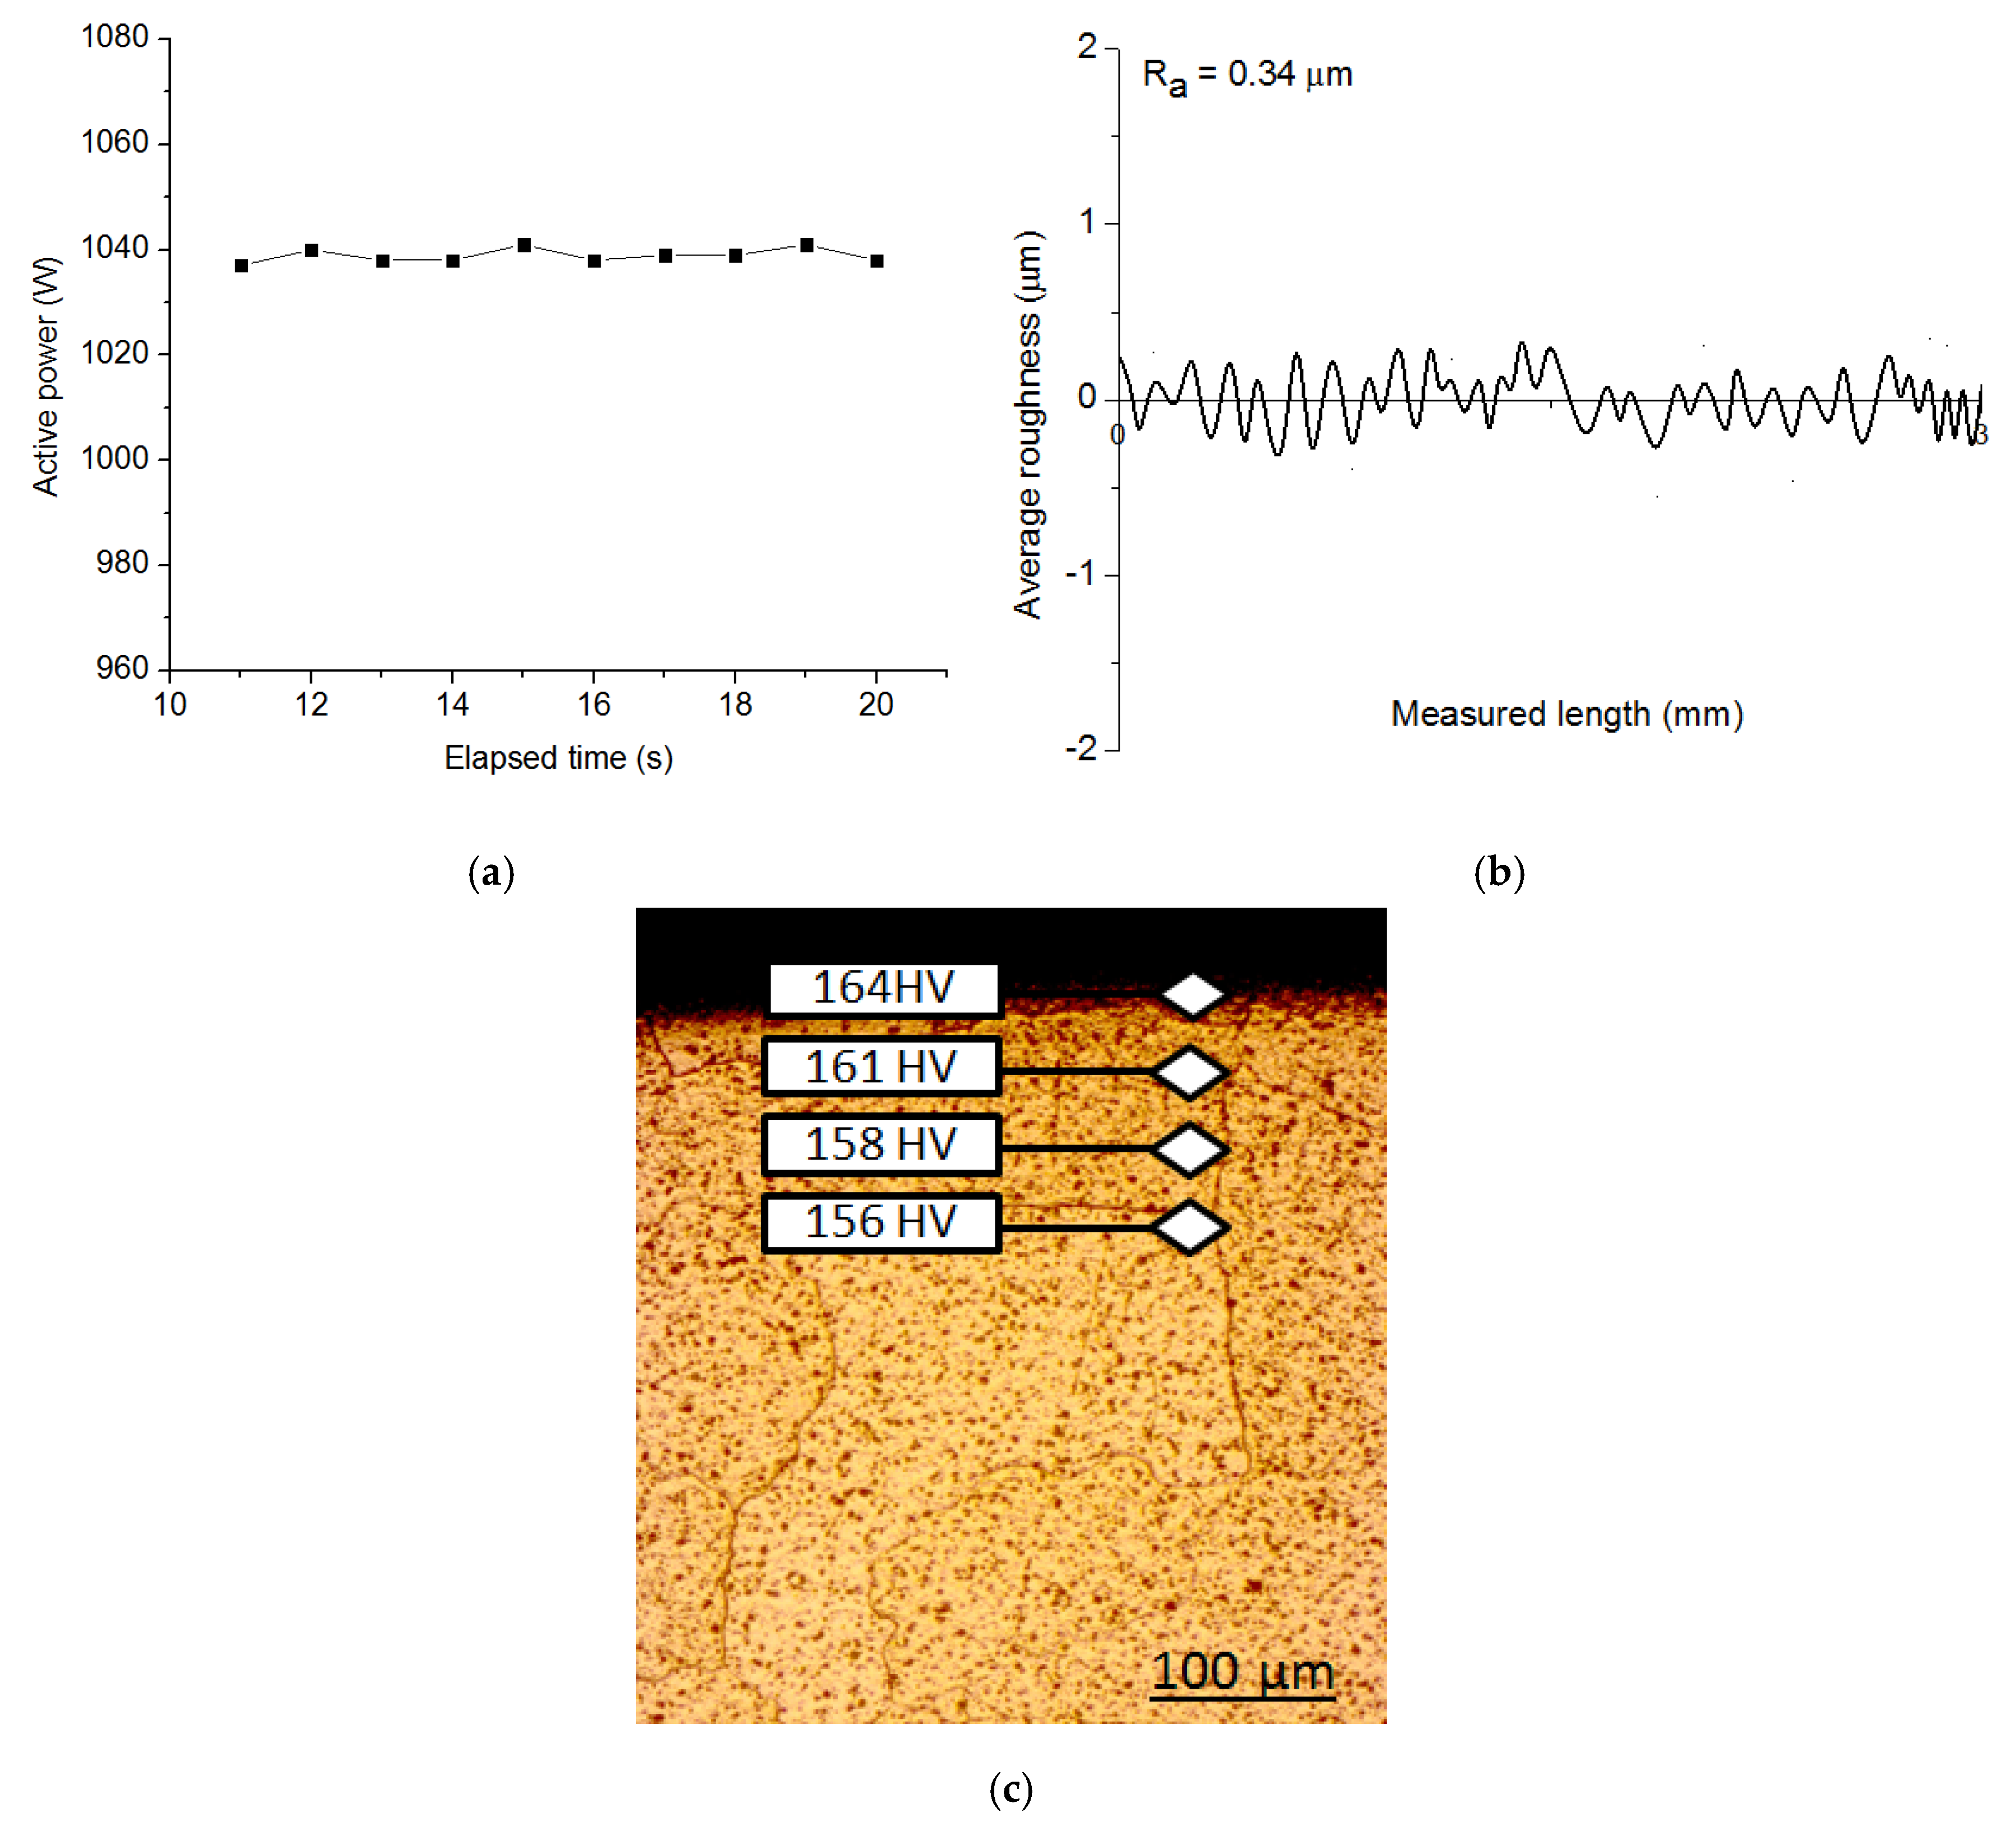
4. Experiments and Measurements

The experimental runs are performed on a turning machine, namely EMCOMAT-20D, to obtain necessary data. The surface is simultaneously treated using turning and burnishing processes. A pneumatic pump is used to generate compressed air. The air pressure has been changed by a solenoid valve and the pressure value is detected using the gauge. The flexibility of the compressed air allows it to more conveniently adjust the burnishing pressure for a specific purpose (Figure 3).
The aluminum bar of 40 mm diameter is used for all experiments. The machined length of 22 mm is employed for each experiment. The pre-machined surface is turned using the depth of cut of 1.5 mm, feed rate of 0.3 mm/rev, and cutting speed of 90 m/min, respectively. The initial values of the average roughness and Vicker hardness are 1.96 µm and 96 HV, respectively. The machining experiments are conducted under the wet condition. The cooling oil, namely E-660 V, is flooded into the machining zone.
The power consumption is automatically recorded using a power meter. The clamp sensors are directly connected with the electrical source and power lines of the lathe machine. The power meter is switched on to capture the variation in machining time. The time interval of 0.1 s is employed to ensure the accuracy of the measured data. The obtained data is stored on the memory card and visualized with the support of the software.
The standard for measurement of surface roughness is ISO 4287. The roughness value is measured on the machined surface in the axial direction using a roughness tester Mitutoyo SJ-301. The diamond tip of 5 µm radius is linearly moved on the machined sample. The measured length of 3 mm is employed for all machining samples. The measured ranges of 0.05–40 mm and the resolution of 0.01 mm are applied to obtain the best results.
The hardness value is obtained with the aid of a tester labeled HV-112. The pyramid diamond indenter is pressed on the machined surface under the test force 49.03 N. The pressed load is maintained for a dwell time of 5 s. The average value of the hardness is calculated from 5 different points on the circular cross-section.
The obtained values of the turning-burnishing performances are shown in Figure 4.

5. Results and Discussion

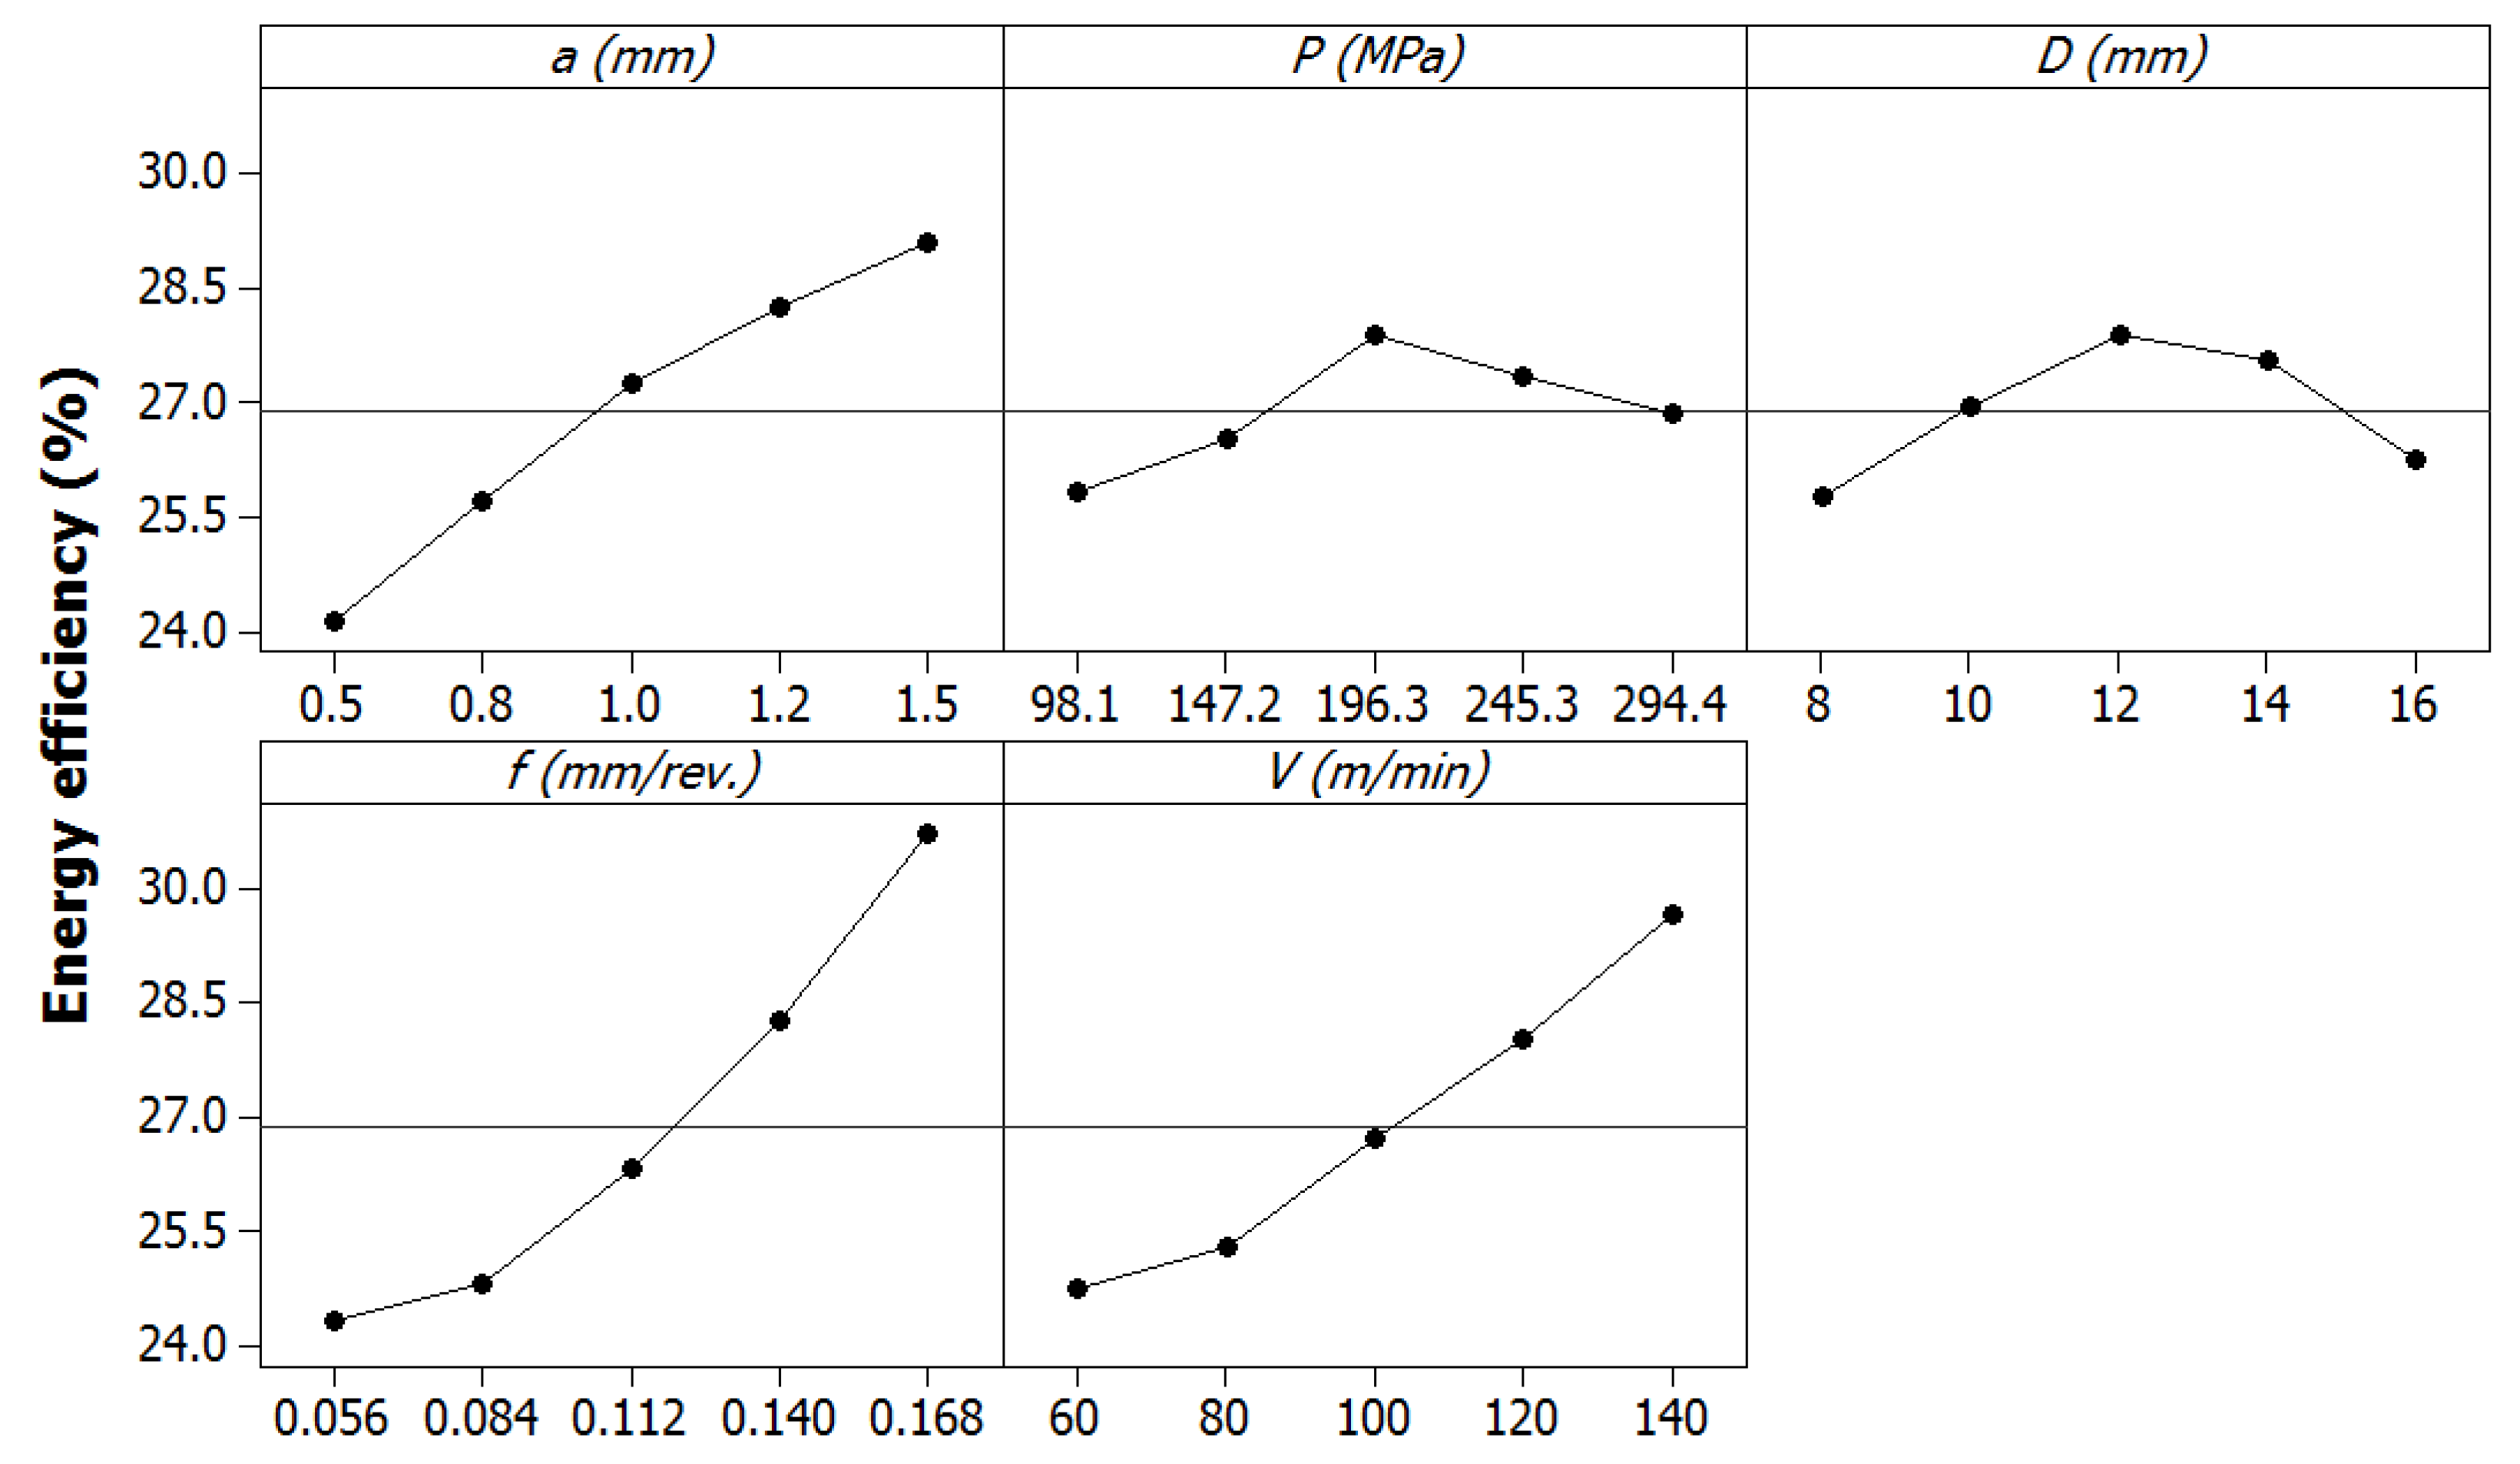
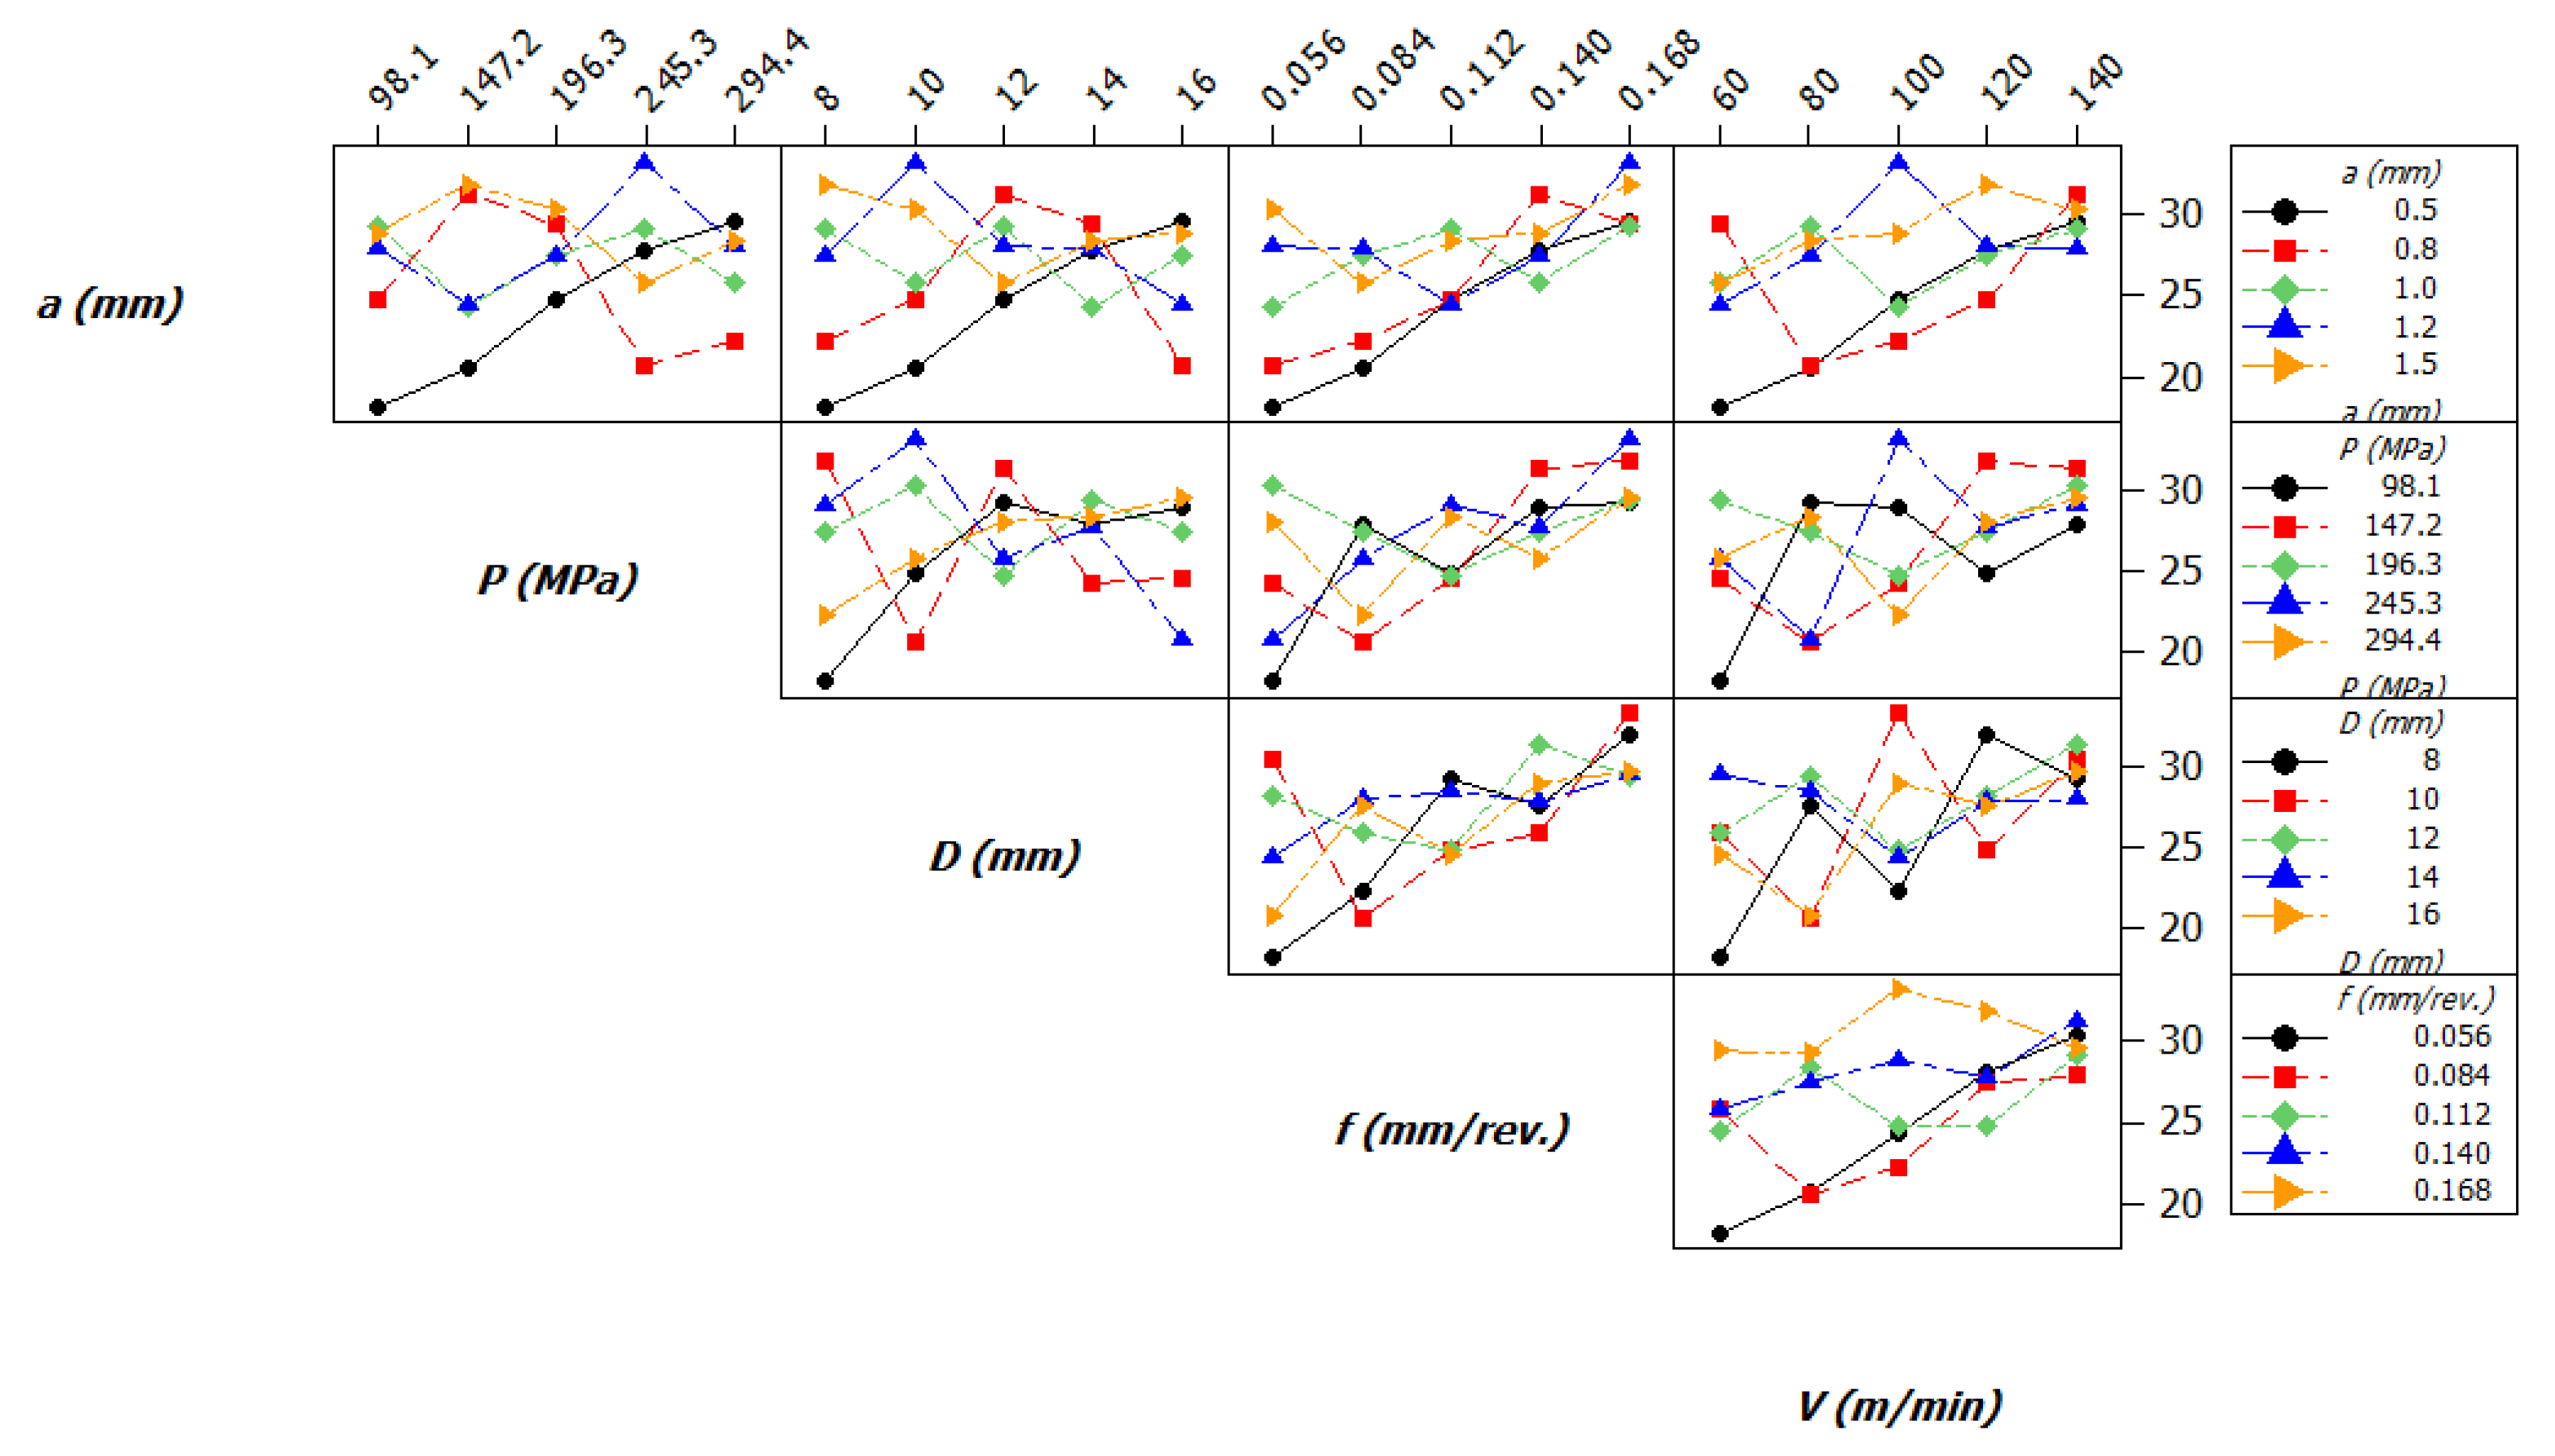
5.1. Parametric Effects

The experimental results of the turning-burnishing process are shown in Appendix Table A1. In this sub-section, the impacts of the machining parameters on the responses have been thoroughly analyzed. Moreover, analysis of variance (ANOVA) is applied to identify the significance of the models and parametric contributions. The results are analyzed with the aid of the Minitab software.
The impacts of the varied factors on the energy efficiency of the turning-burnishing process are shown in Figure 5. For the turning-burnishing operation, higher energy efficiency is preferred.
Higher energy efficiency is obtained with an increased depth of cut. When the depth of cut increases, the thickness of the turned chip is increased due to an increment in the contact area between the turning insert and the workpiece. More material processed results in larger plastic deformation, leading to greater resistance. As a result, a higher active power is required to overcome resistance; hence, energy efficiency is enhanced.
Higher energy efficiency is firstly found with increased burnishing pressure. As the burnishing pressure increases, a higher degree of plastic deformation of the machined surface is obtained. Greater resistance is then produced. Therefore, the higher active power is consumed to overcome the reaction load and energy efficiency increases. A further burnishing pressure may cause excessive resistance, which leads to an increase in reactive power; hence, energy efficiency decreases.
It can be stated that an increased ball diameter causes higher energy efficiency. As the diameter increases, the machining area between the burnishing ball and the workpiece is higher. More material is burnished, and larger deformation is produced. Greater resistance and friction are generated. Obviously, higher active power is required to burnish material; hence, higher energy efficiency is obtained. When the diameter increases from 12 to 16 mm, excessive resistance and friction are produced, this requires higher reactive power. Therefore, energy efficiency decreases.
An increased feed rate causes an enhancement in energy efficiency. A higher feed rate causes a higher reaction load, which requires an increment in the active power to process material. Additionally, a higher value of the feed rate may lead to an increment in the machining temperature, which may cause the work-hardening on the machined sample. This results in an increase in active power due to greater resistance on the workpiece surface. Therefore, higher energy efficiency is achieved with an increment in the feed rate.
Similarly, increased speed leads to an enhancement in energy efficiency. A higher value of the momentum on the spindle motor is produced at an increased speed, which causes an increased active power. Therefore, higher energy efficiency is obtained. Moreover, increased speed leads to a reduction in the machining time, resulting in a decreased energy consumed, which may increase energy efficiency.
The interaction effects of the machining parameters on energy efficiency are shown in Figure 6.
The contribution of each factor on energy efficiency is shown in Table 3. As a result, the feed rate is the most significant factor with a contribution of 17.98%, followed by the speed (14.47%), depth of cut (12.39%), pressure (6.02%), and ball diameter (3.95%), respectively. The p2 has the highest contribution regarding the quadratic terms (8.97%), followed by the d2 (8.82%), f2 (5.12%), a2 (2.67%), and v2 (2.64%), respectively.
Figure 7 depicts the influences of the machining parameters on the decreased roughness ratio. To enhance the machined quality, low DRR is desirable.
As a result, a lower value of the DRR is obtained at the lowest depth of cut. The DRR value is increased with an increment in the depth. At a low depth, a small amount of material is processed and the turned chip is easily removed from the workpiece surface; hence, the machined roughness and DRR values are low. When the depth of cut increases, the machining area between the insert and the workpiece increases. A bigger chip is heavily detached from the machined sample, leading to an increased roughness or DRR value.
The DRR is firstly decreased with increased burnishing pressure. A further burnishing pressure leads to an increment in the DRR. An increment in the burnishing pressure causes increased machining pressure on the sample, which increases the degree of the plastic deformation. Larger material is compressed, which causes a reduction in roughness and DRR value. However, further burnishing pressure may cause the machining instability due to greater reaction pressure during the machining period, which leads to an increase in the deterioration of the surface quality; hence, the roughness and DRR value are increased.
The roughness and DRR value are increased with an increment in the ball diameter. When the ball diameter increases, a machining length between the turned surface and the ball is decreased, leading to smaller peaks. Therefore, the roughness and DRR value are reduced.
The roughness and DRR values are decreased at a low feed rate due to the small distance between the successively turning or burnishing paths. A higher feed rate leads to an increased distance between the turned peaks. Therefore, a higher feed mark is left on the machined sample; hence, higher roughness is produced. Moreover, a higher burnishing trace is generated at the high feed rate, which causes an increase in the roughness.
The roughness and DRR values are decreased with an increased speed. The machine tool vibration may suppress at an increased speed, leading to the machining stability. Moreover, an increased speed causes an increase in the machining temperature; hence, the workpiece is reduced. For the turning, the chip is easily detached from the machined sample. For the burnishing, the material is easily burnished; hence, a roughness is decreased. However, further machining speed causes the excessive temperature in the machining region, which results in the work-hardening behavior on the workpiece [31,32]. For the turning stage, the turned chip is heavily removed. For the burnishing stage, the machined material is hardly burnished. Therefore, the roughness is increased when the speed changes from 100 to 140 m/min.
Figure 8 depicts the interactive effects of machining parameters on the decreased roughness rate.
Table 4 illustrates the contributions of the inputs, which have a significant impact on the decreased roughness ratio. As a result, the feed rate is the highest effective factor due to the contribution of 15.94%, followed by the depth of cut (16.63%), diameter (10.05%), pressure (2.50%), and speed (1.70%), respectively. The contributions of the p2, f2, v2, and a2 are 13.28%, 9.37%, 8.61%, and 5.93%, respectively.
The burnished images at different process inputs are depicted in Figure 9. The smooth surfaces are obtained with the aid of the turning-burnishing process. The turned marks are eliminated on the burnished surface.
Figure 10 depicts the influences of machining parameters on the improved hardness ratio. For the turning-burnishing process, higher IHR is preferred.
The improved hardness rate is associated with an increment in the depth of cut. Moreover, a further depth of cut causes a slight reduction in the IHR. An increased depth of cut causes a larger degree of work-hardening, resulting in a higher IHR value. However, a further depth of cut leads to higher machining temperature, which may relieve the residual stress; hence, the IHR value is then decreased.
Higher IHR value is found at an increased burnishing pressure. Moreover, a further burnishing pressure causes a decrease in the IHR. As the burnishing pressure increases, more material is compressed and burnished. A higher degree of plastic deformation is generated; hence, higher IHR is obtained. However, a further burnishing pressure may cause the relieved residual stress. Therefore, the IHR value is decreased.
A lower IHR value is obtained with an increment in the ball diameter. An increased diameter causes an increment in the machining area between the ball and workpiece, which decreases the compressed pressure. A low degree of plastic deformation is produced and the IHR value is decreased.
A higher IHR value is obtained with an increment in the feed rate and/or speed. An increased feed rate causes a larger degree of work-hardening, resulting in an enhanced hardness. As the machining speed increases, the temperature is increased, resulting in an improvement in the larger plastic deformation; hence, the hardness is enhanced. A further feed rate and/or speed may cause an increase in the machining temperature, which leads to reductions in the hardness.
Figure 11 presents the interactive effects of machining parameters on the improved hardness ratio.
Table 5 shows the contributions of the inputs for the improved hardness rate. As a result, the diameter has the largest contribution (15.05%), followed by the depth of cut (7.50%), speed (6.80%), and feed rate (4.60%), respectively. The contributions of the a2, p2, d2, f2, and v2 are 14.20%, 12.60%, 12.27%, 8.59%, and 2.64%, respectively.

5.2. Optimization Results

The normalized values of the responses are shown in Table 6. The eigenvalues and proportions for the principal components are depicted in Table 7. As a result, the first component accounts for 71.90%, followed by the second component (26.40%) and the third component (1.70%), respectively. The eigenvectors of the principal components are shown in Table 8. The weight values are calculated based on the squares of subsequent eigenvectors of the first and second components. Table 8 revealed that the weight values of the EF, DRR, and IHR are 0.28, 0.34, and 0.44, respectively.
The normalized weighted values are shown in Table 9. The values of the positive and negative values are shown in Table 10. The highest desirability value is obtained at the experimental number 13. The optimal values of the depth of cut, burnishing pressure, diameter, feed rate, and turning speed are 1.00 mm, 0.4 MPa, 16.0 mm, 0.084 mm/rev., and 120 m/min, respectively. The optimal outcomes of the EF, DRR, and IHR are 27.52%, 0.17, and 1.71, respectively. The average roughness and Vicker hardness at the optimal solution are 0.34 µm and 164 HV, respectively. The improvements in the EF, DRR, and IHR are 20.75%, 19.05%, and 8.23%, as compared to common values used (Table 11).
With an increase in the energy price and environmental legislation, enhancing the energy efficiency of machining operations is an urgent demand for industrial manufacturers. Additionally, improving machined quality is also an important requirement to satisfy customer demand and increase profit. For this purpose, a parameter-based optimization of the new turning-burnishing has been addressed to maximize energy efficiency and enhance the machined quality. The technical performances are energy efficiency, decreased roughness ratio, and improved hardness ratio, respectively. The optimization conditions are the machining speed, depth of cut, feed rate, and ball diameter, and burnishing pressure. The optimal solution has significantly contributed to the improvements in energy efficiency and machined quality. The outcomes obtained can be used for the expert knowledge-based system for the turning-burnishing operation. Moreover, the finding is expected as a technical solution to make the turning-burnishing become greener and more efficient.

6. Conclusions

In the current research, an optimization of the hybrid turning-burnishing process has been considered to improve energy efficiency and product quality. The machining responses are energy efficiency, decreased roughness ratio, and improved hardness ratio. Five key factors are the depth of cut, burnishing pressure, the diameter of the compressing ball, the feed rate, and the turning speed. The experimental outcomes were obtained from the trails using the Taguchi method. The weight principle component analysis was employed to determine the weight value of each response. The TOPSIS method was applied to select the optimal solution. Some findings obtained are listed as:
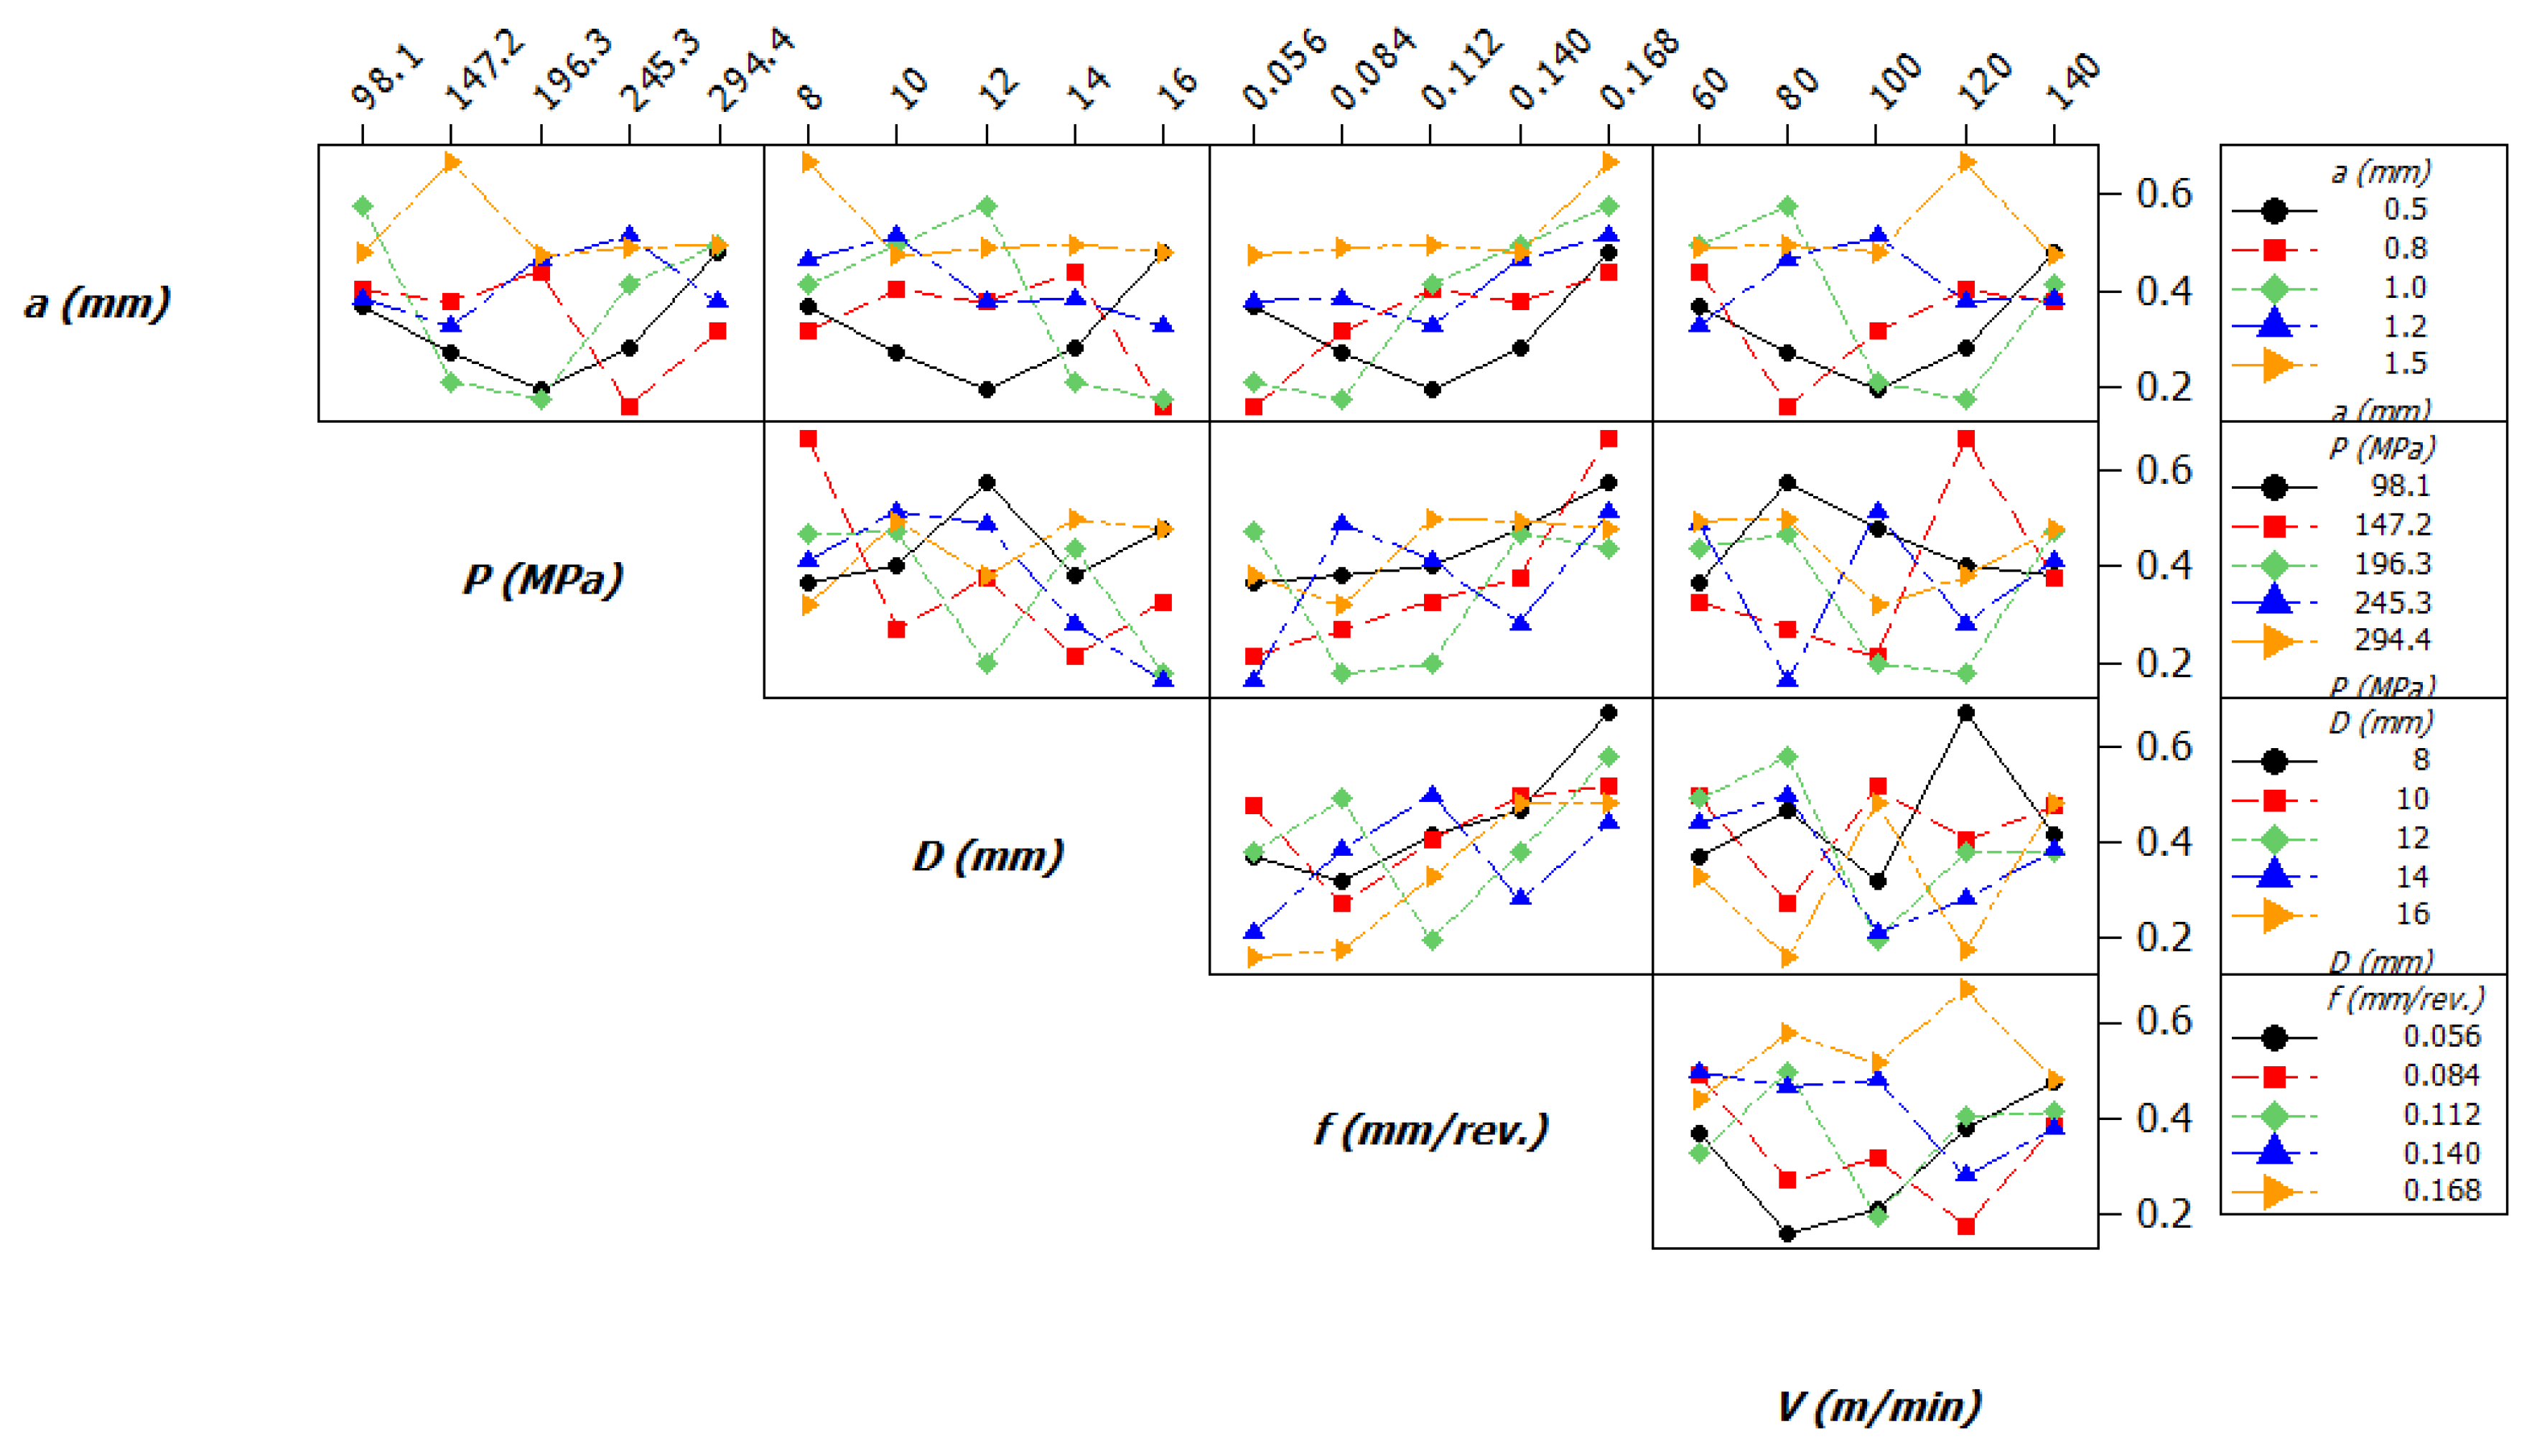
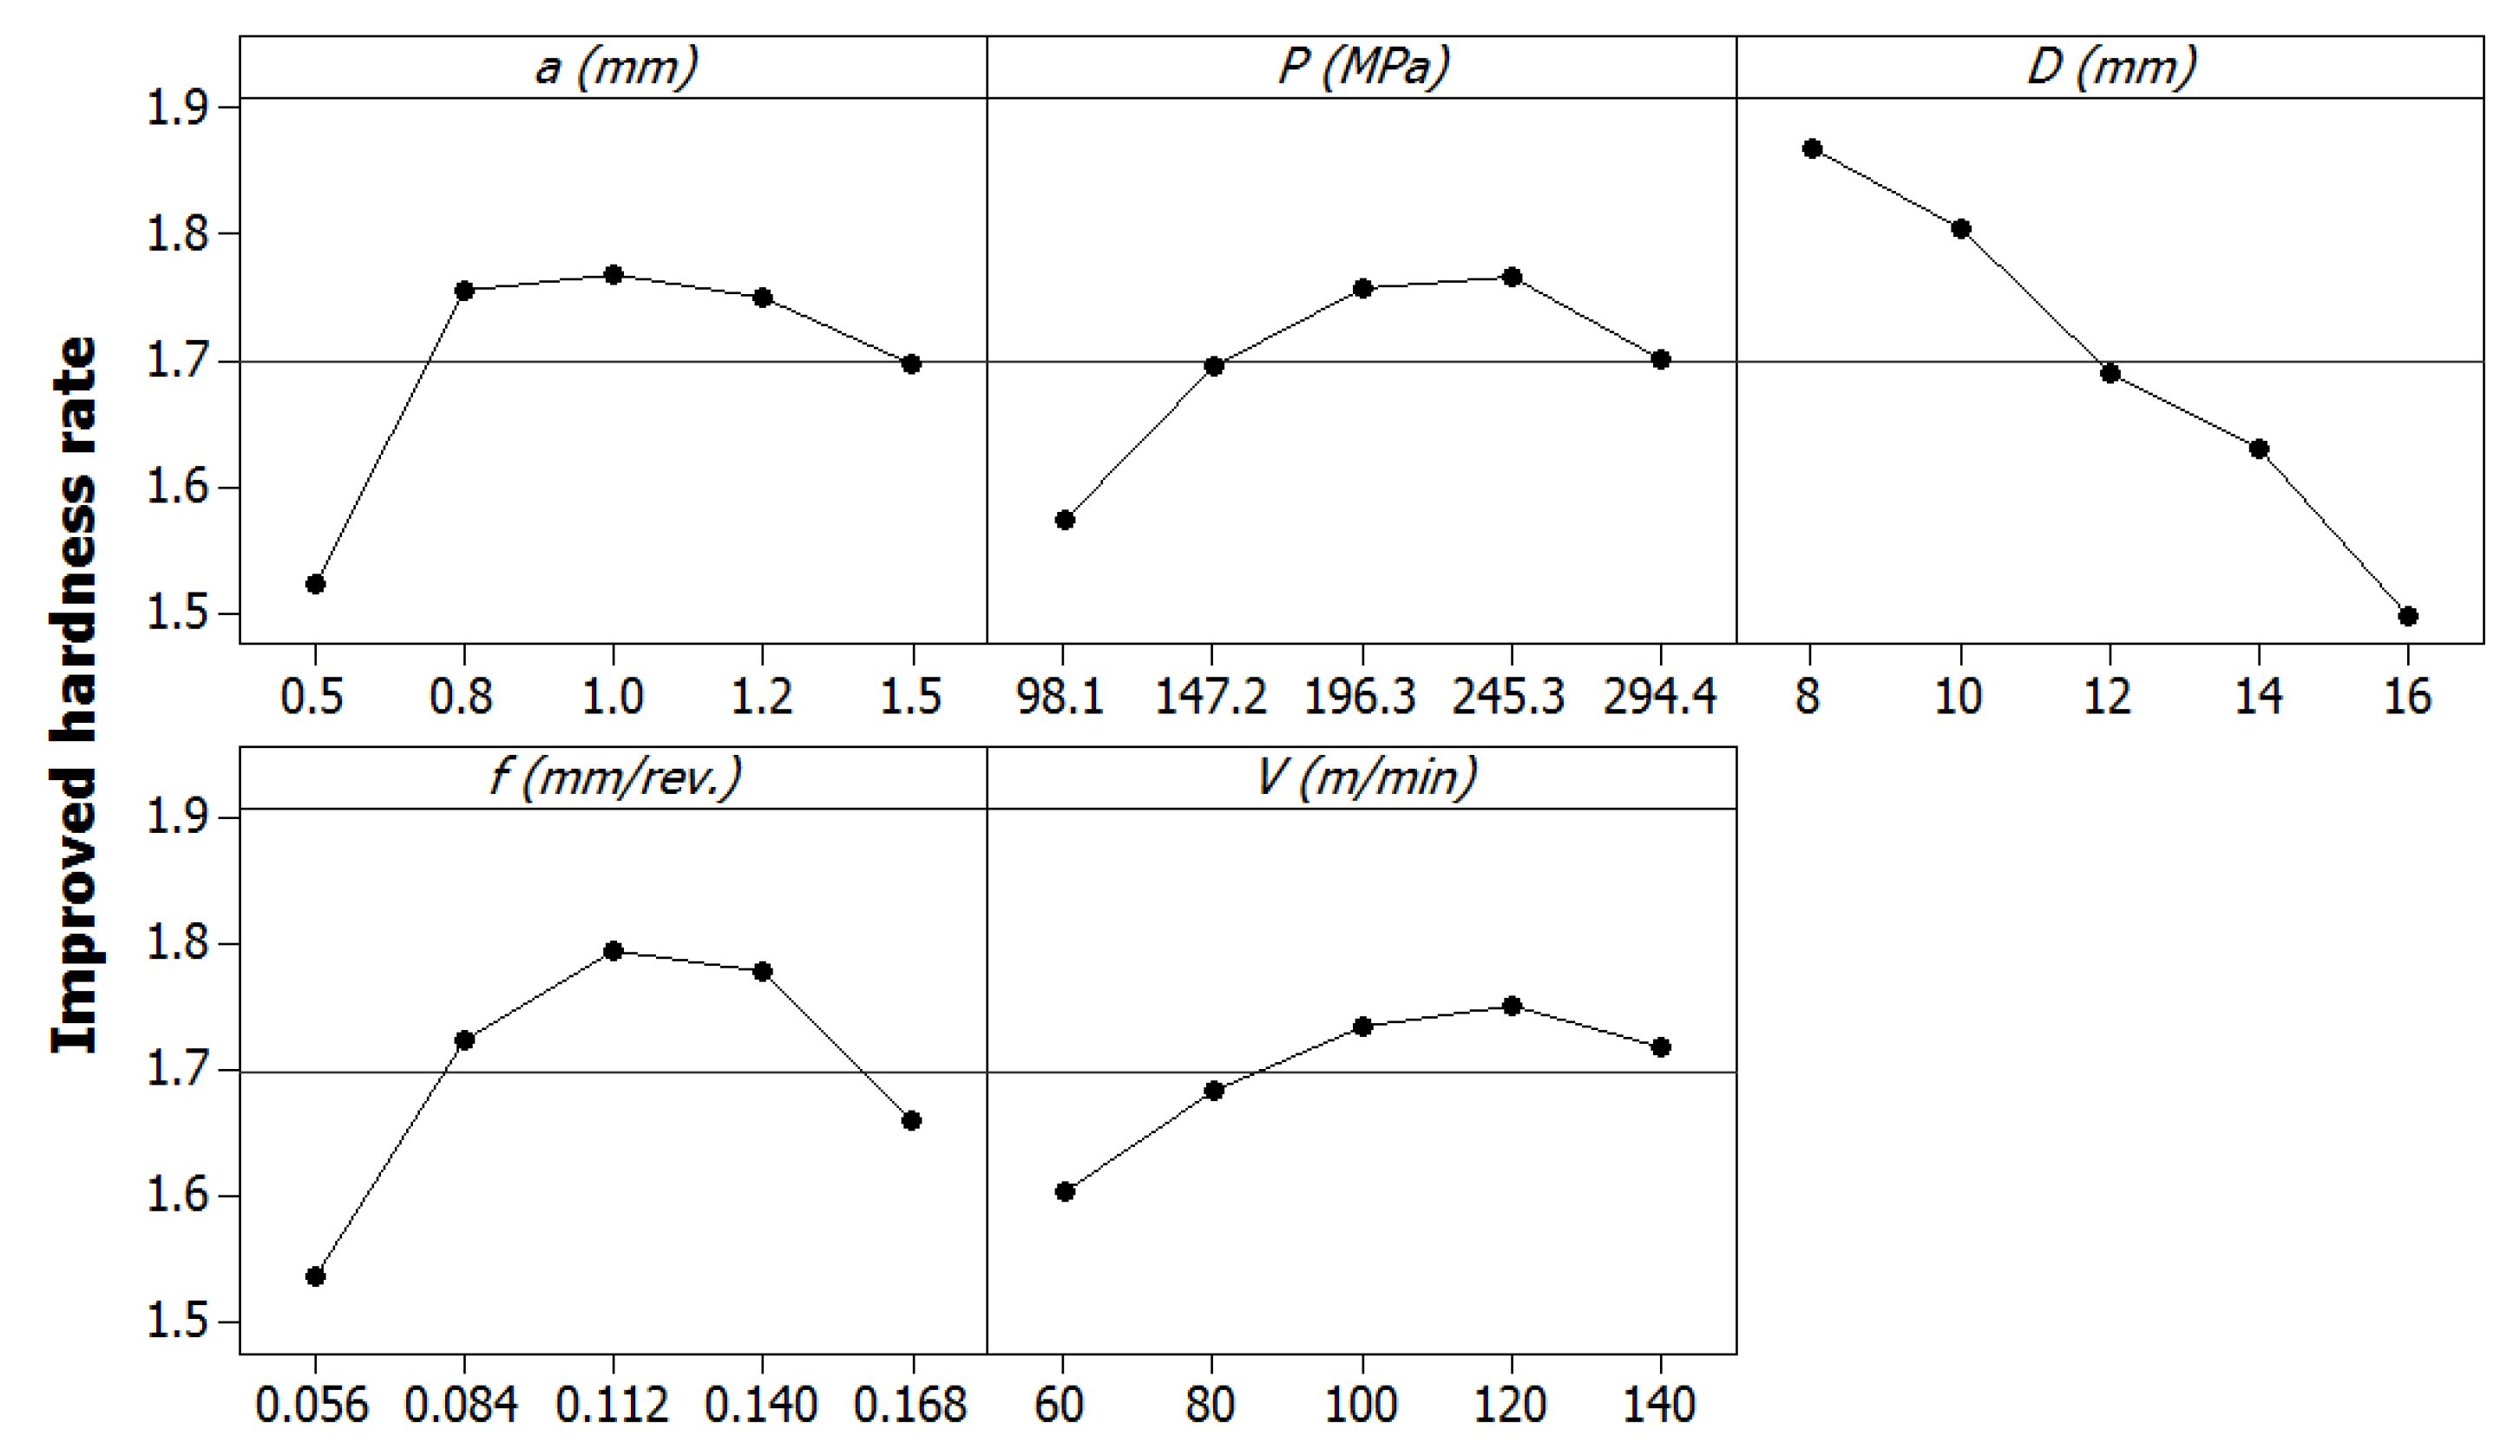
  • The highest values of the depth of cut, feed rate, and turning speed cause an increased energy efficiency, while the middle levels of the diameter and burnishing pressure can be used to obtain higher energy efficiency. The lowest levels of the depth of cut and feed are recommended to decrease roughness, while the larger diameter is used to achieve a smooth surface. The middle values of the burnishing pressure and speed can be employed to enhance the machined quality. Higher hardness is obtained with an increment in the depth of cut, burnishing pressure, and turning speed. A low diameter can be employed to obtain a higher hardness, while the middle value of the feed can be applied to improve hardness.
  • The optimal factors setting obtained by TOPSIS of the depth of cut, burnishing pressure, ball diameter, feed rate, and turning speed were 1.00 mm, 0.4 MPa, 16.0 mm, 0.084 mm/rev, and 100 m/min. The EF and IHR were enhanced by 20.75% and 8.23%, while the DRR was decreased by 19.05%. Additionally, the outcomes can be considered as technical solutions for improvements in energy efficiency and machined quality of the turning-burnishing processes.
  • The hybrid approach, including the Taguchi method, WPCA, and TOPSIS, can extensively support the optimization of the hybrid operation when the responses have contradictory impacts. The proposed method was employed to save machining costs and efforts due to the lesser number of experiments. The WPCA was used to identify the weight for each objective, without the maker ‘subjective choice’. Therefore, the hybrid approach is multi-purposeful and can be applied to different manufacturing operations.
  • It is difficult to apply the new turning-burnishing tool to machine difficult-to-cut material and/or hardened steels. The proper materials for the hybrid process are aluminum, copper, and brass. Moreover, an increase in the burnishing head and pneumatic cylinder can be used to enhance the machined quality.
  • This work addressed the three machining responses, including energy efficiency, roughness, and hardness, that were considered as the outputs. Other responses such as residual stress and the depth of the hardened layer should be studied in order to holistically optimize the turning-burnishing process.

Author Contributions

Conceptualization, T.-T.N. and M.M.; methodology, T.-T.N. and M.M.; software, T.-T.N. and M.M.; validation, T.-T.N. and M.M.; data curation, T.-T.N.; writing—original draft preparation, T.-T.N. and M.M.; writing—review and editing, T.-T.N. and M.M.; funding acquisition, M.M. All authors have read and agreed to the published version of the manuscript.

Funding

This research is funded by Vietnam National Foundation for Science and Technology Development (NAFOSTED) under grant number 107.04-2020.02.

Conflicts of Interest

The authors declare no conflict of interest.

Appendix A

Table A1. Experimental data of the hybrid process.
No.a
(mm)
p
(MPa)
d
(mm)
f
(mm/rev.)
v
mm/min
EF
(%)
RTB
µm
HTB
HV
DDRIHR
10.50.280.0566018.110.721260.371.32
20.50.3100.0848020.520.531540.271.60
30.50.4120.11210024.730.381680.191.75
40.50.5140.1412027.750.551570.281.64
50.50.6160.16814029.580.941250.481.31
60.80.2100.11212024.790.791810.401.89
70.80.3120.1414031.370.741780.381.85
80.80.4140.1686029.420.861520.441.58
90.80.5160.0568020.710.311430.161.49
100.80.680.08410022.240.621890.321.97
1110.2120.1688029.371.131500.581.56
1210.3140.05610024.300.411510.211.57
1310.4160.08412027.520.341640.171.71
1410.580.11214029.160.812010.412.09
1510.6100.146025.840.971830.501.91
161.20.2140.08414027.900.751580.381.65
171.20.3160.1126024.530.641470.331.53
181.20.480.148027.450.921960.472.04
191.20.5100.16810033.291.011850.521.93
201.20.6120.05612028.130.741540.381.60
211.50.2160.1410028.950.941400.481.46
221.50.380.16812031.951.321850.671.92
231.50.4100.05614030.340.931630.471.70
241.50.5120.0846025.780.961620.491.69
251.50.6140.1128028.420.981650.501.72

References

  1. Rech, J.; Hamdi, H.; Valette, S. Workpiece Surface Integrity. In Machining; Springer: London, UK, 2008. [Google Scholar] [CrossRef]
  2. Frăţilă, D.; Caizar, C. Investigation of the Influence of Process Parameters and Cooling Method on the Surface Quality of AISI-1045 during Turning. Mater. Manuf. Process. 2012, 27, 1123–1128. [Google Scholar] [CrossRef]
  3. Jafarian, F.; Amirabadi, H.; Sadri, J.; Banooie, H.R. Simultaneous Optimizing Residual Stress and Surface Roughness in Turning of Inconel718 Superalloy. Mater. Manuf. Process. 2014, 29, 337–343. [Google Scholar] [CrossRef]
  4. Shi, K.; Zhang, D.; Ren, J. Optimization of Process Parameters for Surface Roughness and Microhardness in Dry Milling of Magnesium Alloy Using Taguchi with Grey Relational Analysis. Int. J. Adv. Manuf. Technol. 2015, 81, 645–651. [Google Scholar] [CrossRef]
  5. Bhopale, N.N.; Pawade, R.S.; Joshi, S.S. Surface Quality Analysis in Ball End Milling of Inconel 718 Cantilevers by Response Surface Methodology. Proc. Inst. Mech. Eng. B 2015, 231, 628–640. [Google Scholar] [CrossRef]
  6. Da Silva, L.R.; Couto, D.A.; dos Santo, F.V.; Duarte, F.J.; Mazzaro, R.S.; Veloso, G.V. Evaluation of Machined Surface of the Hardened AISI 4340 Steel Through Roughness and Residual Stress Parameters in Turning and Grinding. Int. J. Adv. Manuf. Technol. 2020, 107, 791–803. [Google Scholar] [CrossRef]
  7. Duo, L.; Xiangqian, J.; Zhen, T.; Liam, B. Development and Application of Interferometric On-Machine Surface Measurement for Ultraprecision Turning Process. J. Manuf. Sci. Eng. 2019, 141, 014502. [Google Scholar] [CrossRef] [Green Version]
  8. Li, D.; Wang, B.; Qiao, Z.; Jiang, X. Ultraprecision machining of microlens arrays with integrated on-machine surface metrology. Opt. Express 2019, 27, 212–224. [Google Scholar] [CrossRef]
  9. Yao, C.; Ma, L.; Du, Y.; Ren, J.; Zhang, D. Surface Integrity and Fatigue Behavior in Shot-Peening for High-Speed Milled 7055 Aluminum Alloy. Proc. Inst. Mech. Eng. B 2017, 231, 243–256. [Google Scholar] [CrossRef]
  10. Nguyen, T.T.; Cao, L.H.; Nguyen, T.A.; Dang, X.P. Multi-response optimization of the roller burnishing process in terms of energy consumption and product quality. J. Clean. Prod. 2020, 245, 119328. [Google Scholar] [CrossRef]
  11. Amdouni, H.; Bouzaiene, H.; Montagne, A.; Nasri, M.; Iost, A. Experimental study of a six new ball-burnishing strategies effects on the Al-alloy flat surfaces integrity enhancement. Int. J. Adv. Manuf. Tech. 2017, 90, 2271–2282. [Google Scholar] [CrossRef] [Green Version]
  12. John, M.R.S.; Banerjee, N.; Shrivastava, K.; Vinayagam, B.K. Optimization of Roller Burnishing Process on EN-9 Grade Alloy Steel using Response Surface Methodology. Braz. Soc. Mech. Sci. Eng. 2017, 39, 3089–3101. [Google Scholar] [CrossRef]
  13. Nguyen, T.T.; Le, X.B. Optimization of Interior Roller Burnishing Process for Improving Surface Quality. Mater. Manuf. Process. 2018, 33, 1233–1241. [Google Scholar] [CrossRef]
  14. Nguyen, T.T.; Le, X.B. Optimization of roller burnishing process using Kriging model to improve surface properties. Proc. Inst. Mech. Eng. B 2019, 233, 2264–2282. [Google Scholar] [CrossRef]
  15. Sachin, B.; Narendranath, S.; Chakradhar, D. Selection of Optimal Process Parameters in Sustainable Diamond Burnishing of 17-4 PH Stainless Steel. Proc. Inst. Mech. Eng. B 2019, 41, 219. [Google Scholar] [CrossRef]
  16. Świrad, S.; Wydrzynski, D.; Nieslony, P.; Krolczyk, G.M. Influence of Hydrostatic Burnishing Strategy on the Surface Topography of Martensitic Steel. Measurement 2019, 138, 590–601. [Google Scholar] [CrossRef]
  17. Grzesik, W.; Krzysztof, Ż. Modification of surface finish produced by hard turning using superfinishing and burnishing operations. J. Mater. Process. Technol. 2012, 212, 315–322. [Google Scholar] [CrossRef]
  18. Axinte, D.A.; Gindy, N. Turning assisted with deep cold rolling-a cost efficient hybrid process for workpiece surface quality enhancement. Proc. Inst. Mech. Eng. B J. Eng. Manuf. 2004, 218, 807–811. [Google Scholar] [CrossRef]
  19. Mezlini, S.; Mzali, S.; Sghaier, S.; Braham, C.; Kapsa, P. Effect of a combined machining/burnishing tool on the roughness and mechanical properties. Lubr. Sci. 2014, 26. [Google Scholar] [CrossRef] [Green Version]
  20. Rami, A.; Kallel, A.; Djemaa, S.; Mabrouki, T.; Sghaier, S.; Hamdi, H. Numerical assessment of residual stresses induced by combining turning-burnishing (cotub) process of aisi 4140 steel using 3d simulation based on a mixed approach. Int. J. Adv. Manuf. Technol. 2018, 97, 1897–1912. [Google Scholar] [CrossRef]
  21. Rami, A.; Gharbi, F.; Sghaier, S.; Hamdi, H. Some Insights on Combined Turning-Burnishing (CoTuB) Process on Workpiece Surface Integrity. Int. J. Precis. Eng. Manuf. 2018, 19, 67–78. [Google Scholar] [CrossRef]
  22. Nguyen, T.; Nguyen, T.; Trinh, Q. Optimization of Milling Parameters for Energy Savings and Surface Quality. Arab. J. Sci. Eng. 2020. [Google Scholar] [CrossRef]
  23. Nguyen, T.-T.; Duong, Q.-D.; Mia, M. Sustainability-Based Optimization of the Rotary Turning of the Hardened Steel. Metals 2020, 10, 939. [Google Scholar] [CrossRef]
  24. Swirad, S.; Pawlus, P. The Effect of Ball Burnishing on Tribological Performance of 42CrMo4 Steel under Dry Sliding Conditions. Materials 2020, 13, 2127. [Google Scholar] [CrossRef] [PubMed]
  25. Jerez-Mesa, R.; Plana-García, V.; Llumà, J.; Travieso-Rodriguez, J.A. Enhancing Surface Topology of Udimet®720 Superalloy through Ultrasonic Vibration-Assisted Ball Burnishing. Metals 2020, 10, 915. [Google Scholar] [CrossRef]
  26. Amini, C.; Jerez-Mesa, R.; Travieso-Rodriguez, J.A.; Llumà, J.; Estevez-Urra, A. Finite Element Analysis of Ball Burnishing on Ball-End Milled Surfaces Considering Their Original Topology and Residual Stress. Metals 2020, 10, 638. [Google Scholar] [CrossRef]
  27. Paiva, A.P.; Costa, S.C.; Paiva, E.J.; Balestrassi, P.P.; Ferreira, J.R. Multi-objective optimization of pulsed gas metal arc welding process based on weighted principal component scores. Int. J. Adv. Manuf. Technol. 2010, 50, 113–125. [Google Scholar] [CrossRef]
  28. Costa, D.M.D.; Belinato, G.; Brito, T.G.; Paiva, A.P.; Ferreira, J.R.; Balestrassi, P.P. Weighted principal component analysis combined with Taguchi’s signal-to-noise ratio to the multiobjective optimization of dry end milling process: A comparative study. J. Braz. Soc. Mech. Sci. Eng. 2017, 39, 1663–1681. [Google Scholar] [CrossRef]
  29. Nguyen, T.T.; Cao, L.H.; Dang, X.P.; Nguyen, T.A.; Trinh, Q.H. Multi-objective optimization of the flat burnishing process for energy efficiency and surface characteristics. Mater. Manuf. Process. 2019, 34, 1888–1901. [Google Scholar] [CrossRef]
  30. Park, H.; Nguyen, T.; Dang, X. Multi-objective optimization of turning process of hardened material for energy efficiency. Int. J. Precis. Eng. Manuf. 2016, 17, 1623–1631. [Google Scholar] [CrossRef]
  31. Ning, J.; Nguyen, V.; Huang, Y.; Karl, T.H.; Steven, Y.L. Constitutive modeling of ultra-fine-grained titanium flow stress for machining temperature prediction. Bio-Des. Manuf. 2019, 2, 153–160. [Google Scholar] [CrossRef]
  32. Ning, J.; Nguyen, V.; Liang, S.Y. Analytical modeling of machining forces of ultra-fine-grained titanium. Int. J. Adv. Manuf. Technol. 2019, 101, 627–636. [Google Scholar] [CrossRef]
Figure 1. A new hybrid turning-burnishing tool.
Energies 13 04929 g001
Figure 2. Systematic optimization procedure.
Energies 13 04929 g002
Figure 3. Experiments and measurements.
Energies 13 04929 g003
Figure 4. Representative values of the technical performances at the experimental No. 13: (a) Power consumed, (b) average roughness, (c) Vicker hardness.
Energies 13 04929 g004
Figure 5. The main effects of machining parameters on energy efficiency.
Energies 13 04929 g005
Figure 6. The interactive effects of machining parameters on energy efficiency.
Energies 13 04929 g006
Figure 7. The main effects of machining parameters on the decreased roughness rate.
Energies 13 04929 g007
Figure 8. The interactive effects of machining parameters on the decreased roughness rate.
Energies 13 04929 g008
Figure 9. SEM images at various conditions: (a) SEM images at experimental No. 13, and (b) SEM images at experimental No. 17.
Energies 13 04929 g009
Figure 10. The main effects of machining parameters on the improved hardness ratio.
Energies 13 04929 g010
Figure 11. The interactive effects of machining parameters on the improved hardness ratio.
Energies 13 04929 g011
Table 1. Summary of published works related to turning-burnishing processes.
YearAuthors [Ref.]ActuatorResponsesOutcomes
2004Axinte and Gindy [18]Hydraulic unitRoughness68% decreased roughness
Thickness of the depth layer300 μm of the depth of layer
2014Mezlini et al. [19]Mechanical unit Roughness77% decreased roughness
Total machining time51% decreased total time
2018Rami et al. [20]Mechanical toolPrediction of the compressive stressAcceptable accuracy for prediction
2018Rami et al. [21]Mechanical toolRoughness70% decreased roughness
HardnessEnhanced hardness
Compressive stressEnhanced compressive stress
Table 2. Varied inputs.
SymbolParametersLevel 1Level 2Level 3Level 4Level 5
aDepth of cut (mm)0.500.801.001.201.50
pBurnishing pressure (MPa)0.20.30.40.50.6
dDiameter (mm)810121416
fFeed rate (mm/rev.)0.0560.0840.1120.1400.168
vTurning speed (m/min)6080100120140
Table 3. Analysis of variance (ANOVA) results for energy efficiency.
SourceSum of SquaresMean SquareF-Valuep-ValueRemarkContribution
Model579.543628.977277.5620<0.0001Significant
a71.805571.8055192.1987<0.0001Significant12.39
p34.888534.888593.3847<0.0001Significant6.02
d22.892022.892061.2740<0.0001Significant3.95
f104.2019104.2019278.9131<0.0001Significant17.98
v83.860083.8600224.4646<0.0001Significant14.47
ap12.112512.112532.42090.0254Significant2.09
ad10.373810.373827.76720.0385Significant1.79
af14.198814.198838.00540.0214Significant2.45
av8.28758.287522.18270.0416Significant1.43
pd7.01257.012518.77000.0422Significant1.21
pf6.31706.317016.90850.0486Significant1.09
pv0.11590.11590.31021.0000Insignificant0.02
df10.257910.257927.45700.0394Significant1.77
dv10.547710.547728.23260.0383Significant1.82
fv19.124919.124951.19090.0167Significant3.30
a215.473815.473841.41810.0204Significant2.67
p251.985151.9851139.1463<0.0001Significant8.97
d251.115751.1157136.8194<0.0001Significant8.82
f229.672629.672679.42350.0059Significant5.12
v215.300015.300040.95280.0224Significant2.64
Error7.47140.3736
Total587.0150
Table 4. ANOVA results for decreased roughness rate.
SourceSum of SquaresMean SquareF-Valuep-ValueRemarkContribution
Model0.55740.027953.7928<0.0001Significant
a0.08650.0865173.0485<0.0001Significant16.63
p0.01300.013026.01450.0097Significant2.50
d0.05230.0523104.5783<0.0001Significant10.05
f0.08290.0829165.8685<0.0001Significant15.94
v0.00880.008817.68990.0468Significant1.70
ap0.00030.00030.52030.9119Insignificant0.05
ad0.00190.00193.85010.8249Insignificant0.37
af0.02710.027154.21420.0053Significant5.21
av0.00890.008917.89800.047Significant1.72
pd0.02430.024348.59510.0110Significant4.67
pf0.00970.009719.45880.0446Significant1.87
pv0.00000.00000.00001.0000Insignificant0
df0.00100.00101.97710.9119Insignificant0.19
dv0.00480.00489.67740.5814Insignificant0.93
fv0.00000.00000.00001.0000Insignificant0
a20.03090.030961.70640.0049Significant5.93
p20.06910.0691138.1890<0.0001Significant13.28
d20.00510.005110.19770.6106Insignificant0.98
f20.04880.048897.5024<0.0001Significant9.37
v20.04480.044889.59390.0002Significant8.61
Error0.01040.0005
Total0.5677
Table 5. ANOVA results for improved hardness rate.
SourceSum of SquaresMean SquareF-Valuep-ValueRemarkContribution
Model1.04840.052474.8865<0.0001Significant
a0.07860.0786112.3298<0.0001Significant7.50
p0.00280.00284.04390.9864Insignificant0.27
d0.15780.1578225.4085<0.0001Significant15.05
f0.04820.048268.8956<0.0001Significant4.60
v0.07130.0713101.8457<0.0001Significant6.80
ap0.05610.056180.1286<0.0001Significant5.35
ad0.00290.00294.19360.7888Insignificant0.28
af0.00950.009513.62930.3849Insignificant0.91
av0.07910.0791112.92890.0032Significant7.54
pd0.00470.00476.73980.6657Insignificant0.45
pf0.00000.00000.00001.0000Insignificant0
pv0.00000.00000.00001.0000Insignificant0
df0.00180.00182.54610.8707Insignificant0.17
dv0.00610.00618.68680.5765Insignificant0.58
fv0.00210.00212.99550.8455Insignificant0.20
a20.14890.1489212.6777<0.0001Significant14.20
p20.13210.1321188.7141<0.0001Significant12.60
d20.12860.1286183.7715<0.0001Significant12.27
f20.02770.027739.54010.0098Significant2.64
v20.09010.0901128.6551<0.0001Significant8.59
Error0.01400.0007
Total1.1635
Table 6. Normalized results of machining responses.
No.EFDDRIHR
11.00000.43240.9924
20.88260.59260.8188
30.73230.84210.7486
40.65260.57140.7988
50.61220.33331.0000
60.73050.40000.6931
70.57730.42110.7081
80.61560.36360.8291
90.87451.00000.8792
100.81430.50000.6650
110.61660.27590.8397
120.74530.76190.8344
130.65810.94120.7661
140.62110.39020.6268
150.70090.32000.6859
160.64910.42110.7939
170.73830.48480.8562
180.65970.34040.6422
190.54400.30770.6788
200.64380.42110.8188
210.62560.33330.8973
220.56680.23880.6823
230.59690.34040.7706
240.70250.32650.7751
250.63720.32000.7616
Table 7. Eigenvalues and proportions of principal components.
Principal ComponentEigenvaluesProportion (%)
First1.975971.90
Second1.145626.40
Third0.17841.70
Table 8. Eigenvectors and contributions for the principal components (PC).
CharacteristicsEigenvectorsContribution (%)
PC1PC2PC3
EF0.6590.080.7490.22
DDR0.570.600.5610.34
IHR0.4910.800.3520.44
Table 9. Normalized weighted values.
No.EFDDRIHR
10.02940.06080.0679
20.03330.04430.0823
30.04010.03120.0900
40.04500.04600.0843
50.04800.07880.0674
60.04020.06570.0972
70.05090.06240.0951
80.04770.07220.0812
90.03360.02630.0766
100.03610.05250.1013
110.04760.09520.0802
120.03940.03450.0807
130.04460.02790.0879
140.04730.06730.1075
150.04190.08210.0982
160.04520.06240.0848
170.03980.05420.0787
180.04450.07720.1049
190.05400.08540.0992
200.04560.06240.0823
210.04690.07880.0751
220.05180.11000.0987
230.04920.07720.0874
240.04180.08050.0869
250.04610.08210.0884
Table 10. Desirability values and ranking.
No.S+S-DRanking
10.05800.04920.936016
20.03730.06740.97987
30.02290.08270.99372
40.03170.06800.98544
50.06640.03630.891723
60.04300.05450.967211
70.03830.05910.97588
80.05330.04420.939615
90.03700.08430.98406
100.03240.06700.98465
110.07440.02670.828325
120.03160.07730.98733
130.02180.08600.99451
140.04160.06120.97259
150.05790.04340.928419
160.04350.05310.965612
170.04260.05790.969710
180.05180.05210.951014
190.05970.04720.929818
200.04480.05240.963113
210.06210.03660.904622
220.08420.03850.844524
230.05490.04320.934817
240.05920.03750.91452210
250.05950.03870.916220
Table 11. The optimum results.
Methoda
(mm)
p
(MPa)
d
(mm)
f
(mm/rev)
v
mm/min
EF
(%)
RTB
µm
HTB
HV
DDRIHR
Initial0.750.3120.0909021.810.421520.211.58
Optimal1.000.4160.08412027.520.341640.171.71
Improvement (%)20.75 −19.058.23

