Abstract
The interaction between natural gas and electricity networks is becoming more significant due to the projected large penetration of renewables into the energy system to meet the emission targets. This is due to the role of gas-fired plants in providing backup to renewables as the linkage between these networks. Therefore, this paper proposes a deterministic coordinated model for the secure and optimal operation of integrated natural gas and electricity transmission networks by taking into account the N-1 contingency analysis on both networks. In order to reduce the computational burden and time, an iterative algorithm is proposed to select the critical cases and neglect other contingencies, which do not have a significant impact on the energy system. The proposed integrated mixed-integer nonlinear programming operational model is evaluated and compared to another enhanced separated model on the IEEE 24-bus and 15-node gas test systems. The results emphasize the importance and effectiveness of the proposed framework (up to 6.7% operational costs savings are achieved).
1. Introduction
According to International Energy Agency (IEA), global natural gas demand and the share of renewable energy are projected to increase by 1.6% and 12.4% in 2023, respectively (compared to 2018 levels) [,].
Gas-fired power plants (GFPPs) characterized by low carbon emissions, low investment cost, and high flexibility play a key role in maintaining the challenging issue of supply-demand balance in power systems with the ever-increasing penetration of renewable energy sources (RESs). GFPPs, the appearance of power-to-gas (P2G) technologies and gas compressors driven by electricity have intensified the linkage between the natural gas and electricity networks (NGEN) [,].
From security perspectives, incidents such as outage of components in NGEN result in significant challenges in the operation of these networks to supply the energy demand. Consequently, the operation of GFPPs (i.e., the main link between these networks) changes as well. In other words, the security and reliability of each network directly influences the other energy vector. As a result, this interaction between these networks highlights the importance of integrated operation of NGEN to enhance the energy system security [,,].
Energy storage systems are one of the most important pieces of equipment to maintain power balance in the power system, especially in presence of significant amount of RESs. In [], the role of the storage system in balancing the European electricity system is investigated. In [], it is demonstrated that electrical energy storages play a key role in facilitating the integration of intermittent RESs. In [], it is shown that, by using molten salt-based storages, the steam turbines’ cycles are extended. Consequently, network flexibility increases and the penetration level of RESs in the power system can be increased. Therefore, this can significantly reduce generation from units characterized with high carbon dioxide emissions. The importance of gas storage facilities can provide flexibility to the operation of energy systems in maintaining the supply-demand balance. Hence, different types of energy storage systems play a very important role in the integration of NGEN.
Many studies have addressed the interaction and necessity of the integration of gas and electricity systems. The value of integrated NGEN is investigated in []. Flexible technologies, such as flexible gas compressors, battery storage, P2G, and demand-side response are employed and operation costs savings up to 21% are achieved. In other research, the value of these flexible options including GFPPs, battery storage, and demand-side response is assessed in expansion planning of integrated NGEN, which leads to significant cost reduction []. In [], a probabilistic steady-state analysis of integrated electricity, gas and heating networks is presented in different operation types. It is demonstrated that, compared to the individual operation of electricity, gas and heating systems, considering all three systems simultaneously provides a much more complicated interaction and uncertainty issues. As a result, considering P2G and power to heat (P2H) systems is useful for overload control but they can make the optimization problem complicated by transmitting the uncertainties arising from solar and wind power to the natural gas system. In [], the advantages of integrating the NGEN in reducing operation costs and preventing load shedding when an outage occurs are discussed. It is shown that the role of multi-directional compressors is significant in improving the system operation. In [], the interdependency between these networks is examined. A multi-objective framework with dynamic security considerations for the autonomous and coordinated operation of NGEN under random outages in both networks is introduced. It is demonstrated that the role of microgrid aggregators as cost-responsive controllable loads is significant in increasing the security of NGEN and reducing operation costs. In [], coordinated stochastic programming of NGEN is provided, in which the role of the compressor is not considered in the gas network modeling. The stochastic model considers the random outage of transmission lines and generators, as well as load forecasting errors. The coordinated stochastic model is shown to be an effective approach to show the uncertainties of two dependent networks. In [], the outer approximation with an equality relaxation (OA/ER) decomposition method is used to solve the non-convex mixed-integer nonlinear programming (MINLP) problem of coordinate operation of both networks. The coordinated operation has resulted in approximately 7% saving in the total operation costs. Flexible compressors and GFPPs as well as gas interconnections make the grid more flexible, which leads to significant improvement in operation costs in decoupled operation modeling.
Due to the increase in penetration level of RES, the security and reliability problems will be a major challenge in operation of natural gas and electricity systems. References [,,,,] discuss the issue of security from planning perspectives. In [], a probabilistic reliability evaluation-based model is proposed to investigate the optimal coupling of multiple energy hubs. In [], a two-stage decomposition method is applied, and the results show that gas transmission constraints affect the long-term planning of the electricity network. In [], a decomposition method is used to jointly check the N-1 and probabilistic reliability criterion. In these references, the gas network is assumed to have a zero-outage rate. In [], a novel model with a linear programming approach is presented for NGEN expansion planning. Minimizing the total operational and capital costs is considered as the objective function, where it recommends cost-base operation and planning strategies. The proposed model in [] takes into account the N-1 criteria in both networks, and demonstrates that random outages have a significant impact on long-term planning. In the introduced model, nonlinear gas flow Equations, a linear approach is derived.
In [], a robust day-ahead economic dispatch model using the second-order cone (SOC) relaxation method for the operation of these systems is proposed. In this model, the role of reserves in managing the renewables uncertainties and N-1 contingencies is evaluated. It is shown that this modeling leads to a more economical solution than a mixed-integer linear programming (MILP) model with a shorter computational time. Reference [], offers a robust security-constraint unit commitment (SCUC) for an integrated model of NGEN, where possible transmission line outages are considered. To solve this non-convex and nonlinear problem, the second-order cone-based column and constraint generation technique is used. The results demonstrate the effectiveness of gas adjustability and storage penetration level to increase system reliability and to improve efficiency. In [], a coordinated optimal corrective control framework for NGEN is considered. The results show that the proposed approach for the security-constrained optimal power and gas flow problem is computationally efficient.
To the best of our knowledge, in the previous studies, contingency outages in both natural gas and electricity networks have not been considered comprehensively. Furthermore, most of the literature used an iterative operational strategy to model the NGEN, as well as accepted the error caused by the linearization of the model.
Hence, in this paper, a deterministic coordinated model for a secure and optimal MINLP operation problem of integrated natural gas and electricity transmission networks (INGETN) is presented. In this model, contingency outages including the N-1 criteria in both networks on power plants (PPs), transmission lines, and gas pipelines are carried out. In order to reduce the computational burden and time of this complex class of optimization, an iterative algorithm is used to select the critical cases and neglect other contingencies, which do not have a significant impact on the energy system. To investigate the significance of the interaction of the electricity and gas infrastructures, the proposed framework for integrated model is compared to a separate method []. Due to the fact that the separated method did not work properly in some critical scenarios, changes were made to improve its performance (enhanced separated method). Furthermore, since solving the problem in the form of MINLP increases the probability of obtaining local optimal solutions, the problem is first solved by relaxed integer variables to obtain the initial guess which can potentially lead to a globally optimal solution instead of the local optimum. Finally, to investigate the performance of the proposed model in comparison to the enhanced separated method, results are evaluated in critical selected scenarios of the updated IEEE RTS 24-bus and 15-node natural gas test systems.
2. Materials and Methods
In this section, the operational model of natural gas and electricity infrastructures is presented. For the INGETN modeling, the GFPPs coupling link constraint is added to the model and the sum of the operational costs of NGEN is the objective function.
2.1. Electricity Network Constraints
Electricity network modeling is in the form of network-constraint unit commitment (NCUC). In addition to generating unit constraints, transmission network constraints have also been considered.
Equations (1)–(13) are related to transmission network and power plants constraints []. In order to determine the power flow of each transmission line, the DC power flow [] is used in Equation (1), where and are real power flow and maximum capacity of transmission line el at time h and is the reactance of transmission line el. The power capacity of each line is limited to Equation (2), where is the phase angle of bus be at time h. The electric power balance is shown in Equation (3). and are respectively the electrical load shedding and demand at bus be and time h, while is produced real power of unit pp at time h. The generating power of PPs by considering spinning reserves is determined according to the demand in Equation (4). is the maximum allowable output real power of unit pp, while is the spinning reserve requirement of system at time h and is 0/1 commitment state of unit pp at time h. Equations (5) and (6) are linearized cost function of PPs and limits on generated power of each segment, respectively. is the minimum allowable output real power of unit pp and is the produced real power in segment seg of unit pp at time h, while is the maximum allowable output real power in segment seg of unit pp. The hourly output power of each PPs is limited by Equation (7). The relationship of the 0/1 binary variables is presented in Equation (8) (i.e., determines the value of binary variables related to the startup/shutdown status of the PPs according to the value of their binary variable, which is related to the on/off commitment status). and are 0/1 binary variables for the startup/shutdown state of unit pp at time h. The minimum up/down time of PPs are presented in Equations (9) and (10), respectively. and are the minimum up/down time, initial and uptime status of unit pp, respectively. Finally, ramp rates, consisting of ramp up/down and startup/shutdown ramps, are presented in Equations (11)–(13). and are the ramp-up, ramp-down, start-up ramp and shut-down ramp of unit pp, respectively.
2.2. Natural Gas Network Constraints
The objective function of natural gas network modeling is to minimize the operation costs. The constraints are nonlinear, which makes the operation of the gas network nonlinear programming (NLP). Hence, the INTGEN model is MINLP, since the electricity network is modelled as MILP.
In the gas network model, besides the gas flow modeling, linepack and compressor performance are considered. In order to calculate the gas flow through the pipelines of a high-pressure gas network, the “Panhandle A” approach [] is used in Equation (14). is the average natural gas flow of pipeline gl at time h. and are the diameter, length and efficiency factor of pipeline gl, respectively. and are the pressure of first-end/second-end node bg of pipeline gl at time h. The following assumption is considered in Equation (14) []: (a) The natural gas network pipelines are horizontal, (b) natural gas velocity and temperature are constant throughout the gas pipelines, (c) change of cross-sectional area along the path of the gas stream is negligible, (d) The natural gas pipelines diameter is smaller than the radius of curvature. Equations (15) and (16) demonstrate the node’s pressure limit and gas flow capacity of pipelines, respectively. and are the minimum and maximum pressure limit at node bg, while and are minimum and maximum gas flow capacity of pipeline gl. A certain amount of natural gas (linepack) should be maintained in pipelines to deal with rapid load fluctuations. This action is necessary from operational perspectives, due to the slower transport speed of natural gas compared to power transmission speed []. The amount of linepack in pipelines and linepack changes per hour are presented in Equations (17) and (18), respectively []. and are the average pressure and cross-sectional area of pipeline gl. and are density of gas, compressibility factor, gas constant and gas temperature at standard condition, respectively. and are the linepack and the linepack changes per hour of pipeline gl at time h. Equations (19)–(23) are the compressor’s operation constraints. The Equation related to the consumption power of gas compressors is provided in Equation (19). is the consumption power of compressor c at time h, is the gas flow through compressor c at time h, is the suction pressure of compressor c at time h, is the discharge pressure of compressor c at time h, is the efficiency of compressor c and is polytropic exponent of gas compressor. The compressors discharge pressure to suction pressure ratio is limited to Equation (20), where is the maximum compressor pressure ratio. The maximum compressor flow rate maximum power consumption maximum and minimum compressor pressure limitations are determined by Equations (21) and (22), respectively. The amount of gas consumed by the compressors is defined by Equation (23), where is the amount of tapped gas by compressor c at node bg at time h and is gas turbine fuel rate coefficient of compressor c. The gas flow balance is given in Equation (24). According to this equality, in each node, the input gas flow must be equal to the output gas flow. is the gas flow rate of terminal gw at time h, is the required gas flow rate for GFPPs at node bg and time h. and are the amount of gas load shedding and demand at node bg at time h. and are compressor-node and pipeline-node incidents matrix. Finally, the terminal gas wells capacities and the injected gas flow ramp rate are demonstrated by Equations (25) and (26), respectively. is maximum capacity of gas flow rate of terminal gw and is up/down ramp rate of natural gas terminal gw.
2.3. Coupling Constraint of Natural Gas and Electricity Infrastructures
GFPPs are the coupling link of natural gas and electricity networks, which is obtained by Equation (27).
where and are the energy conversion coefficient and the efficiency of the GFPPs, respectively. is produced real power of GFPP gpp at time h and is efficiency of GFPP gpp.
2.4. Objective Function
The objective function of the proposed operation model is the aggregate of the operational costs of natural gas and electricity networks.
2.4.1. Electricity Network Objective Function
Equation (28) is the objective function of the NCUC problem, which seeks to minimize the operation cost of the electricity network (), subjected to Equations (1)–(13). is the minimum production cost of unit pp. and are start-up/shut-down cost of unit pp at time h. is the value of loss load and is the slope of segment seg of piecewise linear cost function of unit pp.
2.4.2. Gas Network Objective Function
Equation (29) shows the objective function of the gas network operation to supply the consumption loads, which is minimizing the operation cost of the gas network (), subjected to (14)–(26). and are the cost of gas injection and gas load shedding, respectively.
2.4.3. Proposed INGETN Model Objective Function
By combining Equations (28) and (29), the objective function of the proposed INGETN model is presented in Equation (30), in which the objective is to minimize the operation cost of both networks simultaneously, subjected to Equations (1)–(26).
2.5. Operation Startegies for NGEN
To demonstrate the effectiveness of the proposed methods, the following operation strategies are considered: (a) enhanced separated strategy, and (b) proposed integrated strategy.
2.5.1. Enhanced Separated Operation Method
Since the priority of the gas system operator is to supply the non-electric gas demand, if the GFPPs generation increases in order to support the supply-demand balance, the gas infrastructure may not be able to deliver the gas on time to the demand centers. Consequently, in order to deliver the gas to the non-electric gas demands, it is required to curtail the gas demand for GFPPs. This means that the electricity network operator needs to reduce the generation of GFPPs. In the separated method, this exchange process between these two networks is iterated, until the optimal solution is achieved [].
The prevention of the load shedding in the gas network or its discrepancy with the previous iteration cannot be considered as a condition for stopping the process, since, although this condition may work in normal operation situations without interruption, it should be noted that, in some extreme circumstances, load shedding occurs. Therefore, this iterative process must continue until the lowest operating costs is achieved. For this purpose, the second condition in the algorithm of this enhanced separated method must be considered in accordance with Figure 1.
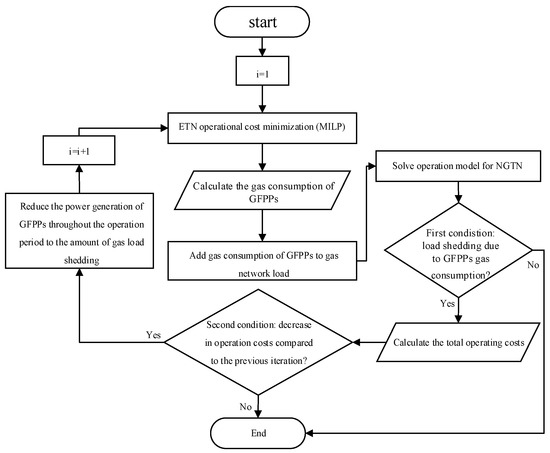
Figure 1.
Flowchart of the enhanced separated model.
2.5.2. Integrated Operation Method
In this method, both networks are operated simultaneously and the whole system constraints are considered with a single objective function (i.e., the operational cost of NGEN).
2.6. Proposed Scenario Reduction Algorithm for N-1 Criteria
In order to address N-1 contingencies, the capacity of the outage component is assumed to be zero, and the model runs on the operation of the rest of network components. Due to outages (N-1 criteria) on transmission lines, PPs in the electricity network, and gas pipelines in the natural gas network, a large number of contingency scenarios are defined. Consequently, the computation time and burden increase significantly. However, some of these scenarios make the system operation more challenging and can even cause load shedding. Therefore, an algorithm is developed to identify the scenarios which make the operation of NGEN more vulnerable.
The flowchart in Figure 2, illustrates this iterative process to reduce the scenarios based on destructive value of each scenario. The execution steps of the proposed algorithm are presented as follows.
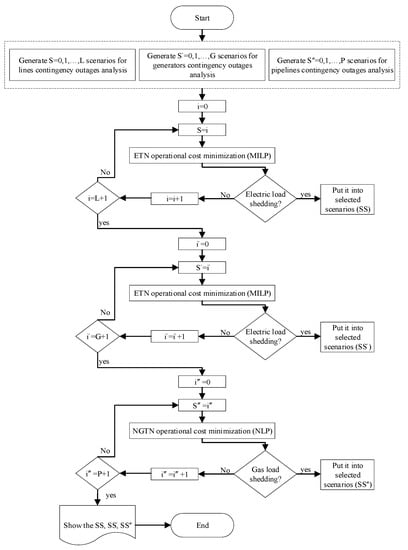
Figure 2.
Flowchart of the proposed algorithm.
Step 1: Scenarios are generated for transmission lines, PPs, and gas pipelines outage.
Step 2: NCUC model is solved for electricity transmission network (ETN) for different transmission line outage scenarios with the objective function (28), subjected to Equations (1)–(13) and the scenarios that electricity load shedding happens are selected.
Step 3: NCUC model is solved for electricity transmission network (ETN) for different outage scenarios of PPs with the objective function (28) subjected to Equations (1)–(13), and the scenarios that electricity load shedding happens are selected.
Step 4: The model of natural gas transmission network (NGTN) operation for different gas pipeline outage scenarios is solved with the objective function (29) subjected to Equations (14)–(26) and the scenarios that gas load shedding happens are selected.
Finally, the two mentioned operation methods are applied and investigated on these selected scenarios to validate the performance of the proposed model.
3. Results
3.1. Case Study
The proposed models are validated on the IEEE RTS 24-bus electricity and 15-node gas test systems. Optimization is performed with GAMS optimization software version 25.1.2 on a computer system with Intel (R) Core (TM) i5 CPU (2.13 GHz) processor and 8 GB of memory.
3.1.1. The Updated Version of IEEE RTS 24-Bus
The modified IEEE reliability test system (RTS) [] (data are available in []) consisting of 12 generating units, 17 loads, and 34 transmission lines, is used to model the electricity network. In order to have more interaction between two infrastructures, one more GFPP is considered in bus number 2 connected to node number 15.
3.1.2. 15-Node Natural Gas Network Test System
To model the gas network, a 15-node test system [,] containing one terminal is used. The network has 16 pipelines, with loads on all nodes and one compressor at node 15. The diagram of the NGEN is shown in Figure 3.
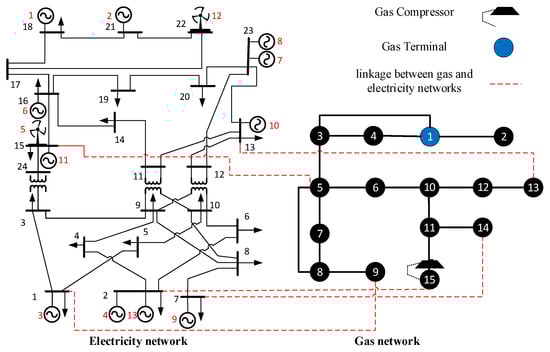
Figure 3.
Network diagram.
3.2. Simulation Results
According to the proposed algorithm, three series of scenarios are selected:
3.2.1. Selected Scenarios of Transmission Lines Outage
The proposed algorithm only selects scenario with transmission line outage between buses 7 and 8 as the critical scenario, which causes problems with the operation of the electricity network and the operator needs to partially curtail the loads. By this line outage, generator 9 is also disconnected from the rest of the network and can only supply loads on bus 7, which has also happened with load shedding at certain times.
1. Enhanced separated operation method
Through adding the required gas for GFPPs to the load of the gas network, the gas system is still capable of delivering the gas to the demand centers on time. This means that gas load shedding is not happening, and therefore redispatch of power is not required. The total amount of electricity load shedding is 518.98 MW.
2. Proposed integrated operation method
The proposed operation method of INGETN for this scenario results in 518.98 MW total electricity load shedding as well, due to the fact that, in both methods, the load shedding occurred in bus 7, where it was disconnected from the network. Hence, GFPP 9 was not able to supply the load in some hours. The gas load shedding in both methods is zero. Therefore, total load shedding in NGEN is the same.
By evaluating the linepack in the gas pipelines, as shown in Figure 4, the linepack in the integrated method is managed properly, due to fewer fluctuations. This enables the gas network operator to deal better with sudden changes in the gas demand. Furthermore, by comparing Figure 4 and Figure 5, it is demonstrated that the linepack in pipes has been used more at morning peak, while at midnight more linepack remains in the pipes, whereas 9.69 mcm is injected from the terminals (i.e., compared to the separated method is less (10.23 mcm)). It is shown that, through the integrated method, more efficient use of the linepack in the pipes, as well as less gas injection from the terminal side, resulted in overall lower operation cost. In Table 1 a comparison of costs in the integrated and separated methods is demonstrated. The integrated model led to lower total operating costs.
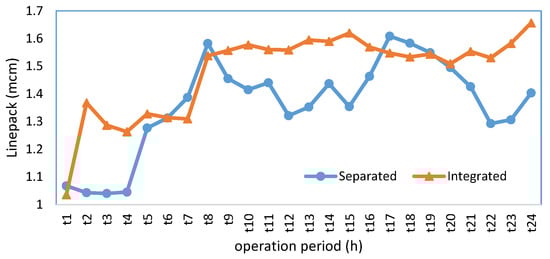
Figure 4.
Aggregated linepack in the gas pipes in integrated and separated methods.
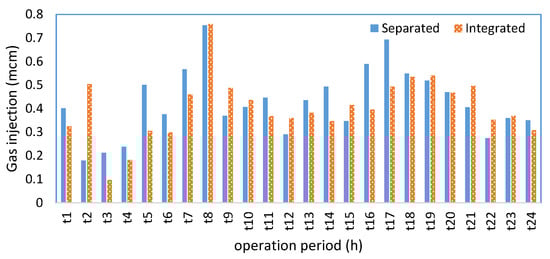
Figure 5.
Total amount of gas injected from the terminal to the network in integrated and separated methods.

Table 1.
Operation Cost of NGEN.
Moreover, comparing the commitment status of GFPPs in Table 2 and Table 3, it is shown that these units are less online in the integrated model, and in total, the generated power is 3904.67 MW less compared to the separated model.
Table 2.
Commitment status of GFPPs in separated method.
Table 3.
Commitment status of GFPPs in integrated method.
3.2.2. Selected Scenarios of Power Plants Outage
The proposed algorithm chooses the scenario with a generator outage on bus 2 as the worst case that load shedding on both networks is happening.
1. Enhanced separated operation method
Besides the non-electric gas demand, since the load of the GFPPs should also be met, the gas network is not capable of supplying the required demand. In other words, the operator of the electricity network needs to change the unit commitment/economic dispatch (UC/ED) according to the amount of available gas for power generation declared by the gas network operator, and consequently reducing the output of GFPPs. In this scenario, this iterative process results in 2 redispatches processes. In the next iteration, the downward trend in cost turns into an uptrend (i.e., in the second iteration the lowest cost is achieved). Figure 6 shows the trend of cost changes in each iteration. On the gas network, the load shedding occurs at node 14, because of the pressure drop at hours 08:00–12:00 and 17:00–21:00. Due to the presence of the compressor, there is no pressure drop in node 15.
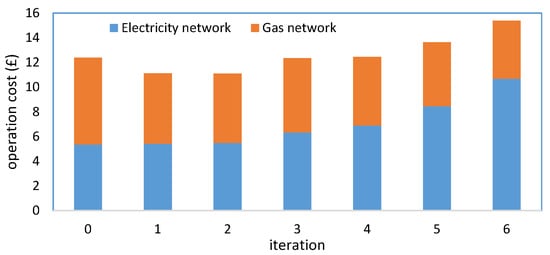
Figure 6.
Comparison of network costs in six iterations in separated Method.
2. Proposed integrated operation method
Table 4 shows a comparison of costs in the integrated and separated methods. The proposed integrated method leads to 6.7% cost saving. The amount of gas load shedding in this method is 0.065 mcm, which is much lower than the separated method (0.165 mcm) gas load shedding. Therefore, total load shedding and operation cost in NGEN are lower in the integrated model.
Table 4.
Operation Cost of NGEN.
Figure 7 shows the amount of consumed gas by the GFPPs, which is almost the same in both methods. The difference in the gas load shedding is related to the commitment time of the GFPPs according to Table 5 and Table 6, where the commitment status of GFPPs in integrated method is different from the separated method in the final operation hours. As shown in Figure 8, in the integrated method, the average pressure at node 14 is higher most of the time, and hence less load shedding happened (from t0 to t6 and t22 to t24, the average pressure at node 14 is the same).
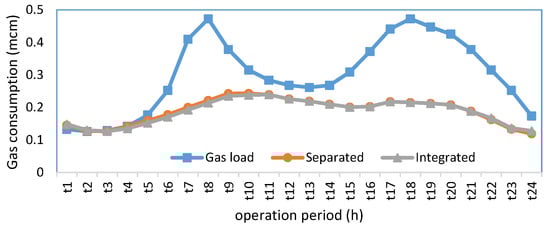
Figure 7.
Gas network’s loads and consumed gas by GFPPs in integrated and separated methods.
Table 5.
Commitment status of GFPPs in separated method.
Table 6.
Commitment status of GFPPs in integrated method.
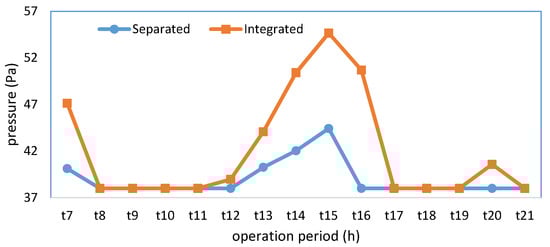
Figure 8.
Pressure at node 14.
As shown in Figure 9, in the integrated model, lower power generated by gas and coal plants is achieved. GFPPs produce about 103 MW less and the produced power by coal-fired power plants (CFPPs), characterized by high emissions is 77.5 MW less.
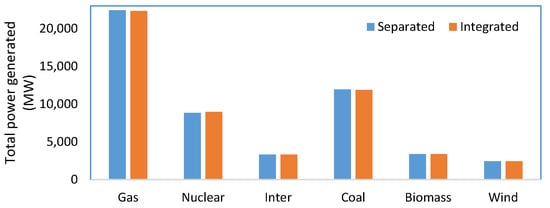
Figure 9.
Comparison of total generated power of different types of power plants in 24 h between integrated and separated methods.
3.2.3. Selected Scenarios of Pipelines Outage
In this test system, the gas network system has a terminal at node 1, which, from a research point of view, is not reasonable for checking the gas pipe outage (e.g., by interruption of the gas pipe between two nodes 3–5, the grid is divided into two sections and at the bottom of the grid due to the lack of supply, gas load shedding is happening significantly). For this reason, to examine the outage of gas pipes, the existing network is modified. The terminal capacity is divided into three sections at nodes 1, 9, and 14.
In this regard, the gas network faces problems with the outage of the gas pipelines between nodes 1–2, 12–13 and 11–15, and consequently the gas demand on nodes 2, 13 and 15 is not supplied completely. Furthermore, on nodes 13 and 15, the GFPPs are also installed. Due to the high capacity of the GFPP 10 connected to node 13, the scenario with outage of the gas pipe between nodes 12–13 is the most critical case that is selected by the proposed algorithm (Figure 2). To conduct a better comparison in this scenario, it is assumed that there is no non-electric gas load on node 13. Therefore, the load that is curtailed on this node results in a lack of supply to GFPP 10.
1. Enhanced separated operation method
In this scenario, this iterative process does not work properly and does not lead to optimal solutions by reducing the output power of GFPPs, leading to a mandatory turn off of GFPP 10. As a result, one iteration leads to the optimal solution. After this iteration, there is not any issue in the gas network to supply the loads and required gas of GFPPs. The gas load shedding in this iteration is zero and the amount of load shedding in electricity network is 2398.7 MW.
2. Proposed integrated operation method
The proposed integrated model has lower operation costs. The amount of injected gas in this method is 7.49 mcm which is lower than 8.04 mcm in separated method. Table 7 shows a comparison of the cost in the two integrated and separated methods. The load shedding in this scenario is the same in both methods (as mentioned in this case, the separated method was enhanced and also the GFPP 10 was considered completely off).
Table 7.
Operation Cost of NGEN.
4. Conclusions
In this paper, to examine the interaction of natural gas and electricity networks in the MINLP operational problem, a deterministic coordinated model for secure and optimal operation of INGETN is proposed. N-1 contingency analysis is applied in both networks for transmission lines and power plants in the electricity network as well as gas pipelines in the gas network. Moreover, in order to reduce the computational burden and time of this security-constraint problem, which contains many contingency scenarios, an iterative algorithm has been introduced to select the critical cases, which have a significant impact on the operation of these networks. By examining a coordinated operation approaches of NGEN (i.e., separated method) in different scenarios, it was indicated that this method did not lead to the optimal solution in some critical scenarios, and as a result, correction actions were made in this method. To validate the effectiveness of the modeled framework, the proposed integrated operation strategy is compared to the enhanced separated strategy. Comparing the simulation results of these operation methods, it is demonstrated that the proposed integrated model is more secure, as the total gas and electrical load shedding is lower than the separated method. Furthermore, in the integrated model by considering the whole-system constraints simultaneously, better use of linepack, less gas injection of terminals, more optimal commitment status of the generating units and more operational costs savings (up to 6.7%) are achieved.
Author Contributions
H.A. conceived the presented idea. A.M.R. and H.A. developed the theory and performed the computations. M.T.A. and H.A. verified the analytical methods. G.S., M.T.A., and H.A. encouraged A.M.R. to investigate the security in gas and electricity networks and supervised the findings of this work. All authors have read and agreed to the published version of the manuscript.
Funding
This research was funded by EPSRC-funded program “UK Carbon Capture and Storage (UKCCSRC)” under grant number EP/K000446/1 and FLexiCell (UK Government Low Carbon Heating Technology Innovation Fund) and the APC was funded by EPSRC-funded program “UK Carbon Capture and Storage (UKCCSRC)” under grant number EP/K000446/1.
Conflicts of Interest
The authors declare that they have no known competing financial interests or personal relationships that could have appeared to influence the work reported in this paper.
References
- International Energy Agency. Available online: https://www.iea.org/gas2018/ (accessed on 13 August 2020).
- International Energy Agency. Available online: https://www.iea.org/renewables2018/ (accessed on 13 August 2020).
- He, C.; Zhang, X.; Liu, T.; Wu, L.; Shahidehpour, M. Coordination of interdependent electricity grid and natural gas network—A review. Curr. Sustain. Renew. Energy Rep. 2018, 5, 23–36. [Google Scholar] [CrossRef]
- Ameli, H.; Qadrdan, M.; Strbac, G. Value of gas network infrastructure flexibility in supporting cost effective operation of power systems. Appl. Energy 2017, 202, 571–580. [Google Scholar] [CrossRef]
- Liu, C.; Shahidehpour, M.; Fu, Y.; Li, Z. Security-constrained unit commitment with natural gas transmission constraints. IEEE Trans. Power Syst. 2009, 24, 1523–1536. [Google Scholar]
- Zhang, X.; Shahidehpour, M.; Alabdulwahab, A.; Abusorrah, A. Hourly electricity demand response in the stochastic day-ahead scheduling of coordinated electricity and natural gas networks. IEEE Trans. Power Syst. 2015, 31, 592–601. [Google Scholar] [CrossRef]
- Sardou, I.G.; Khodayar, M.E.; Ameli, M.T. Coordinated operation of natural gas and electricity networks with microgrid aggregators. IEEE Trans. Smart Grid 2016, 9, 199–210. [Google Scholar] [CrossRef]
- Gyalai-Korpos, M.; Zentkó, L.; Hegyfalvi, C.; Detzky, G.; Tildy, P.; Hegedűsné Baranyai, N.; Pintér, G.; Zsiborács, H. The role of electricity balancing and storage: Developing Input parameters for the european calculator for concept modeling. Sustainability 2020, 12, 811. [Google Scholar] [CrossRef]
- Tafarte, P.; Kanngießer, A.; Dotzauer, M.; Meyer, B.; Grevé, A.; Millinger, M. Interaction of electrical energy storage, flexible bioenergy plants and system-friendly renewables in wind-or solar PV-dominated regions. Energies 2020, 13, 1133. [Google Scholar] [CrossRef]
- Kosman, W.; Rusin, A. The application of molten salt energy storage to advance the transition from coal to green energy power systems. Energies 2020, 13, 2222. [Google Scholar] [CrossRef]
- Ameli, H.; Qadrdan, M.; Strbac, G. Coordinated operation of gas and electricity systems for flexibility study. Front. Energy Res. 2020, 8, 120. [Google Scholar] [CrossRef]
- Ameli, H.; Qadrdan, M.; Strbac, G.; Ameli, M.T. Investing in flexibility in an integrated planning of natural gas and power systems. IET Energy Syst. Integr. 2020, 2, 101–111. [Google Scholar] [CrossRef]
- Yang, L.; Zhao, X.; Li, X.; Yan, W. Probabilistic steady-state operation and interaction analysis of integrated electricity, gas and heating systems. Energies 2018, 11, 917. [Google Scholar] [CrossRef]
- Alabdulwahab, A.; Abusorrah, A.; Zhang, X.; Shahidehpour, M. Stochastic security-constrained scheduling of coordinated electricity and natural gas infrastructures. IEEE Syst. J. 2015, 11, 1674–1683. [Google Scholar] [CrossRef]
- Ameli, H.; Qadrdan, M.; Strbac, G. Coordinated operation strategies for natural gas and power systems in presence of gas-related flexibilities. IET Energy Syst. Integr. 2019, 1, 3–13. [Google Scholar] [CrossRef]
- Zhang, X.; Che, L.; Shahidehpour, M.; Alabdulwahab, A.S.; Abusorrah, A. Reliability-based optimal planning of electricity and natural gas interconnections for multiple energy hubs. IEEE Trans. Smart Grid 2015, 8, 1658–1667. [Google Scholar] [CrossRef]
- Zhang, X.; Shahidehpour, M.; Alabdulwahab, A.S.; Abusorrah, A. Security-constrained co-optimization planning of electricity and natural gas transportation infrastructures. IEEE Trans. Power Syst. 2014, 30, 2984–2993. [Google Scholar] [CrossRef]
- He, C.; Wu, L.; Liu, T.; Shahidehpour, M. Robust co-optimization scheduling of electricity and natural gas systems via ADMM. IEEE Trans. Sustain. Energy 2016, 8, 658–670. [Google Scholar] [CrossRef]
- Qiu, J.; Yang, H.; Dong, Z.Y.; Zhao, J.H.; Meng, K.; Luo, F.J.; Wong, K.P. A linear programming approach to expansion co-planning in gas and electricity markets. IEEE Trans. Power Syst. 2015, 31, 3594–3606. [Google Scholar] [CrossRef]
- Zhang, Y.; Hu, Y.; Ma, J.; Bie, Z. A mixed-integer linear programming approach to security-constrained co-optimization expansion planning of natural gas and electricity transmission systems. IEEE Trans. Power Syst. 2018, 33, 6368–6378. [Google Scholar] [CrossRef]
- Liu, F.; Bie, Z.; Wang, X. Day-ahead dispatch of integrated electricity and natural gas system considering reserve scheduling and renewable uncertainties. IEEE Trans. Sustain. Energy 2018, 10, 646–658. [Google Scholar] [CrossRef]
- He, Y.; Shahidehpour, M.; Li, Z.; Guo, C.; Zhu, B. Robust constrained operation of integrated electricity-natural gas system considering distributed natural gas storage. IEEE Trans. Sustain. Energy 2017, 9, 1061–1071. [Google Scholar] [CrossRef]
- Sun, G.; Chen, S.; Wei, Z.; Cheung, K.W.; Zang, H. Corrective security-constrained optimal power and gas flow with binding contingency identification. IEEE Trans. Sustain. Energy 2019, 11, 1033–1042. [Google Scholar] [CrossRef]
- Qadrdan, M.; Wu, J.; Jenkins, N.; Ekanayake, J. Operating strategies for a GB integrated gas and electricity network considering the uncertainty in wind power forecasts. IEEE Trans. Sustain. Energy 2013, 5, 128–138. [Google Scholar] [CrossRef]
- Parvania, M.; Fotuhi-Firuzabad, M.; Shahidehpour, M. Comparative hourly scheduling of centralized and distributed storage in day-ahead markets. IEEE Trans. Sustain. Energy 2014, 5, 729–737. [Google Scholar] [CrossRef]
- Purchala, K.; Meeus, L.; Van Dommelen, D.; Belmans, R. Usefulness of DC power flow for active power flow analysis. In Proceedings of the IEEE Power Engineering Society General Meeting, San Francisco, CA, USA, 16 June 2005; pp. 454–459. [Google Scholar]
- Osiadacz, A. Simulation and Analysis of Gas Networks; Gulf Publishing Company: Houston, TX, USA, 1987. [Google Scholar]
- Schwele, A.; Ordoudis, C.; Kazempour, J.; Pinson, P. Coordination of power and natural gas systems: Convexification approaches for linepack modeling. In Proceedings of the IEEE Milan PowerTech, Milan, Italy, 23–27 June 2019; pp. 1–6. [Google Scholar]
- Chaudry, M.; Jenkins, N.; Strbac, G. Multi-time period combined gas and electricity network optimisation. Electr. Power Syst. Res. 2008, 78, 1265–1279. [Google Scholar] [CrossRef]
- Grigg, C.; Wong, P.; Albrecht, P.; Allan, R.; Bhavaraju, M.; Billinton, R.; Chen, Q.; Fong, C.; Haddad, S.; Kuruganty, S.; et al. The IEEE reliability test system-1996. A report prepared by the reliability test system task force of the application of probability methods subcommittee. IEEE Trans. Power Syst. 1999, 14, 1010–1020. [Google Scholar] [CrossRef]
- Ordoudis, C.; Pinson, P.; González, J.M.M.; Zugno, M. An Updated Version of the IEEE RTS 24-Bus System for Electricity Market and Power System Operation Studies; Technical University of Denmark (DTU): Lyngby, Denmark, 2016. [Google Scholar]
- Strbac, G.; Pudjianto, D.; Sansom, R.; Djapic, P.; Ameli, H.; Shah, N.; Brandon, N.; Hawkes, A.; Qadrdan, M. Analysis of Alternative UK Heat Decarbonisation Pathways; Imperial College London: London, UK, 2018. [Google Scholar]
- Shabazbegian, V.; Ameli, H.; Ameli, M.T.; Strbac, G. Stochastic Optimization Model for Coordinated Operation of Natural Gas and Electricity Networks. Comput. Chem. Eng. 2020, 142, 107060. [Google Scholar] [CrossRef]
© 2020 by the authors. Licensee MDPI, Basel, Switzerland. This article is an open access article distributed under the terms and conditions of the Creative Commons Attribution (CC BY) license (http://creativecommons.org/licenses/by/4.0/).