Article

Analysis of Energy Saving Effect and Cost Efficiency of ECMs to Upgrade the Building Energy Code

1
Department of Architecture, Ajou University, Suwon 16499, Korea
2
Department of Architecture, Yeungnam University, Gyeongsan, Gyeongbuk 38541, Korea
*
Author to whom correspondence should be addressed.
Energies 2020, 13(18), 4955; https://doi.org/10.3390/en13184955
Submission received: 19 August 2020 / Revised: 11 September 2020 / Accepted: 18 September 2020 / Published: 21 September 2020
(This article belongs to the Special Issue Novel Systems for the Era of Zero-Energy Buildings)

Abstract

:
Building energy codes are key policy tools for improving building energy efficiency by defining the minimum requirement for the energy performance of new buildings. In Korea, the building energy code was focused on prescriptive criteria for a long time but is now gradually introducing performance criteria. However, switching to performance criteria is not straightforward because of the resistance of the market to abandoning the well-consolidated prescriptive criteria. The objective of this study is to derive appropriate measures to strengthen the prescriptive criteria and the performance criteria, considering both the energy-saving effect and the economic efficiency for new office buildings and educational buildings to increase the market acceptance of the building energy codes. To this end, the energy-saving effects of reference buildings resulting from the reinforcement of the prescriptive criteria in the past have been first analyzed. Then, based on the collected energy performance parameters and cost data, the economic efficiency relative to the energy saving deriving from the application of passive and active energy conservation measures (ECMs) were analyzed, and future building energy code’s reinforcement measures were derived.

1. Introduction

In order to meet the demand for reducing greenhouse gas (GHG) emissions in the building sector, major countries have established GHG reduction goals through the United Nations Framework Convention on Climate Change (UNFCCC). To achieve these goals, many countries are implementing various building energy policies to enhance the energy performance of new and existing buildings. Building energy codes are one of the key policy tools that establish minimum levels of energy performance for the design and construction of different building types [1,2,3]. Building energy codes are legal mandatory requirements which usually include specifications regarding envelope, heating, ventilating, and air conditioning (HVAC), domestic hot water (DHW), lighting systems, renewable systems, etc. [2,4,5,6]. Building energy codes play a fundamental role in achieving energy efficiency objectives for newly constructed buildings and reducing building energy demand and carbon emissions, and the advancement of building energy codes is considered one of the most impactful ways to improve the energy performance of building [4,5,6,7]. There are two main types of criteria in most building energy codes: prescriptive and performance-based [6]. Many countries, including the US and the EU countries, are implementing performance-based criteria for new buildings, such as the energy need, energy use, primary energy use, and CO2 emissions, as well as prescriptive criteria, such as the thermal transmittance, air tightness, or the basic physical performance of the building components or the overall buildings. According to the results of an international survey on building energy codes [5], many countries show a trend of switching to performance-based codes.
Several studies have been conducted to evaluate the effect of building energy codes on saving energy and to analyze the effect of energy conservation measures (ECMs) to be included for the upgrading of the current codes. Wang et al. [4] analyzed the effect of building energy efficiency standards (BEES) using actual consumption data and found out that the BEES have a definite and positive impact on the reduction of energy consumption of households in a Chinese city. Jacobsen and Kotchen [7] evaluated the effect of a change in the building codes using residential billing data and found a decrease in the consumption of electricity and natural gas, which means those average social and private payback periods (PP) ranges 3.5–6.4 years. Chirarattananon et al. [8] assessed future energy savings of various building types and sizes according to the revision of the building energy code in Thailand. Qian et al. [9] evaluated the energy-saving potential of different ECMs through the energy simulations in 16 different climate zones for 11 different commercial building types in the U.S., compared to three different versions of American Society of Heating, Refrigerating, and Air-conditioning Engineers (ASHRAE) standards, but did not consider the cost analysis of these ECMs. Zhang et al. [10] determined the key prescriptive parameters of reference buildings in four Chinese cities for the revision of building energy code based on the saving to investment ratio (SIR) methodology.
Korea also updated the GHG reduction goal for the building sector in the 2030 Revised National GHG Reduction Roadmap released in 2018, prescribing a target of reducing GHG by 32.7% compared to the business-as-usual baseline by 2030. The Korean government is continuously promoting rational revisions of the Building Energy Conservation Code (BECC), which is the minimum set of energy performance criteria for new buildings that must be met in order to obtain a building permit. The Korean BECC has focused on prescriptive criteria such as thermal transmittance and insulation thickness since its enactment in 1979 but is now gradually introducing performance criteria as with many other countries [5,11]. A performance approach has been applied for office buildings and educational and research buildings, and all public buildings on a trial basis since 2017. However, switching to performance criteria is not straightforward because of the market resistance to abandoning the well-consolidated prescriptive criteria. To increase the market acceptance, appropriate and satisfactory performance criteria should be suggested by analyzing the energy-saving effect from the reinforcement of the familiar prescriptive criteria as well as the potential effect from the application of the ECMs in terms of performance criteria. Furthermore, not only the energy-saving effect but also the economic efficiency should be taken into account to encourage an active acceptance by the market.
The objective of this study is to derive appropriate ECMs to strengthen the prescriptive criteria and the performance criteria of BECC considering both the energy-saving effect and the economic efficiency for new office buildings and educational buildings. For this purpose, the energy-saving effects of reference buildings have been analyzed according to the past reinforcement of the BECC. Next, based on the collected energy performance parameters and cost data, the economic efficiency relative to the energy saving by applying passive and active ECMs was analyzed. Finally, future recommended ECMs for the reinforcement of BECC were suggested based on the analysis.

2. Development of ECMs Data for Analysis

To improve the energy performance of buildings effectively, the applicability of various ECMs should be investigated on the basis of the energy-saving effect as well as economic efficiency. The preparation of applicable and feasible ECMs should be based on the information on building materials and equipment that are actually sold on the market. To derive practical and cost-effective ECMs, information should be collected on cost as well as energy performance.
Several building energy modeling tools include ECM databases based on market research on building materials and equipment so as to reflect the level of technical development and the cost trends. The OpenStudio Parametric Analysis Tool (PAT) [12,13] provides energy performance evaluation and economic efficiency analysis features according to the application of various ECMs for new and existing buildings. ECMs are broadly categorized into seven types: whole building, electric lighting, equipment, envelope, HVAC, service water heating, and on-site power generation. A change in the building location or direction falls into the ‘whole building’ category. The ‘envelope’ category comprises changes in the R-value of opaque components and the replacement of windows. Lighting power reduction and improved lighting controls are included in the ‘electric lighting’ category. HVAC efficiency and fan coefficients are included in the ‘HVAC’ category. For on-site power generation, ECMs were established for the photovoltaic (PV) power generation. The cost data consists of energy costs and ECMs-related costs such as material cost, construction cost, maintenance cost, and demolition cost. The life cycle cost (LCC) of buildings is calculated from these cost data, analysis length, inflation rate, and discount rate. The CytiBES [14] is a web-based platform for analyzing city-scale energy performance based on various data sources such as weather data, building stock, geographic information system (GIS), building technology database, and utility data. A comprehensive list of 82 ECMS was provided regarding major parameters closely related to the energy performance so that they could be generally applied to buildings across the city rather than to a specific building [15]. In general, typical building technologies of the building envelope, lighting, HVAC, service hot water, plug load, and building operation and maintenance were specified as ECMs. The ECM database includes a description of investment cost and performance value for each ECM. The users can select feasible individual ECM or ECM packages based on energy savings, energy costs reduction, and PP [16]. The Opt-E-Plus [17], an energy performance optimization program for commercial buildings, has a feature that can identify the most economic ECMs by automatically performing repeated simulations. The ECMs include change of location by climate, zone and orientation, change of building geometry, windows-to-wall ratio, number of floors, replacement of building equipment and renewable energy systems, and change of occupancy. For the economic analysis, the costs of materials, construction, maintenance, and demolition are provided for individual ECMs.
In this study, the possibility of obtaining the performance and cost data of the materials and equipment on the market was examined first in order to derive the ECMs. It was found that the information on energy performance parameters such as the thermal conductivity of insulation materials and the equipment efficiency, as well as the cost data such as the material cost, labor cost, and other expenses have been continuously updated in various public or private websites in Korea [11,18,19,20,21]. However, the data quality is uneven, and the energy performance parameters and the cost data are not being managed in an integrated manner. Thus, we have mapped the energy performance parameters and the cost data of ECMs based on the standard specifications or model names of the materials and equipment, as shown in Table 1.
Next, to build a standardized model for calculating the ECM costs, the relationships between the energy performance parameters and cost of each ECM were analyzed. The regression analysis was used to statistically estimate the relationship between observed continuous variables.
The U-value according to the thickness and thermal conductivity of the insulation layer was chosen as an energy performance parameter for the building envelop component. The window U-value, the efficiency and/or capacity of the heating and cooling system, and the lighting power density were chosen as energy performance parameters. Among the renewable energy system, the electric power production per unit area of the PV system was set as an energy performance parameter. To derive the cost of each ECM, the relationship between the investment cost, which is the sum of the material cost and construction cost of each construction material and equipment, and the energy performance value was analyzed. As the energy performance improves, the cost may tend to increase nonlinearly rather than increase at a constant rate. Therefore, various types of regression analyses were applied such as exponential functions and polynomial functions. Next, among various equation models, the model was selected for representing the relationship between energy performance and initial investment cost. The coefficient of determination (R2) is a measure of the degree to which the estimated linear model is suitable for the given data. As shown in Figure 1 and Figure 2, the proportion of the part that can be explained by the applied model is expressed as a value between 0 and 1. The closer to 1, the higher the explanatory power by the model.
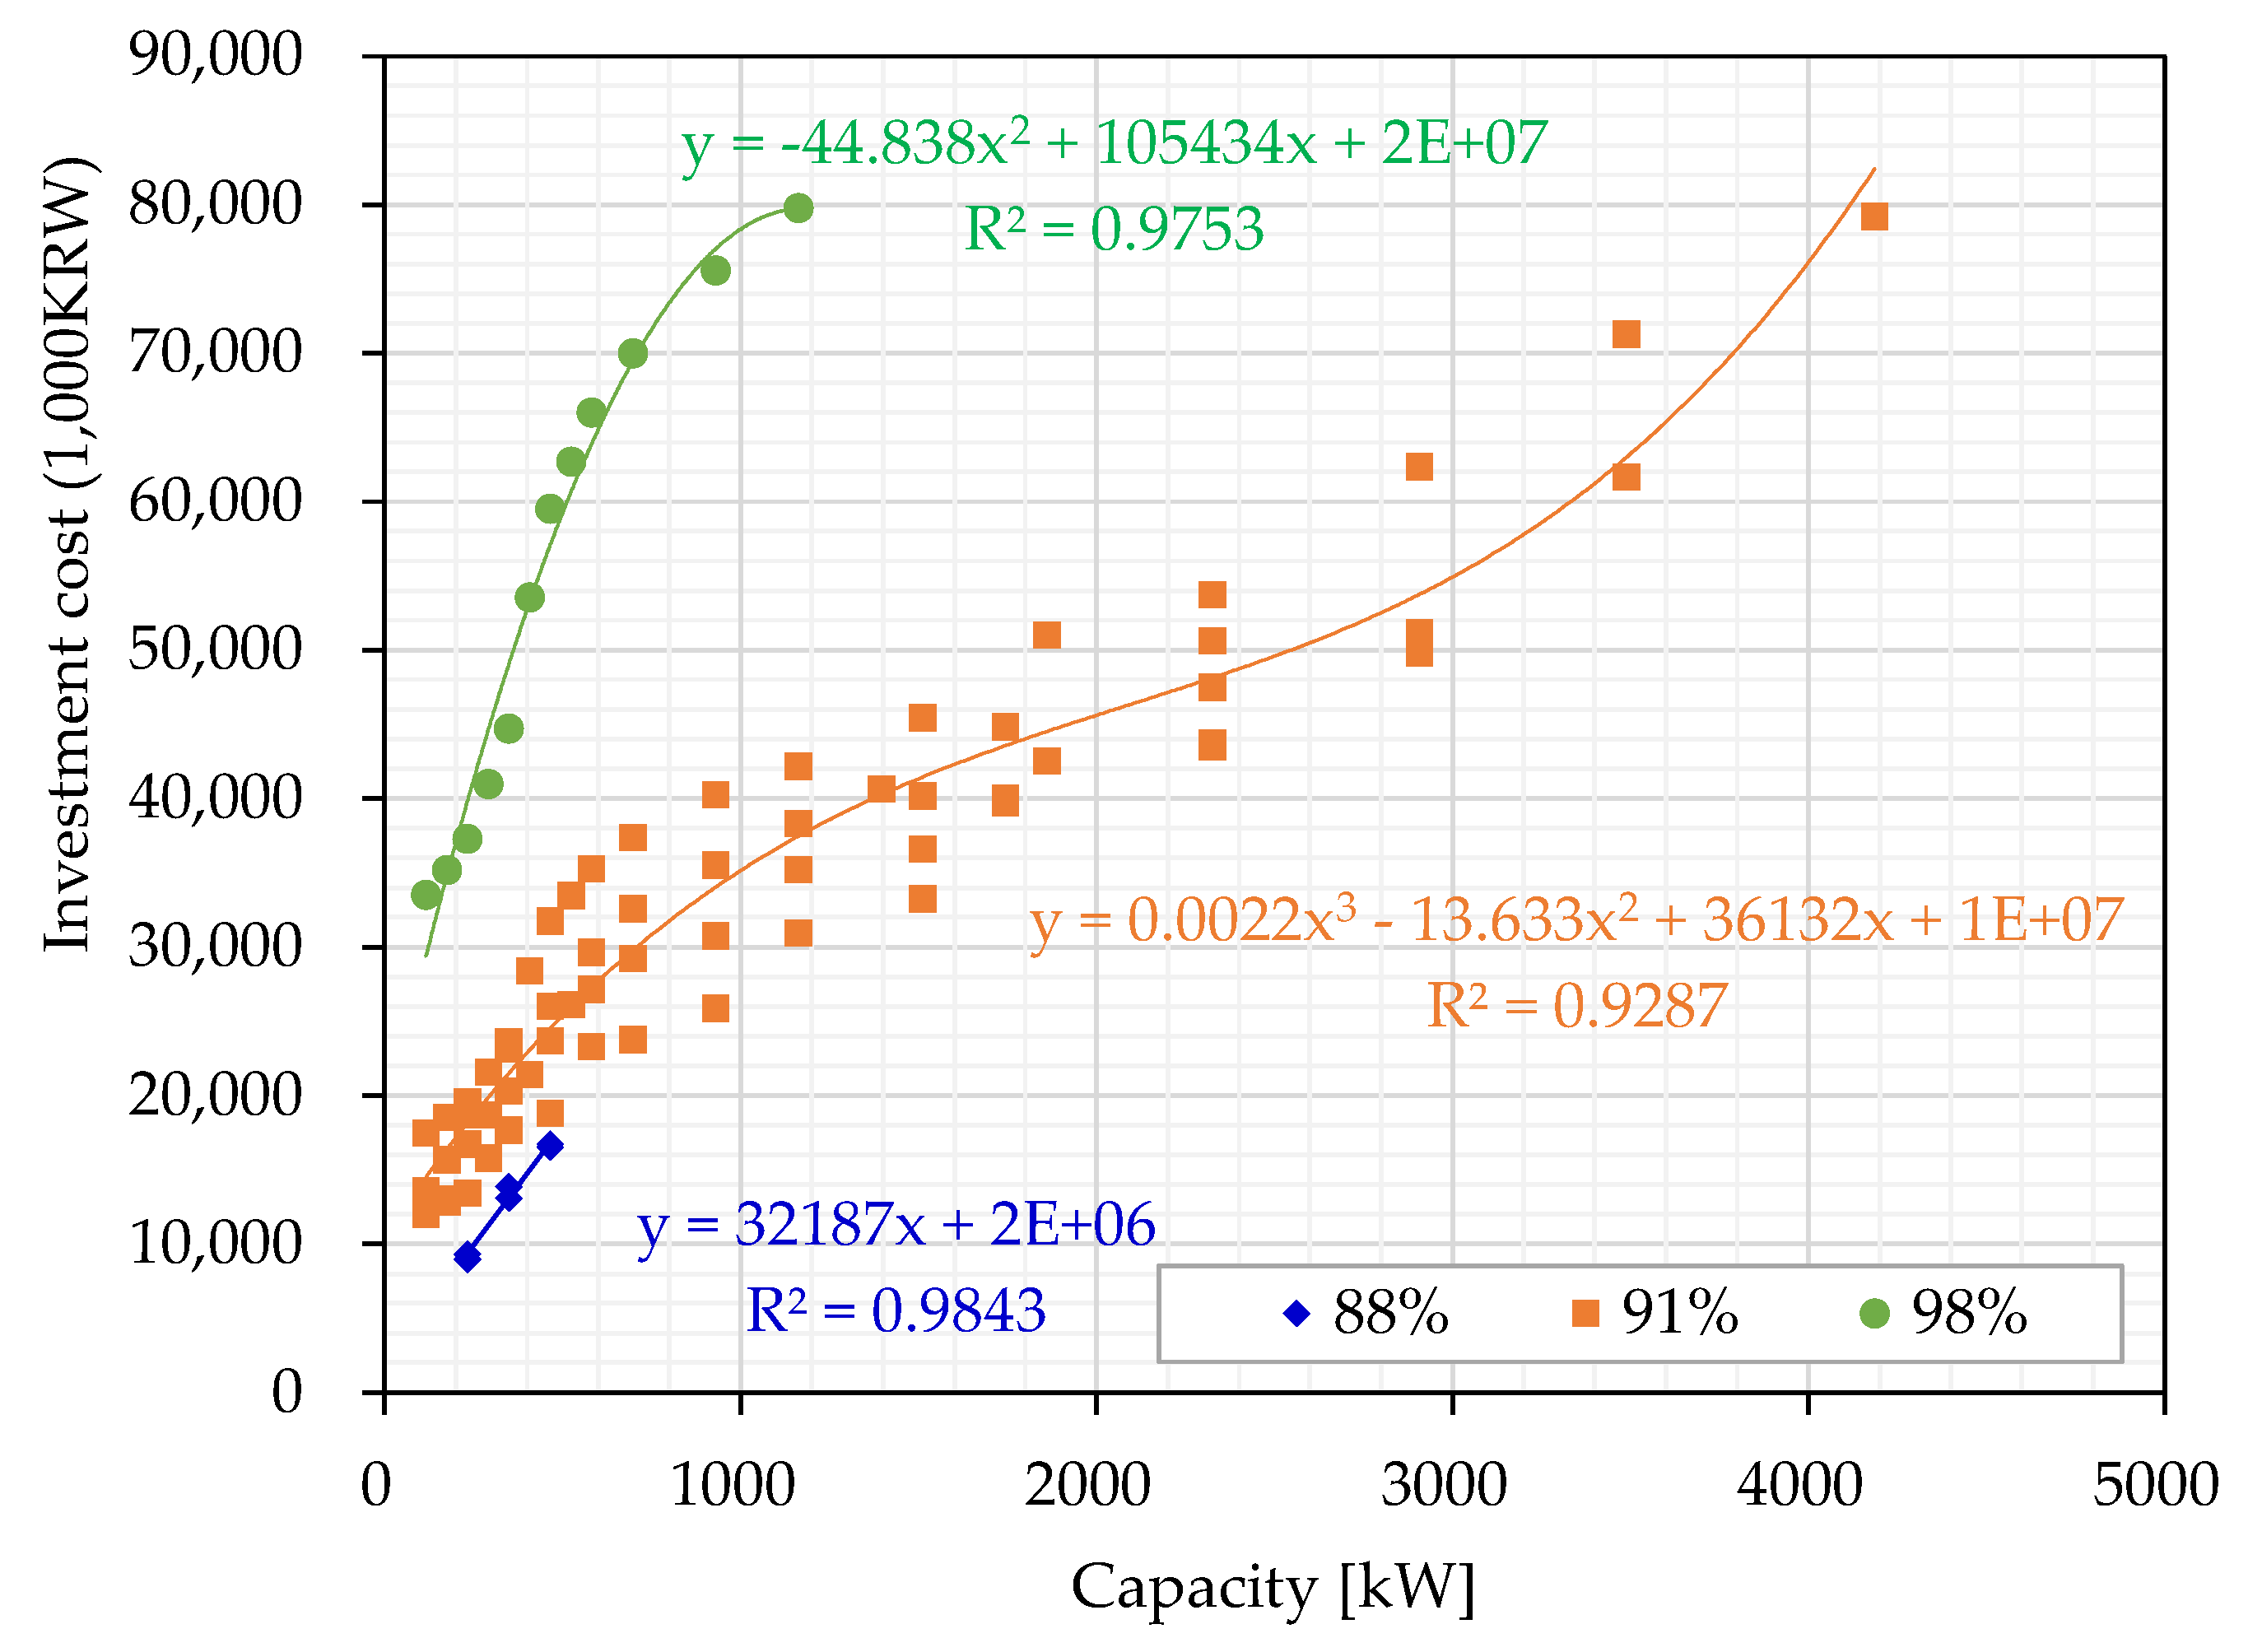
Figure 1 shows the example of analyzing the relationships between the U-values and investment cost of the exterior wall, roof, and floor. The cost increased considerably as the U-value decreased, and the R2 of all calculation models were 0.8 or higher. Likewise, the upgrading of the boiler also produced differences in investment cost according to the equipment efficiency and capacity as shown in Figure 2, and the calculation models showed a high explanatory power with more than 0.9 of R2. Table 2 shows a part of the developed cost calculation models for various ECMs. In this table, 1000 KRW corresponds to about $0.84 ($1 is approximately equal to 1200 KRW). For the building envelope, lighting, and PV system, the equations were developed based on the investment cost per unit area. For the heating and cooling systems, the equations varied with capacities according to each efficiency group. And the collected data were marked by black dots in the table, depending on whether they were used for energy performance or cost calculations.

3. Evaluation Method of Energy Performance and Cost

3.1. Reference Model

To select the reference buildings, certified building data from the national Building Energy Efficiency Rating Certification System were analyzed. This voluntary certification system has been implemented since 2001 to promote the reduction of building energy consumption by providing customers information on building energy performance [11]. From 2001 to 2020, preliminary certificates were issued for about 12,500 buildings at the design stage, and final certificates were issued for 5500 buildings after construction. Among the non-residential buildings, office buildings, and educational and research buildings, to which the performance criteria of BECC are currently applied and have the largest number of certifications, were selected for the analysis.
The buildings that received certifications between 2013 and 2017 were categorized by building type and size, as shown in Table 3. All certified buildings were divided into a small (500–3000 m2) group and large (>3000 m2) group by gross floor area according to the BECC’s classification criteria. The ‘others’ category of educational and research building includes training centers, libraries, cultural centers, dormitories, educational office buildings, etc. In this study, considering the number of data and the representativeness of the building type, it was decided to select one reference building from each of the small office buildings, large office buildings, and large K-12 schools.
To define the representative values related to building features such as the gross area, number of floors, type of heating or cooling systems and equipment, descriptive statistical analysis was performed based on the certified building data. The size distribution by building type and the statistical values are listed in Table 4. For the small office building and the K-12 school, the mean values were similar to the median values in terms of gross areas and number of floors. 52.7% of the K-12 schools were 5-story buildings and 37.8% were 4-story buildings. The distribution of the number of floors in large office buildings also showed a similar trend. On the other hand, the mean value of the gross floor area of large office buildings, which showed a large skewness in terms of gross floor area distribution, differs significantly from the median value. In this case, it can be seen that the median value is more appropriate as a representative value of the data distribution. In the case of the small office buildings, 90% of all buildings used electric or gas heat pumps for heating, and 51.6% of them used boiler and heat pumps together. For cooling, 48% of buildings used heat pumps, and 46% used packaged air conditioners. Among the large office buildings, 25% used heat production systems such as boilers and chillers and individual heating and cooling equipment in parallel, followed by heat pumps only which were used in 24% of the cases. Among the K-12 schools, 92% used heat pumps for heating, while compression-type chillers and heat pumps were used for cooling in parallel in 46% of the cases.
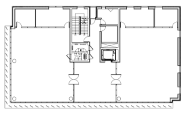
By reviewing the architectural drawings and building equipment lists of the certified buildings, three buildings with features similar to statistical representative values for each building type were selected as reference buildings. Table 5 shows the basic information of the selected reference buildings by building type.

3.2. Cost Calculation

Despite the energy saving that can be achieved when an ECM is applied, if its investment cost is not reasonable, the public acceptance of the ECM by the market will be low. Therefore, not only the energy-saving effect itself but also the saving to the investment cost must be analyzed. Zhang et al. [10] developed an economic model for ECM and conducted an economic efficiency assessment by applying the SIR method for various ECMs in four climate areas in China. Galatioto et al. [22] developed an evaluation model to determine the optimal retrofit cost for historical buildings in Italy and analyzed the LCC and PP for various retrofit measures. In many other studies [23,24,25,26], the investment cost and LCC for the application of various ECMs have been calculated and their relationships to energy savings or PP have been analyzed.
This study attempted to conduct an economic analysis based on the developed ECM cost data. In order to identify the economic feasibility of ECMs as in the above-mentioned various previous researches [10,22,23,24,25,26], the SIR, which quantifies the energy saving to the investment cost, and the PP of the investment cost were selected as the indices of assessment. The following Equations (1) and (2) describe the equations to calculate SIR and PP, respectively:
S I R = E S I C ,
P P = I C E C 0 E C e c m ,
where ES, IC, EC0, ECecm denotes the energy saving when the ECM is applied (kWh), the incremental cost of the ECM(KRW), the energy cost of the baseline model (KRW), and the energy cost when the ECM is applied (KRW), respectively.
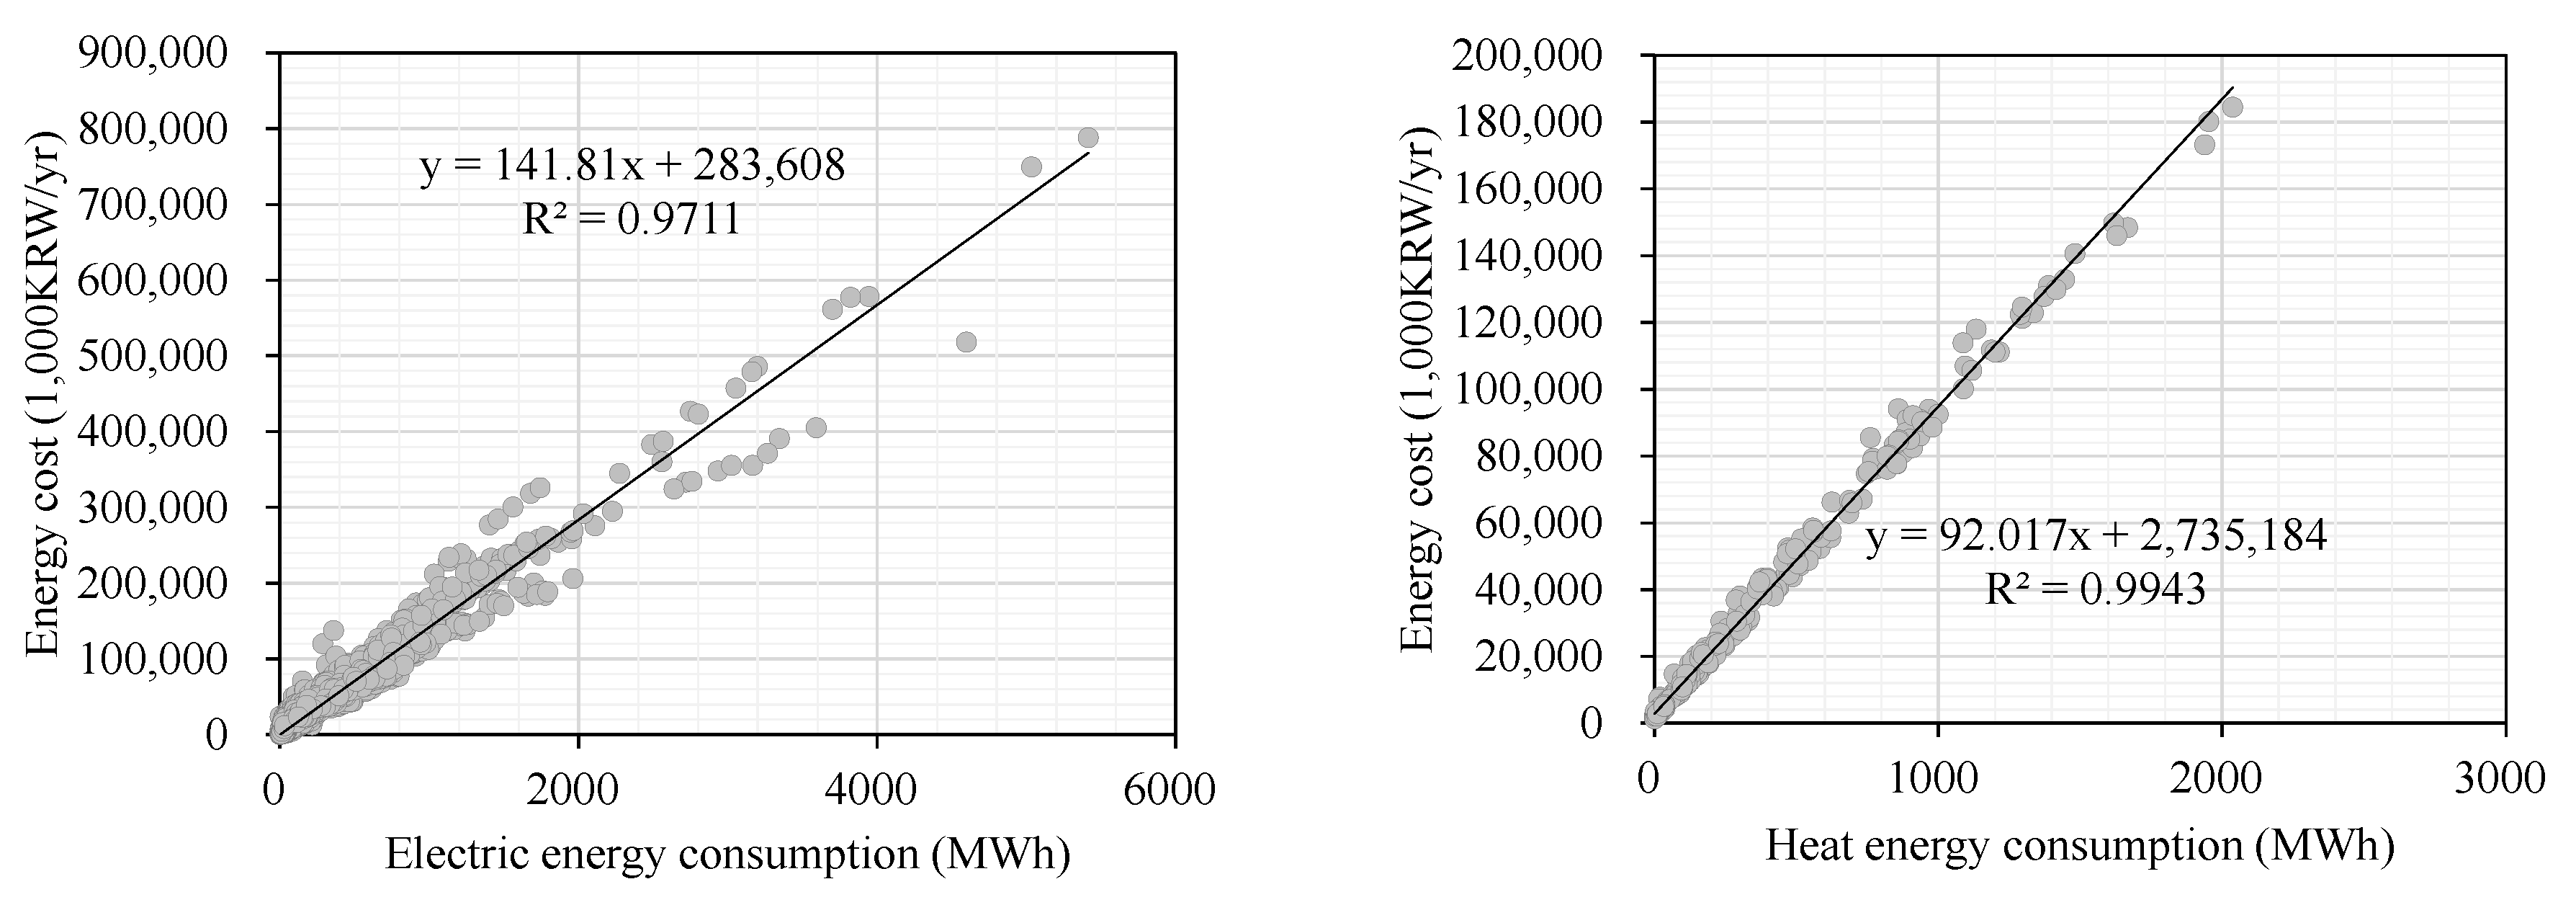
The electricity or heat energy costs of nonresidential buildings are very complex to calculate because of diverse types of contracts and time-variant pricing systems. To calculate the annual energy cost (EC) of Equation (3), the energy cost estimation models were derived through regression analysis based on real energy billing data according to the annual energy consumption for 30,552 cases of electricity and 271 cases of district heating as shown in Figure 3. For the gas energy cost, the regional average prices were applied. Table 6 shows the energy cost estimation model by fuel type.
E C = E C e l e c + E C g a s + E C h e a t

3.3. Energy Simulation

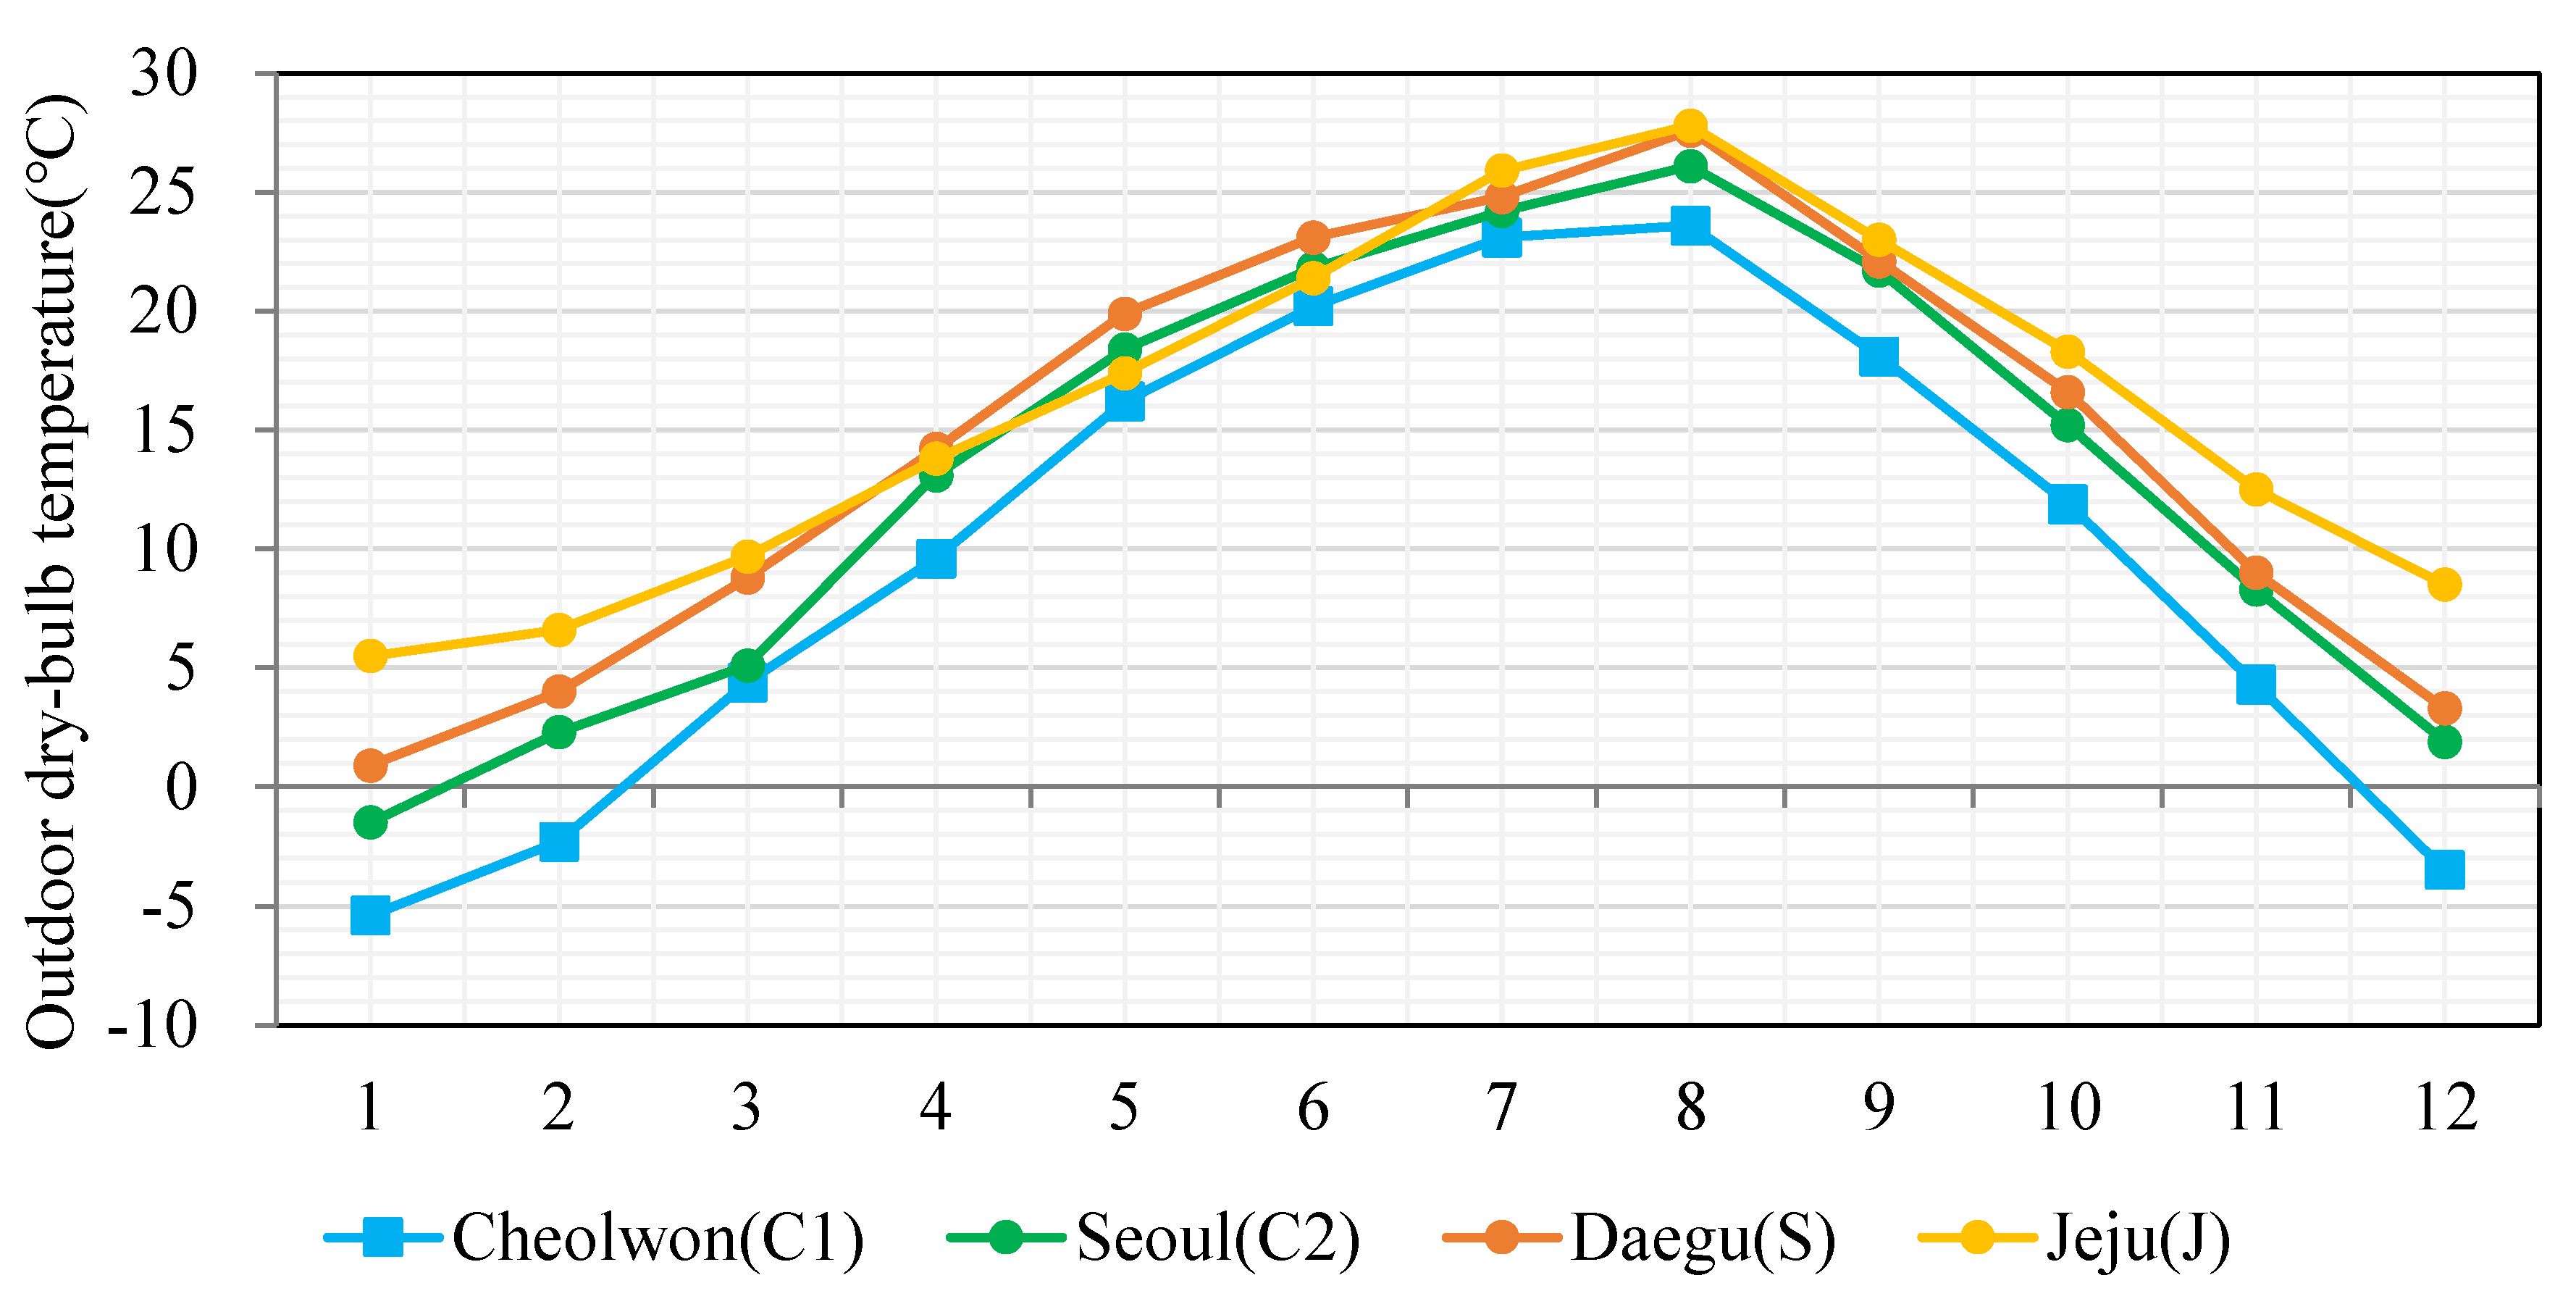
The ECO2-OD, the national official program for calculating building energy need, use, and primary energy use based on the ISO 52016 [11,27], was used to analyze the energy performance according to the reinforcement of the prescriptive criteria of the BECC and the application of ECMs. The program can calculate the energy need and use simply by using the design information in the permission stage, i.e., when the specific details of the buildings are not yet been specifically defined. As the weather conditions of three reference buildings, four representative cities were selected considering the four climate regions of the BECC: Cheolwon in the Central 1 (C1) region, Seoul in the Central 2 (C2) region, Daegu in the Southern (S) region, and Jeju in the Jeju region (J). Figure 4 shows the monthly average ambient temperatures of each city. Among the input parameters concerning the building information, the building type, number of floors, orientation and other geometric data, floor area, equipment type, and capacity were entered as specified in the drawings. The standard operating schedules and conditions were used for lighting, equipment, occupancy, and operating days.
The performance parameters were divided into two groups: parameters for analyzing the energy-saving effects according to the reinforcement of prescriptive criteria until present, and parameters for analyzing the effect of current available ECMs. First of all, for the performance parameters to analyze the effect of the strengthening of the prescriptive criteria, U-value of building envelope, efficiency of heating and cooling equipment, heat recovery rate, lighting power density, and renewable energy ratio to the lighting capacity were selected according to the prescriptive criteria of BECC. Even though the ECM cost data were also established for boilers and chillers, we only used the efficiency of the heat pump as performance parameter, which was applied to the reference buildings. In the case of the performance parameters for the ECMs, heat recovery rate was excluded because there is little data on the cost for the heat recovery rate above the current level specified by the prescriptive criteria.
To analyze the energy-saving effect of the reinforcement of the BECC, the energy needs and uses of reference buildings were calculated based on the values of the parameters at each period when the criteria were reinforced from 2001 to the present. Subsequently, to investigate the energy-saving potential by applying high-performance ECMs, the reference buildings with the parameter values of the latest prescriptive criteria were set as the baseline models. Table 7 shows the input values of the performance parameters according to the reinforcement of the prescriptive criteria for each climate region. A total of 10 periods were established from 2001 to 2020.
Table 8 and Table 9 show the input values for the performance parameters of ECMs when the simulation model of P10 was set as the baseline. In the case of the U-value, as the values applicable to the baseline model varies according to the region, high-efficiency U-values were sequentially assigned based on the U-value of the baseline model of each region. For the heating and cooling equipment, only the efficiency was changed, while the type and capacity of the system was fixed to the values of the systems designed at the time of certification. The efficiency of the EHP was assigned to all the reference buildings, whereas that of the GHP was only applied to the K-12 school building. Finally, changes in lighting power density and renewable energy ratio were also applied to all reference buildings in a similar way.

4. Results and Discussion

4.1. Energy Saving Effect According to the BECC Reinforcement

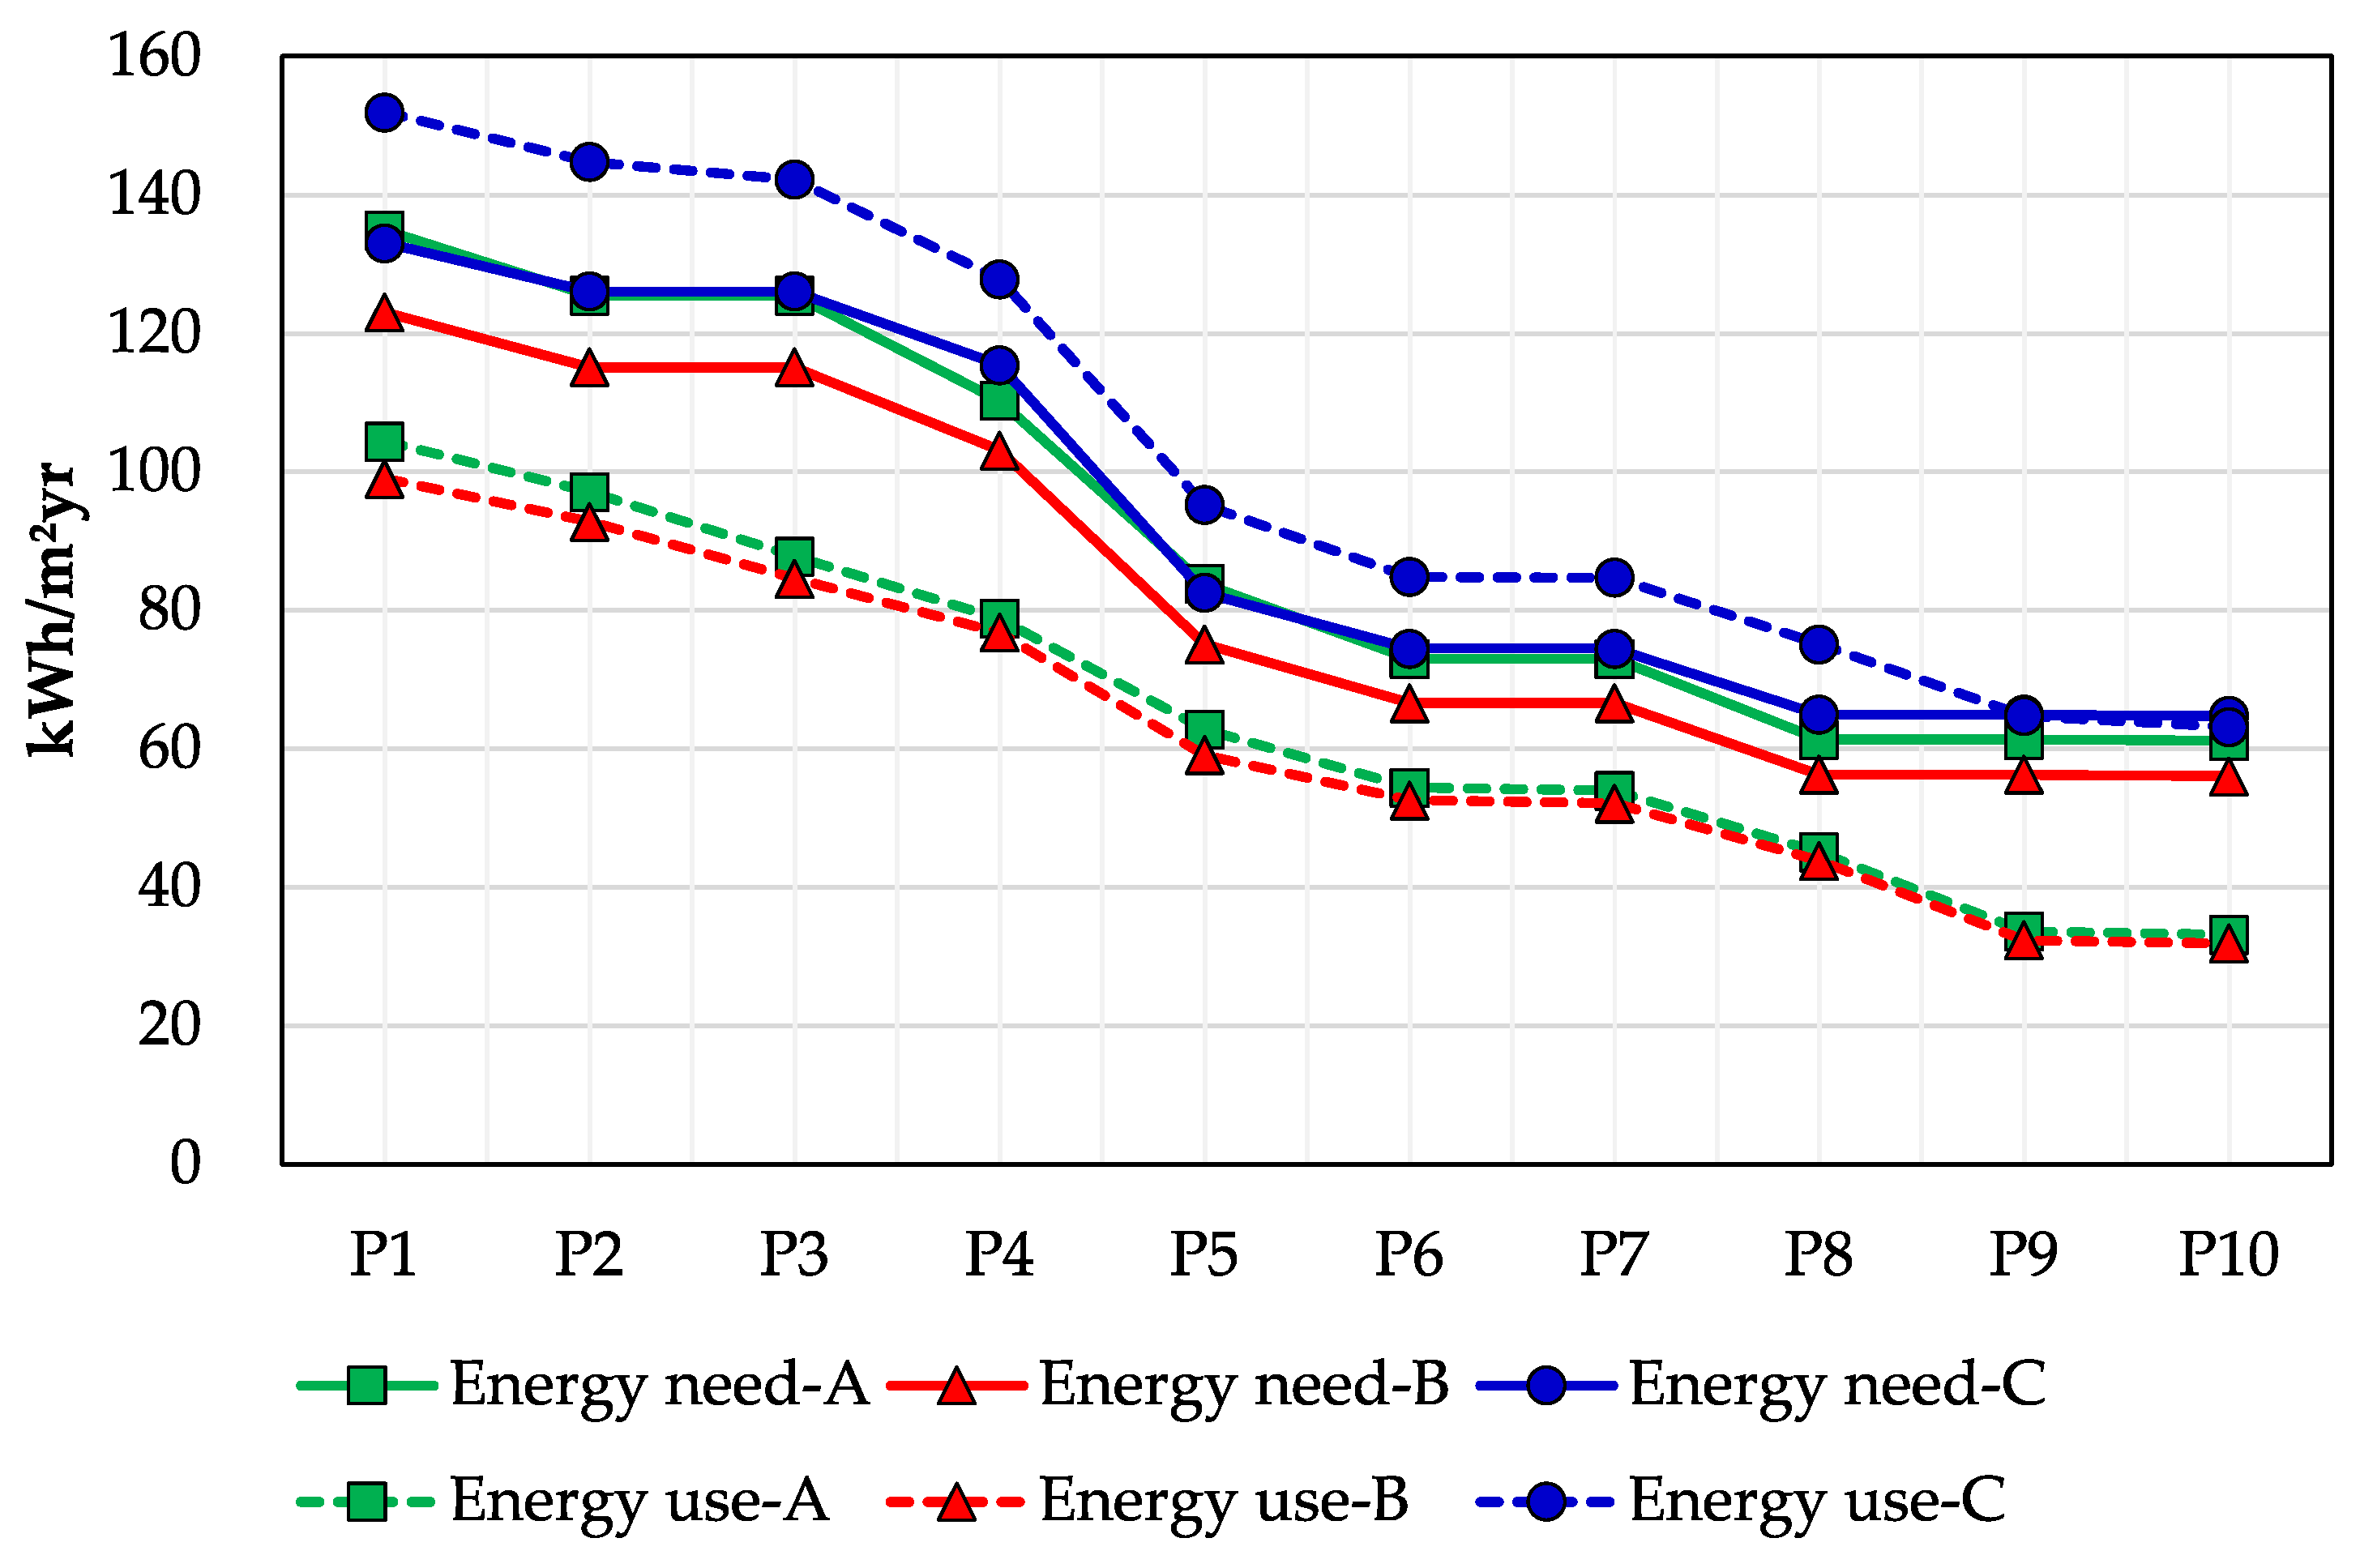
The energy needs, energy uses, and primary energy uses of the small office building A, the large office building B, and the K-12 school building C for each region, calculated by the latest ECO2-OD version 2018.901.3, are shown in Table 10, Table 11 and Table 12, respectively. The reduction ratio in these tables was calculated by dividing the difference of energy need or use in P10 and P1 by energy need or use in P1. Figure 5 shows at a glance the trend of reduction in energy use and need of three reference buildings in the C2 region with the reinforcement of the BECC.
When the latest prescriptive criteria (P10) were applied, buildings A, B, and C all satisfied the current performance-based criteria, primary energy use requirement of 200 kWh/m2·yr for private buildings and 140 kWh/m2·yr for public buildings, in every case. The reduction ratios of the energy need in P10 compared to P1 ranges from 50.2 to 60.0% for the small office building, from 50.1 to 58.7% for the large office building, and from 47.6 to 55.4% for the school building. The reduction ratios of the energy use ranges from 66.4 to 70.0% for the small office building, from 66.2 to 69.4% for the large office building, and from 55.6 to 61.1% for the school building. The energy need and energy use of the reference buildings in every region showed a gradually decreasing trend, thereby confirming the effects in terms of energy saving.
The energy need and use of the large office building were lower than those of the small office building. The larger window to wall area ratio of the small office building than that of the large office building can be one of its reasons. The office buildings A and B showed a significant difference in energy use compared to the school building C. Given that there was not much difference in energy need, the differences in energy use seems to be caused by the fact that the school building uses GHP and EHP with different efficiency in parallel. In terms of the reduction ratios of energy need and use by region, the highest value was achieved in C1, followed by C2, S, and J. As expected, it can be seen that the lower the average annual temperature, the greater the energy-saving effect by strengthening the U-value requirements for the building envelope.
It can be seen that the gradual reinforcement of prescriptive criteria for new buildings in Korea has been well aligned with the strengthening of performance-based criteria as well. However, the additional reinforcement of the prescriptive criteria may not guarantee an effect as strong as that produced in previous reinforcements. Therefore, it is necessary to examine the energy-saving potential through future reinforcement of the BECC and the feasibility of ECMs based on the economic analysis.

4.2. Energy Performance and Cost Evaluation According to a Single ECM Change

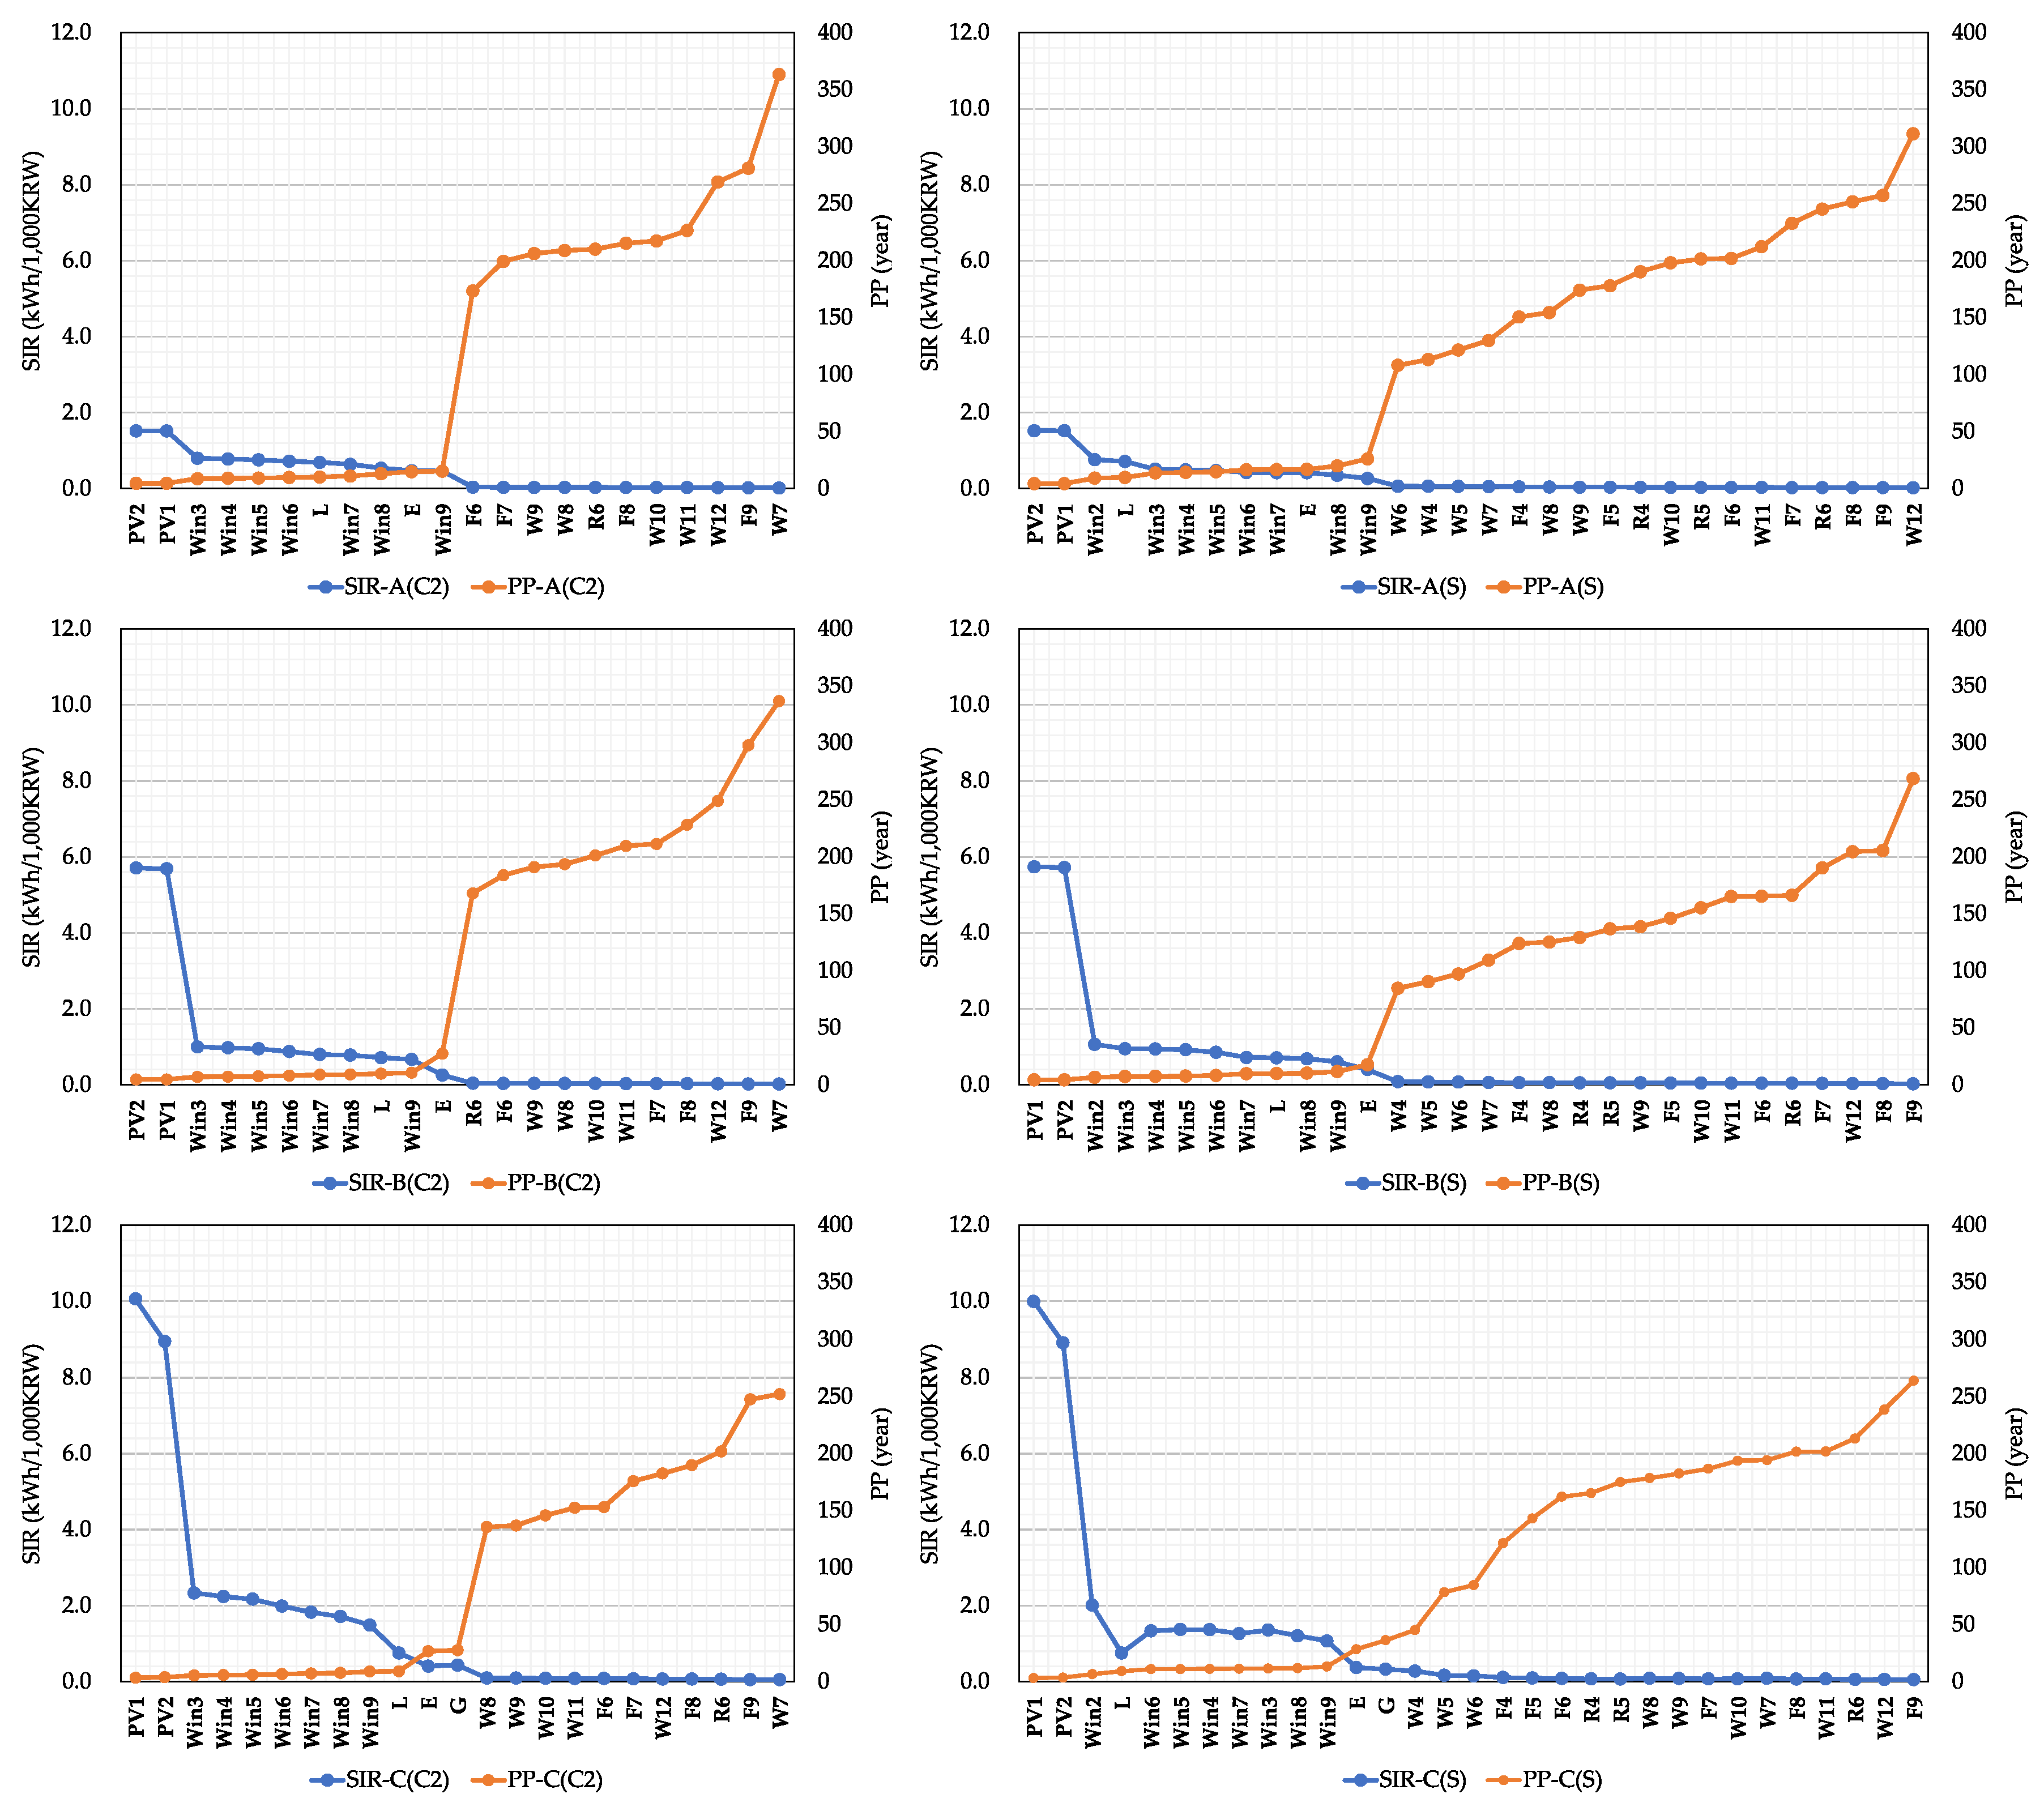
To propose a direction for future improvement of the BECC, the reference building models in P10 were chosen as the baseline models for the current state. To investigate the energy-saving effect of ECMs, SIR, and PP were calculated by analyzing the investment cost increase and energy cost saving when the ECMs were applied to the baseline models one by one. Figure 6 shows the result for each reference building in Seoul in the C2 region and Daegu in the S region in ascending order of PP. Table 13 shows the calculated values of SIR and PP for each reference building in all regions.
First of all, the applicable ECMs were analyzed in terms of the PP. Assuming that at least 15 years of PP was required, this could be satisfied in most cases by installing PV systems, improving the thermal performance of windows, or applying a lower lighting power density. For the reference building A in the C1 region as an example, the increased investment cost could be recovered within 15 years by applying the high efficient EHP as an ECM. In many cases, the PP of the investment cost by improving the thermal performance of windows was also within 15 years. By contrast, when the insulation criteria for wall, roof, and floor were reinforced from the current criteria, the PP of the reference buildings in all regions increased sharply. The effect of the investment for improving the insulation of the exterior wall, roof, and floor seems to be insignificant, even if the prescriptive criteria for U-values are reinforced.
Among the reference buildings, the SIR was the highest in building C, followed by that in building B and building A. The PP also was the shortest in building C, followed by that in building B and building A. As the investment cost calculation models for the building envelope were in the form of exponential functions, the lower the window U-values and the larger the window area, the higher the window investment cost to reduce heating loads, resulting in differences in SIR and PP. However, the energy-saving ratios (ESR) of the ECM model to the baseline model also increases with the window area ratio, so the investment cost could be recovered within 15 years in most cases albeit even though there are slight differences in the PP. By region, the energy-saving effect was the highest in C1, the coldest region, followed by C2, S, and J, which is consistent with the analysis according to the reinforcement of the BECC. In each case, the PP becomes longer as the thermal performance of the windows improves, which leads to the gradual reduction of the SIR. Therefore, if the U-value requirements are reinforced too much, it may be difficult to expect the appropriate PP, similar to the case of the exterior wall, roof, and floor.
In addition, the effect of U-values on energy performance was analyzed as it may vary depending on the building envelope areas and climate conditions. Figure 7 shows the SIR of buildings A to C with the change of the window U-values for four regions. When applying windows with the same U-value in each building, the initial investment cost is the same. However, the SIR gradually decreased from the colder region C1 to the warmer region J, because the ESR varies from region to region due to the influence of the climate condition. It shows that energy-efficient windows can contribute more to heating energy savings at the same initial investment in buildings in colder climates.
Next, the relationship between the PP and the SIR was analyzed. For office buildings, the rankings of SIR and PP by the application of each ECM were inversely related in every region. Similarly, for the school building C in C1 and C2 regions, the PP value increased while the SIR decreased. On the while, when the ECM L, the low lighting power density, was applied for the school building C in S and J regions, the PP was higher despite the lower SIR, compared to the case where the ECMs Win6 to 9 were applied. This may be due to the climate conditions of S and J regions where winter is relatively mild and summer is hot, parallel application of EHP and GHP, and the difference in energy cost between electricity and gas. Moreover, as the lower lighting density leads to a reduction in internal heat gain, the heating load increases, and the cooling load decreases. Therefore, the heating load increases more, and the cooling load decreases less in C1 and C2 regions, where the ambient temperature is low in winter and is also relatively lower in summer than that in the S and J regions. By contrast, in the S and J regions, a large amount of decrease in the cooling load with a low increase of the heating load can be expected.
Unlike two office buildings which use EHPs for both heating and cooling, the school building C uses GHPs as main heating equipment and EHP as auxiliary heating equipment. For cooling, although EHPs are used as the main cooling equipment, but GHPs are also used with almost the same weight. In other words, even if the lighting power density is lowered and the cooling energy need is reduced significantly, its effect is smaller than in the case in which only EHP is applied, and the energy use can increase significantly if the heating energy need increases. Owing to these complex effects, the SIR values were low because the reduction of energy use was smaller than the increase of investment cost even though both the cooling and lightning energy uses decreased.
Nonetheless, the PP was shorter for the ECMs with a high SIR value. The cause may be found in the difference in energy cost between electricity and gas. As the electric energy for cooling and lighting decreased, the portion of the electricity cost to the total energy cost decreased significantly. Although the heating energy use has increased, the total energy costs have decreased significantly because gas costs were lower than electricity costs. On the while, when the thermal performance of windows was reinforced, the gas cost decreased due to the lower heating energy use, but the electricity cost increased due to the higher cooling energy use. As a result, the total energy cost reduction relative to the baseline model was smaller than in the case in which the lighting power density was lowered.

4.3. Energy Performance and Cost Evaluation according to Combined ECM Changes

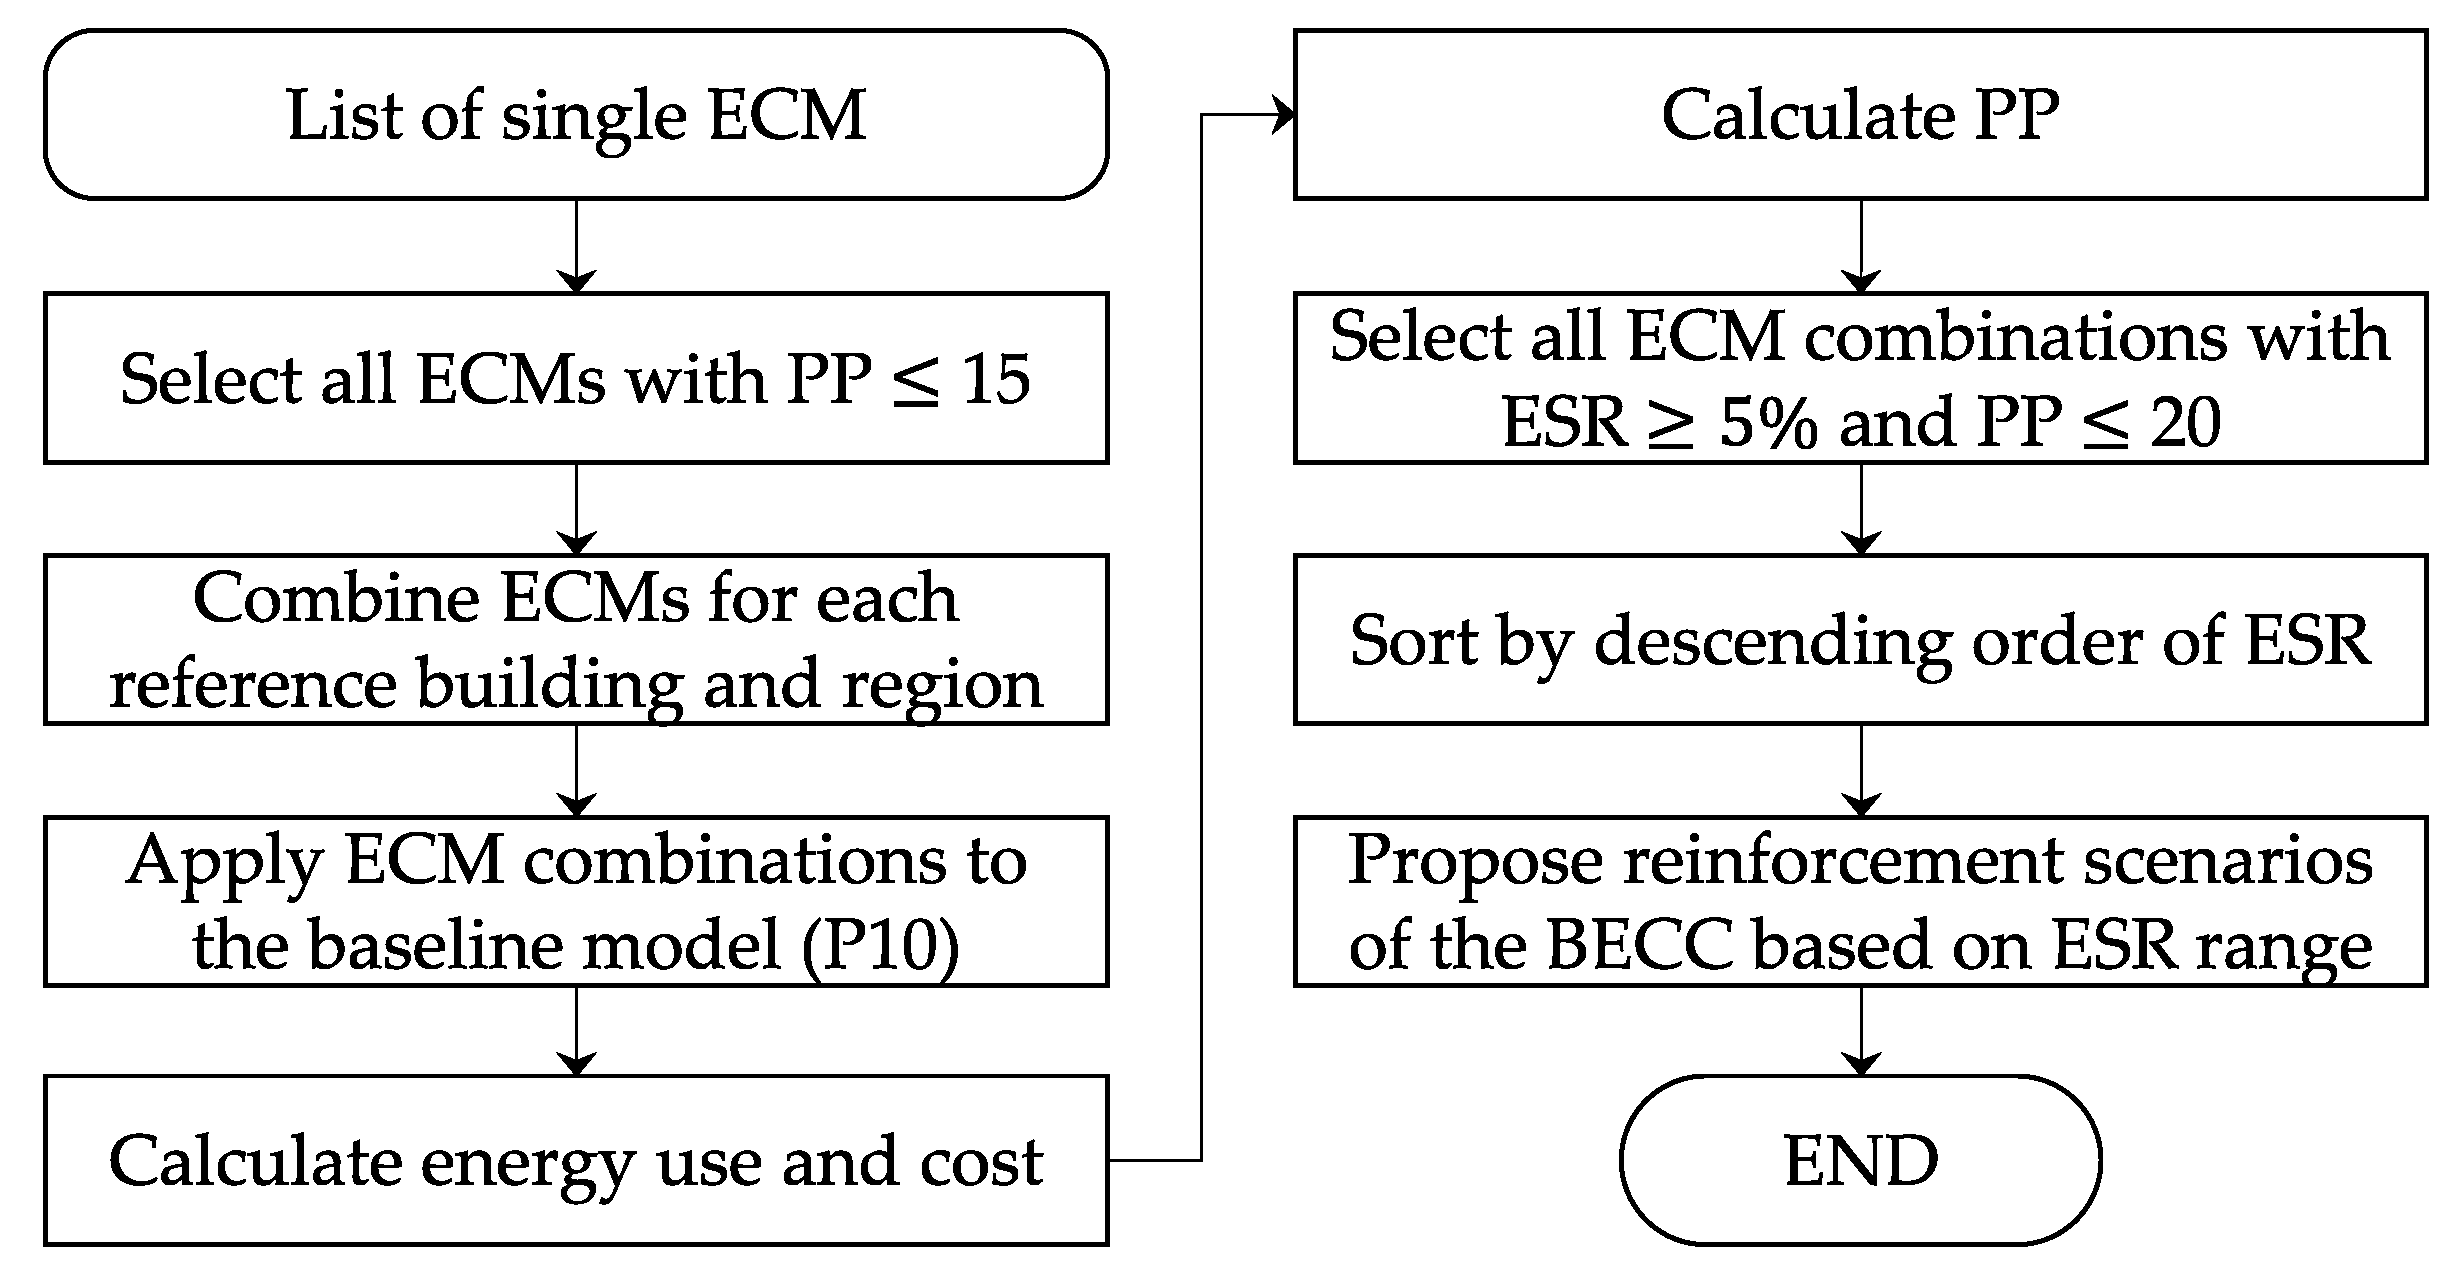
This study aims to suggest directions for future revisions of the BECC by analyzing the potential for energy saving based on a cost-effective ECMs. Therefore, the applicable ECMs were selected based on the PPs of the investment cost, and the reinforcement scenarios were proposed by analyzing the energy-saving effect. The energy-saving effect, energy-cost saving, and PPs were analyzed for single ECM or ECM packages that could have a PP of 15 years or less. These combinations were produced on the basis of the energy saving and economic efficiency obtained by the single ECM changes analyzed above. Table 14 shows the selected ECMs for each reference building and region, and Figure 8 shows the process for analyzing energy saving and economic efficiency for these combinations.
Compared to a single ECM, ECM packages can produce various ranges of ESR to the investment cost. Thus, for the reinforcement scenarios of the BECC within reasonable cost ranges, only the ECMs with PPs of 20 years or less and ESR of 5% or higher were finally selected among total combinations. Figure 9 shows the ESR and the investment cost PP according to the reference building and region, derived in accordance with the analyzing process of the ECM combinations in Figure 8. Table 15 shows the number of ECM combination cases selected among all total cases as well as the minimum and maximum values of the energy use, ESR, and PP of the selected cases for each building and region.
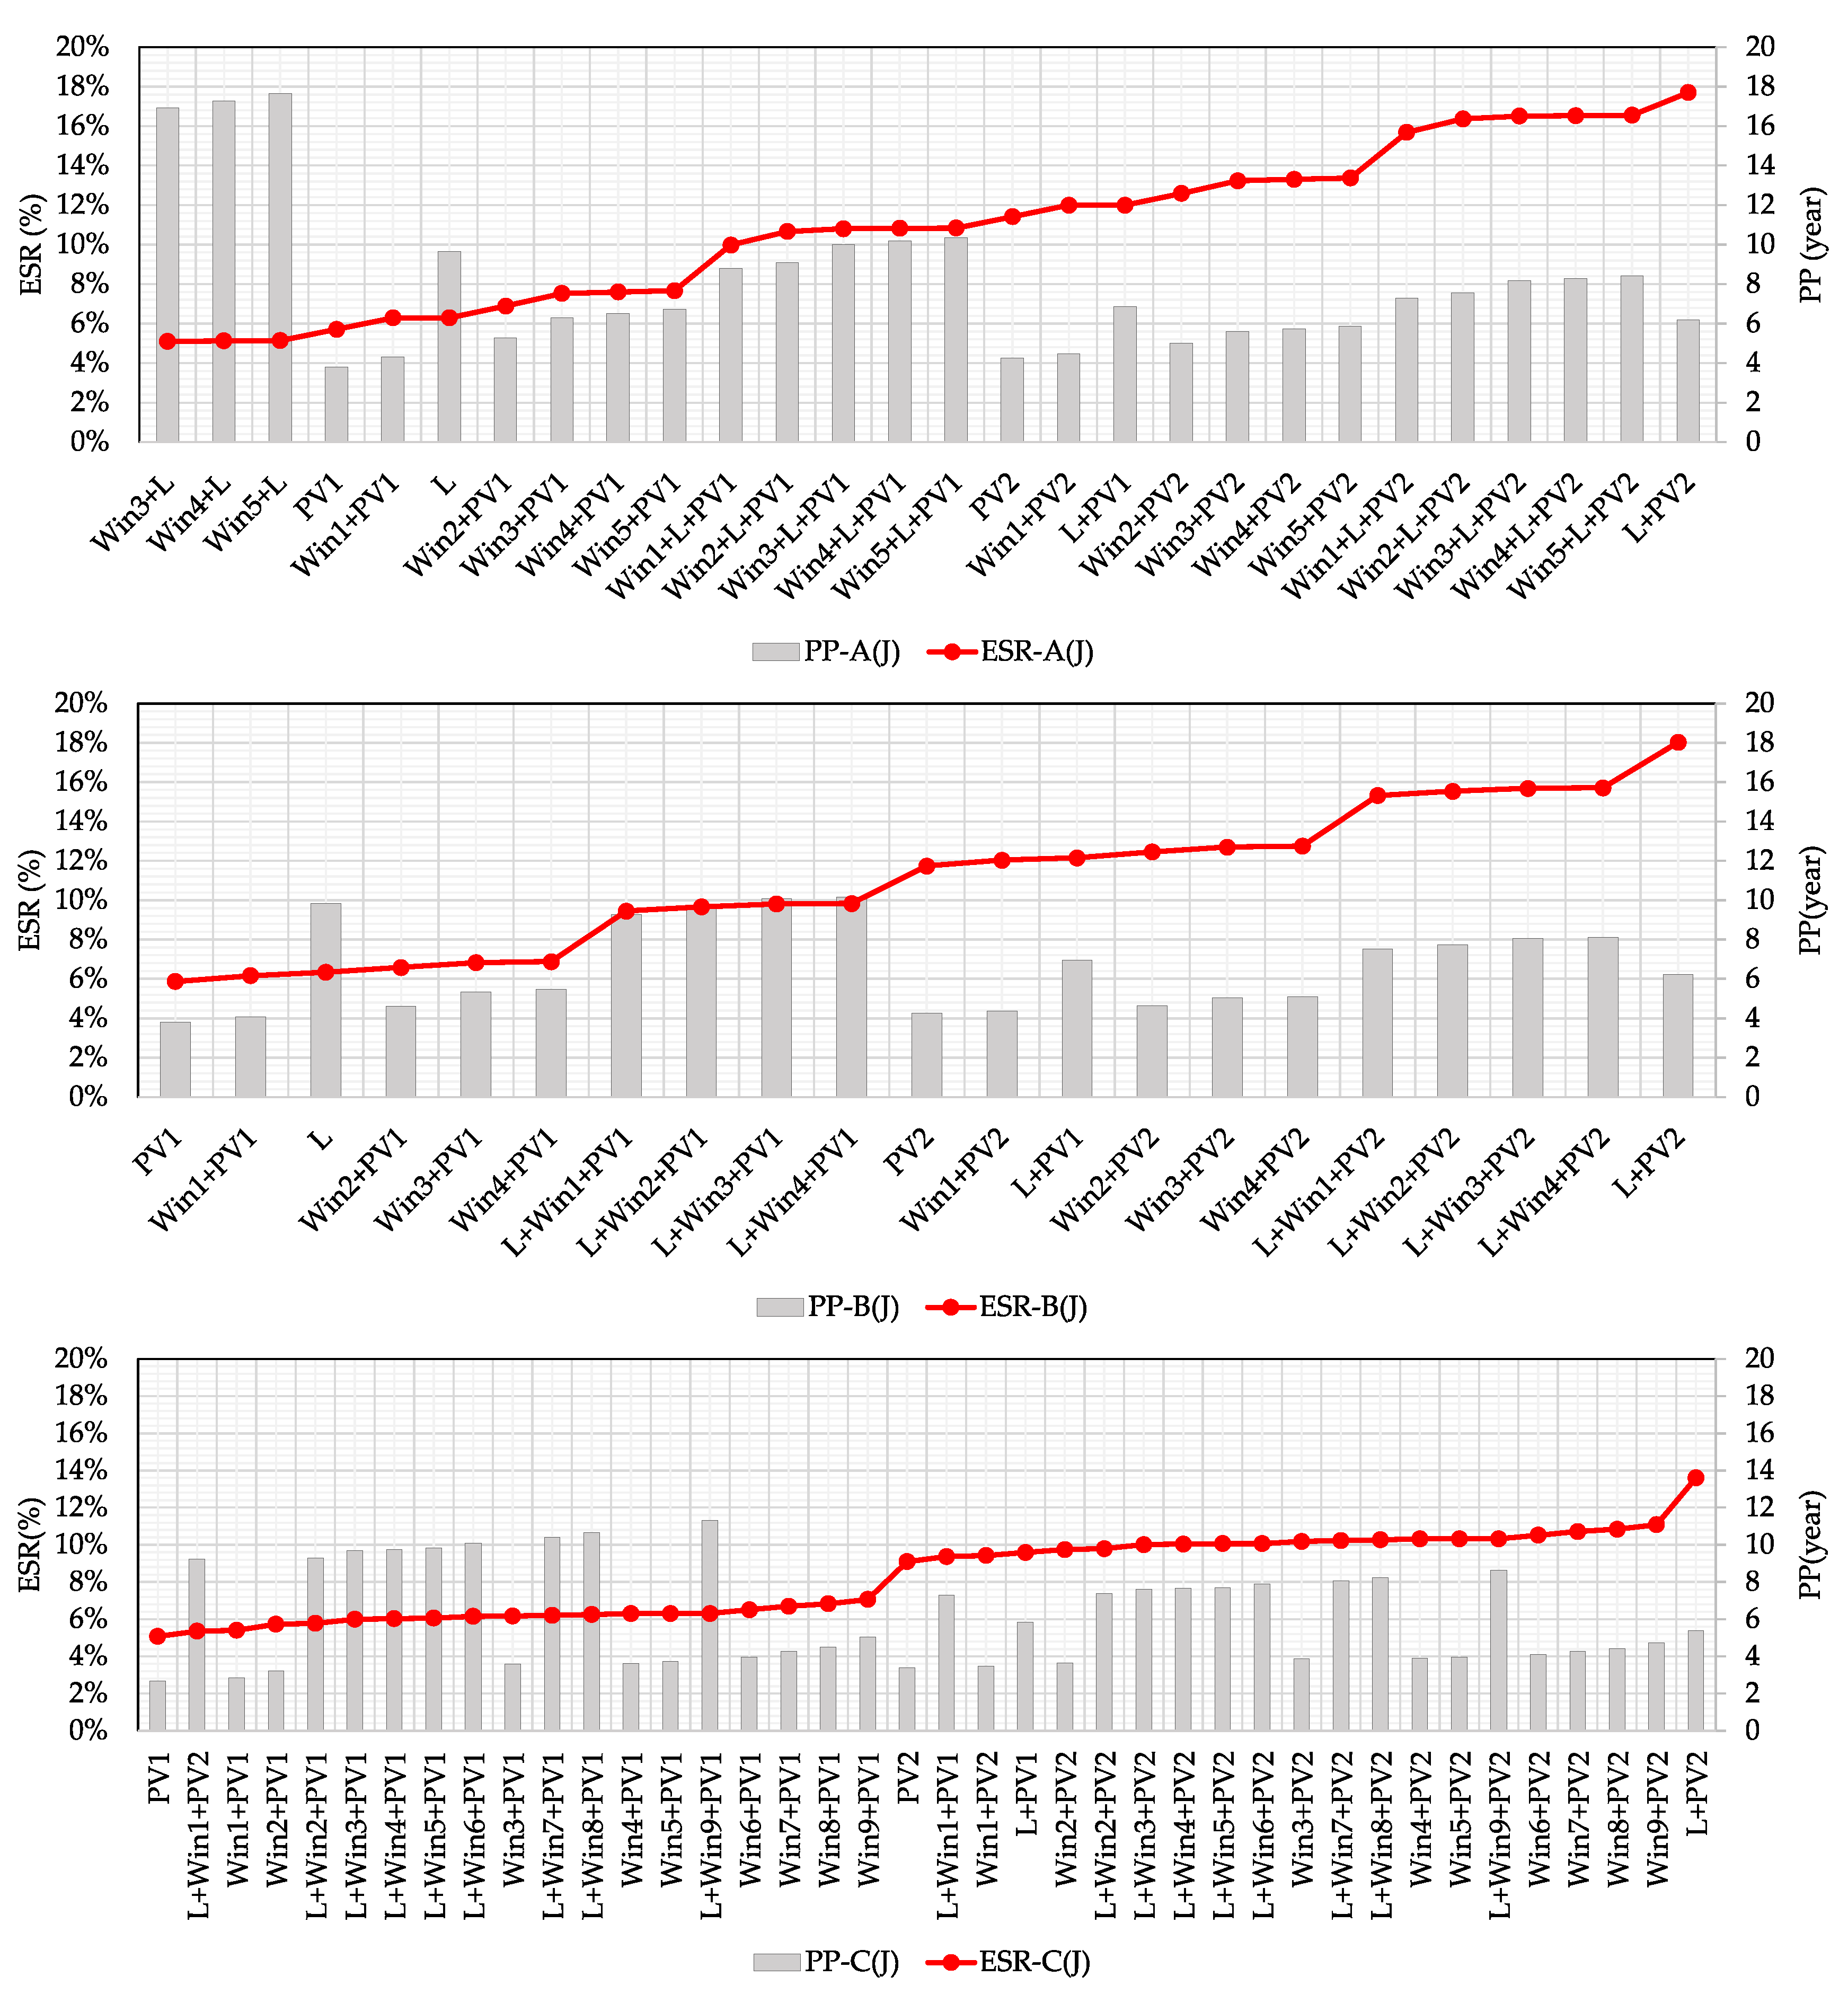
The energy use of both of the reference office buildings could be reduced by up to 20%, while the maximum ESR of the school building C was 13%. This difference may arise from the difference in equipment type and building type. Figure 10 shows the ESR and PP in ascending order for the cases in which ECMs combinations were applied to each reference building in the J region. All buildings show the highest ESR when the ECM L and ECM PV2 were applied simultaneously, and the ESR was higher in office buildings. Since office buildings can be characterized by a high internal heat gain from various equipment such as PCs, printers, copy machines, the highest effect seemed to be obtained when the ECM L and ECM PV2 were applied. For school buildings, the highest thermal performance of the windows (ECM W9) could be applied even in warm regions, and the ESR also showed an increasing trend with the increase of thermal performance. In other words, unlike office buildings, which can save energy by focusing on cooling or lighting energy use rather than on heating, the school building showed a higher increase in heating energy use when the cooling or lighting energy use decreased due to the relatively low internal heat gain and vacation periods. In terms of PP, the school building generally showed a shorter PP compared to that of the office buildings. It seems that even though the energy-saving effect was lower, the cost-saving due to the reduced electrical energy use was higher because of the much lower gas cost.
In the relation between the ESR and the PP in Figure 9, there was a tendency for data to be concentrated on several specific ranges of PP and SIR values. This can also be seen in the changes of ESR of reference buildings in the J region in Figure 10. The ECM packages with ECM PV 2 showed longer PP but higher ESR compared to packages with ECM PV1 or without PV. Even if the PP of investment cost are slightly longer, it is necessary to increase the requirement for the rate of renewable energy production to building energy use as much as possible from the view of the energy-saving effect. Although the energy performance can be improved to some extent by reinforcing the thermal performance of windows (ECMs WIN), the highest energy-saving effect was obtained when the reduction of lighting power density (ECM L) and the increase of PV production (ECM PV2) were applied simultaneously. Since the U-value criteria, which primarily affects heating energy use, have already been sufficiently strengthened, the energy saving effect of the ECMs that affect cooling and lighting energy uses seems to be greater. This suggests that it is necessary to strengthen the criteria related to cooling and lighting energy use rather than heating energy use.
Based on the possibility of increasing the ESR, it was possible to propose a future reinforced scenario for the BECC. The black dots divided into several scenario groups in Figure 9 shows the groups of scenarios based on the step-by-step increase of the ESR according to the specific regional climate conditions and the type of reference buildings. Table 16 shows recommended ECM combinations to achieve the PP and ESR for each scenario. In the cases in which the ESR sections were similar but the PPs were divided into two or more groups, the sections of the scenario were selected based on the shorter PP.

5. Conclusions

Building energy codes are one of the key policy tools that specify the minimum requirement of building energy performance and play a fundamental role in reducing building energy demand and carbon emissions in many countries. This study analyzed the energy-saving effect according to the past reinforcement of prescriptive criteria of the BECC in South Korea. The effect of applicable ECMs were also analyzed considering the economic efficiency, and the scenarios and recommended ECMs were suggested for future reinforcement of the BECC as well as information on the ranges of ESR and PP. For this purpose, ECM cost calculation models were developed by combining the performance data and cost data of building materials and equipment available on the market, which could be applied to finding the cost-effective ECMs for newly constructed real buildings. The SIR and the investment cost PP were calculated for three reference building types that were applied single ECMs and ECM packages in four climate zone. Combinations of multiple ECMs with a PP of less than 15 years were identified, and energy simulations and cost calculations were performed accordingly. Then, the relationship between the ESR and the PP was analyzed according to the application of these ECMs combinations for the cases in which the ESR were 5% or higher and the PP were 20 years or less. The main results of this study are as follows:
  • The gradual reinforcement of prescriptive criteria for new buildings in Korea has been well aligned with the strengthening of performance-based criteria as well. When the latest prescriptive criteria were applied, primary energy use of reference buildings ranged from ranged from 87.7 to 109.8 kWh/m2·yr, which sufficiently satisfied the current performance-based criteria, 200 kWh/m2·yr for private buildings and 140 kWh/m2·yr for public buildings. This suggests that there is room for further strengthening the performance-based criteria in the near future.
  • By installing PV systems, improving the thermal performance of windows, or applying a lower lighting power density, the investment cost could be recovered within 15 years. In many cases, the PP of the investment cost by improving the thermal performance of windows was also within 15 years. However, when the insulation criteria for wall, roof, and floor were reinforced from the current criteria, the PP of the reference buildings in all regions increased sharply. The effect of the investment for improving the insulation of the exterior wall, roof, and floor seems to be insignificant, even if the prescriptive criteria for U-values are reinforced.
  • It was expected that the energy performance criteria for office buildings and school buildings could be reinforced by 5~15% with current available ECMs. The highest ESR were found when reducing the lighting power density as well as adopting the PV system. Since the U-value criteria have already been sufficiently strengthened, the energy-saving effect of the ECMs that affect cooling and lighting energy uses was greater. This suggests that it is necessary to strengthen the criteria related to cooling and lighting energy use rather than heating energy use.

Author Contributions

H.G.K. contributed to the methodology, data analysis, simulation, and writing-original draft preparation. H.J.K., C.H.J., and M.W.C. contributed to the simulation. Y.H.C. contributed to the data analysis and methodology. S.S.K. contributed to the conceptualization of this research, funding acquisition, methodology, and writing-review and editing. All authors have read and agreed to the published version of the manuscript.

Funding

This research was supported by a grant(19AUDP-B079104-06) from Architecture & Urban Development Research Program funded by Ministry of Land, Infrastructure and Transport of Korean government.

Conflicts of Interest

The authors declare no conflict of interest. The funders had no role in the design of the study; in the collection, analyses, or interpretation of data; in the writing of the manuscript, or in the decision to publish the results.

References

  1. Levin, M.; Can, S.; Zheng, N.; Williams, C.; Amann, J.; Staniaszek, D. Building Energy-Efficiency Best Practice Policies and Policy Packages; Lawrence Berkeley National Laboratory: Berkeley, CA, USA, 2012.
  2. Managan, K.; Layke, J.; Araya, M.; Nesler, C. Driving Transformation to Energy Efficient Buildings—Policies and Actions, 2nd ed.; Johnson Controls: Milwaukee, WI, USA, 2012. [Google Scholar]
  3. Building Performance Institute Europe (BPIE). Europe’s Buildings under the Microscope: A Country-by-Country Review of the Energy Performance of Buildings; BPIE: Brussels, Belgium, 2011. [Google Scholar]
  4. Wang, X.; Feng, W.; Cai, W.; Ren, H.; Ding, C.; Zhou, N. Do residential building energy standards reduce energy consumption in China?—A data-driven method to validate the actual performance of building energy efficiency standards. Energy Policy 2019, 131, 82–98. [Google Scholar] [CrossRef] [Green Version]
  5. Evans, M.; Roshchanka, V.; Graham, P. An international survey of building energy codes and their implementation. J. Clean. Prod. 2017, 158, 382–389. [Google Scholar] [CrossRef]
  6. O’Brien, W.; Tahmasebi, F.; Andersen, R.K.; Azar, E.; Barthelems, V.; Belafi, Z.D.; Berger, C.; Chen, D.; Simone, M.D.; d’Oca, S.; et al. An international review of occupant-related aspects of building energy codes and standards. Build. Environ. 2020, 179, 106906. [Google Scholar] [CrossRef]
  7. Jacobsen, G.D.; Kotchen, M.J. Are building codes effective at saving energy? Evidence from residential billing data in Florida. Rev. Econ. Stat. 2013, 95, 34–49. [Google Scholar] [CrossRef] [Green Version]
  8. Chirarattananon, S.; Chaiwiwatworakul, P.; Hien, V.D.; Rakkwamsuk, P.; Kubaha, K. Assessment of energy savings from the revised building energy code of Thailand. Energy 2010, 35, 1741–1753. [Google Scholar] [CrossRef]
  9. Qian, D.; Li, Y.; Niu, F.; O’Neill, Z. Nationwide savings analysis of energy conservation measures in buildings. Energy Convers. Manag. 2019, 188, 1–18. [Google Scholar] [CrossRef]
  10. Zhang, S.; Jiang, Y.; Xu, W.; Liu, Z.; Sun, D. Key prescriptive parameters analysis of the new China building energy code based on saving to investment ratio methodology. Indoor Built Environ. 2017, 26, 78–91. [Google Scholar] [CrossRef]
  11. Park, D.; Yu, K.; Yoon, Y.; Kim, K.; Kim, S. Analysis of a building energy efficiency certification system in Korea. Sustainability 2015, 7, 16086–16107. [Google Scholar] [CrossRef] [Green Version]
  12. National Renewable Energy Laboratory (NREL): OpenStudio. Available online: https://www.openstudio.net/ (accessed on 10 August 2020).
  13. Anton, I.; Tănase, D. Informed Geometries. Parametric Modelling and Energy Analysis in Early Stages of Design. Energy Procedia 2016, 85, 9–16. [Google Scholar]
  14. Lawrence Berkeley National Lab (LBNL): City Building Energy Saver (CityBES). Available online: https://citybes.lbl.gov/ (accessed on 10 August 2020).
  15. Chen, Y.; Hong, T.; Piette, M.A. Automatic generation and simulation of urban building energy models based on city datasets for city-scale building retrofit analysis. Appl. Energy 2017, 205, 323–335. [Google Scholar] [CrossRef] [Green Version]
  16. Chen, Y.; Hong, T. Impacts of building geometry modeling methods on the simulation results of urban building energy models. Appl. Energy 2018, 215, 717–735. [Google Scholar] [CrossRef] [Green Version]
  17. National Renewable Energy Laboratory (NREL). Opt-E-Plus Software for Commercial Building Optimization; US Department of Energy Office of Energy Efficiency and Renewable Energy Operated by the Alliance for Sustainable Energy: Golden, CO, USA, 2010.
  18. Korea Price Information Corporation: Korea Price Information (KPI). Available online: https://www.kpi.or.kr/www/ (accessed on 10 August 2020).
  19. Department of Public Procurement Service: Public Procurement Service System. Available online: http://www.pps.go.kr/kor/index.do/ (accessed on 10 August 2020).
  20. Korea Energy Agency: High Efficiency Equipment Information System. Available online: https://eep.energy.or.kr/main/main.aspx/ (accessed on 10 August 2020).
  21. Korea Price Research Center: Korea Price research system. Available online: https://www.kprc.or.kr/ (accessed on 10 August 2020).
  22. Galatioto, A.; Ricciu, R.; Salem, T.; Kinab, E. Energy and economic analysis on retrofit actions for Italian public historic buildings. Energy 2019, 176, 58–66. [Google Scholar] [CrossRef]
  23. Hajare, A.; Elwakil, E. Integration of life cycle cost analysis and energy simulation for building energy-efficient strategies assessment. Sustain. Cities Soc. 2020, 61, 102293. [Google Scholar] [CrossRef]
  24. Nematchoua, M.K.; Orosa, J.A.; Buratti, C.; Obonyo, E.; Rim, D.; Ricciardi, P.; Reiter, S. Comparative analysis of bioclimatic zones, energy consumption, CO2 emission and life cycle cost of residential and commercial buildings located in a tropical region: A case study of the big island of Madagascar. Energy 2020, 202, 117754. [Google Scholar] [CrossRef]
  25. Moazzen, N.; Ashrafian, T.; Yilmaz, Z.; Karagülere, M.E. A multi-criteria approach to affordable energy-efficient retrofit of primary school buildings. Appl. Energy 2020, 268, 115046. [Google Scholar] [CrossRef]
  26. Zhao, S.; Feng, W.; Zhang, S.; Hou, J.; Zhou, N.; Levine, M. Energy savings and cost-benefit analysis of the new commercial building standard in China. Procedia Eng. 2015, 121, 317–324. [Google Scholar] [CrossRef]
  27. Choi, B.; Shin, J.; Lee, J.; Kim, S.; Cho, Y. Establishment of passive energy conservation measure and economic evaluation of fenestration system in nonresidential building of Korea. Int. J. Polym. Sci. 2017, 2017, 8681737. [Google Scholar] [CrossRef]
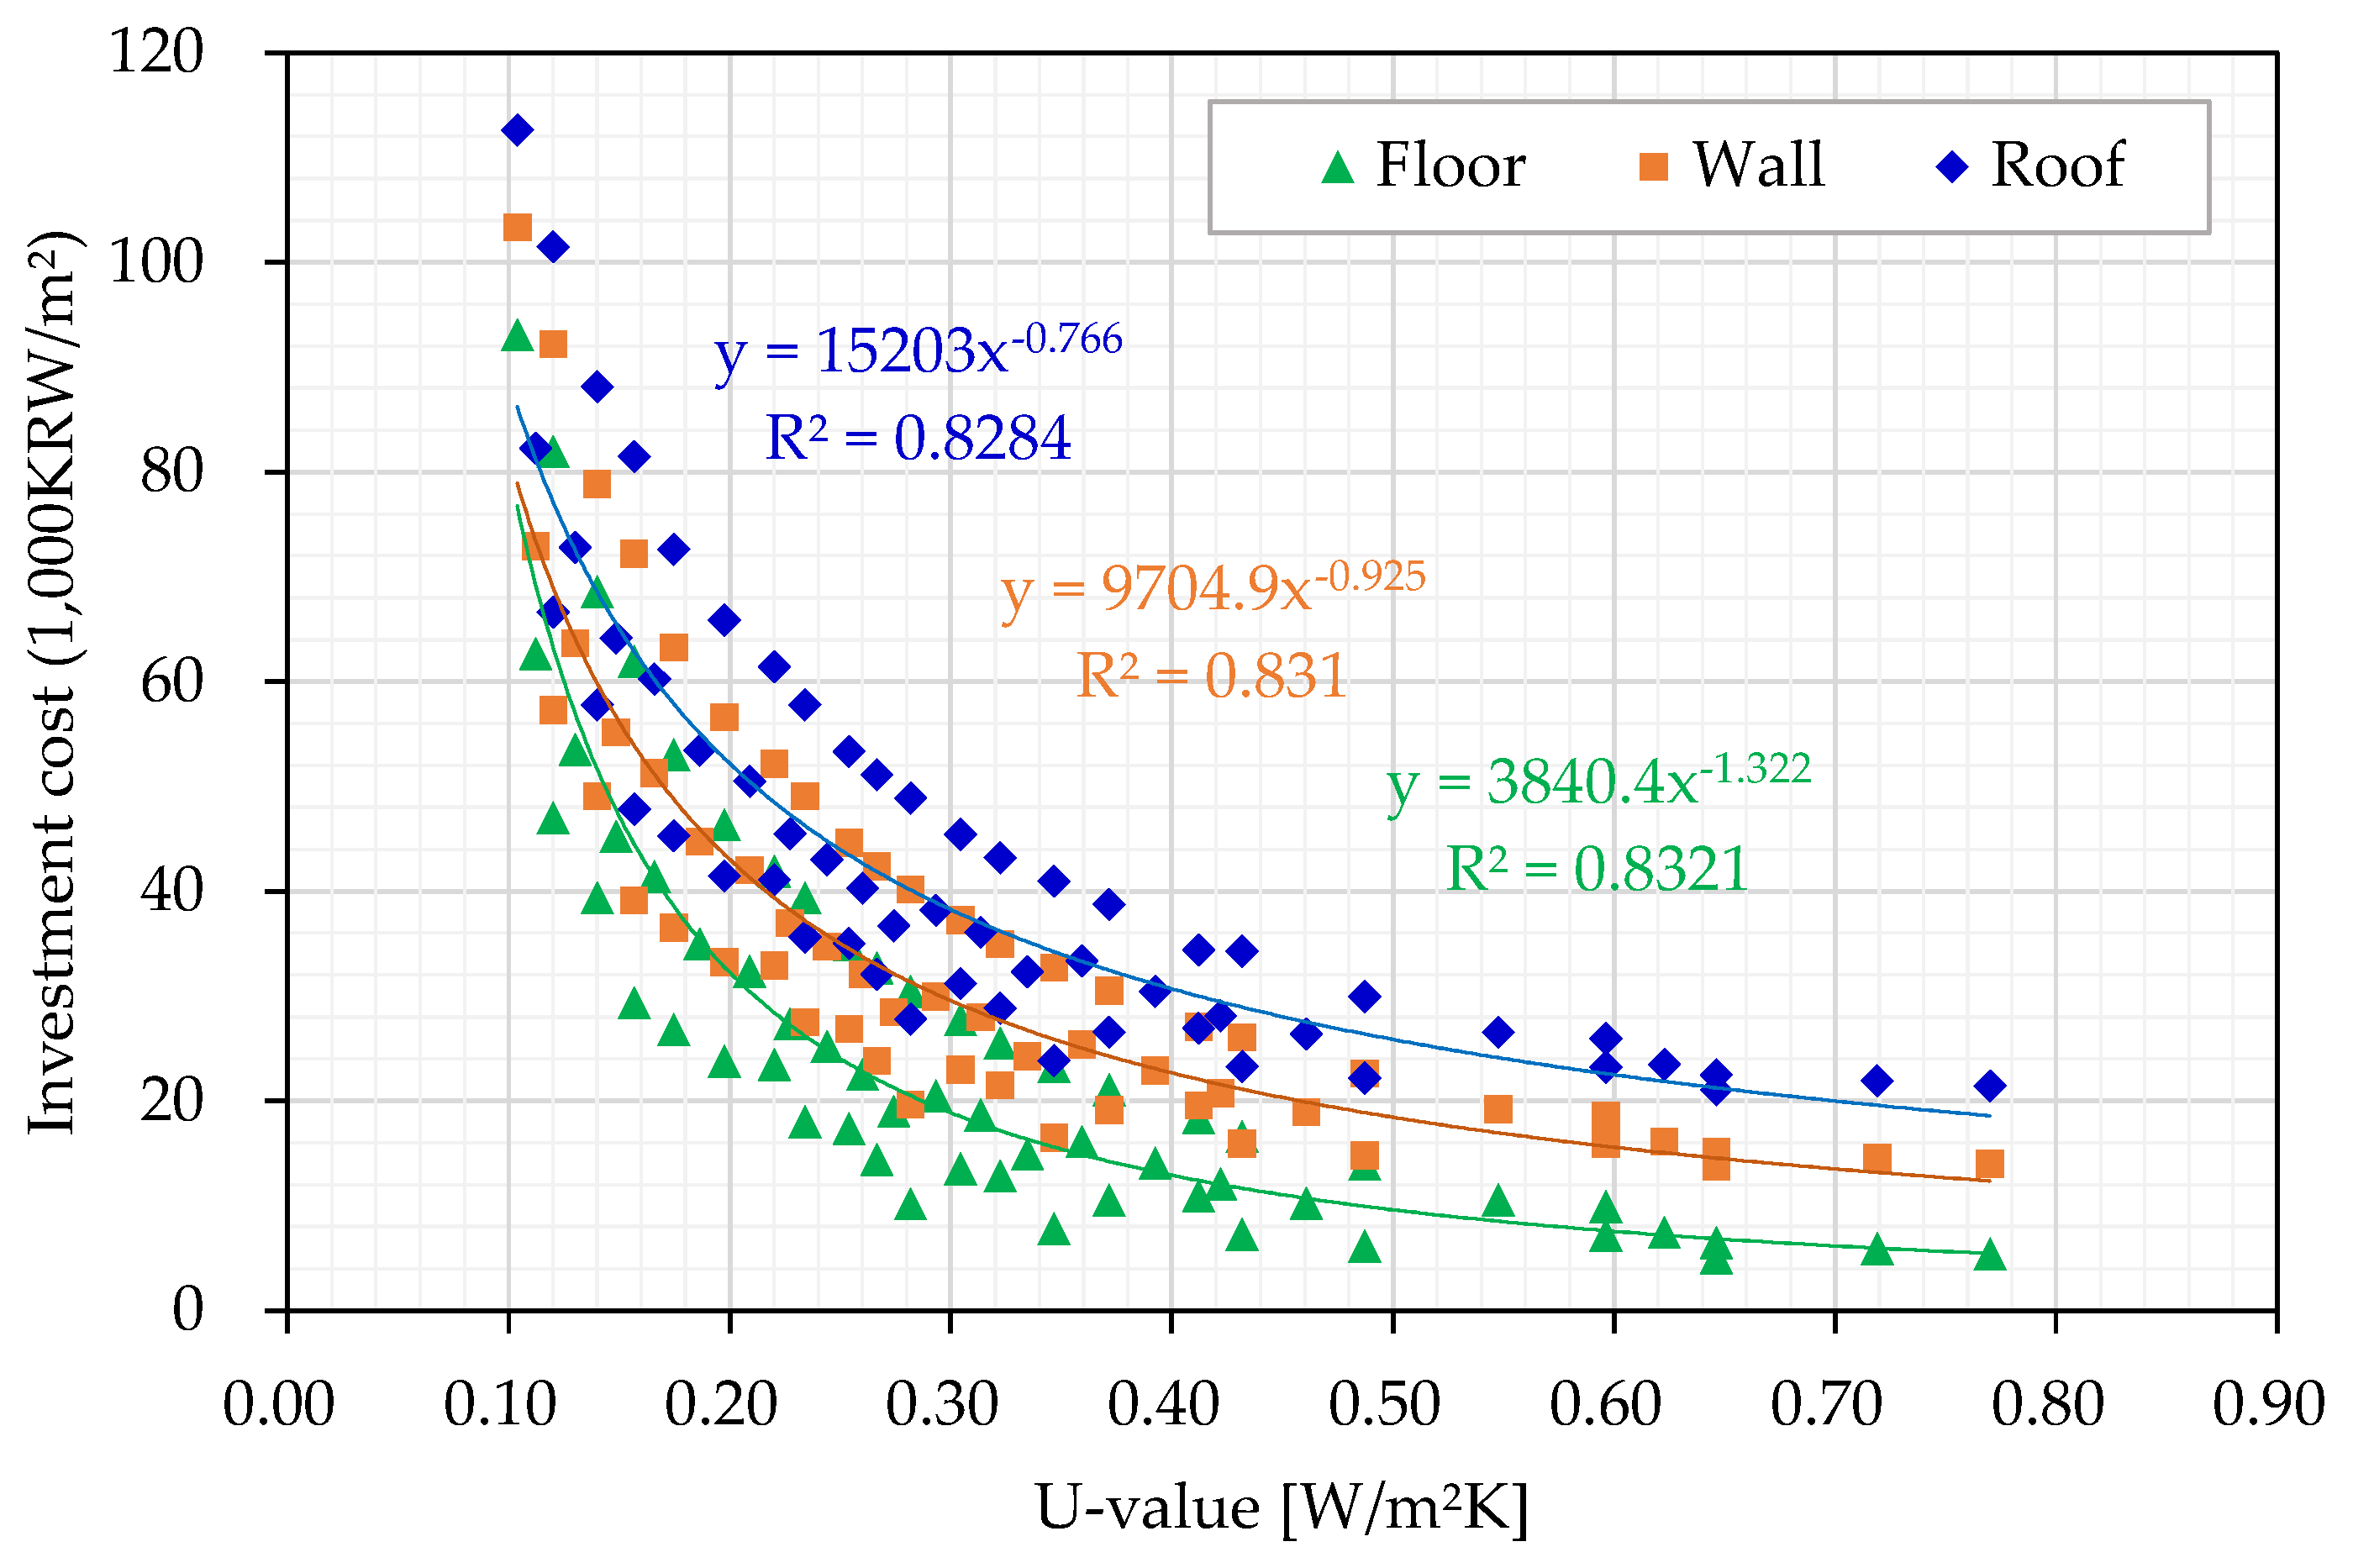
Figure 1. Relationships between the U-value and investment cost of the building envelope.
Energies 13 04955 g001
Figure 2. Relationships between the capacity by efficiency and investment cost of boiler.
Energies 13 04955 g002
Figure 3. Energy cost model based on billing data for electricity and heat energy consumption.
Energies 13 04955 g003
Figure 4. The monthly average ambient temperature of each city.
Energies 13 04955 g004
Figure 5. Trend of reduction in energy use and need with the reinforcement of the BECC in the C2 region.
Energies 13 04955 g005
Figure 6. SIR and PP of the ECMs for each reference building in C2 and S regions.
Energies 13 04955 g006
Figure 7. The SIR for A to C according to climate condition with the U-value of window in 4 regions.
Energies 13 04955 g007
Figure 8. The process for analyzing energy saving and economic efficiency for ECM combinations.
Energies 13 04955 g008
Figure 9. ESR and PP derived by the process of selecting ECM combinations.
Energies 13 04955 g009
Figure 10. ESR trend within 20 years of PP according to ECM combinations for J region as an example.
Energies 13 04955 g010
Table 1. Energy performance parameters and cost information mapping scheme.
Type of ECMMapping ParametersData Source *Collected Data
ParameterEnergyCost
Wall,
roof,
floor
InsulationU-value KPIKorea standard type
Conductivity
Density
Thickness
Investment cost KPIMaterial cost
Direct labor cost
PPSIndirect labor cost
Management allowances
WindowWindow
(glazing and frame)
U-value HEEIModel name
Frame type
Thickness
Glazing type
Glass type
Thickness of air layer
U-value
HEEI
+ BECC
SHGC
VT
Investment cost KPIMaterial cost
Direct labor cost
PPSIndirect labor cost
Management allowances
Heating, cooling systemProduction system or individual equipmentEfficiency and capacity KPI
+ KPRC
System or equipment type
Efficiency
Capacity
Investment cost KPIMaterial cost
Direct labor cost
PPSIndirect labor cost
Management allowances
lighting systemLEDLighting power density KPIPower consumption
Luminous efficiency
Investment cost KPIMaterial cost
Direct labor cost
PPSIndirect labor cost
Management allowances
Renewable energy systemPhotovoltaicPower per collecting area KPIModule type
Collecting area
Power
Investment cost KPIMaterial cost
Direct labor cost
PPSIndirect labor cost
Management allowances
* KPI: Korea Price Information Corp. PPS: Public Procurement Service. HEEI: High Efficiency Equipment Information System. KPRC: Korea Price Research Center.
Table 2. The calculation models of ECMs investment cost.
ECM CategoryPerformance GroupNo. of DataInvestment Cost Calculation Model
y (KRW)
R2
EnvelopeWall-584 y = A w ( 9704.9 × U 0.925 ) 0.83
Floor-584 y = A f ( 3840.4 × U 1.322 ) 0.83
Roof-584 y = A r ( 15,203 × U 0.766 ) 0.83
Windows-5795 y = A w i n ( 157,894 × U 0.087 ) 0.98
Heating
production
system
BoilerEfficiency
(%)
889 y = i = 1 k ( 32,187 x i + 2,000,000 ) 0.98
9174 y = i = 1 k ( 0.0022 x i 3 16.633 x i 2 + 36,132 x i + 10,000,000 ) 0.93
9812 y = i = 1 k ( 44.838 x i 2 + 105,434 x i + 20,000,000 ) 0.98
Cooling
production system
Compression chillerCOP318 y = i = 1 k ( 0.0215 z i 3 252.36 z i 2 + 77,702 z i + 30,000,000 ) 0.99
547 y = i = 1 k ( 0.2897 z i 3 147.84 z i 2 + 175,491 z i + 5,000,000 ) 1.00
623 y = i = 1 k ( 0.2593 z i 3 23.875 z i 2 122,593 z i + 200,000,000 ) 1.00
Absorption chillerCOP1.317 y = i = 1 k ( 2.167 z i 3 + 2489.5 z i 2 + 848,771 z i + 70,000,000 ) 0.99
Cooling
and/or
heating
equipment
Packaged air conditionerCOP3.712 y = 205,228 z + 1,000,000 0.98
Heat pump (gas)Heating/Cooling
COP
1.6/1.43 y = 751,505 z + 1,000,000 0.90
Heat pump (electricity)Heating/Cooling
COP
4.0/3.914 y = 674,283 z 1,000,000 0.90
4.6/4.56 y = 706,714 z + 967,209 0.90
3.3/8.016 y = 575,842 z + 8,000,000 0.90
LightingLED-35 y = 179,790 × A g f l 0.70
PVmonocrystallinekW/m20.1511 y = 150,000 × A P V + 2,000,000 1.00
Nomenclature
A w Wall area (m2) A g f Gross floor area (m2) x i Heating capacity of the i th system (kW)
A f Floor area (m2) A P V PV module area (m2) z i Cooling capacity of the i th system (kW)
A r Roof area (m2) U U-value (W/m2 K) z Total cooling capacity (kW)
A w i n Window area (m2) k Number of production systems l Lighting density (W/m2)
Table 3. Number of certified office buildings and educational and research buildings by type and size.
Building Type and SizeOffice BuildingEducational and Research Building
UniversityK-12 SchoolKindergartenR&D BuildingOthers
Small (500~3000 m2)101599524
Large (3000 m2 or larger)748913474094173
Total849963564999197
Table 4. The size distribution by building type and the selected representative values.
Reference BuildingNFeatureData DistributionMean
TypeSizeMin.25%50%75%Max.
Office buildingsmall101gross area60715982150268229992082
Number of floors1345134.4
large748gross area3002547310,95321,293199,92320,474
Number of floors1510154910.8
K-12 schoollarge347gross area3079995011,93713,64130,51711,769
Number of floors2-5-64.4
Table 5. Information on features of the selected reference buildings.
FeatureA (Small Office Building)B (large Office Building)C (K-12 School)
Floor Plan Energies 13 04955 i001 Energies 13 04955 i002 Energies 13 04955 i003
Building area483 m21049 m22967 m2
Gross floor area2257 m213,267 m211,937 m2
Number of floorsB1/5B4/10B1/5
WWR45%32%26%
Heating/CoolingEHPEHPEHP + GHP
Table 6. The summary of energy cost estimation model by fuel type.
Fuel Type N Energy Cost ModelR2Nomenclature
Electricity30,552 E C e l e c = 141.8   E e l e c + 283,608 0.97EC Annual energy cost (KRW)
Gas- E C g a s = 67.771   E g a s + 13,200 -E Annual consumption(kWh)
District heating271 E C h e a t = 92.017   E h e a t + 2,735,184 0.99 e l e c electricity
g a s gas
h e a t district heating
Table 7. Values of performance parameters according to the reinforcement of the prescriptive criteria.
CategoryPerformance ParameterP1P2P3P4P5P6P7P8P9P10
‘01-
‘08
‘08.7-
‘08.11
‘08.11-
‘10.7
‘10.11-
‘12.5
‘12.5-
‘13.8
‘13.9-
‘14.8
‘14.9-
‘15.12
‘16.1-
‘17.6
‘17.6-
‘18.8
’18.9-
current
ArchitectureWall
U-value
(W/m2 K)
Central 10.470.470.470.360.360.270.270.260.260.17
Central 20.470.470.470.360.360.270.270.260.260.24
Southern0.580.580.580.450.450.340.340.320.320.32
Jeju0.760.760.760.580.580.440.440.430.430.41
Roof
U-value
(W/m2 K)
Central 10.290.290.290.200.200.180.180.150.150.15
Central 20.290.290.290.200.200.180.180.150.150.15
Southern0.350.350.350.240.240.220.220.180.180.18
Jeju0.410.410.410.290.290.280.280.250.250.25
Floor
U-value
(W/m2 K)
Central 10.410.410.410.410.410.290.290.220.220.17
Central 20.410.410.410.410.410.290.290.220.220.20
Southern0.470.470.470.410.410.330.330.250.250.25
Jeju0.520.520.520.410.410.390.390.330.330.33
Window
U-value
(W/m2 K)
Central 13.843.403.402.402.402.102.101.501.501.30
Central 23.843.403.402.402.402.102.101.501.501.50
Southern4.193.803.802.702.702.402.401.801.801.80
Jeju5.234.404.403.403.403.003.002.402.402.20
Mechanical system Heating efficiencyEHP (COP)3344444444
GHP (COP)1.31.31.31.41.41.521.521.521.591.59
Cooling efficiencyEHP (COP)333.83.83.83.84444.2
GHP (COP)1.11.11.11.21.21.31.31.31.31.4
Heat recovery rate (%)0000707070707070
Electrical systemLighting density (W/m2)201818161210107.57.57.5
Renewable systemRenewable energy ratio to lighting capacity (%)000000006060
Table 8. Values of performance parameters for architecture ECMs.
WallFloorRoofWindow
ECM CodeU-Values
(W/m2 K)
ECM CodeU-Values
(W/m2 K)
ECM CodeU-Values
(W/m2 K)
ECM CodeU-Values
(W/m2 K)
W10.38F10.30R10.23Win12.00
W20.35F20.28R20.20Win21.70
W30.33F30.26R30.18Win31.40
W40.30F40.23R40.16Win41.35
W50.28F50.20R50.15Win51.30
W60.26F60.18R60.12Win61.15
W70.23F70.16 Win71.00
W80.20F80.15 Win80.90
W90.18F90.12 Win90.70
W100.16
W110.15
W120.12
Table 9. Values of performance parameters for mechanical, electrical, and renewable ECMs.
ECMECM CodePerformance ParameterValue
EHPEHeating efficiency/Cooling efficiency (COP)4.6/4.5
GHPGHeating efficiency/Cooling efficiency (COP)1.6/1.4
LightingLLighting density (W/m2)6.0
PVPV1Renewable energy ratio to lighting capacity (%)80
PV2Renewable energy ratio to lighting capacity (%)100
Table 10. The energy need of the reference buildings according to the reinforcement of the BECC.
Bldg.RegionEnergy Need (kWh/m2·yr)Reduction
Ratio (%)
P1P2P3P4P5P6P7P8P9P10
AC1146.7136.8136.8117.386.474.774.761.561.558.660.0
C2134.9125.5125.5110.383.873.073.061.361.361.254.7
S131.6122.8122.8108.284.674.174.163.063.063.052.2
J132.6121.9121.9108.987.977.477.466.866.866.050.2
BC1131.9123.9123.9109.877.368.368.357.557.554.558.7
C2123.0115.1115.1103.175.166.666.656.256.256.054.4
S123.1115.3115.3103.491.082.482.471.771.771.741.8
J119.8110.8110.8100.277.869.969.960.360.359.750.1
CC1142.5135.8135.8123.684.075.675.665.965.963.655.4
C2133.0126.1126.1115.582.574.574.564.964.964.751.3
S131.3124.4124.4113.683.975.975.966.366.366.349.5
J125.7118.2118.2108.182.975.375.366.466.465.947.6
Table 11. The energy use of the reference buildings according to the reinforcement of the BECC.
Bldg.RegionEnergy Use (kWh/m2·yr)Reduction
Ratio (%)
P1P2P3P4P5P6P7P8P9P10
AC1112.0104.993.583.465.957.156.847.035.633.770.0
C2104.497.187.878.862.854.454.045.033.633.168.3
S100.894.085.576.861.953.553.044.433.032.567.7
J98.590.883.275.461.953.953.445.434.033.266.4
BC1106.199.689.681.161.654.654.345.834.432.469.4
C299.092.884.676.859.152.652.143.832.431.967.8
S97.291.283.575.764.658.357.849.738.337.861.1
J92.886.079.672.757.751.450.943.432.031.366.2
CC1164.8158.0154.8138.699.388.288.278.367.964.161.1
C2151.9144.8142.2127.895.284.884.775.164.763.258.4
S147.8140.7138.4124.594.784.784.675.064.663.257.3
J137.5130.2128.3115.491.782.282.173.362.961.155.6
Table 12. The primary energy use of the reference buildings according to the reinforcement of the BECC.
Bldg.RegionPrimary Energy Use (kWh/m2·yr)Reduction
Ratio (%)
P1P2P3P4P5P6P7P8P9P10
AC1309.5289.9258.5231.0182.7158.4157.6130.899.394.069.6
C2288.5268.5242.9218.2174.1151.1149.9125.393.992.667.9
S278.8259.9236.7212.7171.7148.6147.1123.792.391.067.4
J272.5251.3230.4208.9171.9149.7148.3126.294.992.766.0
BC1293.4275.4247.8224.5170.8151.6150.8127.496.090.769.1
C2273.8256.7234.1212.7164.0146.0144.8121.990.589.167.4
S281.1263.8239.7218.0168.8150.7149.3126.495.093.366.8
J256.6238.0220.3201.4160.1142.8141.4120.989.687.765.8
CC1308.3291.6282.8255.0187.7166.0165.9143.3114.7109.864.4
C2290.2273.2266.1240.5182.2161.3161.0138.9110.3108.462.6
S284.4267.4260.9236.0181.5161.1160.7138.7110.1108.361.9
J270.3252.9247.7223.9177.4157.7157.4136.4107.7105.461.0
Table 13. SIR (kWh/1000 KRW) and PP (year) of the single ECM for each reference building in 4 regions.
ECM
Code
A (C1)A (C2)A (S)A (J)B(C1)B (C2)B (S)B (J)C(C1)C (C2)C (S)C (J)
SIRPPSIRPPSIRPPSIRPPSIRPPSIRPPSIRPPSIRPPSIRPPSIRPPSIRPPSIRPP
W1 0.08682 0.08583 0.21558
W2 0.07990 0.07891 0.19764
W3 0.07495 0.07397 0.18668
W4 0.0621130.067105 0.083850.066106 0.277450.16975
W5 0.0581220.070101 0.078910.062114 0.165780.15780
W6 0.0651080.064110 0.073970.069102 0.153850.14686
W7 0.0193630.0541300.046155 0.0213370.0641090.059119 0.0512520.0881940.12998
W8 0.0342090.0461550.040175 0.0361940.0561250.050140 0.0931360.0861790.097140
W9 0.0342060.0401740.037193 0.0371910.0511390.045157 0.0931370.0821830.088153
W100.0411720.0322170.0361980.0332150.0431640.0352010.0451550.0401780.1091150.0871460.0751940.079169
W110.0381830.0312260.0332120.0312280.0401750.0342100.0431650.0342100.1021220.0841530.0722020.075179
W120.0312280.0262690.0233110.0252820.0322170.0282490.0342050.0272620.0821520.0701830.0602390.061220
R1 0.061115 0.07199 0.105108
R2 0.054131 0.063112 0.093123
R3 0.049143 0.058123 0.085135
R4 0.0371900.044159 0.0551290.052136 0.0721650.076149
R5 0.0352020.042168 0.0521370.049144 0.0681750.072158
R60.0481470.0342100.0292450.0562040.0591200.0421680.0421660.0651750.0861400.0602020.0562130.096192
F1 0.070101 0.060118 0.14391
F2 0.064109 0.055129 0.13298
F3 0.059119 0.050141 0.121107
F4 0.0471510.051138 0.0571240.043163 0.1091210.105124
F5 0.0401780.043164 0.0481460.037193 0.0921430.088147
F6 0.0411730.0352020.038186 0.0381840.0431650.032219 0.0851530.0811620.078167
F70.0451570.0351990.0302330.0332150.0411720.0332110.0371900.0282530.0951330.0741760.0711870.068193
F80.0421690.0332150.0282520.0302320.0381850.0312280.0342060.0262740.0881430.0691900.0652020.063208
F90.0322210.0252810.0272570.0233050.0292410.0242980.0262690.0203600.0681860.0532480.0502640.048274
Win1 0.7729 0.70510 1.7078
Win2 0.76490.57412 1.06470.63011 2.00971.24812
Win3 0.80290.513140.50114 1.00070.95270.47915 2.33351.356111.17712
Win4 0.77990.495140.48115 0.97570.94370.46615 2.24061.368111.15812
Win5 0.75790.477150.46215 0.95070.92280.45316 2.16861.370111.13712
Win61.01670.720100.426170.410171.23060.87580.85980.414172.83541.98971.335111.06913
Win70.92280.640110.419170.357201.12760.79890.722100.378192.61951.82471.265110.99314
Win80.88180.540130.352200.362201.05770.78390.686100.350202.28661.71481.206120.94015
Win90.725100.462150.270260.289240.91680.668110.608120.226312.04461.48991.069130.82517
E0.538130.473150.417170.439160.294240.259270.400180.223320.490230.407270.369280.31932
G 0.630190.434270.328360.25148
L0.689100.692100.716100.731100.673110.71710 0.712100.71710 0.607100.75490.75290.7449
PV11.52651.52251.52341.52055.72855.68755.74045.69459.986310.05739.99139.9144
PV21.52651.52251.52541.52055.70755.70855.71845.69458.91548.95048.91748.8794
Table 14. The selected ECMs for each reference building and region.
Bldg.RegionWin1Win2Win3Win4Win5Win6Win7Win8Win9ELPV1PV2
AC1
C2
S
J
BC1
C2
S
J
CC1
C2
S
J
Table 15. Minimum and maximum values of energy use, ESR, and PP according to ECM combinations.
Bldg.RegionNumber of ECM Combination CasesEnergy Use
(kWh/m2)
ESR (%)PP (Year)
TotalSelectedMin.Max.Min.Max.Min.Max.
AC1593731.9227.545.318.3519
C2954631.3927.345.217.4519
S292130.6226.725.817.8412
J352831.5127.325.117.7418
BC1292130.5226.755.817.4511
C2473330.0426.175.818.0511
S294535.7729.205.422.7510
J292129.4625.665.918.0410
CC1291360.0256.156.412.449
C2472359.8154.705.413.4314
S532859.8954.735.213.4413
J594058.0052.795.113.6311
Table 16. Recommended ECM combinations according to the reinforcement scenarios of the BECC.
Bldg.RegionScenarioESR
(%)
PP
(Years)
Recommended ECMs
Improve Window
U-Value
Improve EHP EfficiencyReduce Lighting DensityProduce 80%
of the Lighting Load by PV
Produce 100% of the Lighting Load by PV
AC115~105~7
210~155~8
315~8~10
C215~104~9
210~154~7
315~6~10
S15~104~6
210~154~6
315~7
J15~104~8
210~154~6
315~6~9
BC115~104~6
210~154~6
315~7~9
C215~104~6
210~154~6
315~6~9
S15~105~9
210~155~8
315~205~8
420~255~7
J15~103~6
210~154~6
315~6~8
CC115~104~5
210~154~6
C215~83~4
28~154~6
S15~84~6
28~124~5
312~6
J15~83~6
28~123~5
312~156