Abstract
Previous research identified that battery temperature control is critical to the safety, lifetime, and performance of electric vehicles. In this paper, the liquid-based battery temperature control of electric buses is investigated subject to heat transfer behavior and control strategy. Therefore, a new transient calculation method is proposed to simulate the thermal behavior of a coolant-cooled battery system. The method is based on the system identification technique and combines the advantage of low computational effort and high accuracy. In detail, four transfer functions are extracted by a thermo-hydraulic 3D simulation model comprising 12 prismatic lithium nickel manganese cobalt oxide (NMC) cells, housing, arrestors, and a cooling plate. The transfer functions describe the relationship between heat generation, cell temperature, and coolant temperature. A vehicle model calculates the power consumption of an electric bus and thus provides the input for the transient calculation. Furthermore, a cell temperature control strategy is developed with respect to the constraints of a refrigerant-based battery cooling unit. The data obtained from the simulation demonstrate the high thermal inertia of the system and suggest sufficient control of the battery temperature using a quasi-stationary cooling strategy. Thereby, the study reveals a crucial design input for battery cooling systems in terms of heat transfer behavior and control strategy.
1. Introduction
Emission emitting and the ensuing global warming is one of the main challenges of the 21st century [1]. The emissions of the transport sector are among the fastest growing and are responsible for 25.5% of global CO2 emissions in 2016 [2]. Therefore, the decarbonization of transport is one major challenge to obtaining environmental sustainability. In this context, the electrification of road transport and a shift toward public transport is a promising measure [3]. In line with this, the electrification of public transport buses is the focus of many projects worldwide [4] and has already been successfully tested in several international initiatives [5]. Many scientists point out the advantage of electric buses in terms of CO2 and particulate matter emissions [6]. For instance, Zhou et al. [7] examine the real performance of battery electric buses in Macao (China) and found that from a life cycle perspective, an electric bus has 20–35% less CO2 emissions compared to diesel buses. However, the limited energy capacity of batteries compared to conventional fuel is still challenging, making lithium-ion batteries a key technology. In addition, the operating battery temperature has a high impact on the performance, lifetime, and safety of the battery cells. Hence, a battery thermal management system (BTMS) is required to control the temperature within the favorable range of 15–35 °C [8,9]. Several BTMS are discussed in the literature and recently reviewed by Kim et al. [10] and Lu et al. [11]. In terms of liquid-based battery thermal management, Wu et al. [12] provides an overview of design studies and challenges.
An interesting research scope in this direction is the transient battery thermal behavior and the proper thermal management control subject to cell temperature requirements, energy efficiency, constraints to mechanical limitations, and feasibility in real-time applications. In this regard, modeling is an important tool. Based on the general energy balance of a battery by Bernardi et al. [13] in 1984, various types of battery models have been presented [12,14]. Electrochemical models and electrical equivalent circuit models are successfully applied to describe internal resistance, but the temperature distribution and anisotropic material of the cells are neglected [12]. On the other hand, thermal models are provided in the literature in variations of 1D, 2D, and 3D with deficiencies regarding internal resistance calculation [12]. Coupled electro-thermal simulations have been introduced with high accuracy in terms of thermal and electrical predictions but are associated with high simulation times and extensive simulation input requirements [15]. For transient simulation, i.e., of driving profiles, lumped or simplified models are generally used to reduce the computational effort involved. In addition to these models, a rapid and precise transient calculation approach is based on the system identification technique, which calculates the battery temperature by convolution [16].
However, different model approaches have been applied for the transient thermal simulation of battery systems. Che Daud et al. [17] used a lumped 1D model to estimate the temperature in dependence of the New European Driving Cycle (NEDC) and Artemis driving cycle. As a drawback, the dynamics are reproduced insufficiently i.e., the cell temperature fluctuations of the measurements are not predicted properly by the simulation. Worwood et al. [18] investigated the thermal behavior of cylindrical LiCoO2/graphite cells by means of a 2D model. An experimental model validation is carried out and demonstrates an error of 2% and 5% for a test driving cycle and a constant 1 C discharging rate, respectively. In addition, the cell heat generation for the US06 driving cycle and the resulting cell temperature for different cooling applications (radial air cooling, liquid tab cooling, and heat pipe) are presented. The results reveal strong cell temperature fluctuation (caused by the driving profile) for a hybrid vehicle (up to 1 K/min), while moderate fluctuations are simulated for an electric vehicle (about 0.1 K/min). Coupled electro-thermal model simulations were conducted for transient automotive application by Tourani et al. [19] and Hosseinzadeh et al. [20]. Using a 1D thermo-electro-chemical model coupled with a 2D thermo-electro model, Tourani et al. analyzed the thermal behavior of lithium manganese oxide (LMO) pouch cells. Hosseinzadeh et al. applied a 1D thermo-electro-chemical model to simulate NMC battery cells for different charging and discharging conditions as well as for two driving profiles. Additionally, a 3D thermal model is combined to capture the temperature distribution at the cell scale. The models of Tourani et al. and Hosseinzadeh et al. are validated by measurements. The results indicate the high impact of ambient temperature and no discernible cell temperature fluctuations due to the driving profile, respectively. Hu et al. [16] examined the transient thermal behavior of a battery by means of the system identification technique. The research demonstrates high precision, but it is limited to one arbitrary current profile. Xiao et al. [15] analyzed the surface temperature of LiFePO4 cells using the thermal impulse response technique with an accuracy of 2% against measurements. In a further paper, Torregrossa and Xiao et al. [21] used four transfer functions to capture different charging rates. Based on this, the battery surface temperature profiles are presented for an input of an electric vehicles reference driving cycle.
Investigations into the thermal behavior of batteries of electric buses in relation to driving cycles have been published by Lajunen et al. [22], Wu et al. [23], and Angermeier et al. [24]. Lajunen et al. used the software AMEsim [25] to calculate the thermal energy losses of the powertrain in relation to three standardized driving profiles and one measured driving profile. Thereby, the analysis clarifies that speed is more important for the battery heat production than aggressive driving. Wu et al. investigated the thermal behavior of batteries in relation to three driving cycles in china taking a validated lumped thermal model into account. Angermeier et al. predicted the thermal propagation of battery coolant temperature for the Standardized On-Road Test Cycle 2 (SORT2) based on the impulse response technique introduced by Hu et al. [16].
In addition to studies on the thermal behavior of battery cells in transient applications, there are efforts to achieve a suitable control strategy for battery temperature regulation. Tao et al. [26] and Gao et al. [27] controlled the cell temperature by air cooling in an automotive application. Tao et al. investigated the behavior and controllability of cylindrical battery cells for an aggressive urban driving cycle by a lumped, thermal model. Thereby, a predictive controller adjusts the air temperature with the AC compressor as an actuator. The results indicate a minor deviation of the cell core temperature from the target temperature, which was achieved by strong fluctuations of the controlled air temperature. Based on a reduced order model, which is validated by computational fluid dynamic (CFD) simulations, Gao et al. used fuzzy logic to control the temperature of cylindrical battery cells regulating the air flow velocity. For the US06 transient driving profile, a deviation to the target temperature of ±0.2 K for the battery cells is achieved.
However, most of the literature in this field focuses on the thermal behavior of batteries [15,16,17,18,19,20,21,22,23], and the few studies on thermal control are limited to air-cooling applications [26,27]. To the authors’ knowledge, the dynamics of a battery system including a closed, liquid-based thermal control loop subject to energy efficiency, the mechanical limitations of the cooling unit, and feasibility has not yet been published. Furthermore, only a few researchers have addressed the issue of the battery thermal control of electric buses [22,23,24].
The main contributions of the present paper are the introduction of a novel method for the fast and accurate calculation of the heat transfer in liquid-cooled battery systems and the proposal of a battery temperature control strategy for electric buses. Therefore, a thermo-hydraulic 3D simulation model comprising 12 prismatic NMC cells, housing, arrestors, and a cooling plate was set up in Comsol Multiphysics 5.4 (Comsol AB, Stockholm, Sweden) and employed to extract four transfer functions with respect to the system identification technique. The transfer functions describe the interaction between heat generation, cell temperature, and coolant temperature. Based on the transfer functions, a calculation method was developed to compute the transient thermal behavior of a coolant-cooled battery system of 1800 battery cells. Thereby, the current profile of the battery is calculated by a vehicle model of a 12 m electric bus. The simulations are carried out for three different driving profiles and charging rates of 0.5 C and 1 C. In addition, a simple battery cell temperature control strategy is designed with respect to the constraints of a refrigerant-based battery cooling unit.
The present study is organized as follows. Section 2 addresses the methodology for the calculation of the transient thermal behavior of the battery system. In this regard, the driving cycles, the bus vehicle model, the 3D thermo-hydraulic simulation model, and the transient calculation method are introduced. In Section 3, the results and discussion are provided. The first part of this section covers the analysis of the transfer function characteristics and a validation of the transient calculation method. Secondly, the thermal behavior of the battery system for real and standardized applications is discussed. Finally, Section 4 provides a summary of the main results and gives some conclusions.
2. Methodology
2.1. Driving Profile
The Standardized On-Road Test Cycle 2 (SORT2) proposed by UITP [28] and two real driving cycles (bus line 92 and 84) [29] of Stuttgart (Germany) are used to investigate the thermal behavior of the bus battery system. The SORT2 and bus line 92 are urban driving cycles, whereas bus line 84 is a suburban cycle. The velocity profiles of the three bus driving cycles are highlighted in Figure 1, Figure 2 and Figure 3. The main characteristics are summarized in Table 1. The geographical itineraries of bus line 92 and 84 are captured in Appendix A.

Figure 1.
Velocity profile for repeated sequence of Standardized On-Road Test Cycle 2 (SORT2).
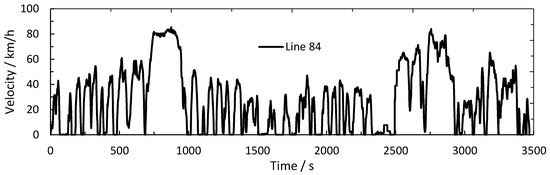
Figure 2.
Velocity profile of bus line 84 in Stuttgart, Germany.
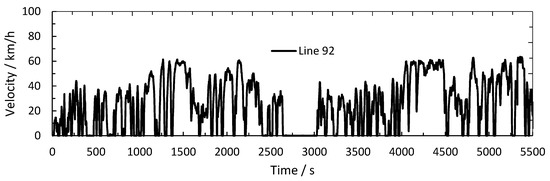
Figure 3.
Velocity profile of bus line 92 in Stuttgart, Germany.

Table 1.
Characteristics of the suburban cycles SORT2 and bus line 84 and the urban bus line 92. The average total speed includes the bus stops.
2.2. Vehicle Model
In order to predict the current profile of the battery cells, the total motor power demand
is calculated by the integral of the total forces
where , , , , , , , , and are the rolling resistance coefficient, vehicle weight, acceleration of gravity, scope, cross-section area, drag coefficient, air density, and vehicle acceleration. The vehicle specifications are based on a 12 m battery electric bus with a total mass of 20,000 kg. Further vehicle specifications are listed in Table 2.
Table 2.
Technical specifications of the electric bus and the battery system.
Considering constant energy consumption of the auxiliaries () (HVAC included), the battery power
is defined, where , , , and are the efficiency of the electric motor, gear, power electronics, and battery with constant values of 90% [32,33], 96% [23,32], 95% [23,34], and 95% [32], respectively. In addition, a constant recuperation rate of 40% is assumed with respect to Hu et al. [36].
The battery system design is inspired by the system of the company Akasol GmbH (OEM 37 PRC) and accordingly consists of 150 battery modules with 12 cells each. Thereby, 15 modules are connected in series and 10 are connected in parallel, which at a nominal battery cell voltage of 3.7 V and a capacity of 37 Ah results in a system capacity and a system voltage of 250 kWh and 666 V.
The current of a 12-cell module
is described as a function of the driving profile, where is the current and is the nominal voltage of 44.4 V. Consequently, the current profile of the electric bus system can be calculated in dependence of the driving profiles in Section 2.1.
2.3. 3D Thermo-Hydraulic Simulation Model
The main idea of the transient thermal simulation method of this paper is the incorporation of transfer functions to describe the entire heat transfer behavior of a battery system. Initially, the thermal behavior of the battery system must be simulated to define the transfer functions. Therefore, a 3D thermo-hydraulic simulation model is implemented in Comsol Multiphysics 5.4 comprising twelve battery cells, arresters, housing, and cooling plate (Figure 4).
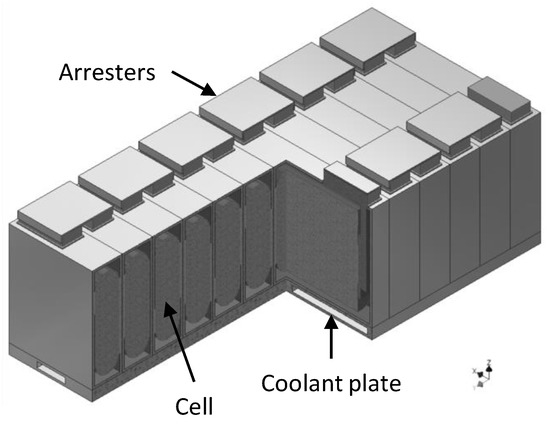
Figure 4.
Overview of the battery module geometry. Shown are 12 prismatic cells covered in hard cases, arresters, and the coolant plate (modified from Angermeier et al. [24]).
The prismatic cell design is expired by DIN 91252, and the material values of the cells are based on literature values for nickel manganese cobalt oxide (NMC) battery cells. The used material values are listed in Table 3. The material of the anode is copper, while the cathode and the hard case are made of aluminum. A thermal contact resistance is implemented between the cells and between the cells and cooling plate by 2 × 10⁻⁵ m2K/W [37] and 7.5 × 10⁻⁴ m2K/W [29], respectively. Information about the mesh quality is given in Appendix B, and some results of the 3D simulations are provided in Appendix C.
Table 3.
Battery cell material values according to Loges et al. [38], Richter et al. [39], and Viswanathan et al. [40].
The electrochemical properties are assumed to be homogeneous and isotropic, and the convective heat transfer inside of the cells is neglected. The internal energy conservation of every cell of the simulation mesh is calculated by Equation (5)
where , , , , and represent the mean density, specific heat capacity, temperature, time, specific heat production, and specific heat transfer to the coolant, while , , and are thermal conductivity in the direction of , , and , respectively. Moreover, the heat production () is assumed to be homogeneous inside the cells and is defined according to Bernardi et al. [13]
where and are the current and open-circuit voltage. The mixing and the reaction enthalpy are not addressed, and the entropy coefficient is assumed to be constant. To capture a “worst case” scenario for the examined cooling application, the internal resistance is assumed to be a relatively high value of 4 mΩ [39]. In addition to the cell heat production, ohmic losses are considered inside the arresters.
The cooling plate is designed as a u-profile with pin fins for higher heat transfer. The fluid dynamics are simulated with the k-ω-SST-Low-Re Model. The applied coolant is a water/glycol mixture (50/50 mass-%). The mass flow remains constant (0.05 kg/s) and thus calculated once, the flow field can be replaced by the mean heat transfer coefficient (MHTC). The MHTC between fluid and solid is constant for a stationary flow field and minor temperature-related material specification changes. For heat exchangers, MHTC is generally defined as
where is the logarithmic mean temperature, is the heat flux, and is the area of the heat transfer.
2.4. Transient Calculation
The investigation into transient thermal behavior using the 3D battery model of Section 2.1 has an unreasonable computational cost. Therefore, the system identification technique is taken into account to calculate the thermal behavior in dependence of driving cycles. The methodology is introduced in the following.
2.4.1. System Identification
Based on the linear system theory, the thermal behavior of the battery model in Section 2.1 can be described by transfer functions with respect to given inputs and resulting outputs. The requirement of a linear and time-invariant (LTI) system is respected due to the constant flow rate, constant specific heat capacity, constant density, constant heat transfer, and linear boundary conditions [41]. For a fast calculation of a transient input, the superposition principle in Laplace domain
is employed, where , , and are the output, input, and transfer function. In the present paper, the thermal behavior of the battery system is investigated on the basis of four transfer functions. The first transfer function
defines the coolant outlet temperature as a function of the heat production . Thereby, the operator indicates the Laplace transformation. The relation between heat production and mean cell temperature is described by the second transfer function
The third transfer function
expresses the effect of the coolant inlet temperature to the mean cell temperature of the module. The coolant outlet temperature as a function of the coolant inlet temperature is defined by the fourth transfer function
Evidently, the battery cell temperature and the coolant outlet temperature are determined by the inputs of coolant inlet temperature and heat production. According to the total differential
the combined output can be calculated. Considering constant material values of the battery module, the coolant material, and the volume flow, the gradients and are constant, and the cell temperature
and the coolant outlet temperature
are defined with respect to Equations (8) and (13). One advantage of defining the generated heat as an input variable for the transfer functions is that in contrast to the approach of Torregrossa and Xiao et al. [21], different charging rates can be represented. In addition, the transfer functions describe the thermal transfer behavior; thus, simplifications regarding the heat generation model do not affect the accuracy of the transfer functions.
However, the knowledge of the transfer functions is required and can be extracted from 3D simulations for a defined input. In this regard, two different input signals are considered: the sine sweep (chip signal) is used to define the full range of frequencies and the step response to determine the correct magnitude at low frequencies [42,43]. In a second step, the system identification toolbox of Matlab R2020a (MathWorks Inc., Natick, MA, USA) computes the transfer function according to the method of least squares to fit the transfer function to a fourth-order lag element.
2.4.2. System Simulation and Control
A system simulation including a vehicle model, battery thermal behavior, and thermal management system is performed in Matlab Simulink. Thereby, the battery thermal behavior is described by the four transfer functions. Therefore, the 3D model is not implemented in Matlab Simulink. Figure 5 provides an overview of the calculation procedure. Starting with a driving profile and the vehicle model of Section 2.2, the heat production of the cells is calculated as a function of the current. Thereby, the temperature of the reversible heat production part is assumed to be constant (T = 300 K) as a necessary condition for an efficient transient calculation. Based on Equation (14), the mean cell temperature of every module is predicted by the second and third transfer function and the input of the heat production and coolant inlet temperature, respectively.
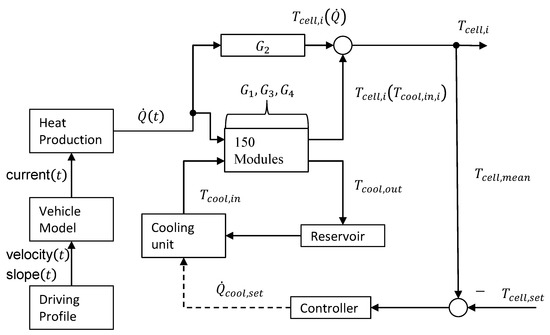
Figure 5.
Calculation procedure for the battery system including a liquid-based thermal control loop. The driving profile and vehicle model determine the heat production. Transfer functions define the cell and coolant temperature. The coolant circulates between the battery, reservoir, and cooling unit. A controller closes the control loop considering the set and mean cell temperature.
On the left side of Figure 6, the coolant connection of the modules for the first of fifteen rows is illustrated. Consequently, 10 modules are in series and 15 are in parallel connection. The total coolant flow is 2700 L/h for the system and 180 L/h per module. According to Equation (15), the coolant outlet temperature of one module is calculated in dependence of heat production and coolant inlet temperature. The relationship is clarified on the right side of Figure 6. In this case, the coolant outlet temperature of module is the inlet temperature of module . A time delay is implemented within the module to describe the time of the fluid to flow through a module.
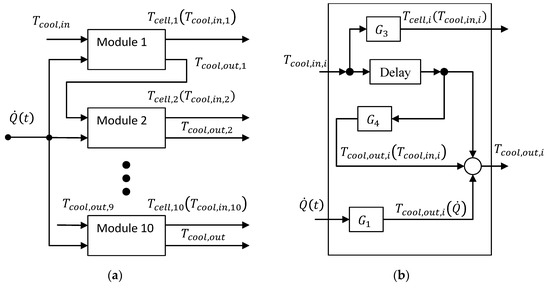
Figure 6.
(a) Overview of the serial coolant flow connection of the battery modules. Inputs are heat production and coolant inlet temperature. Outputs are coolant outlet temperature and cell temperature due to the coolant inlet temperature. (b) Overview of the calculation procedure for one module. Coolant outlet temperature is defined by the coolant inlet temperature and in conjunction with heat production and . The cell temperature as a function of coolant inlet is defined by .
Behind the 150 modules, a reservoir (60 L) with a heat capacity is defined. To close the control loop, a proportional controller regulates the average cell temperature by adjusting the refrigerant capacity of the cooling unit. In this context, some constrains are implemented to reflect the specification of a battery cooling unit of the Mahle GmbH [44]. In detail, the cooling unit works as an air-cooled vapor compression system and consists of a refrigerant-coolant evaporator (chiller), an electric scroll compressor, an air-refrigerant condenser, an axial condenser fan, and a thermostatic expansion valve (TXV). Accordingly, the refrigeration capacity is adjustable between 4 and 6 kW in steps of 0.5 kW. Furthermore, a minimum of operation time and a switch-off time of 5 min is defined. A functionality to heat the battery is not implemented. Generally, the control strategy aims to regulate the battery cell temperature within a small range and secondly, to avoid the high frequency of on–off switching due to the live time of the compressor of the battery cooling unit.
3. Results and Discussion
3.1. Transfer Function
3.1.1. Investigation of the Transfer Functions
Four transfer functions are defined to describe the thermal behavior of the battery model. The transfer functions can be analyzed with respect to the Bode magnitude plot of the corresponding frequency responses in Figure 7. The decisive area for the driving profiles under consideration (compare Section 2.1) is between and Hz.
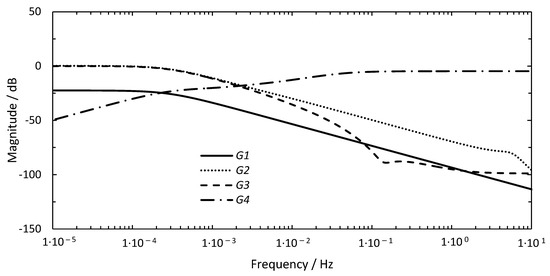
Figure 7.
Bode magnitude plot for the four transfer functions to . Damped dynamics of the heat transfer system for higher frequencies can be observed.
The transformation of the dB scale is given by Equation (16)
Accordingly, at low frequency, the first transfer function causes a coolant outlet temperature change of 0.075 K for an input of 1 W heat generation. However, as the frequency of heat input increases, the resulting change in coolant outlet temperature decreases. For instance, at a frequency of Hz, the coolant outlet temperature only changes by 0.003 K. A similar behavior can be observed for the second and third transfer function. Both have a transformation ratio of 1:1 at low frequency. Owing to this, a heat generation input of 1 W leads to a cell temperature increase of 1 K (), and logically, a 1° K increase in coolant inlet temperature raises the cell temperature by 1 K (). In contrast, the magnitude of the fourth transfer function surges for higher frequency. The described characteristics of the four transfer functions (Figure 7) are not particularly surprising, since the first three transfer functions – define the heat transfer within the cells or between the cells and coolant, while the fourth transfer function expresses the coolant outlet temperature as a function of the coolant inlet temperature. In fact, the thermal wave fundamentals state that the thermal wave amplitude decreases with higher frequency [45], and thus the magnitude of the heat transfer decreases as well. Consequently, the magnitude of the first three transfer functions grows with increasing heat transfer, while the magnitude of the fourth decreases. However, bearing in mind the relevant frequency range for electric buses ( to Hz), the results indicate a strongly dumped dynamic and thus a high inertia of the heat transfer behavior of the system.
The exact values depend on the specifications of the battery model and are therefore only valid for the model under consideration. Nevertheless, the principle understanding of dynamics may be generalized to other liquid-cooled battery systems.
3.1.2. Transient Validation
To demonstrate feasibility of the method introduced in Section 2.4, a validation is carried out by numerical 3D simulations. Therefore, the current profile of the SORT2 driving cycle and a varying coolant inlet temperature are the input for the calculation of the coolant outlet temperature and the cell temperature via transfer function and numerical simulation, respectively. The results are illustrated in Figure 8.
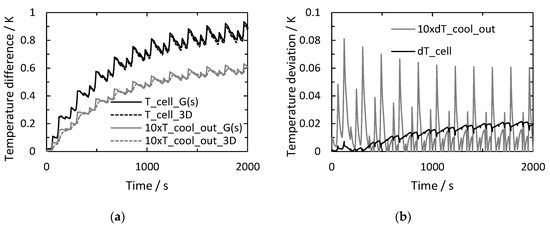
Figure 8.
Trajectory of cell and coolant outlet temperature for 3D and transfer function calculation. Input is the SORT2 driving cycle. Coolant temperature is shown for ten modules in a row (a). Temperature deviation between 3D and transfer function calculation (b). The temperature difference refers to the initial conditions.
The temperature curve of the cells calculated by transfer functions covers the dynamics of the numerical results, and after 2000 s, there is a maximum deviation of 0.02 K. The coolant outlet temperature in Figure 8 represents the propagation for ten battery modules, and a maximal deviation of 0.08 K is achieved. Despite the assumption of constant temperature of the reversible heat production (Equation (6)), the results indicate the high accuracy of the calculation via transfer functions. Evidently, the validation confirms the functionality of the method to predict the heat transfer of the system. However, the method can only represent reality as precisely as the system from which the transfer functions are extracted. Therefore, the exact values from this analysis should be treated with caution regarding the simplifications and characteristics of the 3D simulation model. Nevertheless, the proposed method provides a fast and accurate calculation procedure, as the simplifications of the 3D model influence the input of the method, but not its functionality. This is especially important to emphasize, because the transfer functions (input) can also be obtained from experiments [15] or other simulations, as long as the conditions of a linear and time-invariant system are respected.
3.2. Driving Cycle Study
3.2.1. Current Profile
The current profiles per cell for three driving cycles are calculated according to the vehicle model of Section 2.1 and shown in Figure 9, Figure 10 and Figure 11. The lowest current rates are quantified for the urban SORT2 driving cycle, whereas the suburban bus line 84 has the highest rates. With respect to the cell capacity of 37 Ah, discharging rates up to 3 C are reached and thus comparable to the simulation results of Wu et al. [23]. However, the mean C-rate of SORT2, line 92, and line 84 are 0.23, 0.27, and 0.32, respectively. The specific energy consumption is between 1.9 and 2.3 kWh/km and hence within the range for electric buses [33,35].
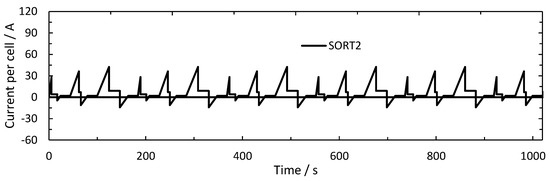
Figure 9.
Current profile for repeated sequences of Standardized On-Road Test Cycle 2 (SORT2).
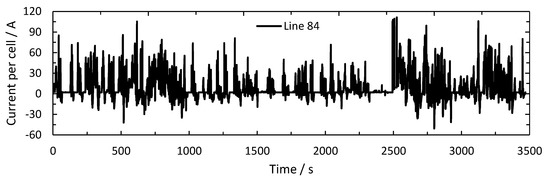
Figure 10.
Current profile of the suburban line 84 in Stuttgart, Germany.
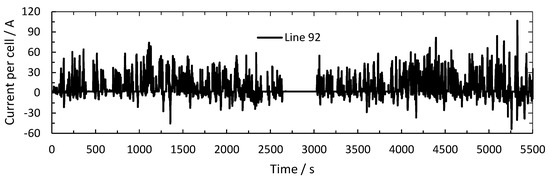
Figure 11.
Current profile of the urban line 92 in Stuttgart, Germany.
3.2.2. Thermal Behavior
In this section, the thermal behavior of the battery system is simulated with respect to the method introduced in Section 2.4. Thereby, two cases are considered:
- The battery cell temperature is controlled according to the control strategy and restrictions of the battery cooling unit described in Section 2.4.2 (with cooling).
- The coolant is circulated but not cooled (without cooling).
The coolant temperature, the coolant capacity, and the controlled and uncontrolled mean battery cell temperature of the fifth module (compare Figure 6) are analyzed for two constant charging rates of 0.5 C and 1 C and for the three aforementioned current profiles. The results for a charging rate of 0.5 C (125 kW) are visualized in Figure 12. Without cooling, the cell temperature increases by 18 K before the system is completely charged. The recommended temperature limit of 35 °C is already exceeded after 3800 s when the initial temperature is assumed to be 25 °C. For the cooling case, the refrigerant capacity and the referring coolant temperature are regulated by the battery cooling unit. The simulation indicates that after a short start-up period, a refrigerant capacity of 4 kW is sufficient to adjust the battery cell temperature. A constant deviation of the cell temperature of circa 1 K results from the proportional controller and the restriction of the battery cooling unit (compare to Section 2.4.2).
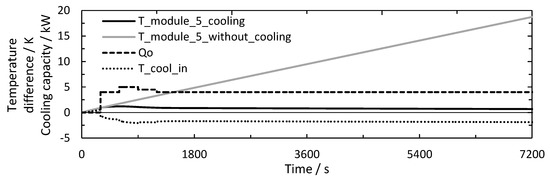
Figure 12.
Coolant temperature, coolant capacity, and controlled and uncontrolled mean battery cell temperature of module 5 for a charging rate of 0.5 C. The temperature difference refers to the initial conditions.
Figure 13 shows the simulation results for a charging rate of 1 C (250 kW). For the case without cooling, the battery cell temperature increases up to 20 K within 2200 s, whereas a cooling capacity of 6 kW reduces the temperature rise to 20 K after it is fully charged. The coolant is also heated up considerably in both cases and thus reduces the cell temperature rise. However, the results clarify that a 6 kW cooling capacity is not sufficient for a 1 C charging rate, and hence, lower C-rates are recommended for the system under consideration.
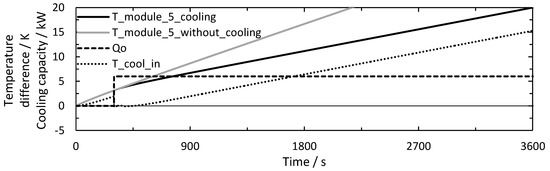
Figure 13.
Coolant temperature, coolant capacity, and controlled and uncontrolled mean battery cell temperature of module 5 for a charging rate of 1 C. The temperature difference refers to the initial conditions.
Figure 14 highlights the simulation outcome for fifteen repeated sequences of the SORT2 driving cycle. Without cooling, the cell temperature increases over 10 K after 2 h and 46 min. Taking temperature control into account, the cell temperature is within a range of ±1 K and a quasi-stationary state is reached. This result is particularly interesting as it indicates a sufficient control of the battery cell temperature via a simple proportional controller with quasi-stationary cooling between 4 kW and when it is switched off. A possible reason for this circumstance is the slow dynamic of the thermal system discussed in Section 3.1.
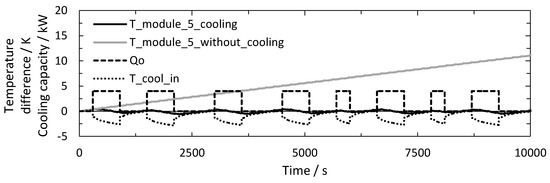
Figure 14.
Coolant temperature, coolant capacity, controlled and uncontrolled mean battery cell temperature of module 5 for fifteen repeated sequences of the SORT2. The temperature difference refers to the initial conditions.
Similar results are presented in Figure 15 for two times of line 92. The total cooling time is higher compared to SORT2, and a cooling capacity of 5 kW is temporarily required during the second cycle. However, the battery cell temperature is still retained within a small range by a quasi-stationary cooling capacity control of the cooling unit. Without cooling, the temperature rises up to 17 K after 3 h and thus exceeds the recommended limit of 35 °C for an initial temperature of 25 °C. Consequently, the cooling strategy protects the battery from overheating and thus promotes lifetime and safety of the battery system.
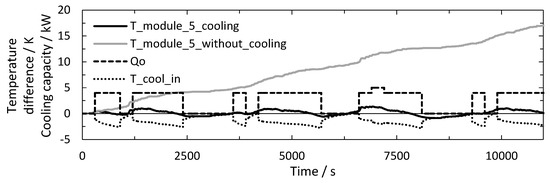
Figure 15.
Coolant temperature, coolant capacity, controlled and uncontrolled mean battery cell temperature of module 5 for two times line 92. The temperature difference refers to the initial conditions.
Higher and longer cooling rates are required for the driving profile of line 84 due to higher heat production. The results are outlined in Figure 16. The cell temperature is controlled within a range of ±2 K by quasi-stationary operation of the cooling unit. Without cooling, the temperature rises up to 15 K after 1 h and 54 min, underlining the need for an active cooling application.
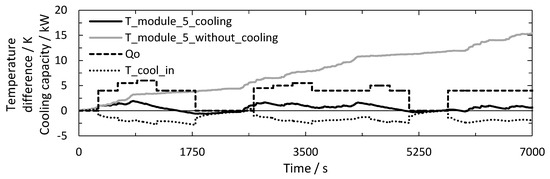
Figure 16.
Coolant temperature, coolant capacity, and controlled and uncontrolled mean battery cell temperature of module 5 for two times line 84. The temperature difference refers to the initial conditions.
When interpreting the exact values, the underlying model and its parameters must always be taken into account, since the literature already indicates that the results can vary between different models and cooling applications [18,19,20]. In this respect, the neglected influence of a variable internal resistance on heat production may have considerable effects. On the other hand, the investigated heat transfer behavior is not affected by the heat production (compare Section 2.4.1), and thus, there is a high probability that the principle behavior of the thermal transfer may be generalized to other battery systems with comparable specifications. In fact, the findings for the cell temperature development without cooling are in good agreement with the results of Lajunen et al. [22] and Wu et al. [23], who also consider electric bus applications.
In addition, the transient thermal behavior of the battery and the cooling system confirms the findings of a highly dumped system in Section 3.1 and reveals that for coolant cooling, a quasi-stationary control is adequate to regulate the cell temperature within a small range. The fact that the heat production calculation is based on a high internal resistance supports this statement, since this increases the thermal fluctuations of the system through high heat production within the cells, and the system can yet be operated in a quasi-stationary mode. Owing to this, the results suggest that a simple proportional controller is sufficient, and in contrary to the research of Tao et al. [26] and Gao et al. [27], no high dynamic controller is necessary. The main reason for this contradiction is probably that Tao et al. and Gao et al. used air instead of coolant to cool the battery, which apparently influences the dynamics of the thermal behavior. The findings of this chapter are of considerable relevance, as the low dynamic requirements simplify the control system tremendously, and the quasi-stationary operation further increases the service life and energy efficiency of the refrigerant-based cooling unit.
4. Conclusions
In this research, a novel transient calculation method is proposed to investigate the liquid-based battery cell temperature control of electric buses in dependence of standardized and real driving cycles. Thereby, a vehicle model calculates the battery current profile, while the system identification technique is used to describe the heat transfer behavior of the battery system. In this context, four transfer functions are extracted from a 3D thermo-hydraulic simulation model comprising twelve battery NMC cells, housing, arrestors, and a cooling plate. The transfer functions describe the thermal behavior between heat production, cell temperature, coolant inlet, and outlet temperature. Based on the transfer functions, a method for a fast prediction of the transient thermal behavior of a battery system is developed including thermal management i.e., coolant cooling. A 3D numerical model validation demonstrates a cell temperature deviation of ±0.02 K after 2000 s. The evaluation of the transfer functions reveals a high thermal inertia of the battery system, especially for higher frequencies. In addition, the thermal behavior of the system is examined for constant charging rates of 0.5 C and 1 C and for three driving cycles. The results correspond to the damped thermal behavior and suggest a proportional controller to be capable of regulating the cell temperature within a range of ±2 K by quasi-stationary control. These findings are of considerable relevance, since the low dynamic requirements simplify the control system enormously and quasi-stationary operation further increases the service life and energy efficiency of the refrigerant-based cooling unit. Therefore, this paper provides deep insights into the dynamic of a liquid-cooled battery thermal system and reveals crucial inputs for the battery cooling control strategy of electric buses.
Author Contributions
S.A. outlined the structure and content of this article. J.K. and C.K. proved the content. J.K. carried out the main simulations. S.A. wrote the manuscript. All authors have read and agreed to the published version of the manuscript.
Funding
This research received no external funding.
Acknowledgments
We acknowledge support for the Article Processing Charge by the Open Access Publication Fund of the Technische Universität Ilmenau.
Conflicts of Interest
The authors declare no conflict of interest.
Appendix A
The geographical itineraries of bus line 84 and 92 are captured in Figure A1.

Figure A1.
Geographical itinerary of line 84 (a) and line 92 (b). Bus stops are marked.
Appendix B
The mesh generated for the 3D simulation consists of 3,630,573 elements and 663,282 vertices. Quality criteria are provided in Table A1.
Table A1.
Specific values to evaluate the mesh quality.
Table A1.
Specific values to evaluate the mesh quality.
| Quality Criteria | Average | Minimal Value |
|---|---|---|
| skewness | 0.6712 | 0.127 |
| volume vs. circumradius | 0.6914 | 0.1427 |
| volume vs. length | 0.7821 | 0.1579 |
| condition number | 0.8395 | 0.1828 |
| growth rate | 0.6682 | 0.2575 |
| maximum angle | 0.7412 | 0.127 |
Appendix C
The temperature distribution of the battery module is shown in Figure A2 for a charging rate of 1 C and steady-state conditions. The coolant inlet temperature is set to 25 °C. The cell temperature is under 35 °C, and the coolant plate temperature is over 27 °C. With regard to the temperature distribution of a single cell, a temperature homogeneity of ±2 K across the electrode can be observed. The heat is transferred trough the aluminum hard case from the cell to the coolant plate.

Figure A2.
Temperature distribution for the middle cross-section of a battery module for a charging rate of 1 C. A slight temperature change cross the electrode appears. Heat transfer through the aluminum hard case.
The velocity profile of the coolant plate flow field, as introduced in Section 2.3, is shown in Figure A3. The u-profile and the pin fins intensify the turbulence of the flow. Further information about the simulations is provided in [46].

Figure A3.
Velocity profile of the coolant plate for a mass flow of 0.05 kg/s.
References
- Martin, J. The 17 Great Challenges of the Twenty-First Century. Oxford University 2007. Available online: https://www.elon.edu/docs/e-web/predictions/17_Great_Challenges.pdf (accessed on 14 August 2020).
- IEA. CO2 Emissions from Fuel Combustion 2016. International Energy Agency 2016. Available online: https://www.oecd-ilibrary.org/energy/co2-emissions-from-fuel-combustion-2016_co2_fuel-2016-en (accessed on 14 August 2020).
- Creutzig, F.; Jochem, P.; Edelenbosch, O.Y.; Mattauch, L.; van Vuuren, D.P.; McCollum, D.; Minx, J. Transport: A roadblock to climate change mitigation? Science 2015, 350, 911–912. [Google Scholar] [CrossRef] [PubMed]
- Clairand, J.-M.; Guerra-Terán, P.; Serrano Guerrero, X.; Gonzalez, M.; Escrivá, G. Electric Vehicles for Public Transportation in Power Systems: A Review of Methodologies. Energies 2019, 12, 3114. [Google Scholar] [CrossRef]
- Li, J.-Q. Battery-electric transit bus developments and operations: A review. Int. J. Sustain. Transp. 2016, 10, 157–169. [Google Scholar] [CrossRef]
- Xu, X.; Lv, X.; Han, L. Carbon Asset of Electrification: Valuing the Transition from Fossil Fuel-Powered Buses to Battery Electric Buses in Beijing. Sustainability 2019, 11, 2749. [Google Scholar] [CrossRef]
- Zhou, B.; Wu, Y.; Zhou, B.; Wang, R.; Ke, W.; Zhang, S.; Hao, J. Real-world performance of battery electric buses and their life-cycle benefits with respect to energy consumption and carbon dioxide emissions. Energy 2016, 96, 603–613. [Google Scholar] [CrossRef]
- Pesaran, A.; Santhanagopalan, S.; Kim, G.-H. Addressing the Impact of Temperature Extremes on Large Format Li-Ion Batteries for Vehicle Applications. In Proceedings of the 30th international battery seminar, Ft.Lauderdale, FL, USA, 11–14 March 2013; Available online: https://www.nrel.gov/docs/fy13osti/58145.pdf (accessed on 16 August 2020).
- Pesaran, A.A. Battery thermal models for hybrid vehicle simulations. J. Power Sources 2002, 110, 377–382. [Google Scholar] [CrossRef]
- Kim, J.; Oh, J.; Lee, H. Review on battery thermal management system for electric vehicles. Appl. Therm. Eng. 2019, 149, 192–212. [Google Scholar] [CrossRef]
- Lu, M.; Zhang, X.; Ji, J.; Xu, X.; Zhang, Y. Research progress on power battery cooling technology for electric vehicles. J. Energy Storage 2020, 27, 101155. [Google Scholar] [CrossRef]
- Wu, W.; Wang, S.; Wu, W.; Chen, K.; Hong, S.; Lai, Y. A critical review of battery thermal performance and liquid based battery thermal management. Energy Convers. Manag. 2019, 182, 262–281. [Google Scholar] [CrossRef]
- Bernardi, D.M.; Pawlikowski, E.M.; Newman, J. A General Energy Balance for Battery Systems. J. Electrochem. Soc. 1985, 132, 5. [Google Scholar] [CrossRef]
- Wang, Q.; Jiang, B.; Li, B.; Yan, Y. A critical review of thermal management models and solutions of lithium-ion batteries for the development of pure electric vehicles. Renew. Sustain. Energy Rev. 2016, 64, 106–128. [Google Scholar] [CrossRef]
- Xiao, Y.; Torregrossa, D.; Paolone, M. Surface temperature estimation of li-ion battery via thermal impulse response technique. In Proceedings of the IEEE Applied Power Electronics Conference and Exposition (APEC), Charlotte, NC, USA, 15–19 March 2015; pp. 1089–1095. [Google Scholar]
- Hu, X.; Lin, S.; Stanton, S.; Lian, W. A Foster Network Thermal Model for HEV/EV Battery Modeling. IEEE Trans. Ind. Appl. 2011, 47, 1692–1699. [Google Scholar] [CrossRef]
- Che-Daud, Z.; Asus, Z.; Abu Bakar, S.A.; Abu Husain, N.; Mohd Samin, P.; Chrenko, D. Temperature Prediction of Lithium-Ion Battery Used in Realistic Driving Cycles. In Proceedings of the IEEE Vehicle Power and Propulsion Conference (VPPC), Belfort, France, 11–14 December 2017; pp. 1–4. [Google Scholar]
- Worwood, D.; Kellner, Q.; Wojtala, M.; Widanage, W.; MGlen, R.; Greenwood, D.; Marco, J. A new approach to the internal thermal management of cylindrical battery cells for automotive applications. J. Power Sources 2017, 346, 151–166. [Google Scholar] [CrossRef]
- Tourani, A.; White, P.; Ivey, P. Analysis of electric and thermal behaviour of lithium-ion cells in realistic driving cycles. J. Power Sources 2014, 268, 301–314. [Google Scholar] [CrossRef]
- Hosseinzadeh, E.; Genieser, R.; Worwood, D.; Barai, A.; Marco, J.; Jennings, P. A systematic approach for electrochemical-thermal modelling of a large format lithium-ion battery for electric vehicle application. J. Power Sources 2018, 382, 77–94. [Google Scholar] [CrossRef]
- Torregrossa, D.; Xiao, Y.; Fahimi, B.; Paolone, M. Nonparametric Estimation of Surface Temperature of Li-Ion Cells Using Thermal Impulse Response. IEEE Trans. Transp. Electrif. 2016, 2, 407–416. [Google Scholar] [CrossRef]
- Lajunen, A.; Kalttonen, A. Investigation of thermal energy losses in the powertrain of an electric city bus. In Proceedings of the IEEE Transportation Electrification Conference and Expo (ITEC), Dearborn, MI, USA, 14–17 June 2015; pp. 1–6. [Google Scholar]
- Wu, X.; Lv, S.; Chen, J. Determination of the Optimum Heat Transfer Coefficient and Temperature Rise Analysis for a Lithium-Ion Battery under the Conditions of Harbin City Bus Driving Cycles. Energies 2017, 10, 1723. [Google Scholar] [CrossRef]
- Angermeier, S.; Heik, J.; Kerler, B.; Karcher, C. Investigation into heat transfer of a fluid-cooled battery depending on driving profile of electric buses via thermal impulse response technique. In Proceedings of the 14th International Conference of Heat Transfer, Fluid Mechanics and Thermodynamics, Wicklow, Ireland, 22–24 July 2019; Available online: https://na.eventscloud.com/ehome/349879/program/?&t=37e84e64acfd67aa345e8e3046e4d5ab (accessed on 16 August 2020).
- Simcenter Amesim, Siemens AG. Available online: https://www.plm.automation.siemens.com/global/en/products/simcenter/simcenter-amesim.html (accessed on 16 August 2020).
- Tao, X.W.; Wagner, J. A thermal management system for the battery pack of a hybrid electric vehicle: Modeling and control. Proc. Inst. Mech. Eng. Part D J. Automob. Eng. 2016, 230, 190–201. [Google Scholar] [CrossRef]
- Gao, X.; Ma, Y.; Chen, H. Active Thermal Control of a Battery Pack Under Elevated Temperatures. IFAC-PapersOnLine 2018, 51, 262–267. [Google Scholar] [CrossRef]
- UITP: Union Internationale des Transports Publics. Available online: https://www.uitp.org/ (accessed on 16 August 2020).
- Mahle Group. Internal Material of the Mahle GmbH. Available online: https://www.mahle.com/en/ (accessed on 16 August 2020).
- Daimler, eCitaro Specification. Available online: https://www.mercedes-benz-bus.com/de_DE/models/ecitaro/facts/technical-data.html (accessed on 16 August 2020).
- Lajunen, A. Energy consumption and cost-benefit analysis of hybrid and electric city buses. Transp. Res. Part C Emerg. Technol. 2014, 38, 1–15. [Google Scholar] [CrossRef]
- Lindh, P.; Petrov, I.; Immonen, P.; Pyrhönen, J.; Niemelä, M.; Anttila, J.; Paakkinen, M.; Scherman, E. Performance of a Direct-Liquid-Cooled Motor in an Electric Bus Under Different Load Cycles. IEEE Access 2019, 7, 86897–86905. [Google Scholar] [CrossRef]
- Basma, H.; Mansour, C.; Haddad, M.; Nemer, M.; Stabat, P. Comprehensive energy modeling methodology for battery electric buses. Energy 2020, 207, 118241. [Google Scholar] [CrossRef]
- Sinhuber, P.; Rohlfs, W.; Sauer, D.U. Study on power and energy demand for sizing the energy storage systems for electrified local public transport buses. In Proceedings of the IEEE Vehicle Power and Propulsion Conference, Seoul, Korea, 9–12 October 2012; pp. 315–320. [Google Scholar]
- Vepsäläinen, J.; Otto, K.; Lajunen, A.; Tammi, K. Computationally efficient model for energy demand prediction of electric city bus in varying operating conditions. Energy 2019, 169, 433–443. [Google Scholar] [CrossRef]
- Hu, X.; Murgovski, N.; Johannesson, L.; Egardt, B. Energy efficiency analysis of a series plug-in hybrid electric bus with different energy management strategies and battery sizes. Appl. Energy 2013, 111, 1001–1009. [Google Scholar] [CrossRef]
- Fletcher, L. A Review of Thermal Control Materials for Metallic Junctions. J. Spacecr. 1972, 9. [Google Scholar] [CrossRef]
- Loges, A.; Herberger, S.; Werner, D.; Wetzel, T. Thermal characterization of Li-ion cell electrodes by photothermal deflection spectroscopy. J. Power Sources 2016, 325, 104–115. [Google Scholar] [CrossRef]
- Richter, F.; Vie, P.J.; Kjelstrup, S.; Burheim, O.S. Measurements of ageing and thermal conductivity in a secondary NMC-hard carbon Li-ion battery and the impact on internal temperature profiles. Electrochim. Acta 2017, 250, 228–237. [Google Scholar] [CrossRef]
- Viswanathan, V.V.; Choi, D.; Wang, D.; Xu, W.; Towne, S.; Williford, R.E.; Zhang, J.-G.; Liu, J.; Yang, Z. Effect of entropy change of lithium intercalation in cathodes and anodes on Li-ion battery thermal management. J. Power Sources 2010, 195, 3720–3729. [Google Scholar] [CrossRef]
- Hu, C.; Lin, S.; Stanton, S.; Lian, W. A state space thermal model for HEV/EV non-linear and time varying batter thermal system. In Proceedings of the ASME 2011 International Mechanical Engineering Congress & Exposition, Denver, CO, USA, 11–17 November 2011; pp. 783–791. [Google Scholar]
- Pintelon, R.; Schoukens, J. System Identification: A Frequency Response Approach; IEEE Press: New York, NY, USA, 2001. [Google Scholar] [CrossRef]
- De Keyser, R.; Ionescu, C.M.; Festila, C. A one-step procedure for frequency response estimation based on a Switch-Mode Transfer Function Analyzer. In Proceedings of the 50th IEEE Conference on Decision and Control and European Control Conference, Orlando, FL, USA, 12–15 December 2011; pp. 1189–1194. [Google Scholar]
- Hipp, C.; Mückle, S.; Schauer, M.; Segal, D.; Zimmermann, R. System for Controlling the Temperature of an Electric Energy Storage Device. Patent Nr. WO 2019/016021 A2 2019. Available online: https://patentimages.storage.googleapis.com/77/97/f2/7be732563f0615/WO2019016021A2.pdf (accessed on 4 September 2020).
- Baehr, H.D.; Stephan, K. Heat conduction and mass diffusion. In Heat and Mass Transfer, 3rd ed.; Springer: Berlin/Heidelberg, Germany, 2011; pp. 158–161. [Google Scholar]
- Heik, J. Numerische Analyse des Thermischen Verhaltens Prismatischer Li-Ion-Zellen in Abhängigkeit Standardisierter Fahrprofile von E-Bussen, Masterthesis, University of Ilmenau, Ilmenau, Germany. 2019. Available online: https://opac.lbs-ilmenau.gbv.de/DB=1/CMD?ACT=SRCHA&IKT=1016&SRT=YOP&TRM=Julius+Heik (accessed on 4 September 2020).
© 2020 by the authors. Licensee MDPI, Basel, Switzerland. This article is an open access article distributed under the terms and conditions of the Creative Commons Attribution (CC BY) license (http://creativecommons.org/licenses/by/4.0/).