Game-Theory Based V2G Coordination Strategy for Providing Ramping Flexibility in Power Systems

Abstract
:1. Introduction
- We propose to use the EV clusters as a flexible resource to improve system ramping capability while fully considering the power flow congestion in the power network.
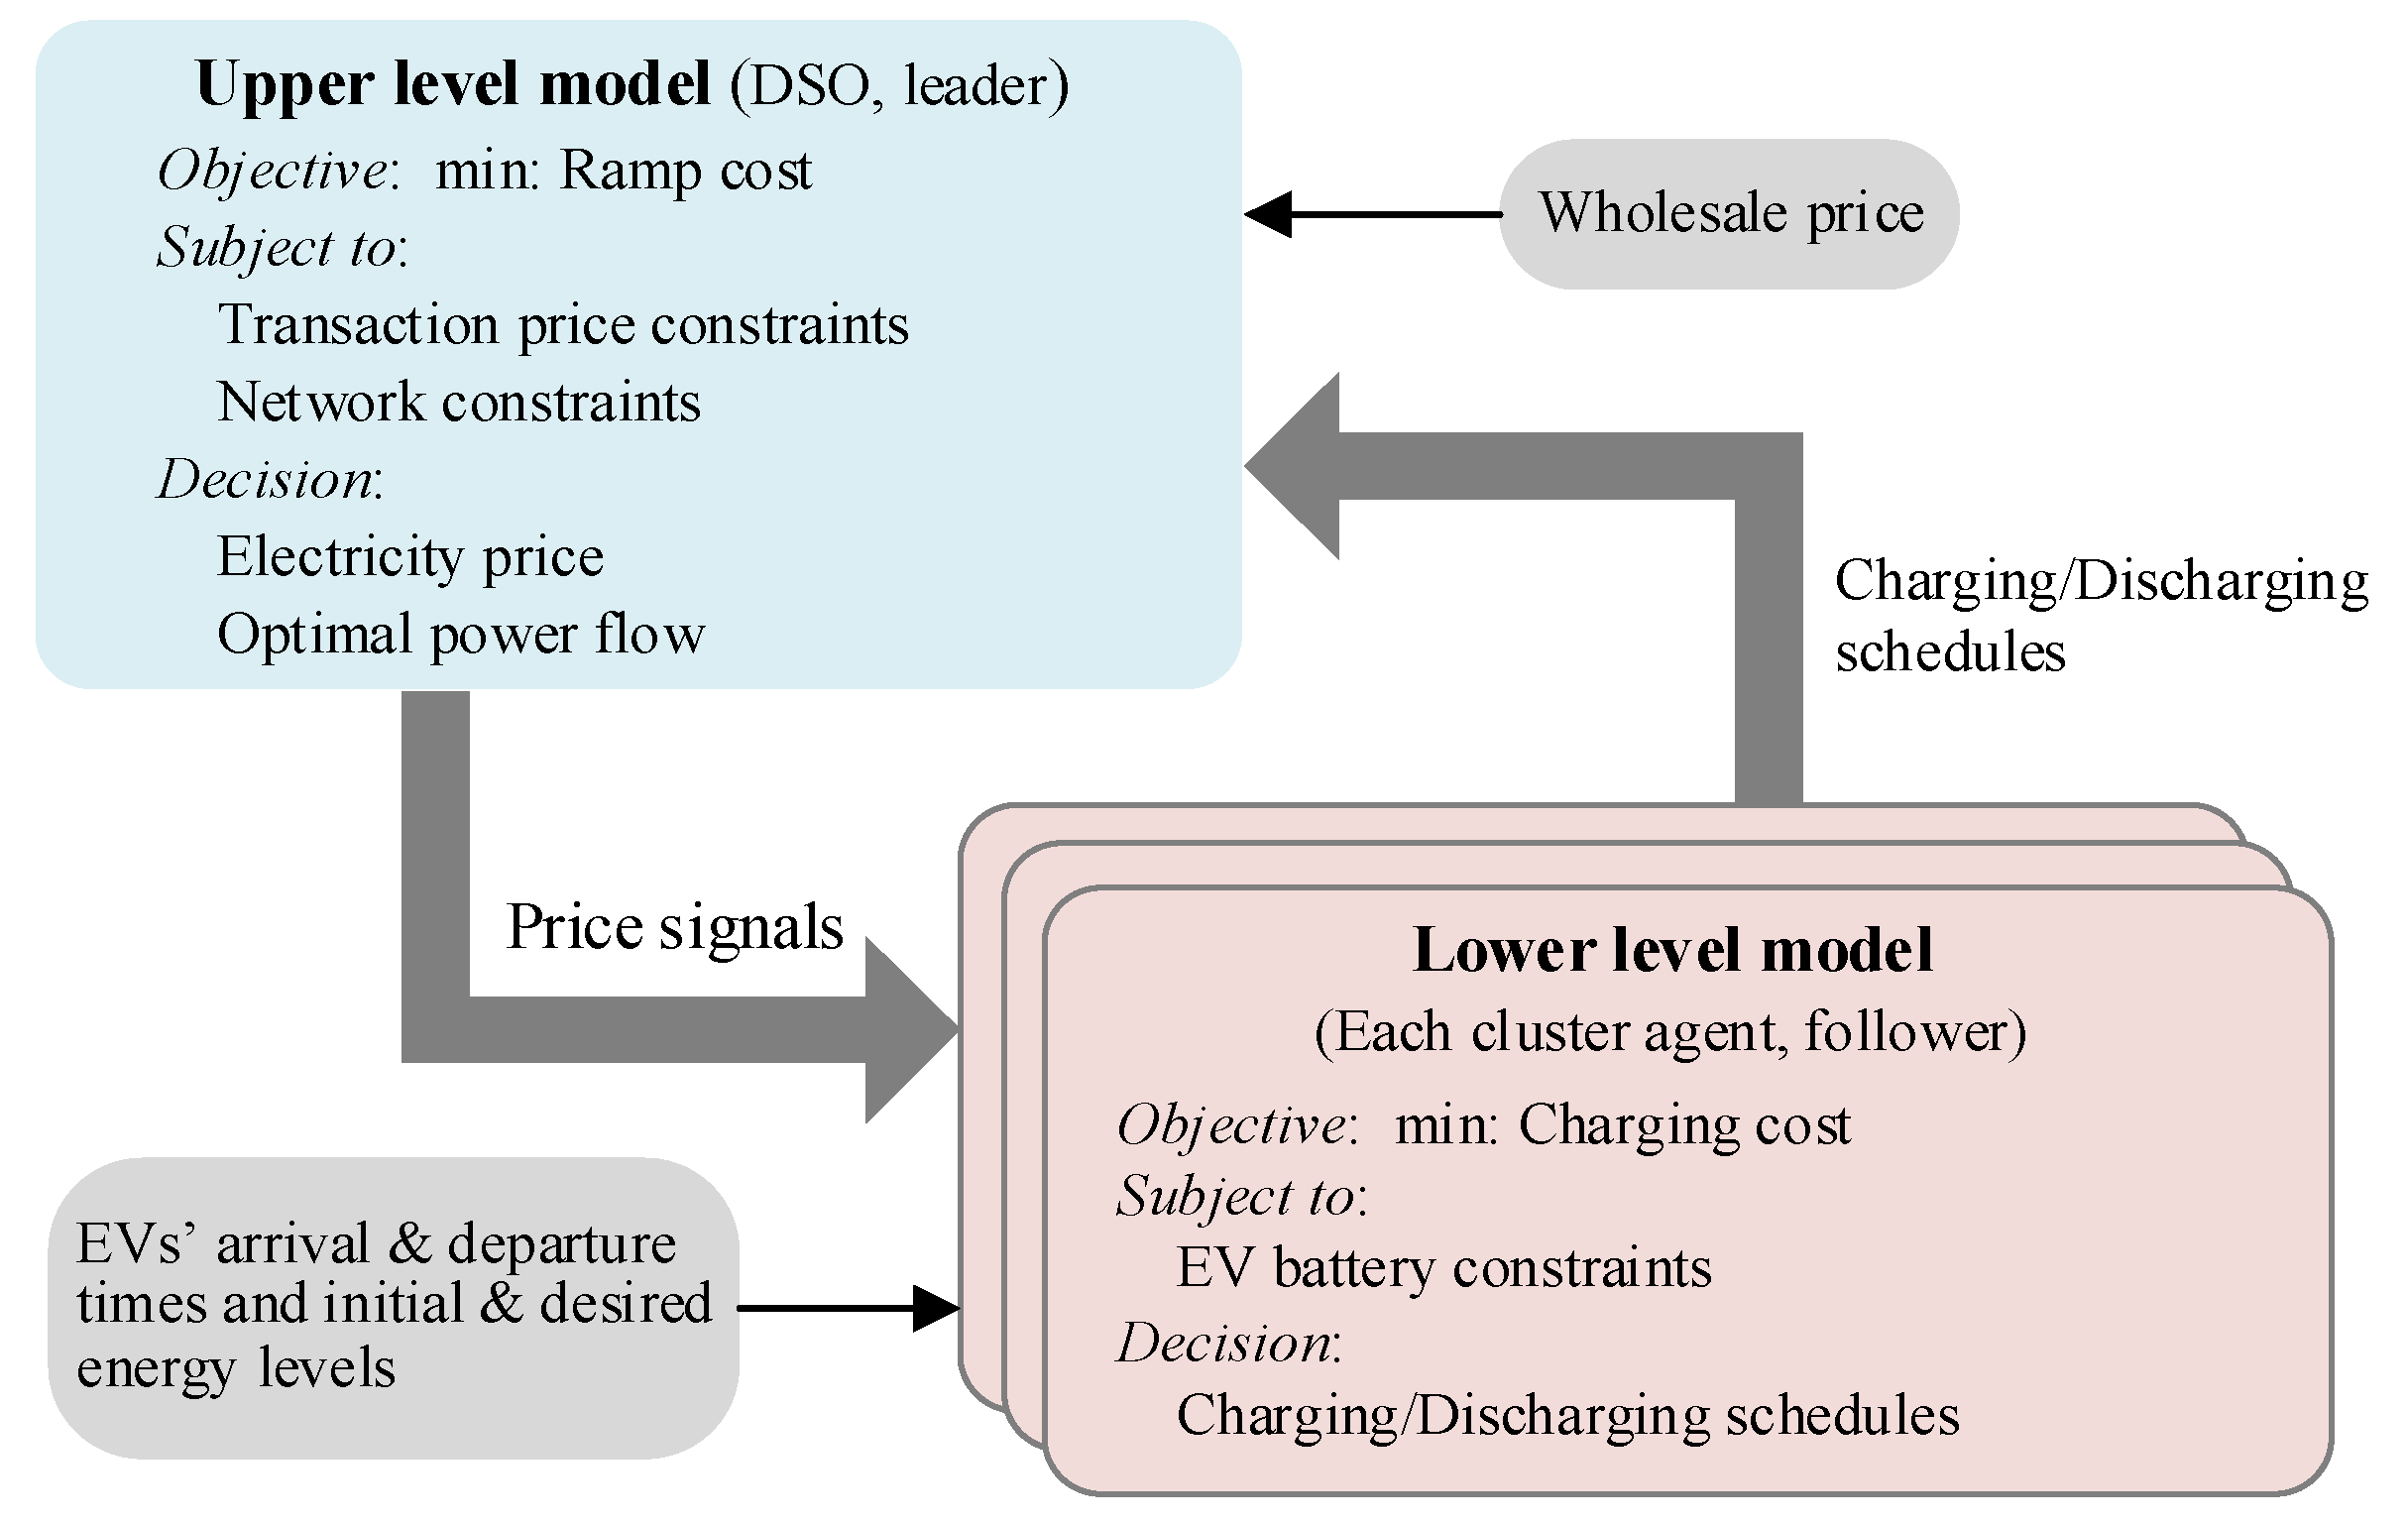
- In order to study V2G coordination, we propose a dynamic pricing mechanism, which models the DSO as a leader deciding the electricity trading prices at the EV-cluster-connected buses, and models the EVs as followers responding to the prices by scheduling their V2G charging and discharging.
- The Stackelberg-game-based bi-level model that we propose is reformulated as a single-level mixed-integer second-order cone programming (MISOCP) problem by using Karush-Kuhn-Tucker (KKT) conditions, the strong duality theorem and second-order cone (SOC) relaxation, and thus can be efficiently solved by commercial solvers.
2. System Model and the Proposed Strategy
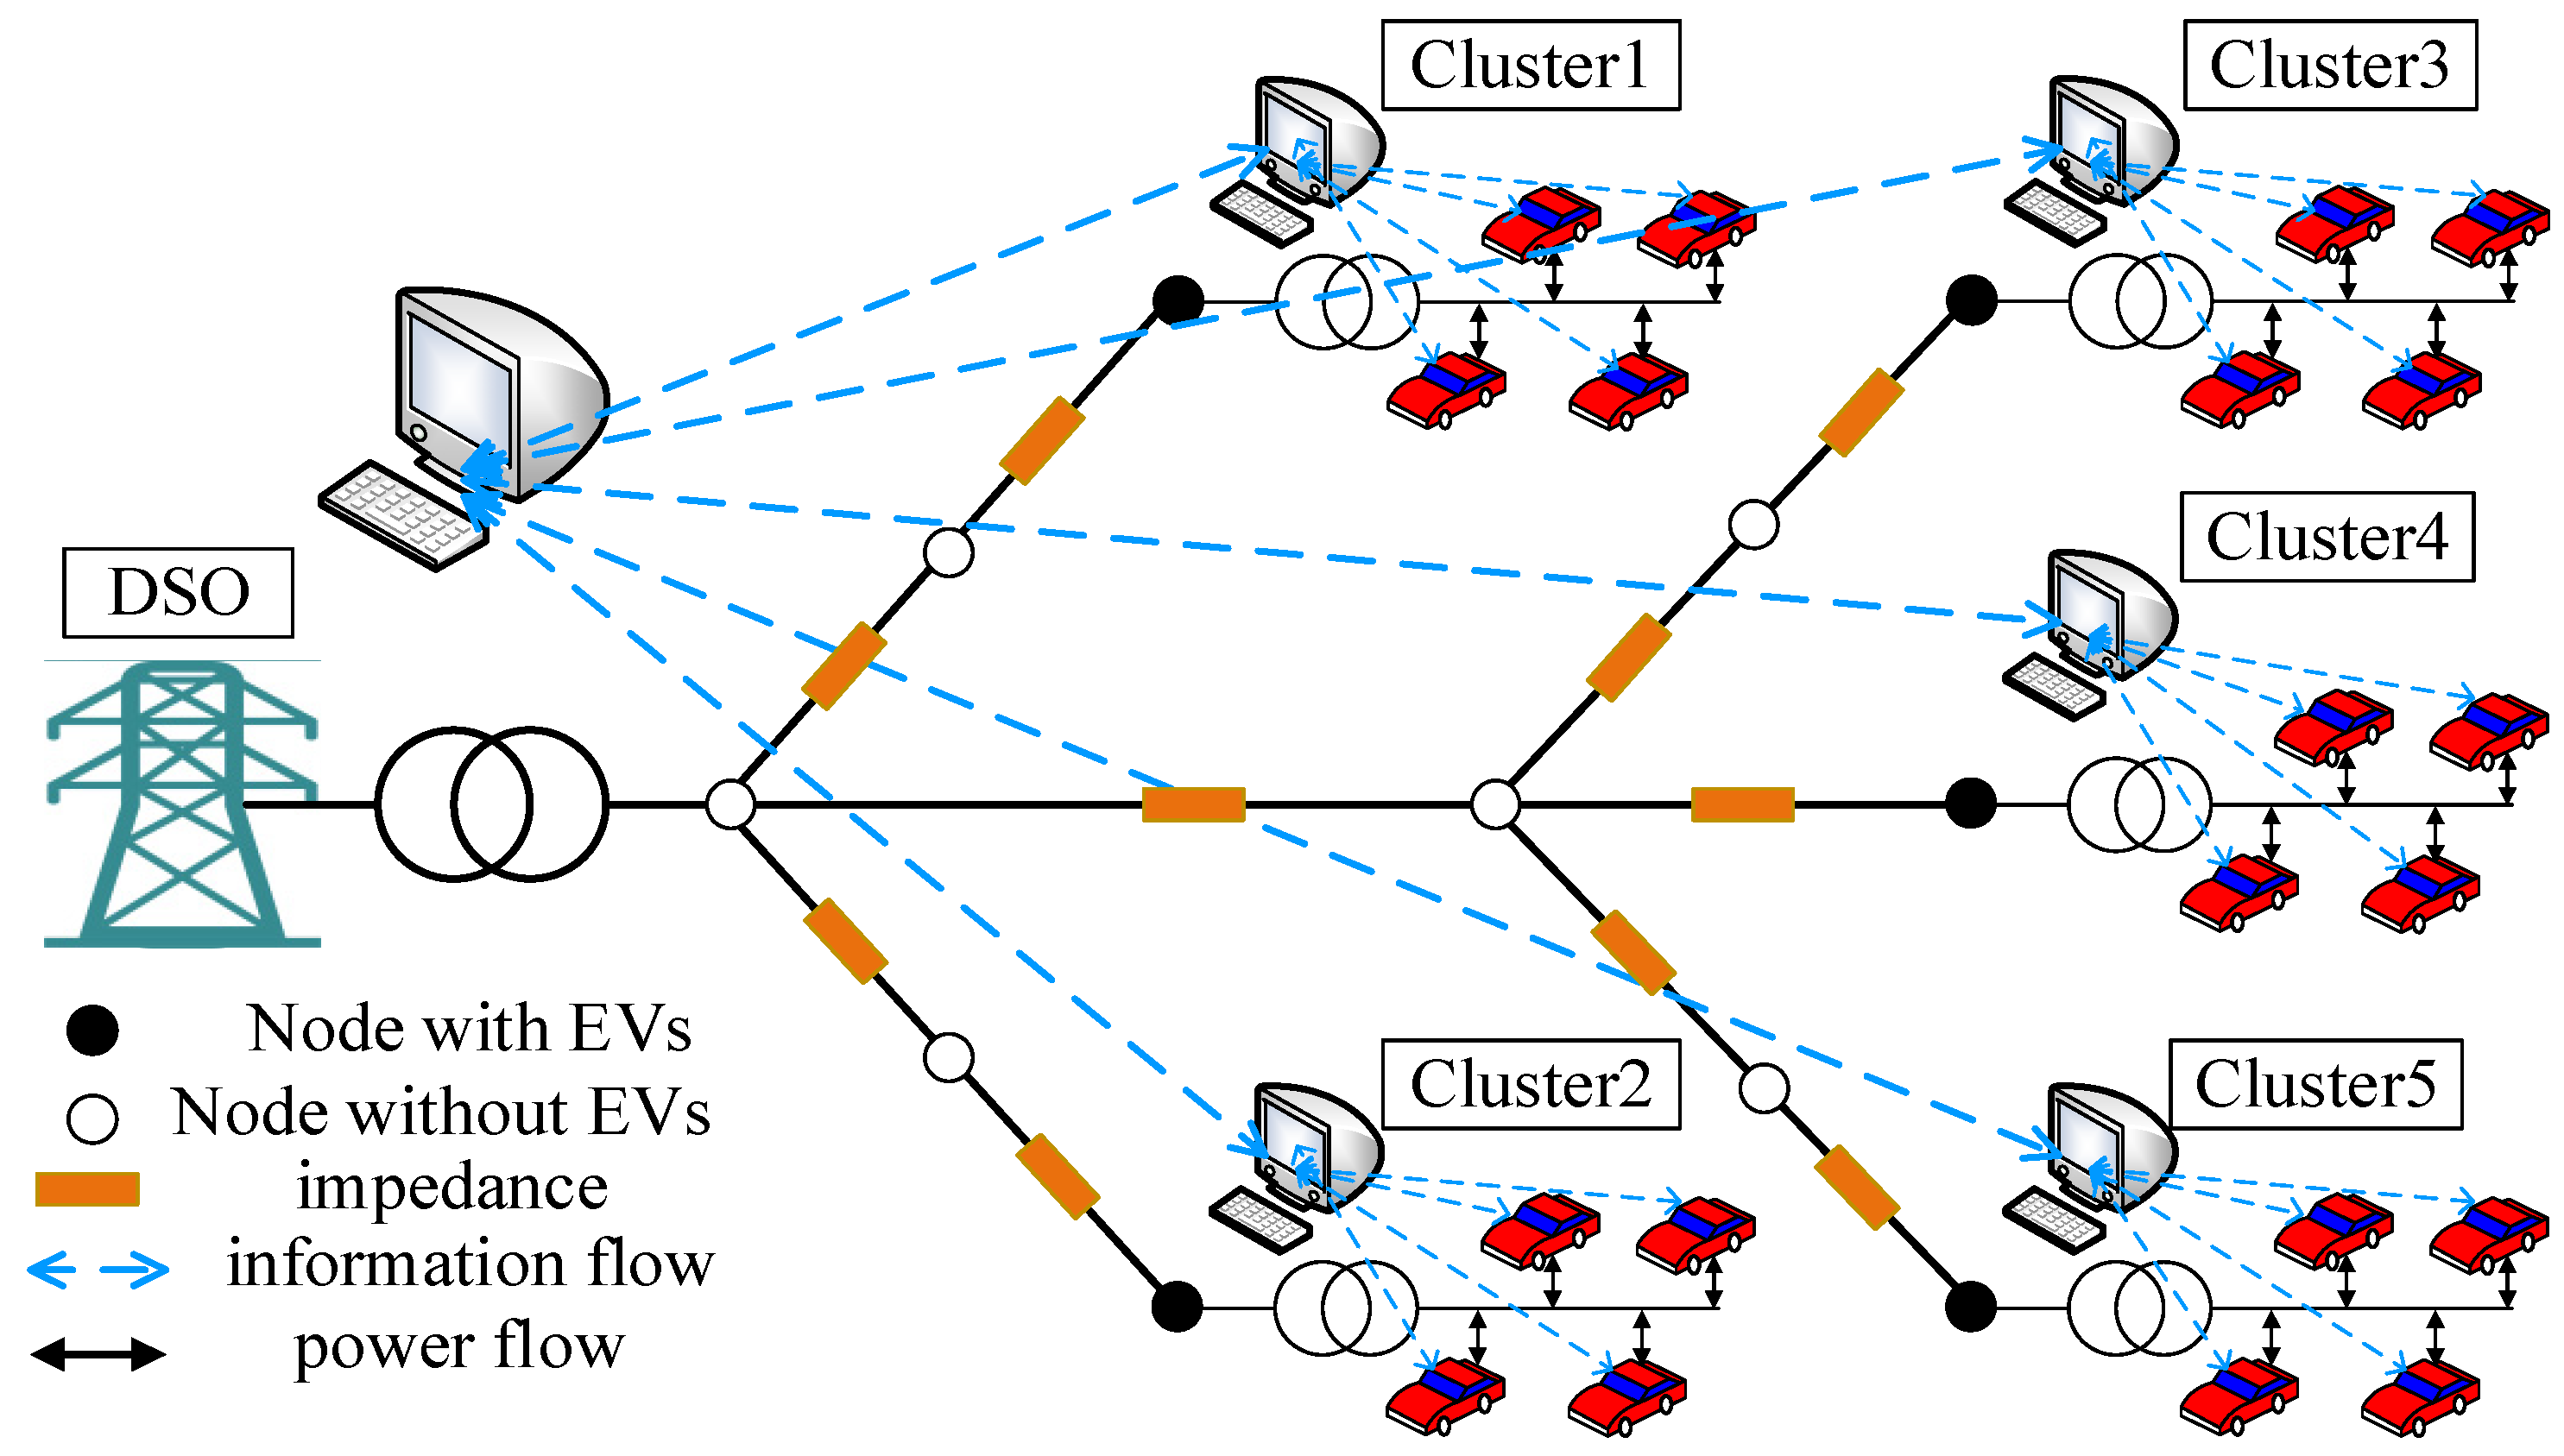
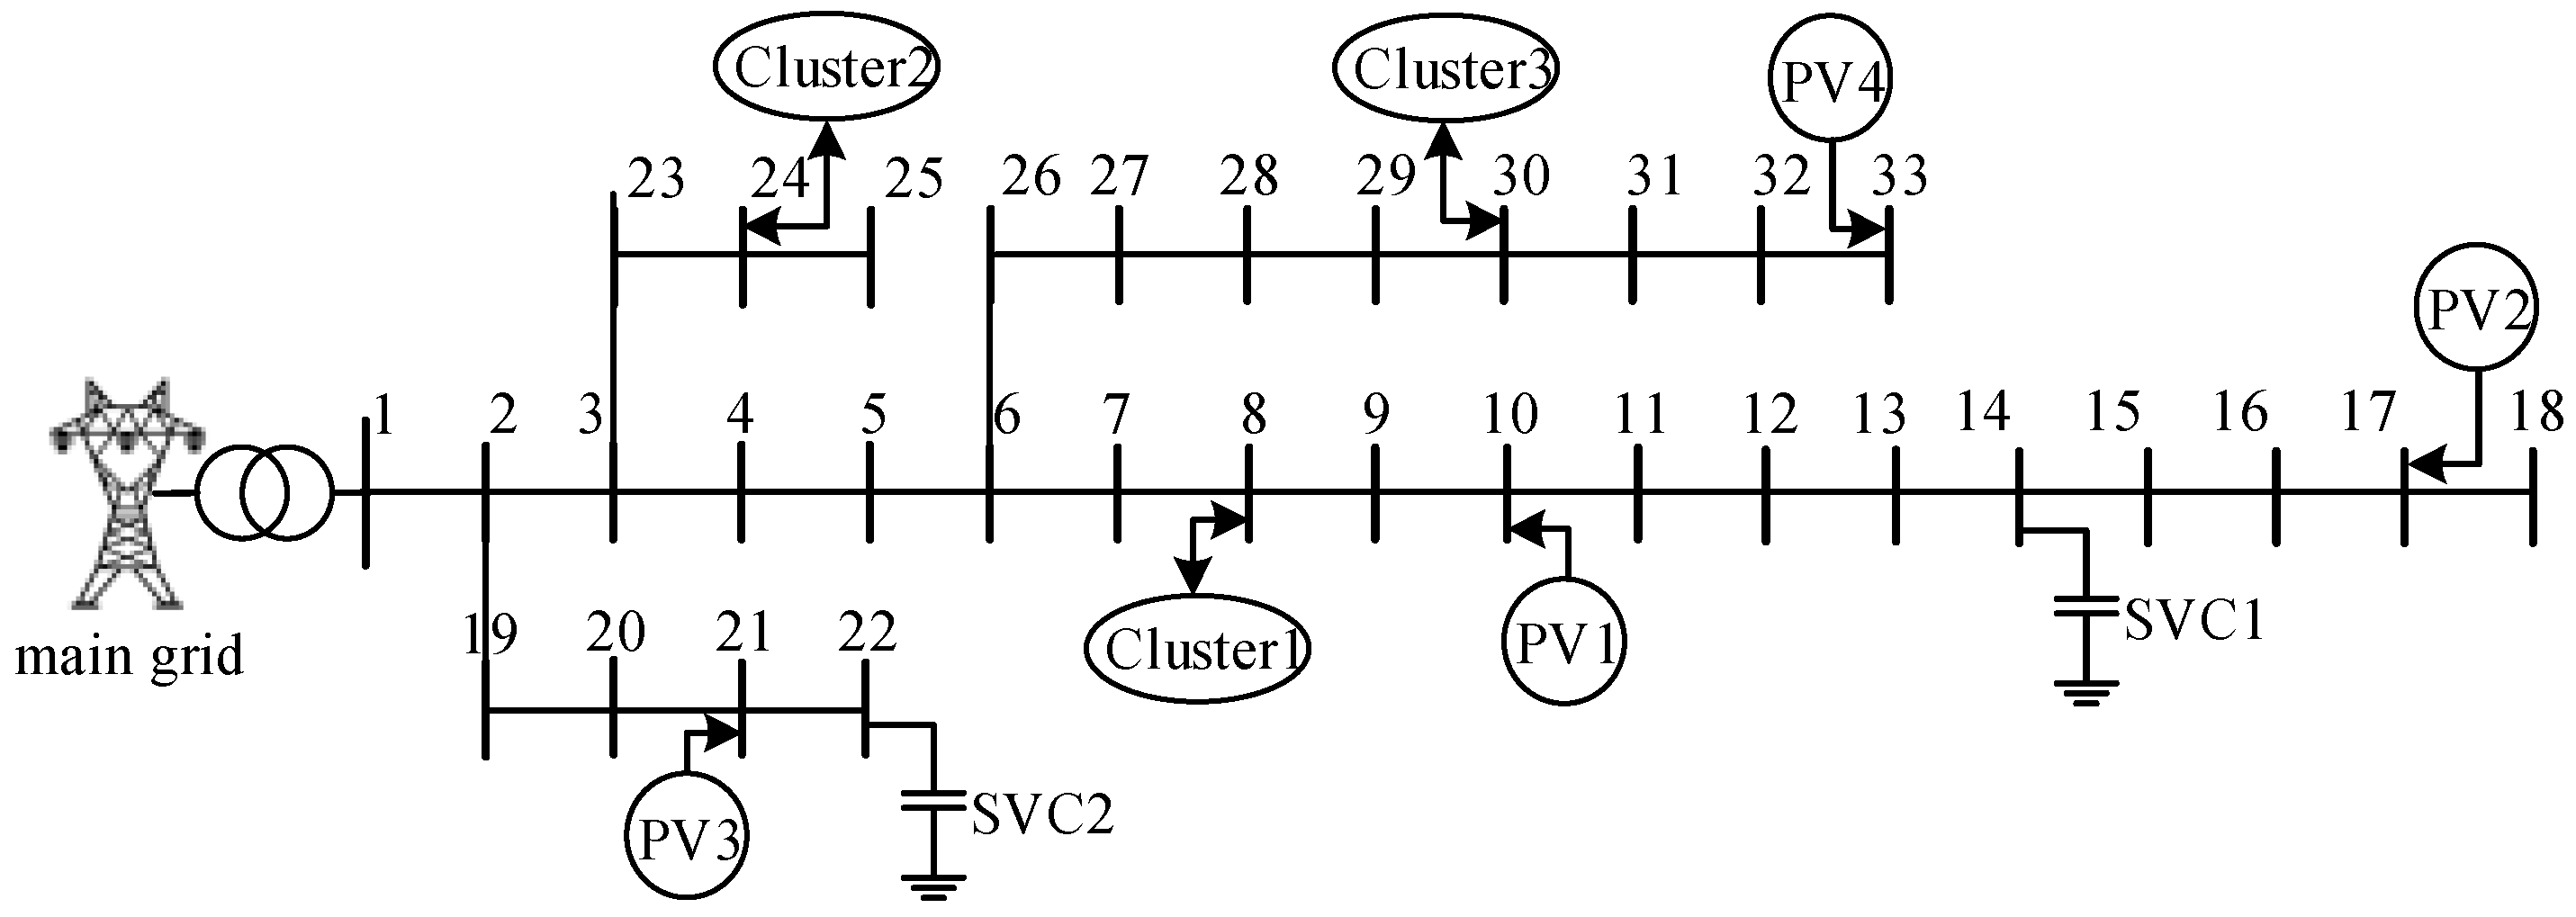
2.1. Active Distribution System
2.2. Proposed Stackelberg-Game-Based Coordination Strategy
3. Mathematical Formulation
3.1. Model of DSO
3.2. Model of an EV Cluster
3.3. Model Reformulation
3.3.1. Linearization of Bilinear Terms
3.3.2. Second-Order Cone Programming
3.3.3. Single-Level MISOCP Model
4. Case Studies
4.1. Simulation Parameters
4.2. Simulation Results
5. Conclusions
Author Contributions
Funding
Conflicts of Interest
Nomenclature
| A. Abbreviations | |
| DSO | Distribution system operator |
| ISO | Independent system operator |
| KKT | Karush-Kuhn-Tucker |
| MISOCP | Mixed integer second-order cone programming |
| PV | Photovoltaic |
| SOC | Second-order cone |
| V2G | Vehicle-to-grid |
| B. Sets and Parameters | |
| N | Set of EV clusters with index n |
| M | Set of EVs with index m |
| S | Set of distribution network buses with index i and j |
| T | Set of hours with index t |
| a/b | Coefficients of peak ramp cost |
| Maximal levels of EV’s charging/discharging power | |
| Maximal square of the current of branch ij | |
| Required net charging power | |
| Lower/upper bounds of the EV battery’s energy level | |
| Arrival/departure times of EV m at cluster agent n | |
| Minimal/maximal squares of the voltage of bus i | |
| Lower/upper bounds of transaction prices between the DSO and EV cluster n | |
| C. Variables | |
| Charging/discharging power of an EV | |
| Active/reactive power flows on branch ij | |
| Active/reactive loads at bus j | |
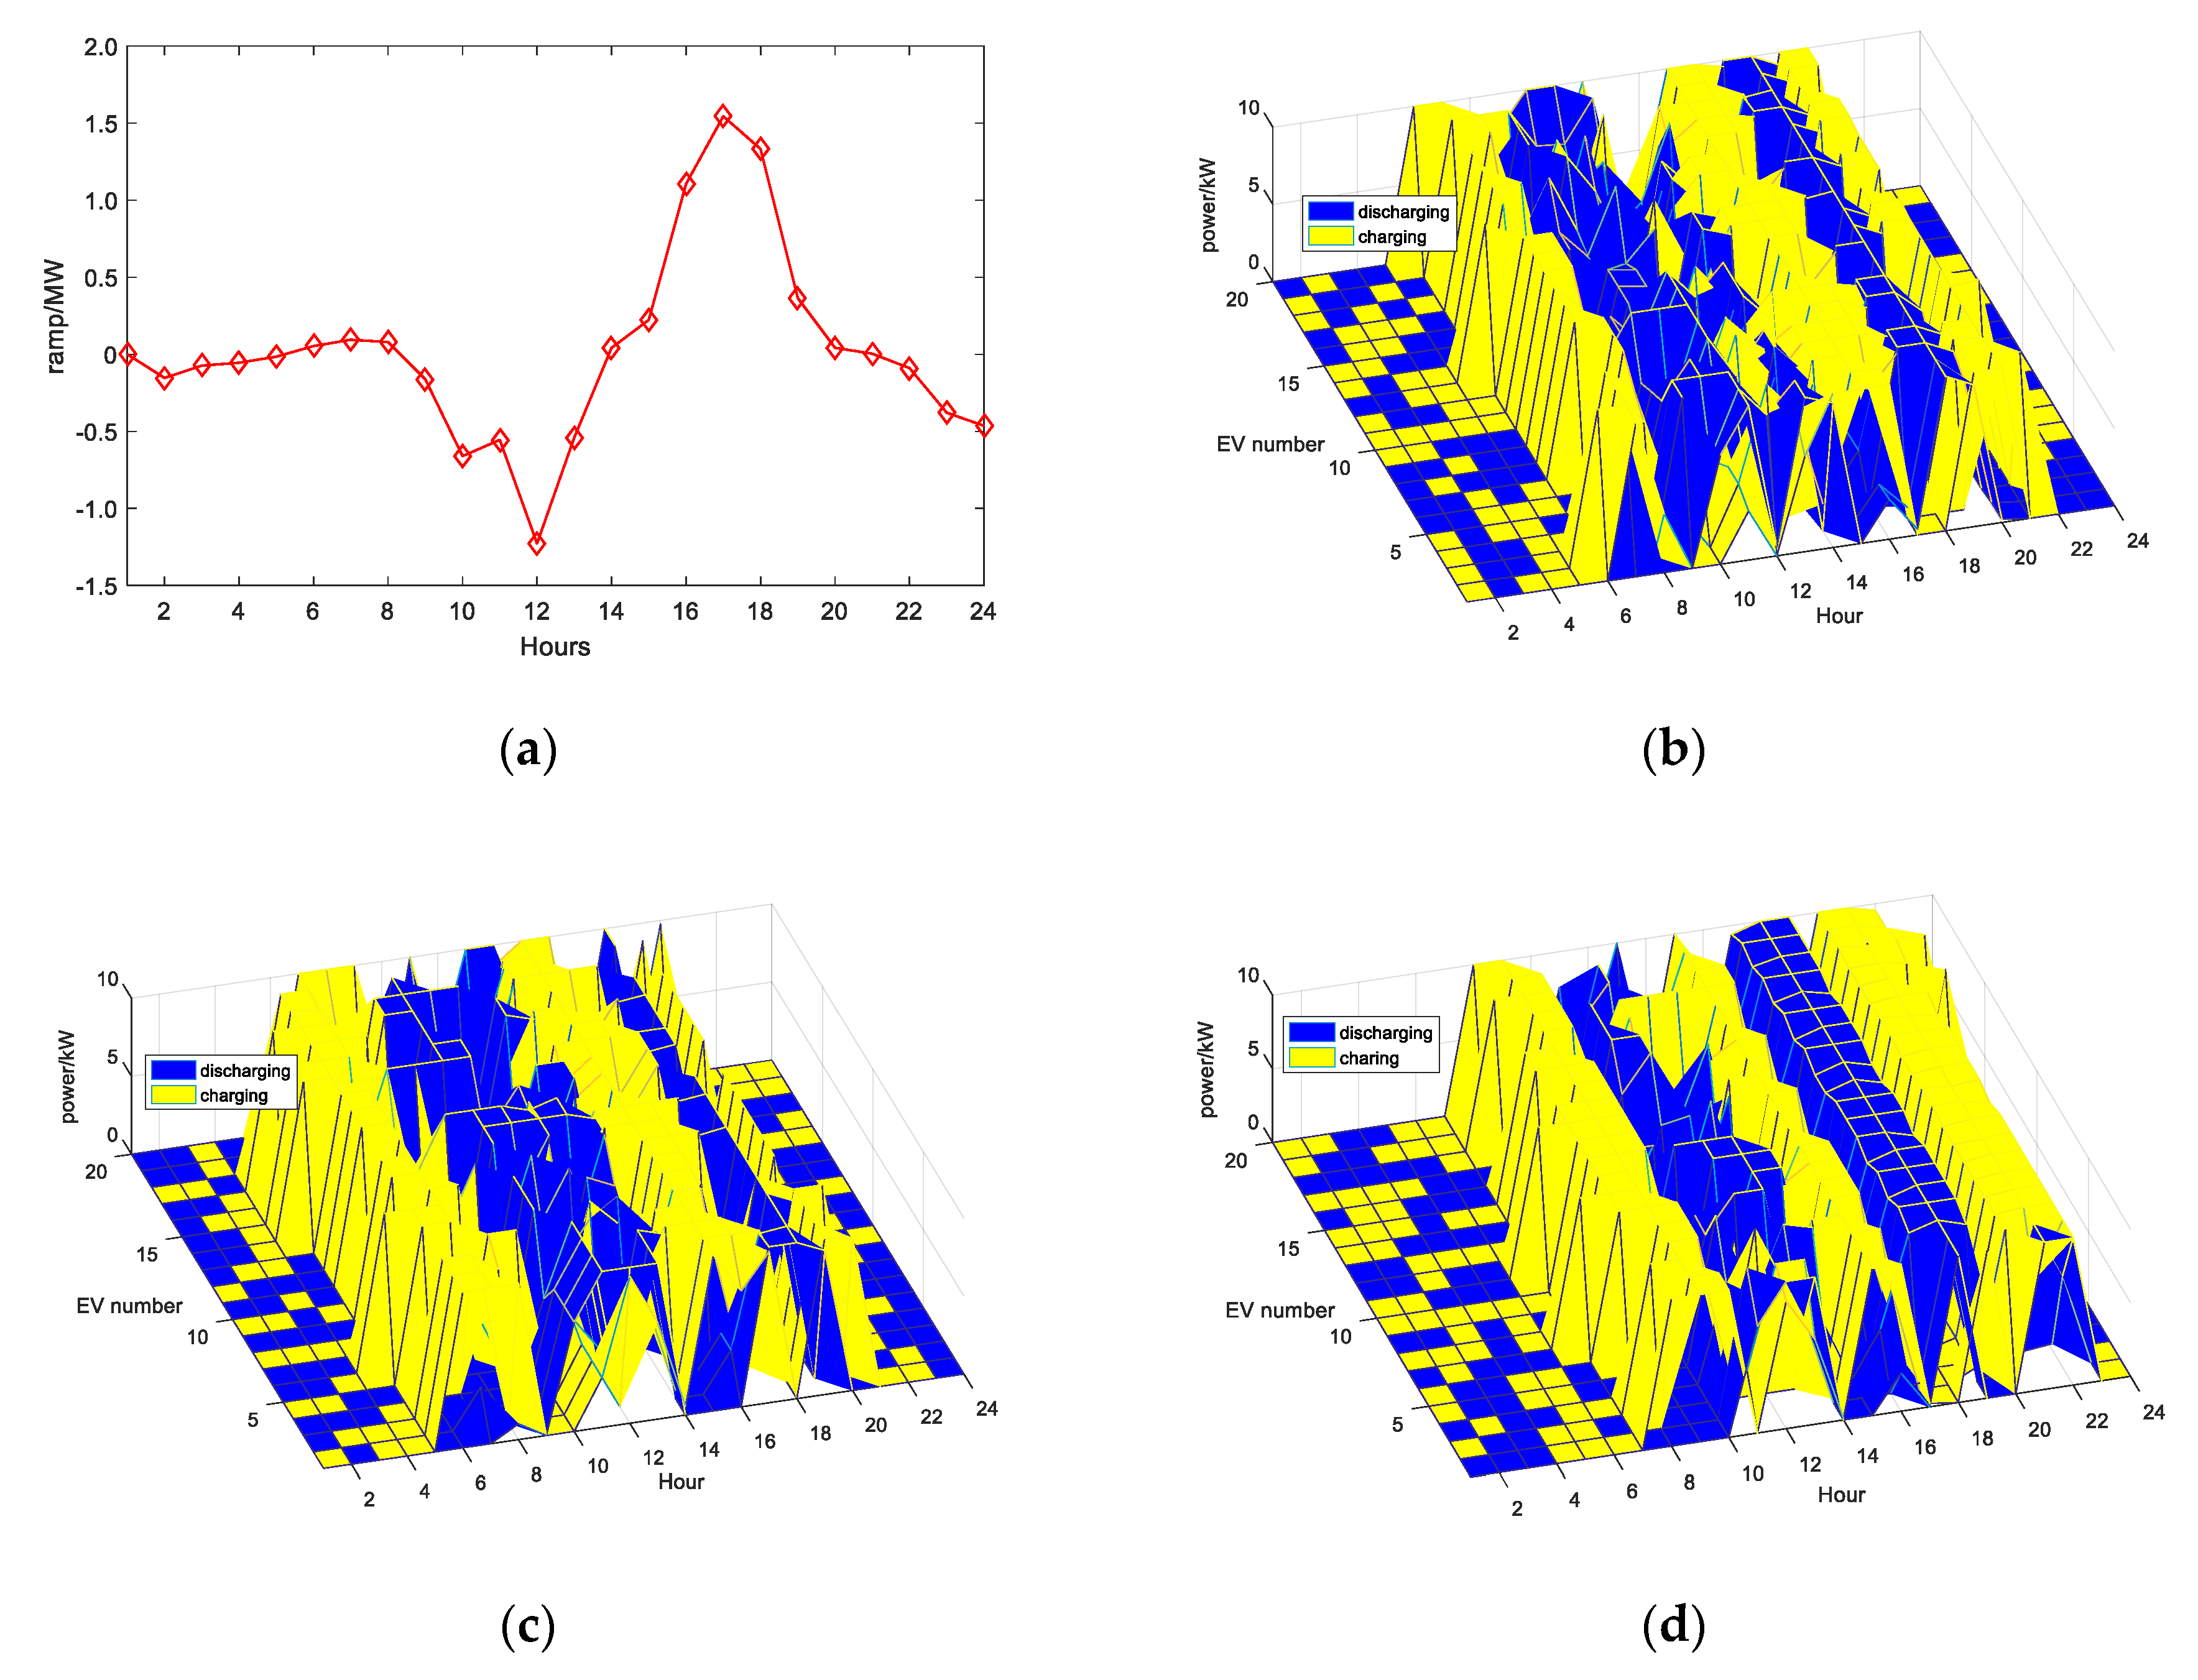
| System ramp at time slot t | |
| Voltage of bus i and the current of branch ij | |
| Transaction prices between the DSO and EV cluster n | |
| Dual variables in the proposed model | |
Appendix A

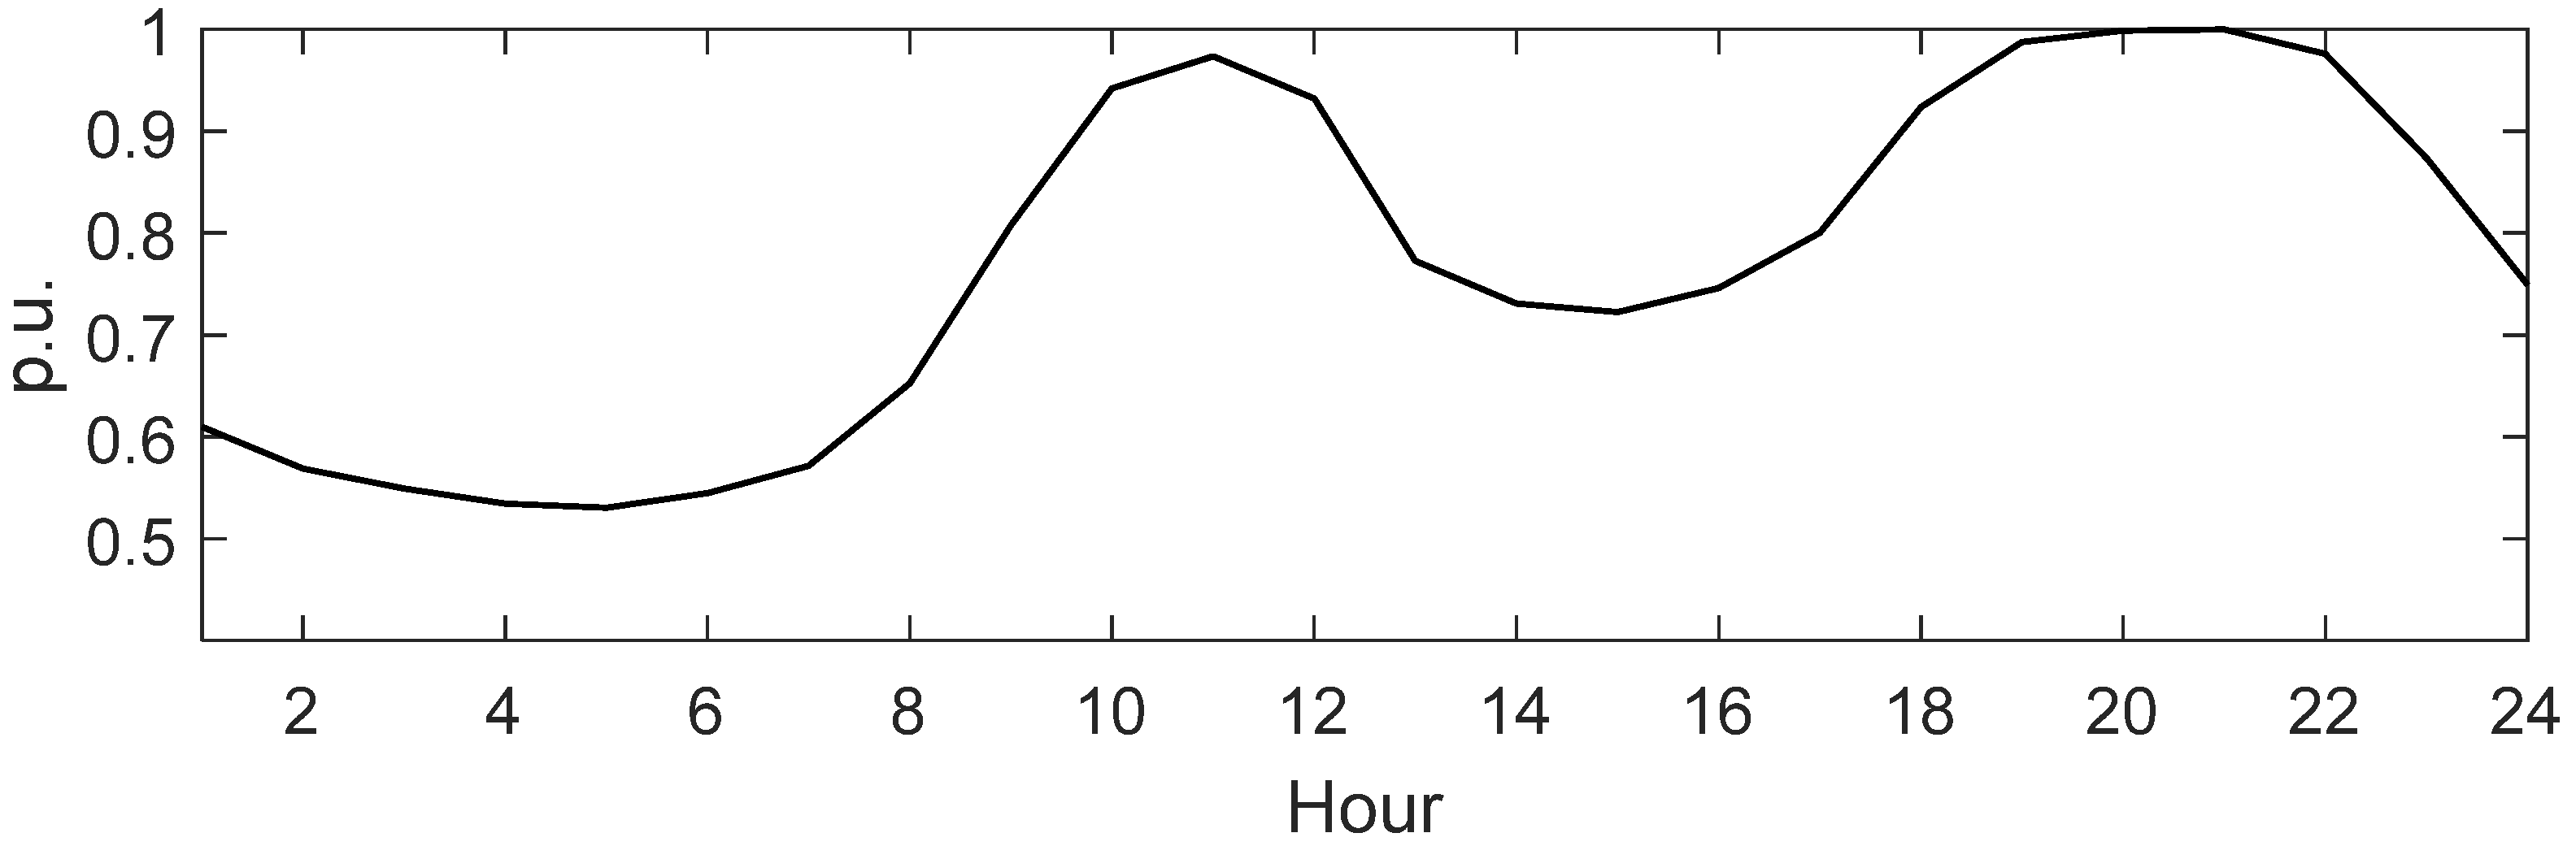
| Hour | Load | Hour | Load | Hour | Load | Hour | Load |
|---|---|---|---|---|---|---|---|
| 01:00 | 0.6099 | 07:00 | 0.5715 | 13:00 | 0.9735 | 19:00 | 0.9875 |
| 02:00 | 0.5687 | 08:00 | 0.6528 | 14:00 | 0.9320 | 20:00 | 0.9989 |
| 03:00 | 0.5490 | 09:00 | 0.8078 | 15:00 | 0.7729 | 21:00 | 1.0000 |
| 04:00 | 0.5344 | 10:00 | 0.9422 | 16:00 | 0.7309 | 22:00 | 0.9760 |
| 05:00 | 0.5303 | 11:00 | 0.9735 | 17:00 | 0.7223 | 23:00 | 0.8740 |
| 06:00 | 0.5447 | 12:00 | 0.9321 | 18:00 | 0.7461 | 24:00 | 0.7491 |
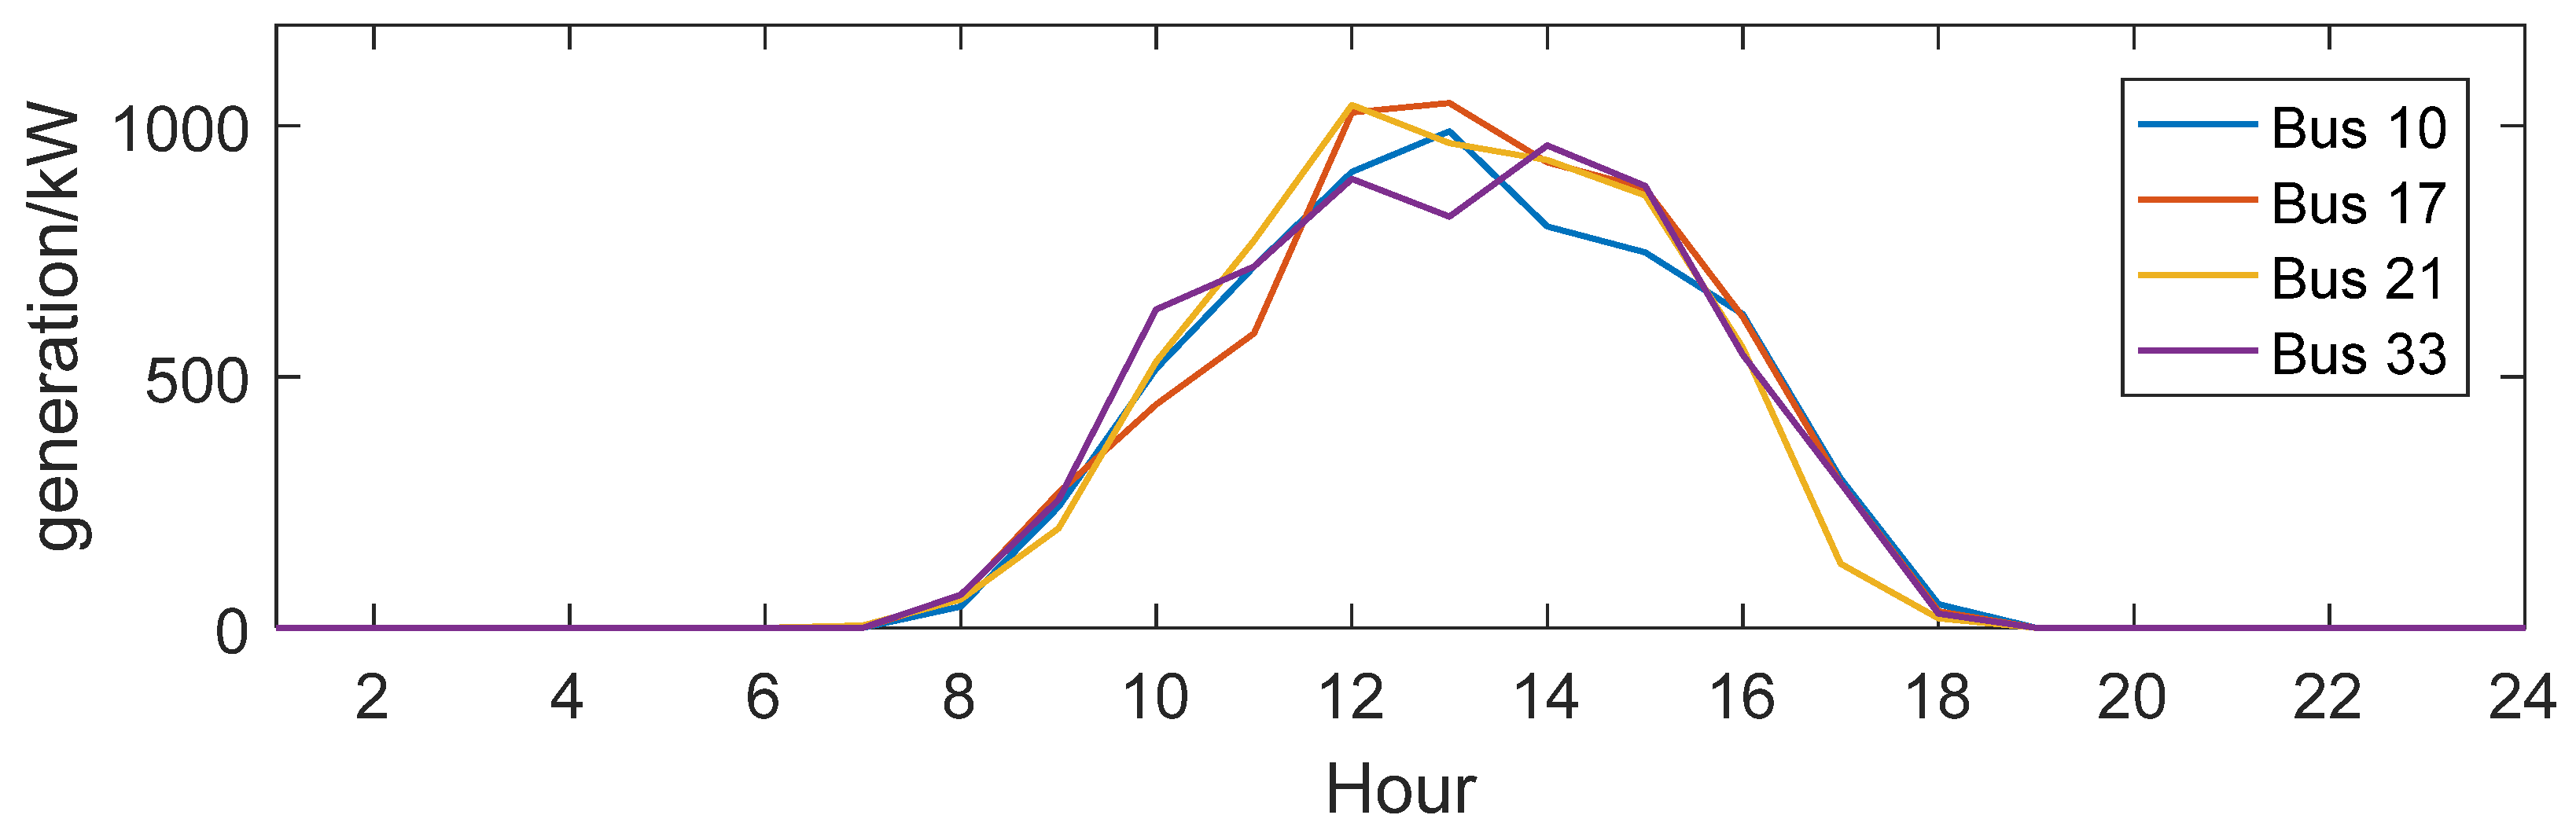
| Hour | PV1 | PV2 | PV3 | PV4 | Hour | PV1 | PV2 | PV3 | PV4 |
|---|---|---|---|---|---|---|---|---|---|
| 01:00 | 0 | 0 | 0 | 0 | 13:00 | 988.50 | 1045.20 | 964.80 | 818.40 |
| 02:00 | 0 | 0 | 0 | 0 | 14:00 | 799.50 | 927 | 931.80 | 960.30 |
| 03:00 | 0 | 0 | 0 | 0 | 15:00 | 747.30 | 875.10 | 861 | 879.90 |
| 04:00 | 0 | 0 | 0 | 0 | 16:00 | 624.30 | 619.50 | 558 | 543.90 |
| 05:00 | 0 | 0 | 0 | 0 | 17:00 | 297.90 | 288.60 | 127.80 | 288.60 |
| 06:00 | 0 | 0 | 0 | 0 | 18:00 | 47.40 | 33 | 18.90 | 28.50 |
| 07:00 | 0 | 0 | 4.80 | 0 | 19:00 | 0 | 0 | 0 | 0 |
| 08:00 | 42.60 | 61.50 | 56.70 | 66.30 | 20:00 | 0 | 0 | 0 | 0 |
| 09:00 | 241.20 | 269.70 | 198.60 | 255.30 | 21:00 | 0 | 0 | 0 | 0 |
| 10:00 | 515.70 | 444.60 | 529.80 | 633.90 | 22:00 | 0 | 0 | 0 | 0 |
| 11:00 | 719.10 | 586.50 | 771.00 | 719.10 | 23:00 | 0 | 0 | 0 | 0 |
| 12:00 | 908.10 | 1026.30 | 1040.70 | 894.00 | 24:00 | 0 | 0 | 0 | 0 |
References
- Administration, U.E.I. Annual Energy Outlook 2019: With Projections to 2050. 2020. Available online: https://www.eia.gov/outlooks/aeo/pdf/aeo2019.pdf (accessed on 1 August 2020).
- Kwon, H.; Park, J.-K.; Kim, D.; Yi, J.; Park, H. A Flexible Ramping Capacity Model for Generation Scheduling with High Levels of Wind Energy Penetration. Energies 2016, 9, 1040. [Google Scholar] [CrossRef] [Green Version]
- Che, L.; Liu, X.; Li, Z. An Intra-interval Security Risk Regarding Regulation Burden Due to Wind Variation in High-Wind-Penetrated Power Systems. IEEE Trans. Power Syst. 2018, 33, 3213–3216. [Google Scholar] [CrossRef]
- Badal, F.R.; Das, P.; Sarker, S.K.; Das, S.K. A Survey on Control Issues in Renewable Energy Integration and Microgrid. Prot. Control Mod. Power Syst. 2019, 4, 8. [Google Scholar] [CrossRef] [Green Version]
- CAISO. What the Duck Curve Tells Us about Managing a Green Grid. 2020. Available online: https://www.caiso.com/Documents/FlexibleResourcesHelpRenewables_FastFacts.pdf (accessed on 9 August 2020).
- Chalise, S.; Atia, H.R.; Poudel, B.; Tonkoski, R. Impact of Active Power Curtailment of Wind Turbines Connected to Residential Feeders for Overvoltage Prevention. IEEE Trans. Sustain. Energy 2016, 7, 471–479. [Google Scholar] [CrossRef]
- Kalantari, A.; Galiana, F.D. The impact of wind power variability and curtailment on ramping requirements. In Proceedings of the 2010 IEEE/PES Transmission and Distribution Conference and Exposition: Latin America (T&D-LA), Sao Paulo, Brazil, 8–10 November 2010; pp. 133–138. [Google Scholar]
- Bae, H.; Tsuji, T.; Oyama., T.; Uchida, K. Frequency regulation method with congestion management using renewable energy curtailment. In Proceedings of the 2016 IEEE Power and Energy Society General Meeting (PESGM), Boston, MA, USA, 17–21 July 2016; pp. 1–5. [Google Scholar]
- Wang, Y.; Lou, S.; Wu, Y.; Wang, S. Flexible Operation of Retrofitted Coal-Fired Power Plants to Reduce Wind Curtailment Considering Thermal Energy Storage. IEEE Trans. Power Syst. 2020, 35, 1178–1187. [Google Scholar] [CrossRef]
- Zhang, X.; Che, L.; Shahidehpour, M.; Alabdulwahab, A.; Abusorrah, A. Electricity-Natural Gas Operation Planning With Hourly Demand Response for Deployment of Flexible Ramp. IEEE Trans. Sustain. Energy 2016, 7, 996–1004. [Google Scholar] [CrossRef]
- Chen, X.; Kang, C.; O’Malley, M.; Xia, Q.; Bai, J.; Liu, C.; Sun, R.; Wang, W.; Li, H. Increasing the Flexibility of Combined Heat and Power for Wind Power Integration in China: Modeling and Implications. IEEE Trans. Power Syst. 2015, 30, 1848–1857. [Google Scholar] [CrossRef]
- Richter, M.; Möllenbruck, F.; Obermüller, F.; Knaut, A.; Weiser, F.; Lens, H.; Lehmann, D. Flexibilization of steam power plants as partners for renewable energy systems. In Proceedings of the 2016 Power Systems Computation Conference (PSCC), Genoa, Italy, 20–24 June 2016; pp. 1–8. [Google Scholar]
- Hu, J.; Wen, F.; Wang, K.; Huang, Y.; Salam, M. Simultaneous Provision of Flexible ramping product and demand relief by interruptible loads considering economic incentives. Energies 2018, 11, 46. [Google Scholar] [CrossRef] [Green Version]
- Sheha, M.; Mohammadi, K.; Powell, K. Solving the duck curve in a smart grid environment using a non-cooperative game theory and dynamic pricing profiles. Energy Convers. Manag. 2020, 11, 3102. [Google Scholar] [CrossRef]
- Nguyen, H.K.; Khodaei, A.; Han, Z. Distributed algorithms for peak ramp minimization problem in smart grid. In Proceedings of the 2016 IEEE International Conference on Smart Grid Communications (SmartGridComm), Sydney, NSW, Australia, 6–9 November 2016; pp. 174–179. [Google Scholar]
- Abrishambaf, O.; Faria, P.; Vale, Z. Ramping of Demand Response Event with Deploying Distinct Programs by an Aggregator. Energies 2020, 13, 1389. [Google Scholar] [CrossRef] [Green Version]
- Mediwaththe, C.P.; Smith, D.B. Game-Theoretic Electric Vehicle Charging Management Resilient to Non-Ideal User Behavior. IEEE Trans. Intell. Transp. Syst. 2018, 19, 3486–3495. [Google Scholar] [CrossRef] [Green Version]
- Vagropoulos, S.I.; Bakirtzis, A.G. Optimal Bidding Strategy for Electric Vehicle Aggregators in Electricity Markets. IEEE Trans. Power Syst. 2013, 28, 4031–4041. [Google Scholar] [CrossRef]
- Annamraju, A.; Nandiraju, S. Coordinated control of conventional power sources and PHEVs using jaya algorithm optimized pid controller for frequency control of a renewable penetrated power system. Prot. Control Mod. Power Syst. 2019, 4, 28. [Google Scholar] [CrossRef] [Green Version]
- Ko, K.S.; Han, S.; Sung, D.K. A New Mileage Payment for EV Aggregators with Varying Delays in Frequency Regulation Service. IEEE Trans. Smart Grid 2018, 9, 2616–2624. [Google Scholar] [CrossRef]
- Haghi, H.V.; Qu, Z. A Kernel-Based Predictive Model of EV Capacity for Distributed Voltage Control and Demand Response. IEEE Trans. Smart Grid 2018, 9, 3180–3190. [Google Scholar] [CrossRef]
- Cheng, L.; Chang, Y.; Huang, R. Mitigating Voltage Problem in Distribution System with Distributed Solar Generation Using Electric Vehicles. IEEE Trans. Sustain. Energy 2015, 6, 1475–1484. [Google Scholar] [CrossRef]
- Luo, X.; Xia, S.; Chan, K.W.; Lu, X. A Hierarchical Scheme for Utilizing Plug-in Electric Vehicle Power to Hedge Against Wind-Induced Unit Ramp Cycling Operations. IEEE Trans. Power Syst. 2018, 33, 55–69. [Google Scholar] [CrossRef]
- Zhang, B.; Kezunovic, M. Impact on Power System Flexibility by Electric Vehicle Participation in Ramp Market. IEEE Trans. Smart Grid 2016, 7, 1285–1294. [Google Scholar] [CrossRef]
- Zhang, X.; Hu, J.; Wang, H.; Wang, G.; Chan, K.W.; Qiu, J. Electric Vehicle Participated Electricity Market Model Considering Flexible Ramping Product Provisions. IEEE Trans. Ind. Appl. 2020. [Google Scholar] [CrossRef]
- Massier, T.; Melo, D.F.R. Integration of renewables in Singapore: Ramp rate support using electric vehicles. In Proceedings of the 2017 IEEE Innovative Smart Grid Technologies—Asia (ISGT-Asia), Auckland, New Zealand, 4–7 December 2017; pp. 1–6. [Google Scholar]
- Ko, K.S.; Sung, D.K. The Effect of EV Aggregators with Time-Varying Delays on the Stability of a Load Frequency Control System. IEEE Trans. Power Syst. 2018, 33, 669–680. [Google Scholar] [CrossRef]
- Nguyen, H.K.; Khodaei, A.; Han, Z. Incentive Mechanism Design for Integrated Microgrids in Peak Ramp Minimization Problem. IEEE Trans. Smart Grid 2018, 9, 5774–5785. [Google Scholar] [CrossRef]
- Baran, M.E.; Wu, F.F. Network reconfiguration in distribution systems for loss reduction and load balancing. IEEE Trans. Power Del. 1989, 4, 1401–1407. [Google Scholar] [CrossRef]
- Bruninx, K.; Pandžić, H.; Cadre, H.L.; Delarue, E. On the Interaction between Aggregators, Electricity Markets and Residential Demand Response Providers. IEEE Trans. Power Syst. 2020, 35, 840–853. [Google Scholar] [CrossRef]
- Huang, S.; Wu, Q.; Wang, J.; Zhao, H. A Sufficient Condition on Convex Relaxation of AC Optimal Power Flow in Distribution Networks. IEEE Trans. Power Syst. 2017, 32, 1359–1368. [Google Scholar] [CrossRef] [Green Version]
- Chen, X.; Leung, K. Non-Cooperative and Cooperative Optimization of Scheduling with Vehicle-to-Grid Regulation Services. IEEE Trans. Veh. Technol. 2020, 69, 114–130. [Google Scholar] [CrossRef]
- Wang, H.; Huang, J. Incentivizing Energy Trading for Interconnected Microgrids. IEEE Trans. Smart Grid 2018, 9, 2647–2657. [Google Scholar] [CrossRef] [Green Version]


| Charging Costs | Cluster 1 (RMB) | Cluster 2 (RMB) | Cluster 3 (RMB) |
|---|---|---|---|
| Under retail price | 128 | 177 | 323 |
| Proposed strategy | 118 | 171 | 290 |
| Reduction rate | 7.8% | 3.4% | 10.2% |
© 2020 by the authors. Licensee MDPI, Basel, Switzerland. This article is an open access article distributed under the terms and conditions of the Creative Commons Attribution (CC BY) license (http://creativecommons.org/licenses/by/4.0/).
Share and Cite
Zhang, J.; Che, L.; Wang, L.; K. Madawala, U. Game-Theory Based V2G Coordination Strategy for Providing Ramping Flexibility in Power Systems. Energies 2020, 13, 5008. https://doi.org/10.3390/en13195008
Zhang J, Che L, Wang L, K. Madawala U. Game-Theory Based V2G Coordination Strategy for Providing Ramping Flexibility in Power Systems. Energies. 2020; 13(19):5008. https://doi.org/10.3390/en13195008
Chicago/Turabian StyleZhang, Jin, Liang Che, Lei Wang, and Udaya K. Madawala. 2020. "Game-Theory Based V2G Coordination Strategy for Providing Ramping Flexibility in Power Systems" Energies 13, no. 19: 5008. https://doi.org/10.3390/en13195008