1. Introduction
The energy storing systems are commonly used in research focused on distribution system optimization [
1,
2,
3]. In those papers, energy storage is used as a support to distributed generation. Thanks to them, it is possible to store energy in the valley and use it in peaks of the demand. In most of this research, the Li-ion batteries are used due to their economic parameters [
4].
The solar photovoltaic (PV) arrays are commonly considered to be cost-beneficial devices and they are utilized for more applications. According to Reference [
5], photovoltaic cells were commonly used for charging nickel-cadmium batteries in space vehicles and in remote locations. Bhatti et al. [
6] conducted research on Photovoltaic-Electric Vehicle (PV-EV) charging including the power converter topologies, charging mechanisms, and control for both the PV-grid and PV-standalone/hybrid systems.
The PV arrays are also recognized as environmentally-friendly [
7] and sustainable [
8].
The PV arrays are scalable for a wide range of power and easy to integrate with many power converters [
9,
10]. The photovoltaic power generation system usually comprises together an inverter, dc-to-dc converter, and PV array. As far the classical inverter is concerned, it generates output voltage that is lower than the dc link voltage. The result is that the extent of the output transformer become greater and the efficiency of the overall system drops.
Usually, the PV array acts as a power source for electric energy storing system, as a utility grid or either mentioned. The efficiency of the photovoltaic apparatus is mainly influenced by the existence of the light. Despite the fact that the current is able to flow back from the bus into PV cells during the night, reverse current must be avoided due to a possibility of fire, vast damage, or leakage loss [
11]. The blocking diode effectively prevents reverse current flow.
According to Reference [
12], blocking diodes in a PV array block reverse currents and cannot be a substitute for an overcurrent protective device. The diodes voltage rating should be at least two times higher than the V
OCmax of the PV module or the PV string, while their current rating capacity should be at least 1.4 times higher than short circuit current short circuit current (ISC) of a single PV module or the parallel strings. The blocking diodes should be placed in boxes with an adequate degree of protection and be only available for trained service personnel. Blocking diodes are used to keep batteries from releasing in reverse through the solar panel boards during the evening or night [
13,
14].
According to Reference [
15], blocking diodes help prevent excess currents in parallel connected strings.
Nayar et al. [
14] described two lowering criteria for the cycle life of batteries in PV power systems, such as not a full charging and prolonged operation at a low state of charge. They mentioned that power output of the PV array is usually sampled at a definite sampling period and compared with the previous value. The standalone applications of PV arrays need the utilization of voltage source inverters, which can be of a single-phase or a three-phase type. Three switching techniques are commonly used, namely: square wave, quasi-square wave, and pulse-width modulation (PWM).
Verma et al. [
16] studied a solar PV power generation system for a standalone small residential load of 500 W. Therein, the dc output voltage from the PV array was boosted by the boost dc-dc converter. Such a converter regulated its output voltage independently on the solar radiation and temperature. The converter was regulated with the PWM method in order to safely charge the battery.
Afterward, the current and voltage of PV when selecting the power Metal-Oxide Semiconductor Field-Effect Transistors (MOSFETs) and driver are smoothened by a small capacitor [
17]. Verma et al. [
16] recommended the utilization of boost converter topology with the freewheel diode preventing current from flowing back. Due to the fact that the system should always follow the maximum power to increase the system efficiency, a maximum power point tracking (MPPT) scheme on the grounds of the perturbation and observation (P&O) tactic was proposed.
The photovoltaic as an infrequent source of power cannot satisfy the need for the load in a continuous manner. The set of batteries or other energy storages can improve the supply availability.
In order to provide safe operation of battery, according to Reference [
18], a basic charge controller monitors and holds the battery voltage between two limit levels. Commonly, the charge controller is characterized by the way it regulates charging current to a battery. In a shunt charge controller, charging current to a battery is limited by short-circuiting the PV array. Such short-circuiting moves the array’s operating point on the I-V curve near the short-circuit condition and limits the power output. A blocking diode in series between the battery and the shunt element prevents the short-circuiting of the battery. In a series charge controller, charging the current to the battery is limited by open circuiting the PV arrays. A switching element of the charge controller opens when the battery becomes fully charged. This moves the array’s operating point on the I-V curve to the open circuit condition and limits the power output. Most charge controllers use a transistor that passes current in one direction and prevents reverse current. The modern charged controllers usually operate in a three-stage charge cycle including bulk stage, absorption stage, and float stage.
As reported in Reference [
16], the 96-V dc voltage available at terminals of the storage battery was fed to a dc-to-ac boost converting it into 230 V rms, which was easily accessible without a transformer. This technique allowed for increasing system efficiency. The PV power generation system with the boost inverter [
19,
20] and a storage battery allowed achieving a dc-to-ac conversion without applying the step-up transformer.
The goal of the present study was to compare chosen electrical characteristics of two assemblies with each containing the same PV array, boost converter, boost inverter, and a different storage battery, namely, the Li-S one and the Li-ion one, respectively.
2. Differences Occurring during Modelling of Li-Ion and Li-S Batteries
According to Reference [
21], during battery modelling, it is necessary to estimate its State of Charge (SOC). The latter in Li-ion batteries is obtained by measuring flowing current in amperes and voltage reading. Under stable conditions of battery operation, its SOC is estimated based on a voltage measurement. Previously mentioned methods are inappropriate for Li-S batteries due to the shuttle effect of the current measurement and fail of voltage reading because of the probable non-linear character in the form of the two plateaus occurring.
Temperature also strongly affects the battery voltage and, accordingly, the usable capacity, power, SOC estimation, etc. The temperature influence on the voltage and lifespan of Li-ion batteries is well recognized and predictable [
22,
23].
The Li-S battery behaviour due to temperature is difficult to predict. Additionally, Li-S models should also assess the memory effect that is partially recognized in the Li-S case. The memory effect is an important factor for Li-S modelling as it influences the cycles above all in cold environments. The connection between OCV and temperature may differ significantly, which is contingent upon the previous cycles caused by the memory effect [
24]. The memory effect is inexistent in Li-ion batteries. Commonly, Li-S and Li-ion batteries models are characterized by the same factors.
In the case of instant response models, the use voltage, temperature, and Crate allows evaluation of the battery characteristic. Nevertheless, for battery aging and degradation of the cycle, models should consist of Depth of Discharge (DOD) and the effect of time. The mathematical models of batteries can be analytical and stochastic as well. In the first ones, the set of algebraic and eventually differential equations describes battery properties. Stochastic battery models are based on the principle of the discrete-time Markov chain, which allows for predicting the future of the process assumed from its present condition and without knowing its entire history.
Electrochemical models are very complex and need a high capacity of data processing [
25]. Hence, they are considered to not be convenient for EVs. The accuracy of the electrical circuit equivalent (ECN) models is enough and they have lower complexity. They are characterized by a fast response and, therefore, are suitable for automotive applications. The ECN model achieves better results for EV applications [
26]. Abbas Fotouhi et al. [
27] compared and analysed for both Li-ion and Li-S batteries, following three different modelling techniques, namely: mathematical, electrochemical, and ECN. The conclusion was that, despite the fact that electrochemical models have the potential to offer extreme accuracy, ECN models were more feasible for predicting the battery behaviour for EV applications. They are able to support parametrisation of different operating points so that it is possible to apply them for SOC estimation. Jiang et al. [
28] summarized the different Li-S models categorized by type and ordered per year. They found that mathematic models are the first used while developing the new chemistry. The first stage mentioned is carried out at cell level. For better understanding of the chemical reactions occurring internally, the electrochemical model seems to be more related. Because of the microprocessors’ computational limitations on board EVs, the battery models applied on EV should request relatively small computational resources. When the chemical performance of the battery is well recognized, simplified models, such as ECN ones, are the better options. The parameters determined with the application of ECN models are functional for parameters determination, such as State of Charge SOC, State of Health SOH, Voltage V, and the internal battery resistance, which are all required for the battery sizing in EVs [
29].
The ECN model uses elementary electrical components: resistors, capacitors, and voltage sources in a circuit. The essential configuration of an ECN battery model uses a circuit containing only one voltage source and one resistor simulating the internal battery resistance. Adding RC pairs to the model increases its accuracy by considering the battery polarization characteristics [
30]. It is needed to use the accurate parameterization of the elements of the ECN technique to achieve reliable results. The widely used techniques for the ECN elements parametrization are pulse-based methods [
31,
32] and the electrochemical impedance spectroscopy (EIS) [
22,
33,
34,
35,
36,
37,
38].
Li-ion and Li-S batteries differ from each other. The voltage profile is materially different between charge and discharge. Models for Li-ion batteries are not transferable to models for Li-S batteries because of the differences in their performance [
21].
3. Methods
Photovoltaic Panel Model
A PV cell consisted of the semiconductor material converting the solar radiation into the dc current by using the photovoltaic effect. The solar cell was being described by the I-V characteristic. The PV module was formed thanks to the connection of 36 solar cells in series.
For required output voltage and current, the analysed PV power generation system, further called PV array, consisted of five modules connected in parallel and three modules connected subsequently. The electrical equivalent circuit of the PV module was shown in
Figure 1. A general formula describing the dependence between voltage (
V) and current (
I) was given by Equation (1) [
16].
where:
, —parameters representing the number of cells connected in parallel and in series, respectively,
, —parallel and series resistances of the PV module,
I—the output current of the PV module,
V—the output voltage of the PV module,
K = 1.38 × 10⁻²³ K−1—the Boltzmann constant,
q—the charge on an electron,
A—the ideal factor determining the characteristic discrepancy of an ideal p-n junction,
—the reverse saturation current dependent on the module temperature,
—photo-current generated by solar radiation.
The magnitude of power
P developed from the PV array is obtained from Equation (2) [
12].
The maximum power condition can be obtained from condition (3) [
12].
Equation (1) modelled the I-V curve of the PV module and a multiplication of both magnitudes gave the supplied power P as given in Equation (2).
4. The Boost Converter
The boost converter, with the output voltage higher than the input one, used voltage in this system that was of the same design as the one described in Reference [
16]. In the implementation of the boost converter, a diode and a Metal-Oxide-Semiconductor Field-Effect Transistor (MOSFET) was utilized. A dc-dc converter output was connected in series with a photovoltaic panel for high efficiency. It was assumed that the switching frequency
Fsw of the converter was equal to 50 kHz. Output current ripple Δ
i1 and voltage ripples Δ
v were equal to 10% and 5%, respectively.
The duty cycle
D of a boost converter is obtained from Equation (4) [
16].
where:
—the input voltage of the boost converter, which is the output of the PV array. It was assumed that the varied between 58–64 Volts.
—the output voltage of the boost converter that is constant and equal to 96 V.
From Equation (4), duty cycle
D varies between 33–39%. The inductance L of the boost converter inductor is obtained from Equation (5) [
12].
where:
Vin = VPV—the output voltage from the PV array,
Δi1—the output current ripple. It was assumed that the value of Δi1 was equal to 5%,
Fsw = 50 kHz—the assumed switching frequency.
The magnitude of inductance
L obtained from Equation (5) was equal to 2.12 mH. The capacitance of the boost converter output capacitor was obtained from Equation (6) [
16].
where:
I0 = 5.2 A—the assumed output current,
ΔV = 10%—the assumed output voltage ripple.
The value of output capacitance C2 obtained from Equation (6) was equal to 343 μF.
The output of the PV array was connected to a dc-dc converter boosting the voltage of the PV array from 63.5 V to 96 V.
The general view of the MATLAB/SIMULINK model (MathWorks, Inc. Natick, MA, USA) of a boost converter in the company with its control scheme was presented in
Figure 2.
The dc-to-dc converter was accountable for the output voltage regulation at the peak power point. It was also supplying a constant voltage so as to charge a battery. To regulate the boost converter output voltage, the Pulse Width Modulation (PWM) control was arranged. For the generation of the MOSFET gating pulse to the PI controller, there was an error voltage given between the reference value and converter output voltage. Then that error voltage was compared by using the comparator to a repetitive sequence wave of switching frequency. Then an ON/OFF generated pulse controlled the dc-to-dc converter [
39].
A Proportional Integral Voltage Controller
The proportional-integral controller PI produced a set of two output signals—the first one proportionate to the voltage error signal and the second one proportional to the error signal integral.
The PI controller output was determined from Equation (7) [
12].
where:
= 0.015—the assumed proportional gain,
e(t)—voltage error signal between boost converter output voltage and reference voltage,
ti—integral time.
The proportional action enlarges the loop gain and decreases the sensitivity of the system for the variations of its parameters. Integral action limits or even eliminates the steady state error.
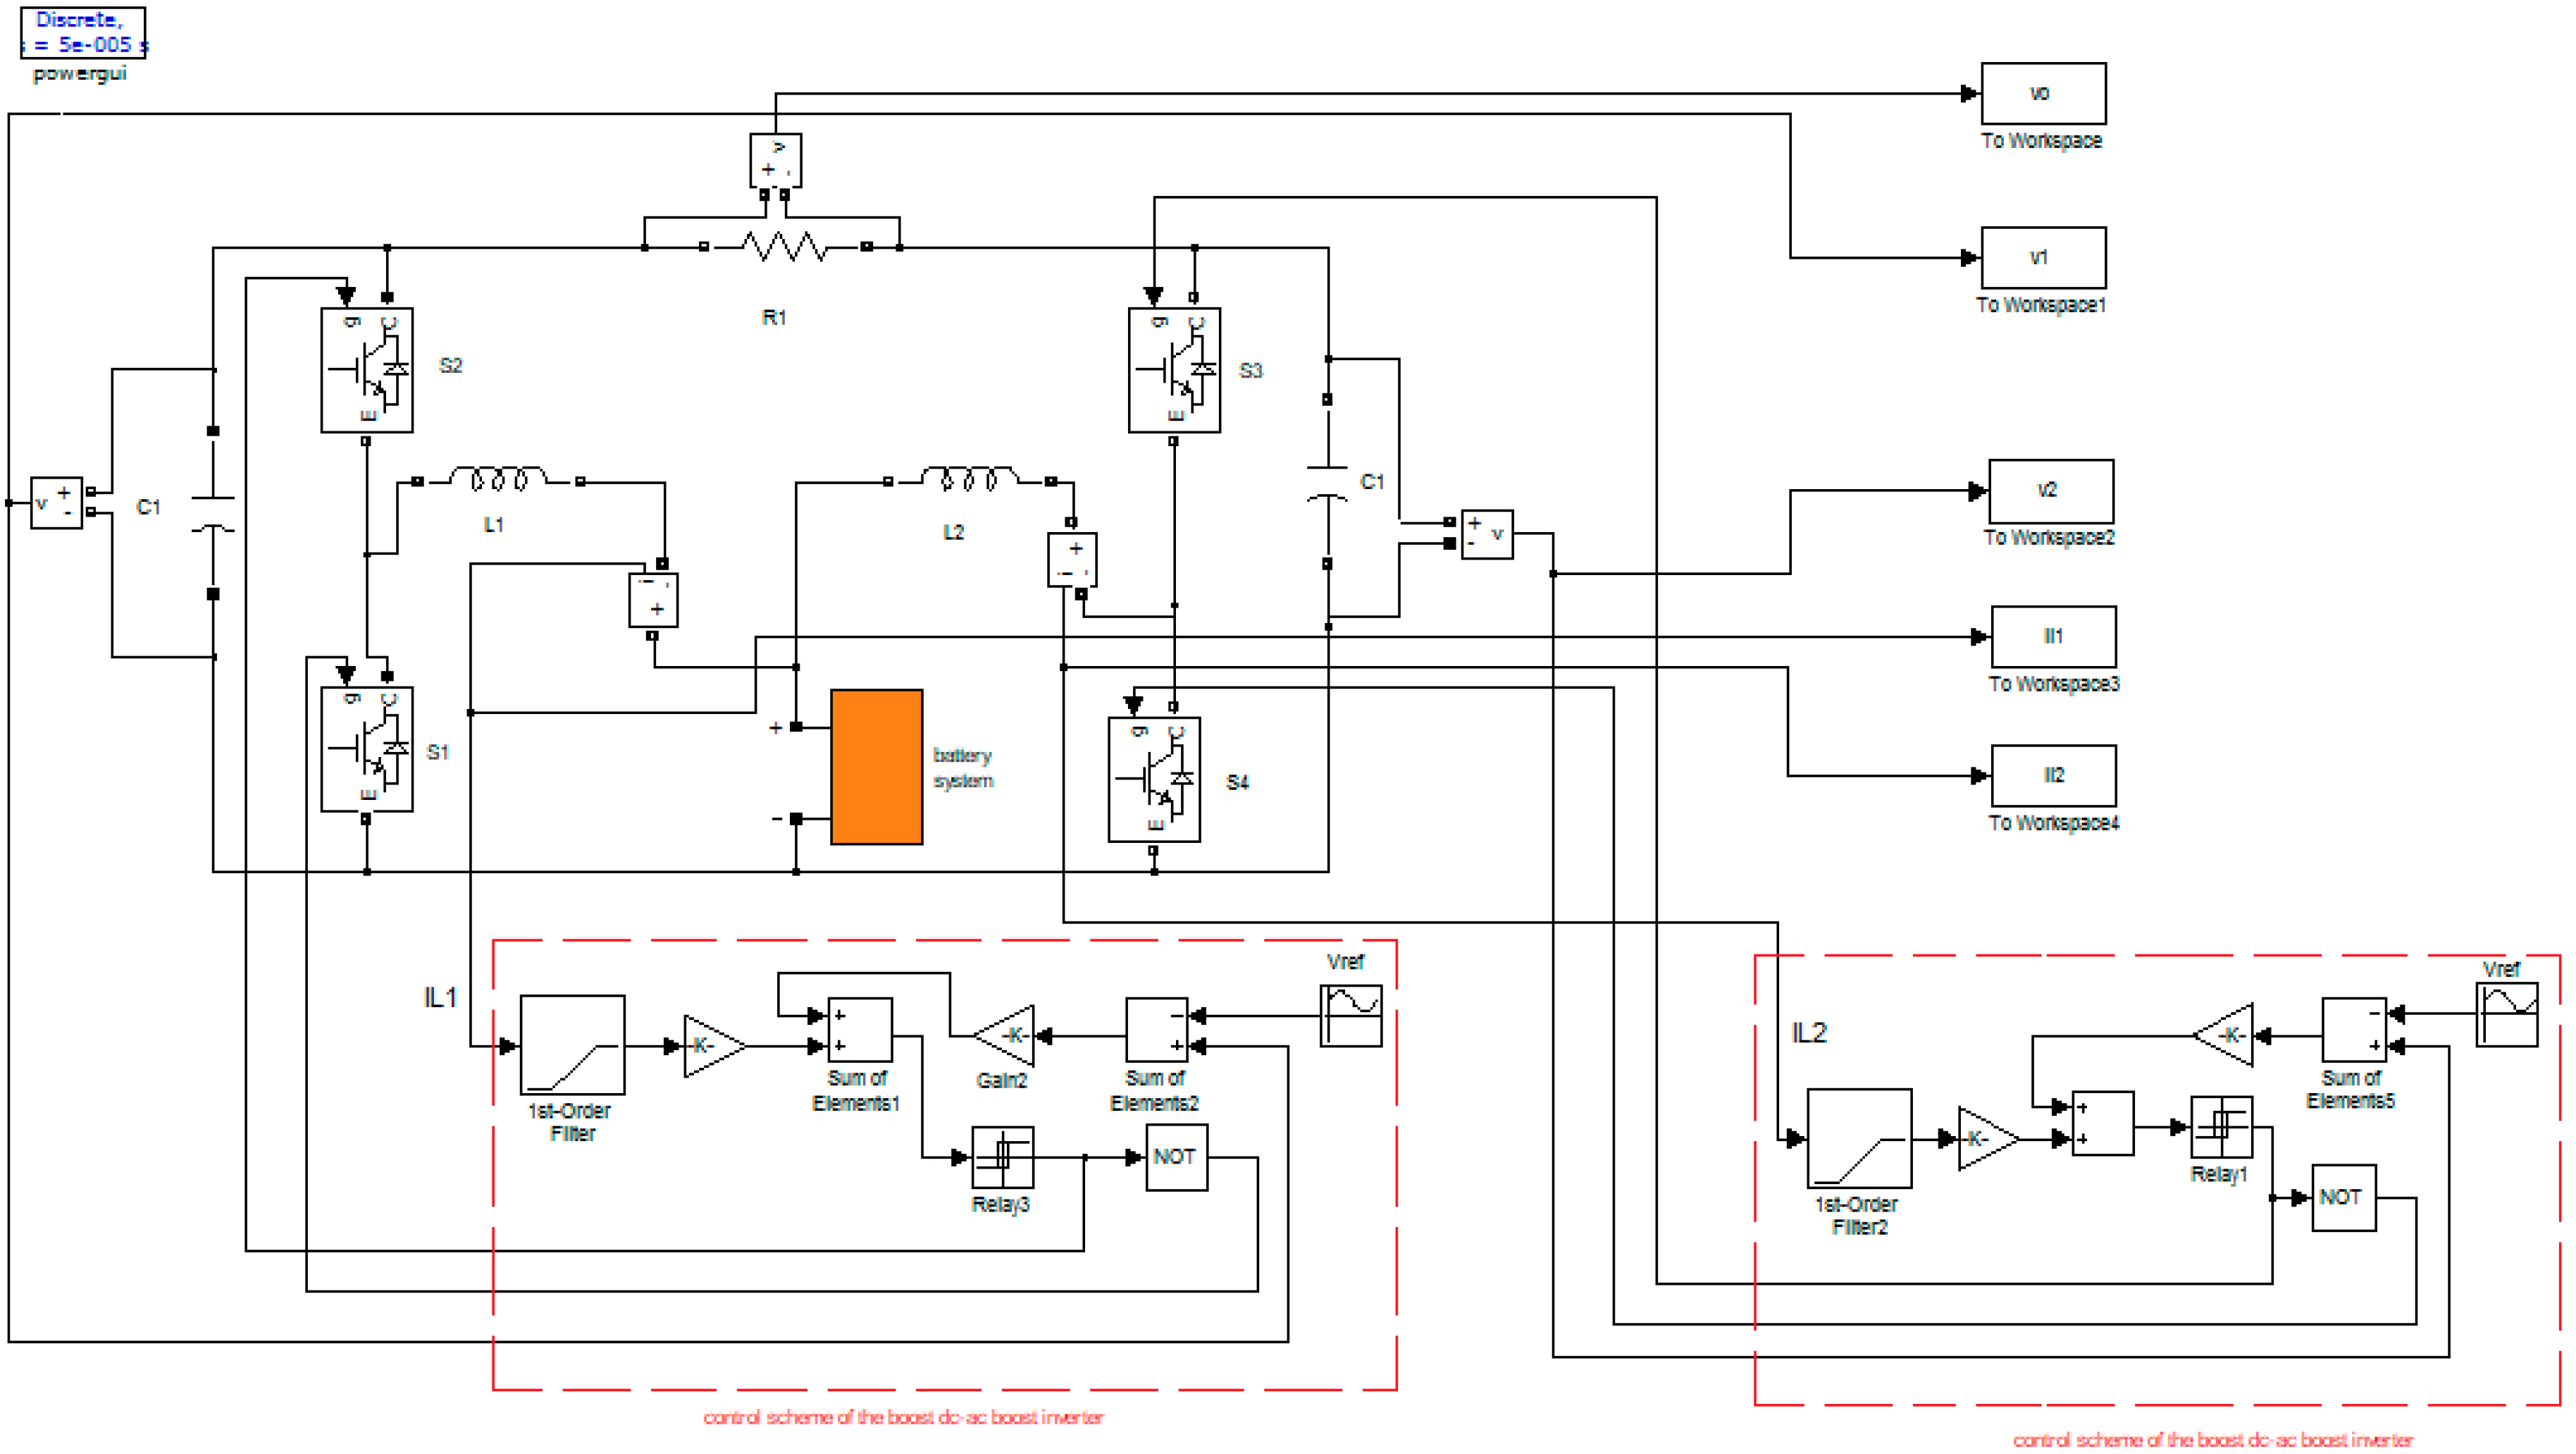
5. The Boost Inverter
The boost inverter used in this system was of the same design as the one described in Reference [
16]. Such an inverter consisted of two individual dc-dc boost converters. Those converters were driven by two 180° phase-shifted dc-biased sinusoidal references with a differential output in the form of an ac output voltage [
40,
41]. The MATLAB/SIMULINK model of the analyzed boost inverter was shown in
Figure 3. That model presents the boost converters controlled by a sliding mode control scheme. That dc-to-ac boost inverter was designed for a power of 500 W, single phase, 230 V, and 50 Hz residential load, as assumed for the standard camper installation and devices therein. The dc link voltage equal to 96 V from a battery was converted to a 230 V rms with 50 Hz output to feed different types of loads. The boost dc-ac inverter generated an ac output voltage from a lower dc input voltage in a single power stage. That boost inverter achieved dc-ac conversion due to the differential connection of the load across two dc-dc converters A and B and adjustment of the dc-dc converter output voltage in the sinusoidal manner. The first converter A generated the output voltage
V1 while the second converter B generated the output voltage
V2. The load was differentially connected across these converters with regard to the ground. In effect, one got differential ac voltage
V1-
V2 across the load.
The conduction mode was given by Equation (8) [
16].
where:
V1—the voltage across capacitor C1,
Vin—the input voltage to boost the inverter.
Since, two converters are 180° out of phase, the output voltage was obtained from Equations (9) and (10) [
12].
A Control Technique for the Boost Inverter
In order to optimize the dynamics, a sliding mode control was applied in order to control the boost inverter [
16]. The boost dc-ac converter included dc link voltage
Vin, input inductors
L1 and
L2, power switches S
1–S
4, transfer capacitors C
1 and C
2, freewheeling diodes D
1–D
4, and load resistance R
L. The controllers A and B allowed the capacitors voltages
V1 and
V2 to follow sinusoidal reference accurately. The equation describing the sliding surface in the state space was determined by the linear combination of a state variable error in the following form (11) [
16].
where:
K1, K2—the gains,
ε1,
ε2—feedback current and voltage error, respectively, given by Equations (12) and (13) [
16].
By substituting Equations (12) and (13) in Equation (11), we obtained the signal function given by Equation (14) [
16].
The system nature was entirely determined by coefficients K1 and K2, which were limited to the existence satisfaction, stability assurance, and quick response, even in the case of a huge supply and load alternations. The signal obtained from Equation (14) was fed to a hysteresis loop, which controlled control the semiconductor device by the generation of the pulse.
6. The Li-ion Battery Model
The energy from the photovoltaic panel is not available for 24 h per day. When the sun sets, the load is provided by a battery system storing the additional power generated under the increased solar radiation.
The battery system was modelled using the Thevenin’s equivalent model [
42,
43] containing the
Rs equivalent resistance (external + internal) of parallel/series combination of a battery with an assumed small value of
Rs = 0.01 Ω. The parallel circuit of
Rb and
Cb described the stored energy and voltage during charging or discharging.
Rb in parallel with
Cb represented self-discharging of the battery (
Figure 4).
The energy
Ebat stored in the battery was given in kWh when a capacitor modelled the battery unit. The value of capacitance
Cb was obtained from Equation (15) [
16].
where:
Vocmax—the maximum voltage at the terminals of the battery under a full charged state,
Vocmin—the minimum voltage at the terminals of the battery under a full discharged state.
Since the self-discharging current of a battery was small, the resistance Rb with the assumed large value of Rb = 10 kΩ was used. The battery was assumed to have a supply of 500 W for 8 h of peaking capacity, while the voltage of order varied from 85.6 V to 101.6 V. The calculated value of Cb for that battery from Equation (15) was equal to Cb = 9615.38 F.
7. The Li-S Battery Model
The model was similar to the one of a Li-ion battery. However, its parameters depended on the SOC, as described in Reference [
28].
To develop the lithium-sulphur battery characteristic, the consistent circuit model was utilized. The first-order RC steady circuit model was chosen due to its relatively good matching ability with a very simple structure. As shown in
Figure 4, the RC network was added to the internal resistance model for the diffusion process simulation and the electrochemical reaction occurring inside the lithium-sulphur battery. Regarding the Kirchhoff’s voltage law, the capacitance-voltage was chosen as the state variable and the state space equations was presented by Equations (16) and (17) [
28].
where:
Vb—the battery’s terminal voltage,
Voc—the battery’s open circuit voltage (OCV),
ib—the load current,
Rs—the internal resistance involving the contact resistance and charge transfer resistance,
Rp—the equivalent polarization resistance,
Cp—the equivalent polarization capacitance, respectively.
The course of voltage
VOC versus SOC of Li-S battery for charging and discharging processes was presented in
Figure 5. Similarly,
Figure 6,
Figure 7, and
Figure A1 presented courses of resistances
Rs and
Rp as well as capacitance
Cp, respectively.
8. Results and Discussion
The I-V curves and the P-V curves obtained for the analysed PV array were shown in
Figure 6 for the temperature of 25 °C and three values of the incident irradiances: 0.1, 0.5, and 1 kW/m
2, respectively. Similar curves for the incident irradiance were equal to 1 kW/m
2 and for two values of temperature: 25 °C and 45 °C, respectively. These values were presented in
Figure 7. The shape of each curve depends on the temperature of the cell and the incident irradiance. Each I-V curve presented a maximum power point (MPP) for an optimal application of the PV array. The MPPT was obtained from Equation (2), which provided requirements included in Equation (3). The two supplementary crucial points of each I-V curve are the following.
- -
the open circuit voltage Voc representing the maximum voltage given by the non-loaded array,
- -
the short-circuit current Isc representing a maximum removable current of the array.
The operating point at which the PV array are able to provide maximum power, assuming specified radiation intensity, was close to the characteristic bend. It can be noticed that the PV array behaved more like a current source from the left of the MPP, and more like a voltage source from the right of the MPP.
All curves of incident irradiation, a specific voltage (optimum voltage) occurred for which the PV array operated at a convenient maximum power point. Since the loads which are supplied by the PV system usually operated under constant voltage, you needed to control the maximum power point tracking (MPPT) condition of the PV array for each load voltage.
9. Conclusions
During simulation of the model including boost inverter and the storage battery, only small differences occurred in the courses of currents
IL1 and
IL2 versus time between cases of the Li-ion battery and the Li-S one. The courses of voltages
V0,
V1,
V2, and current
I0 versus time were the same. During simulation of the model including the boost converter, the values of voltages
V0 and
Vd were 2% higher and 2% lower, respectively, for the Li-S battery when compared to these for the Li-ion battery. The variabilities of voltages
V0 and
Vd and of current
I0 for Li-S battery were significantly lower when compared to these for the Li-ion battery. The values of currents
I0 and
IL and of voltage
Vs were very close for both kinds of batteries. Therefore, during short time co-operation of Li-S battery with the analysed set of PV array, the boost converter and boost inverter have no significant changes in performances of the mentioned set in comparison to the case of the Li-ion battery. However, for deep decrease of SOC of the battery, such changes can become more visible. This kind of electrical storage batteries solutions can be use in different kind of PV systems [
44,
45,
46] and in some cars [
47].
Author Contributions
K.S. (Krystian Siczek), P.P., S.S., Ł.A., W.Z., K.S. (Krzysztof Siczek) and P.K. Methodology, P.P., A.O., and P.K. Software, K.S. (Krystian Siczek), P.P., S.S., G.B., K.S. (Krzysztof Siczek) and P.K. Validation, K.S. (Krystian Siczek), S.S., Ł.A., A.O., K.S. (Krzysztof Siczek) and W.Z. Formal analysis, K.S. (Krystian Siczek), P.P., Ł.A., S.S., and A.O., K.S. (Krzysztof Siczek). Investigation, K.S. (Krystian Siczek), S.S., Ł.A., A.O., and W.Z. Resources, S.S. and P.P. Data curation, K.S. (Krystian Siczek), S.S., Ł.A., A.O., and W.Z. Writing—original draft preparation, K.S. (Krystian Siczek), S.S., Ł.A., A.O., and W.Z. Writing—review and editing, K.S. (Krystian Siczek), S.S., Ł.A., A.O., and W.Z. Visualization, K.S. (Krystian Siczek), S.S., and A.O. Supervision, K.S. (Krystian Siczek), P.P., S.S., and A.O. Project administration, K.S. (Krystian Siczek), P.P., and S.S. K.S. (Krzysztof Siczek). Funding acquisition, K.S. (Krystian Siczek), S.S., Ł.A., A.O., and W.Z. All authors have read and agreed to the published version of the manuscript.
Funding
This research received no external funding.
Conflicts of Interest
The authors declare no conflict of interest.
Appendix A
For the Li-ion battery cooperating with the boost inverter, the obtained performances (courses of voltages
V0,
V1,
V2, and currents
IL1,
IL2,
I0 versus time) were presented in
Figure A1a–f. For the Li-S battery, the similar obtained performances were shown in
Figure A2a–f. Only small differences were observed for the courses of currents
IL1 and
IL2 versus time between cases of the Li-ion battery and the Li-S one. The other courses, such as voltages
V0,
V1,
V2, and current
I0 versus time were visually the same.
Figure A1.
The performances (courses of voltages V0, V1, V2, and currents IL1, IL2, I0 versus time) for the Li-ion battery cooperating with the boost inverter. (a) V0; (b) V1; (c) V2; (d) IL1; (e) IL2; (f) I0.
Figure A1.
The performances (courses of voltages V0, V1, V2, and currents IL1, IL2, I0 versus time) for the Li-ion battery cooperating with the boost inverter. (a) V0; (b) V1; (c) V2; (d) IL1; (e) IL2; (f) I0.
Figure A2.
The performances (courses of voltages V0, V1, V2, and currents IL1, IL2, I0 versus time) for the Li-S battery cooperating with the boost inverter. (a) V0; (b) V1; (c) V2; (d) IL1; (e) IL2; (f) I0.
Figure A2.
The performances (courses of voltages V0, V1, V2, and currents IL1, IL2, I0 versus time) for the Li-S battery cooperating with the boost inverter. (a) V0; (b) V1; (c) V2; (d) IL1; (e) IL2; (f) I0.
The courses of voltage
V0, currents
I0,
IL, and voltages
Vc,
Vd, vs. versus time obtained from the simulation for the boost converter are presented in
Figure A3a–f for the case of Li-ion battery, and in
Figure A4a–f for the case of the Li-S battery. The obtained values of voltage
V0 for the Li-S battery was about 2% higher than these for the Li-ion battery. The variability of voltage
V0 for the Li-S battery was significantly lower than in the case of the Li-ion battery. The values of current
I0 were very close for both kinds of batteries. However, the variability of current
I0 for the Li-S battery was significantly lower than in the case of Li-ion battery courses. The courses of current
IL were almost the same for both kinds of batteries. The obtained values of voltage
Vd for the Li-S battery was about 2% lower than these for the Li-ion battery. The variability of voltage
Vd for Li-S battery was significantly lower than in the case of the Li-ion battery. The courses of voltage were the same for both kinds of batteries.
Figure A3.
The courses of voltage V0, currents I0, IL, and voltages Vc, Vd, and Vs versus time for the boost converter for the Li-ion battery, (a) V0; (b) I0; (c) IL; (d) Vc; (e) Vd (f) Vs.
Figure A3.
The courses of voltage V0, currents I0, IL, and voltages Vc, Vd, and Vs versus time for the boost converter for the Li-ion battery, (a) V0; (b) I0; (c) IL; (d) Vc; (e) Vd (f) Vs.
Figure A4.
The courses of voltage V0, currents I0, IL, and voltages Vc, and Vd, versus time for the boost converter for the Li-S battery, (a) V0; (b) I0; (c) IL; (d) Vc; (e) Vd; (f) Vd.
Figure A4.
The courses of voltage V0, currents I0, IL, and voltages Vc, and Vd, versus time for the boost converter for the Li-S battery, (a) V0; (b) I0; (c) IL; (d) Vc; (e) Vd; (f) Vd.
References
- Andrychowicz, M. Comparison of the Use of Energy Storages and Energy Curtailment as an Addition to the Allocation of Renewable Energy in the Distribution System in Order to Minimize Development Costs. Energies 2020, 13, 3746. [Google Scholar] [CrossRef]
- Jamian, J.; Mustafa, M.; Mokhlis, H.; Baharudin, M. Simulation study on optimal placement and sizing of battery switching station units using Artificial Bee Colony algorithm. Electr. Power Energy Syst. 2014, 55, 592–601. [Google Scholar] [CrossRef]
- Zheng, Y.; Dong, Z.; Luo, F. Optimal allocation of energy storage system for risk mitigation of discos with high renewable penetrations. IEEE Trans. Power Syst. 2014, 21, 212–220. [Google Scholar] [CrossRef]
- Lazard’s Levelized Cost of Storage Analysis—Version 4.0. 2018. Available online: https://www.lazard.com/media/450774/lazards-levelized-cost-of-storage-version-40-vfinal.pdf (accessed on 14 July 2020).
- Section 3—Sealed Nickel-Cadmium Cells and Batteries. In EDN Series for Design Engineers, Rechargeable Batteries Applications Handbook; 1998; pp. 35–151. Available online: https://www.sciencedirect.com/science/article/pii/B9780750670067500048 (accessed on 14 July 2020). [CrossRef]
- Bhatti, A.R.; Salam, Z.; Junaidi, M.B.; Aziz, A.; Yee, K.P.; Ashique, R.H. Electric vehicles charging using photovoltaic: Status and technological review. Renew. Sustain. Energy Rev. 2016, 54, 34–47. [Google Scholar] [CrossRef]
- Terashima, K.; Sato, H.; Ikaga, T. Development of an environmentally friendly PV/T solar panel. Solar. Energy 2020, 199, 510–520. [Google Scholar] [CrossRef]
- Fthenakis, V. Sustainability of photovoltaics: The case for thin-film solar cells. Renew. Sustain. Energy Rev. 2009, 13, 2746–2750. [Google Scholar] [CrossRef] [Green Version]
- Tan, C.W.; Green, T.C.; Hernandez-Aramburo, C. An Improved Maximum Power Point Tracking Algorithm with Current-Mode Control for Photovoltaic Applications. In 2005 International Conference on Power Electronics and Drives Systems; IEEE: Piscataway, NJ, USA, 2005; Volume 1, pp. 489–494. [Google Scholar] [CrossRef]
- Castellanos, S.; Sunter, D.A.; Kammen, D.M. Rooftop solar photovoltaic potential in cities: How scalable are assessment approaches? Environ. Res. Lett. 2017, 12, 125005. [Google Scholar] [CrossRef]
- Wiles, J.C.; King, D.L. Blocking diodes and fuses in low-voltage PV systems. In Conference Record of the Twenty Sixth IEEE Photovoltaic Specialists Conference-1997; IEEE: Piscataway, NJ, USA, 1997; pp. 1105–1108. Available online: https://www.osti.gov/servlets/purl/548686 (accessed on 14 July 2020).
- Kyritsis, A.; Papanikolaou, N.; Christodoulou, C.; Gonos, I.; Tselepis, S. Chapter II-3-C—Installation Guidelines: Electrical. In McEvoy’s Handbook of Photovoltaics, 3rd ed.; Kalogirou, S.A., Ed.; Academic Press: Cambridge, MA, USA, 2018; pp. 891–914. [Google Scholar] [CrossRef]
- Saravanan, S.; Kumar, R.S.; Prakash, A.; Chinnadurai, T.; Tiwari, R.; Prabaharan, N.; Babu, B.C. Chapter 8—Photovoltaic array reconfiguration to extract maximum power under partially shaded conditions. In Distributed Energy Resources in Microgrids; Chauhan, R.K., Chauhan, K., Eds.; Academic Press: Cambridge, MA, USA, 2019; pp. 215–241. [Google Scholar] [CrossRef]
- Nayar, C.V.; Islam, S.M.; Dehbonei, H.; Tan, K.; Sharma, H. Chapter 1—Power Electronics for Renewable Energy Sources. In Alternative Energy in Power Electronics; Rashid, M.H., Ed.; Butterworth-Heinemann: Oxford, UK, 2011; pp. 1–79. [Google Scholar] [CrossRef]
- Castañer, L.; Bermejo, S.; Markvart, T.; Fragaki, K. Chapter IIA-2—Energy Production by a PV Array. In Practical Handbook of Photovoltaics, 2nd ed.; McEvoy, A., Markvart, T., Castañer, L., Eds.; Academic Press: Cambridge, MA, USA, 2012; pp. 645–658. [Google Scholar] [CrossRef]
- Verma, A.K.; Singh, B.; Kaushik, S.C. An Isolated Solar Power Generation Using Boost Converter and Boost Inverter. Int. J. Eng. Inf. Technol. 2010, 2, 101–108. [Google Scholar]
- Xiao, W.; Ozog, N.; Dunford, W.G. Topology study of photovoltaic interface for maximum power point tracking. IEEE Trans. Ind. Electron. 2007, 54, 1696–1704. [Google Scholar] [CrossRef]
- Qazi, S. Chapter 2—Fundamentals of Standalone Photovoltaic Systems. In Standalone Photovoltaic (PV) Systems for Disaster Relief and Remote Areas; Qazi, S., Ed.; Elsevier: Amsterdam, The Netherlands, 2017; pp. 31–82. [Google Scholar] [CrossRef]
- Cáceres, R.O.; Barbi, I. A Boost dc–ac converter: Analysis, design and experimentation. IEEE Trans. Power Electron. 1999, 14, 134–141. [Google Scholar] [CrossRef]
- Ilango, G.S.; Rao, P.S.; Karthikeyan, A.; Nagamani, C. Single-stage sinewave inverter for an autonomous operation of solar photovoltaic energy conversion system. Renew. Energy 2010, 35, 275–282. [Google Scholar] [CrossRef]
- Benveniste, G.; Rallo, H.; Canals, C.L.; Merino, A.; García, B. Comparison of the state of Lithium-Sulphur and Lithium-ion batteries applied to electromobility. J. Environ. Manag. 2018, 226, 1–12. [Google Scholar] [CrossRef] [PubMed] [Green Version]
- Lin, X.; Perez, H.E.; Mohan, S.; Siegel, J.B.; Stefanopoulou, A.G.; Ding, Y.; Castanier, M.P. A lumped-parameter electro-thermal model for cylindrical batteries. J. Power Sources 2014, 257, 1–11. [Google Scholar] [CrossRef]
- Canals Casals, L.; Amante García, B.; González Benítez, M.M. Aging Model for Re-used Electric Vehicle Batteries in Second Life Stationary Applications. In Project Management and Engineering Research; Ayuso Muñoz, J.L., Ed.; Springer: Cham, Switzerland, 2017; pp. 139–151. [Google Scholar] [CrossRef]
- Propp, K.; Marinescu, M.; Auger, D.J.; Neill, L.O.; Fotouhi, A.; Somasundaram, K.; Offer, G.J.; Minton, G.; Longo, S.; Wild, M.; et al. Multi-temperature state-dependent equivalent circuit discharge model for lithium-sulfur batteries. J. Power Sources 2016, 328, 289–299. [Google Scholar] [CrossRef] [Green Version]
- Rong, P.; Pedram, M. An analytical model for predicting the remaining battery capacity of lithium-ion batteries. Proc. Des. Autom. Test Eur. 2003, 14, 1148–1149. [Google Scholar] [CrossRef]
- He, H.; Xiong, R.; Guo, H.; Li, S. Comparison study on the battery models used for the energy management of batteries in electric vehicles. Energy Convers. Manag. 2012, 64, 113–121. [Google Scholar] [CrossRef]
- Fotouhi, A.; Auger, D.J.; Propp, K.; Longo, S.; Wild, M. A review on electric vehicle battery modelling: From Lithium-ion toward Lithium-Sulphur. Renew. Sustain. Energy Rev. 2016, 56, 1008–1021. [Google Scholar] [CrossRef] [Green Version]
- Jiang, J.; Liang, Y.; Ju, Q.; Zhang, L.; Zhang, W.; Zhang, C. An Equivalent Circuit Model for Lithium-Sulfur Batteries, the 8th International Conference on Applied Energy—ICAE2016. Energy Procedia 2017, 105, 3533–3538. [Google Scholar] [CrossRef]
- Knap, V.; Stroe, D.I.; Teodorescu, R.; Swierczynski, M.; Stanciu, T. Comparison of parametrization techniques for an electrical circuit model of Lithium-Sulfur batteries. In 2015 IEEE 13th International Conference on Industrial Informatics (INDIN); IEEE: Piscataway, NJ, USA, 2015; pp. 1278–1283. [Google Scholar] [CrossRef] [Green Version]
- Fotouhi, A.; Shateri, N.; Auger, D.J.; Longo, S.; Propp, K. A MATLAB Graphical User Interface for Battery Design and Simulation; From Cell Test Data to Real-World Automotive Simulation. In Proceedings of the 13th International Conference on Synthesis, Modeling, Analysis and Simulation Methods and Applications to Circuit Design (SMACD), Lisbon, Portugal, 27–30 June 2016. [Google Scholar]
- Stroe, D.-I.; Swierczynski, M.; Stroe, A.-I.; Knudsen Kær, S. Generalized Characterization Methodology for Performance Modelling of Lithium-Ion Batteries. Batteries 2016, 2, 37. [Google Scholar] [CrossRef] [Green Version]
- Wagner, N.; Eneli, H.; Ballauff, M.; Friedrich, K.A. Correlation of capacity fading processes and electrochemical impedance spectra in lithium/sulfur cells. J. Power Sources 2016, 323, 107–114. [Google Scholar] [CrossRef] [Green Version]
- Daowd, M.; Omar, N.; Verbrugge, B.; Van Den Bossche, P.; Van Mierlo, J. Battery Models Parameter Estimation based on Matlab/Simulink®. In Proceedings of the 25th Electric Vehicle Symposium (EVS-25), Shenzhen, China, 5 November 2010; Volume 2, pp. 1–6. [Google Scholar]
- Hentunen, A.; Lehmuspelto, T.; Suomela, J. Time-domain parameter extraction method for thevenin-equivalent circuit battery models. IEEE Trans. Energy Convers. 2014, 29, 558–566. [Google Scholar] [CrossRef]
- Hu, X.; Sun, F.; Cheng, X. Recursive calibration for a lithium iron phosphate battery for electric vehicles using extended Kalman filtering. J. Zhejiang Univ. A 2011, 12, 818–825. [Google Scholar] [CrossRef]
- Sun, L.; Zhao, Q.; Xiang, J.; Shi, J.; Wang, L.; Hu, S.; Su, S. Adsorption of NO and NH3 over CuO/γ-Al2O3 catalyst by DRIFTS. J. Chem. Ind. Eng. Soc. China 2009, 60, 444–449. [Google Scholar] [CrossRef]
- Thanagasundram, S.; Arunachala, R.; Makinejad, K.; Teutsch, T.; Jossen, A. A Cell Level Model for Battery Simulation. In Proceedings of the European Electric Vehicle Congress, Brussels, Belgium, 20–22 November 2012; pp. 1–6. [Google Scholar]
- Stroe, D.I.; Knap, V.; Swierczynski, M.; Schaltz, E. Electric circuit modeling of lithium-sulfur batteries during discharging state. In IEEE Energy Conversion Congress and Exposition (ECCE); IEEE: Piscataway, NJ, USA, 1 January 2017; pp. 1024–1029. [Google Scholar] [CrossRef] [Green Version]
- Power Electronics: Converters, Applications, and Design, 3rd ed.; Mohan, N.; Undeland, T.M.; Robbins, W.P. (Eds.) John Wiley & Sons, Inc.: Hoboken, NJ, USA, 2002; 832p. [Google Scholar]
- Cáceres, R.; Barbi, I. A Boost DC-AC converter: Operation, analysis, control and experimentation. In Proceedings of the IEEE IECON’95 Conference, Orlando, FL, USA, 5–11 November 1995; pp. 546–551. [Google Scholar]
- Kazimierczuk, M.K. Synthesis of phase modulated dc/ac inverters and dc/dc converters. In IEE proceedings B (Electric Power Applications); IET Digital Library: Wales, UK, 1992; Volume 139, pp. 387–394. [Google Scholar]
- Ceraolo, M. New Dynamic models of lead-acid batteries. IEEE Trans. Power Syst. 2000, 15, 1184–1190. [Google Scholar] [CrossRef] [Green Version]
- Leung, K.K.; Sutanto, D. A New TopoLogy of a BAttery Energy Storage System, Proceedings of EMPD’98. 1998 International Conference on Energy Management and Power Delivery (Cat. No.98EX137), Singapore; IEEE: Piscataway, NJ, USA, 1998; Volume 1, pp. 253–258. [Google Scholar] [CrossRef]
- Znajdek, K.; Sibiński, M.; Strąkowska, A.; Lisik, Z. Polymer substrates for flexible photovoltaic cells application in personal electronic systems. Opto-Electron. Rev. 2016, 24, 20–24. [Google Scholar] [CrossRef]
- Sibiński, M.; Znajdek, K. Degradation of flexible thin-film solar cells due to a mechanical strain. Opto-Electron. Rev. 2017, 25, 33–36. [Google Scholar] [CrossRef]
- Znajdek, K.; Szczecińska, N.; Sibiński, M.; Wiosna-Sałyga, G. Adjustment of rare earth elements luminescence spectrum for best performance in photovoltaic applications. J. Nanoelectron. Optoelectron. 2019, 14, 33–38. [Google Scholar] [CrossRef]
- Widerski, T.; Raj, E.; Lisik, Z.; Kubiak, P. Temperature measurements of automotive power electronic equipment with microchannels liquid-cooling system. Prz. Elektrotechniczny 2014, 11, 137–141. [Google Scholar] [CrossRef]
© 2020 by the authors. Licensee MDPI, Basel, Switzerland. This article is an open access article distributed under the terms and conditions of the Creative Commons Attribution (CC BY) license (http://creativecommons.org/licenses/by/4.0/).

 ,
, 
