Abstract
The demand for internal combustion engines remains high for mobile power sources in all fields due to their low costs, running distance capacity, charging reliability, and heavy driving durability. However, air pollution, efficiency, and environmental factors make this more challenging. According to recent research, using a fueled prechamber can lead to lean combustion in the main chamber, resulting in increased efficiency, reduced fuel consumption, and reduced toxic emissions. However, difficulties in producing a fueled prechamber for commercial engines include mixture and soot formation problems in the limited space of the prechamber, and limited research on the charging possibility of the unfueled prechamber. A removable prechamber is advantageous for used vehicles because an engine redesign is not required. Therefore, we proposed to use an unfueled prechamber to enhance the lean burning efficiency of the spark ignited (SI) engine and explore the possibility of charging an unfueled, unscavenged prechamber with a fuel-rich mixture. Consequently, investigating the possibility of filling an unfueled prechamber with a fuel-rich mixture without additional fuel delivery or an air control system was the aim of this study. For this purpose, the charge flowrate of the centrally located unfueled prechamber is extensively investigated by using Computational Fluid Dynamics (CFD), through its design. As a result, a realizable charge flow was detected for the unfueled prechamber in two periods in the inlet and compression strokes. Most importantly, we found fluctuation phenomena in mass flow rates at the inlet stroke directing a charge flow of the richer mixture into an unfueled prechamber without additional systems. Moreover, keeping the charged rich mixture inside the prechamber during the compression stroke is as important as charging the prechamber with the fuel-rich mixture. The study will enable us to produce a removable prechamber to improve the combustion efficiency of port injected engines.
1. Introduction
Fossil fuels currently make up 81% of global primary energy consumption [1]. However, scarce resources and increasingly stringent emission requirements necessitate a stronger focus on alternative fuels and systems [2].
Lean-burning concepts are being studied to reduce the fuel consumption and exhaust emissions of an engine. The use of lean or ultra-lean air-fuel ratios is an efficient and proven strategy to reduce fuel consumption and pollutant emissions [3]. The most promising alternative to port fuel injection (PFI) was the gasoline direct injection (GDI) concept, owing to its lean-burning and fuel-saving advantages. However, GDI engines have higher black carbon (BC) emissions, which are global-warming pollutants, than PFI engines [4]. It has been validated that GDI vehicles have more total hydrocarbons (THC), particulate matter (PM) mass, and solid particulate number (PN) emissions at 30 °C [5,6]. Using a prechamber is one way to generate a higher stratified charge, which in turn may solve the problems of a GDI engine. Stratified charges occur when a fuel-rich mixture is located near the ignition source (at the prechamber), and the rest of the volume has a fuel-lean mixture, resulting in the total concentration of the air-fuel mixture being close to its theoretical concentration.
Prechamber combustion can be referred to as a “prechamber combustor” [7], “prechamber ignition“ [3], “torch ignition” [8,9,10], “jet ignition” [11,12,13,14,15,16], “two-stage combustion” [17,18,19], and “scavenged prechamber” [2,20]. Results from these studies validate the advantages of the fuel-added prechamber for SI engines and confirm the lean-burning and fuel-saving efficiencies of prechambers with an additional fuel delivery nozzle. A prechamber is a small volume connected to the main chamber with single or multiple ducts [21,22,23,24]. It can be classified as fueled and unfueled (passive) [3,25], depending on how much local fuel-rich stratification is made (Figure 1).
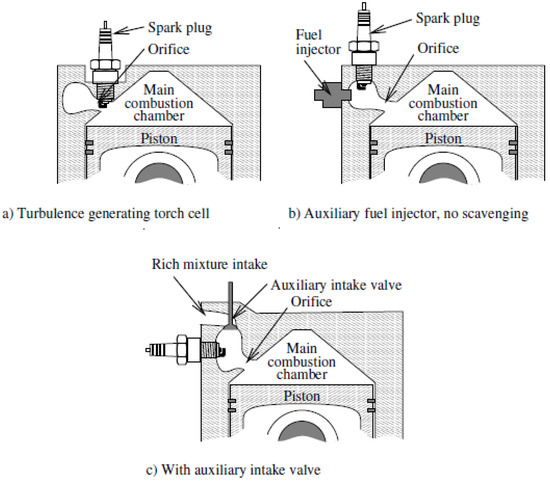
Figure 1.
Classification of the prechamber: (a) unfueled prechamber; (b) fueled prechamber with direct-injected; (c) indirectly injected fueled prechamber [22,26].
Whereas the benefits of fueled prechambers with an additional fuel or air supply have been validated, the benefits of un-fueled prechambers have not been studied at length. Alternative terms for unfueled prechamber combustion include “passive prechamber combustion” [3,25], and “unscavenged prechamber combustion” [20]. A study by Benajes et al. investigated the increased passive prechamber efficiency with good combustion stability and high combustion efficiency in stoichiometric conditions. This investigation was conducted using a turbocharger to amplify the insertion of a fuel-rich mixture into the prechamber using different configurations [25]. The study experimentally proved that the unfueled prechamber efficiency could be increased, and that it may no longer be passive, provided that a viable charging method exists. By using a turbocharger, charging a prechamber with richer fuel resulted in increased efficiency. Therefore, an understanding of the charge flow phenomena is important for determining the effectiveness of the unfueled un-scavenged prechamber system. Yet, there are not many numerical studies in this specific field, thus indicating a major area that still needs to be explored in order to advance in lean combustion with a prechamber system [3]. Some questions related to the phenomena that occurred within the pre-chamber remain unsolved. Further efforts should therefore be taken to further develop the Turbulent Jet Ignition concept though more sophisticated measurement techniques like Particle Image Velocimetry (PIV) and/or numerical methods such as Computational Fluid Dynamics (CFD) [25].
For the reasons discussed above, the prechamber is considered to be a potential alternative method to make stratification. Most researchers have used the direct injection method in the prechamber chamber, while the unfueled prechamber has not been widely studied. Therefore, we proposed to use an unfueled prechamber to enhance the lean burning efficiency of the spark ignited engine and explore the possibility of charging an unfueled, unscavenged prechamber with a fuel-rich mixture.
In this work, the following research gaps will be addressed:
- An efficient ignition system for lean combustion, including the prechamber in SI engines.
- Effective characteristics of an unfueled prechamber, including the geometry, position, as well as design characteristics spark ignited (SI) engines.
Since 2014, our team has investigated the charging of the unfueled prechamber with a richer mixture than that in the main chamber by using its own geometry. Studies include the investigation of prechamber positions, combinations of the angular effect of the precession and tilt angles, and the geometry of the inlet/outlet holes of the prechamber at the beginning of the inlet stroke. Consequently, charge flow velocity was found to be the primary predictor of charge flow intensification.
In a previous study [27], the transient velocity pattern in the prechamber was considered at the inlet and outlet duct locations. It was found that the two possible methods for charging the prechamber with a fuel-rich mixture, according to the piston movement, are to charge the prechamber in the compression and inlet strokes.
Consequently, investigating the possibility of filling an unfueled prechamber with a fuel-rich mixture at the inlet stroke without additional fuel delivery or air control system was the aim of this study. However, the second charge flow in the compression stroke involves the well-mixed homogeneous charge flow phenomenon, since both the rich mixture insertion and burnt gas discharging are obtained without an additional turbocharger, fuel, or air injector. For this purpose, the charge flowrate of the centrally located unfueled prechamber is extensively investigated by CFD, from the beginning to the end of the inlet stroke, through its design.
Contrary to a traditional unfueled prechamber study, the new prechamber’s inlet and outlet ducts were set and distinctly observed based on their charge flow directions and purposes. The methodology and simulation models are discussed in Section 3. Using cold flow simulations, the mass flowrates through the prechamber inlet and outlet ducts were determined without the influence of chemical and thermal reactions at the beginning of the inlet stroke. This helped clarify the characteristics of the first charge flow and the effects of different inner edges of the prechamber configurations. The influence of the design changes on charge flow is described in Section 4.1.
The charge flow characteristics of inlet and outlet mass flow rates were nonlinear. The first charge amplitudes were useful in identifying whether the prechamber was well charged. The effect similar to the inverse liquid bottle phenomenon is useful not only for the charge flow but also for maintaining charge without any leakage during the second charge. The effect of the fluctuating phenomena of the charge and discharge flow is described in Section 4.2.
This charge flow phenomenon will provide the reasoning behind the flow configuration in addition to the possible condition for directing the richer part of the port injected fuel into the prechamber. Conclusions about the effectiveness of the new prechamber and future work are summarized in Section 5. The current design of the optimized configuration makes it possible not only to charge the prechamber with the fuel-rich mixture but also to prevent the mixture from leaking into the main chamber during the compression stroke.
As a result, the realizable charge flow detected in the inlet stroke can be explained by the pressure difference produced by compression in the main chamber via the piston movement.
Most importantly, we found fluctuation phenomena in mass flow rates at the inlet stroke directing a charge flow of the richer mixture into an unfueled prechamber without additional systems. Moreover, keeping the charged rich mixture inside the prechamber during the compression stroke is as important as charging the prechamber with the fuel-rich mixture. The study will enable us to produce a removable prechamber to improve the combustion efficiency of port injected engines.
2. Literature Review
2.1. Internal Combustion Engine (ICE) for Computational Fluid Dynamics (CFD)
For an internal combustion engine (ICE), there are four different methods of port flow analysis, in-cylinder combustion simulation, and full-cycle simulation, which differ from each other depending on the demanded results of the focused process [28].
The flow in the port was analyzed by keeping the engine geometry frozen at a critical angle of rotation selected by the user. This analysis is similar to static analysis for any case solved using CFD. The analysis of combustion in the cylinders is calculated only during the expansion stroke. Full-cycle simulations provide a complete picture of the engine process, including airflow, fuel injection, combustion, and the formation of exhaust gases from a chemical reaction.
Cold flow analysis is a transient simulation. A complete engine cycle can be simulated but without a chemical reaction. Cold flow simulation can visualize the airflow throughout the cycle, capturing the induction of air, predicting the swirl formation, tumble, and mass flows through specific cross-sections. Mixing air with injected fuel can also be predicted but without reaction. Since these thermodynamic changes in the engine are neglected by the simulation, the flow characterized by the power stroke and exhaust does not reflect reality.
The model of mass, momentum, energy, k-epsilon of turbulence, and the tumble ratios without fuel injection and chemical reaction are described in the following equations:
where is the density, is the velocity vector, P is the pressure, σ is the turbulent viscous stress tensor, I is specific internal energy, J is the heat flux tensor, is the overall velocity vector, and A is the area [22,29].
2.2. Fluid Flow in the Prechamber
It is important to understand the movement of fluid in the combustion chambers, since it has a significant effect not only on the homogeneous mixing of air and fuel, but also on the possible stratification and efficiency of the engine. General parameters are discussed, including mass flow, drop, and swirl in a fluid flow study by Heywood [21].
2.2.1. Turbulence and Tumble
Engine turbulence occurs because of a high-speed process in the engine cycle. Air enters from the engine in a repeating cycle at a relatively high speed, creating a turbulent flow inside the cylinder. Designers require an engine that can operate with high turbulence when the piston is near the TDC. Since ignition occurs near the TDC, high turbulence makes it possible to rapidly break up and propagate a faster flame compared to low turbulence. Previous researchers searched for the geometry of the main combustion chamber and the shape of the piston to create turbulence in the engine that sequentially affects the combustion process. Other key factors contributing to turbulence are the piston speed, inlet flow condition, and intake manifold design. When considering the speed of all parts and flows, turbulent kinetic energy is one of the useful descriptions that can be calculated using simulation.
2.2.2. Swirl and Tumble
A swirl is defined as the rotational movement of air around the vertical axis of a cylinder. Tumble flow also occurs around a circumferential axis near the outer edge of the piston bowl. Tumble is usually measured experimentally using a steady flow rig at the selected valve lift, but the value of the tumble ratio is specific to the installation design. In an ANSYS IC engine, the tumble ratio is calculated using the following equation:
where is the magnitude of fluid angular momentum with respect to the tumble axis, and is the moment inertia of fluid mass about the tumble axis. In addition to the tumble ratio, the cross tumble ratio involves the rotational flow at the axis perpendicular to the tumble axis [28].
3. Methodology
The aim of this stage of the research was: (1) to develop reliable tools for predicting the charging possibility of the unfueled prechamber in the input stroke; (2) to allow better understanding of the design influence of inner edge of inlet and outlet ducts on the charge flow; (3) to reduce the cost of experiments that are used for most of the relevant design.
By using the cold flow method, changes in temperature and pressure in the engine cylinder were analyzed without any reaction from the fuel injection or spark ignition. This provided an idea of the real charge flow state prior to the combustion process. A modification was made on an existing engine model to produce two new inner edges while maintaining the geometry of other parts of the engine. This design adjustment was used on the previously modified models capable of fitting into the spark plug hole without changing the design of the original engine’s main chamber. For cold flow analysis, the initial axisymmetric engine model was modified into a full-size 3-dimensional engine model to investigate the charge flow through the inlet and outlet ducts of the prechamber. Simulated results were compared to the experimental results [25].
Hence, the richer part of the mixture of the port injected engine was supposed to be inserted into the prechamber during the inlet valve opened period, while the considering period of the simulation relied on that period.
The parameters and values were taken from an actual naturally aspirated single-cylinder engine with a 0.5-L capacity, which has a high resemblance to the geometry of the initial model. All parameters were the values that had to be inserted at the preliminary stage of the cold flow simulation before inserting the engine model.
3.1. Modeling the Engine
The engine studied in this research is a four-valve pent-roof type 4 cycle SI showed in Figure 2 with specifications listed in Table 1. The initial model used was taken from the ANSYS tutorial, which was modified into two models of unfueled prechambers with different inner wall configurations while retaining the geometry of the other engine parts. The selection of the prechamber design was previously modified based on the ease of fabricating the prechamber fitted into the spark plug hole without changing the shape of the cylinder head of the real engine. A computational model of engine analysis generally includes the engine intake valve, exhaust valve, and cylinder head with a prechamber, cylinder, and piston.
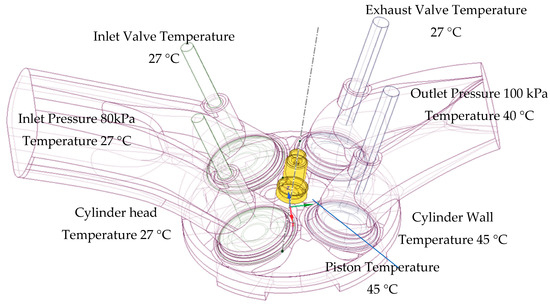
Figure 2.
Configuration of the engine cylinder head with the prechamber located on the top of the pent-roof type combustion chamber (two valves each for the inlet and exhaust). The prechamber is colored as yellow.

Table 1.
Engine specifications.
The initial engine model was symmetrical, but the modified position of the prechamber makes it asymmetric. This is because the prechamber of the current design location was eccentrically shifted closer to one of the inlet valves and tilted in the symmetry plane of the engine with a precession angle related to the prechamber centerline.
A full-sized model was used to analyze the effect of various geometric prechamber properties on the charge flow while keeping the diameter and depth of the prechamber constant. Figure 3 shows the two prechamber designs used in this study. Prechamber A uses a chamfered design, and Prechamber B uses the sharp inner edge design. Prechamber A and B have a similar shape except for the inner end of the inlet and outlet ducts, which are chamfered in the 1 mm radius. These parameters were taken from a naturally aspirated 0.5 L single cylinder, which resembled the geometry of the initial model. All parameters were inserted at the preliminary stage of the cold flow simulation before inserting the engine model. Figure 4 shows the simulation model of the prechamber system. The prechamber consists of three parts: a prechamber body (pink colored area), an inlet (blue colored area), and an outlet (green colored area) ducts. The boundary conditions in the inlet and outlet ducts of the engine are provided in Figure 4. The ANSYS workbench FLUENT ICE, developed by ANSYS Inc., USA, was used for the numerical analysis in this study.
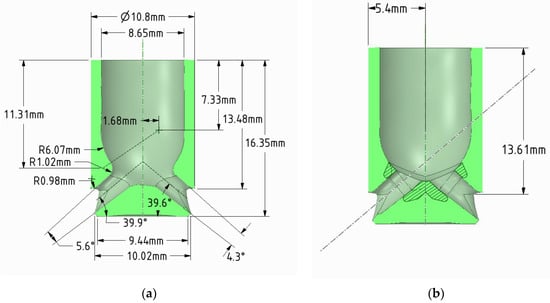
Figure 3.
The prechamber: (a) sharp edge design, (b) chamfered inner edge design. The dashed area is the difference between the designs.
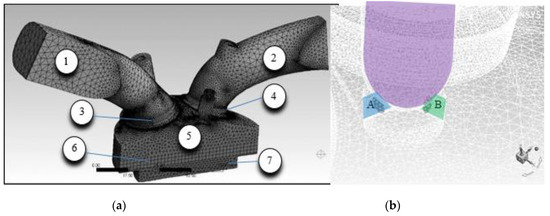
Figure 4.
Decomposition model of the engine with prechamber: (a) Mesh of the cylinder head (b) Inlet-A, and outlet-B, ducts in the main body of the prechamber-C.
3.2. Decomposing and Meshing
To accurately visualize the flow inside the prechamber, the engine model was split into different zones, which provided better control of the mesh of the model. Figure 3a shows that different zones (Table 2) have different qualities and shapes of the mesh cell. The grid cell is particularly fine in the volume of the main and pre-chambers of the combustion chamber and the valve seat. For accuracy and computation speed, moving zones were associated with a hexagonal cell and static zones with tetrahedral cells.
Table 2.
Model sones.
For the engine boundary conditions, the inlet and outlet temperatures were 313 K and 333 K, respectively. The inlet and outlet pressures were 80 kPa and 100 kPa. The temperature of the cylinder head, piston, and cylinder wall were 348 K, 318 K, and 318 K. Once all parameters were determined, the turbulent model k-ε with an enhanced wall function was used for the flow model. When the heat transferred from the main cylinder to the prechamber, the flow through the inlet and outlet ducts were the primary output parameters for charging the prechamber. The inner edge configuration and of the cross-sectional change of the inlet and outlet ducts of the prechamber was considered as an input parameter.
3.3. Grid Test
The grid independence test was performed to determine the minimum number of grid cells to ensure that it was not too small or large, resulting in a significant deviation from the correct result. Figure 5 shows a grid independence test for the chamfered design of the prechambers, which was used with tumble ratios to compare three different numbers of grid cells in the range of 1,550,000 to 6,369,000.
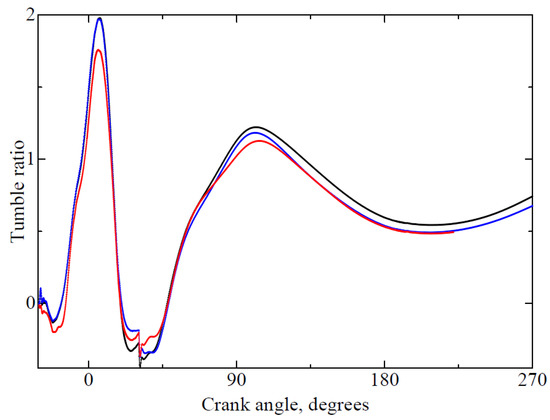
Figure 5.
Grid independence test for the Tumble Ratio.
Figure 5 shows that the tumble ratios are similar even with a significant difference in the number of grid cells. This is especially true at the beginning of the intake stroke, which is 45° to 90° from TDC. The tumble ratio of 1,550,000 cells of the mesh has a deviation of 5% when compared to the other two models with different numbers of cells.
This study presents an inlet flow analysis, starting from −30° CAD to TDC, where at this crankshaft rotation angle, the intake opening overlapped with the exhaust valve closing. If the remaining exhaust fumes were unaffected by the condition inside the cylinder, then the exhaust valve was completely closed from 45° CAD to 720° CAD.
In the cold flow simulation, the analysis included an intake stroke and a compression stroke. The simulation was calculated from 5° until the inlet valve opens, while the exhaust valve was completely shut off. The mass flow rate of injected air at the inlet was 0.0103 kg/s, and the initial pressure at the inlet was 98,900 Pa. This initial condition was obtained from a real engine model, which has geometric properties close to the original computational model. In the cold flow simulation, the engine analysis was set as the standard k-epsilon model with improved wall treatment. Enhanced Wall treatment is a two-layer model of combining the law of the laminar wall with the law of the turbulent flow. As an integral part of enhanced wall treatment, the two-layer model determines the turbulent viscosity and ε for the mesh layer on the wall. When applying enhanced wall treatment, this treatment is similar to that of a standard two-layer model if the mesh layer is small enough to allow a laminar sublayer (when y+ < 30) [14]. For this study y+ = 16. The PISO scheme was used along with the Green-Gauss node for the gradient and PRESTO! for pressure. For accuracy purposes, a second-order upwind was set to determine density, momentum, and turbulent kinetic energy.
This study presents an analysis of the engine starting from 329.4 CAD, where at this crankshaft rotation angle, the inlet opening overlapped with the exhaust valve closing. If the residual exhaust did not affect the condition inside the cylinder chamber, then the exhaust valve was completely closed between 330 CAD and 720 CAD.
4. Results
4.1. Effect of Design
The primary reason for directing a fuel-rich mixture into the prechamber is to determine the timing that is compatible with the geometry solution to make enough pressure difference between the prechamber and main chamber of the engine. Because the engine considered in this research is naturally aspirated, the only way to make a pressure difference was to use geometry variations with limited piston speed. To understand the geometry, the engine RPM will change while other parameters remain as steady as possible.
Two designs of the inner edge for the inlet and outlet ducts of the prechamber were considered: the sharp-edged design (the red circled area in Figure 6a) and the chamfered design (the red circled area in Figure 6b).
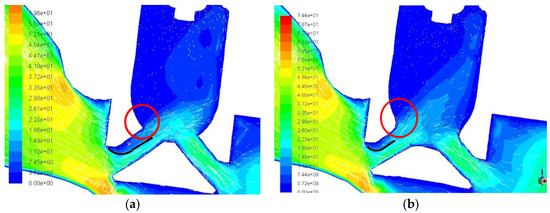
Figure 6.
The contour of velocity magnitudes around the prechamber during the inlet stroke at the 64.1° form the degree from the top dead center (TDC). (a) The sharp inner edge (red circled area) of inlet and outlet ducts. (b) The chamfered inner edge (red circled area) of inlet and outlet ducts.
Contours of the magnitude velocity at the same crank angle of 64° from the beginning of the inlet stroke are compared in Figure 6. The velocity direction (white traces) in Figure 6b is higher than in Figure 6a. Additionally, the region of the flow separation in the sharp-edged design is wider (black line in Figure 6a) than the chamfered-edged (black line in Figure 6b) design. This suggests that the possibility of charging in the inner sharp-edge type inlet and outlet ducts is less than in the chamfered inner edge.
The mass flow rates for the designs shown in Figure 6 were compared in Figure 7. The mass flow rate in the inlet duct is shown in Figure 7a. The sharp-edge design (black line) causes a lower mass flow rate between 45° and 80° and a crank angle between 90° and 180°. However, the mass flow rates are similar over the remainder of the crank angle (from 180° to 750°) positions.
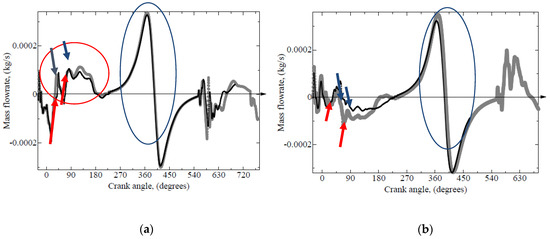
Figure 7.
Mass flow rates of the outlet ducts of the prechamber with chamfered edges (gray line) and sharp edge (black line). (a) Mass flow rates in inlet ducts for both designs, (b) Mass flow rates in outlet ducts for both designs.
The positive and negative mass flow rate values represent the charging and discharging of the prechamber (Figure 6, Figure 7, Figure 8 and Figure 9).
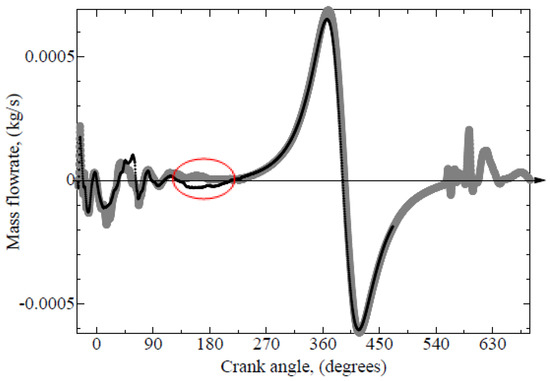
Figure 8.
Comparison of mass flow rate differences between inlet and outlet ducts of chamfered design (gray line) and the sharp-edge design (black line) of the prechamber.
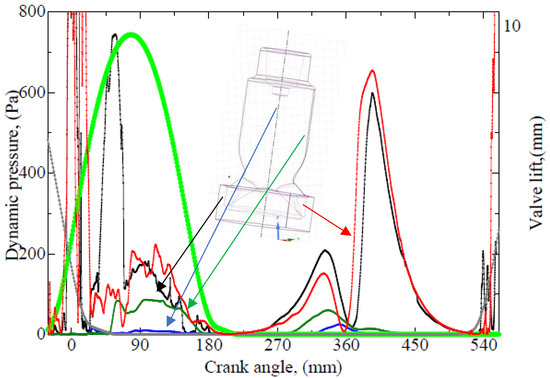
Figure 9.
The pressure at the different places of the prechamber.
In Figure 6, Figure 7, Figure 8 and Figure 9, large regions of positive flows (representing a charge flow) were observed twice between one ignition and the next one. The first positive mass flowrate region, through the inlet duct of the prechamber, was observed from 45° to 180° of the crank angle in the inlet stroke (red-circled area in Figure 7a). The second region of the positive mass flowrates, through the same duct, was observed from 180° to 360° of the crank angle in the compression stroke (blue-circled area in Figure 7a).
The mass flow rates of the inlet and outlet ducts pulse at the inlet stroke. The direction is shown by the red (charge increment direction) and blue (increment direction) arrows in Figure 7. The green line in the Figure 9 shows the valve lift throughout the engine cycle, showing the opening and closing of the exhaust and intake valves.
Results show that the increment or decrement durations of inlet and outlet ducts are the same. The steps of pulsations for both inlet and outlet ducts correspond to each other. When the inlet mass flow rate increases, the outlet mass flow rate decreases. This indicates that the charge flow of the prechamber is unlikely to be stable during the intake stroke. The total mass flow rate of the discharge flows shows fluctuations.
The mass flowrates in the outlet duct of the prechamber, for the chamfered and sharp-edged designs, are shown in Figure 7b. The value of the discharge mass flow rate for the sharp-edge design is lower than the chamfered design, from the TDC to the BDC (0° to 180°) during the intake stroke.
The total mass flowrates for the chamfered and sharp-edge designs are compared in Figure 8. The designs have similar total mass flow rates; however, deviations occur at some places. This difference is prominent between the end of the intake and the beginning of the compression strokes (from 135° to 225° of the crank angle, as indicated by the red circle). The positive mass flowrate for the chamfered design occurs from the beginning of the intake stroke to the middle of the compression stroke. However, some discharge mass flow rates are present during the intake stroke. This indicates that the chamfered design is more suitable than a sharp-edged one when late remixing with the main chamber.
The charging possibility was slightly higher for a sharp edge design than a chamfered design. Nonetheless, a discharge mass flow is observed at BDC and the beginning of the compression stroke.
The mass flow rate configuration of both designs was similar, aside from the slight difference at the end of the intake stroke (the red-circled area in Figure 8). The discharged mass flow rate from the prechamber is neglected in the case of the chamfered design (the gray line inside the red-circled area in Figure 8), which is useful for keeping the charged rich mixture separate from the well-blended mixture in the main chamber. For the sharp-edge design case, the discharge flow is detectable (the black line inside the red-circled area in Figure 8), which allows for the possibility of exchanging a charged air-fuel mixture between the prechamber and main chamber. Consequently, this flow (the black line in the red-circled area of Figure 8) will reduce the difference in mixture concentrations between these chambers. There were some extremely low-velocity areas, all in positions of the valve openings. This could indicate the extreme positions of the self-charge process for the self-scavenging prechamber.
From the simulation, it was observed that the first part of the charge flow to the prechamber was immediately after the TDC of the intake stroke and can be considered as the central part of the charge. It can be used as the richest part of the air-fuel mixture when fuel is injected into the chamber while the inlet valve is open, and the air-fuel mixture is not homogeneously mixed. During this period, the charge flow of the prechamber was pulsed continuously, and the highest part of its amplitude at the beginning of the intake stroke was a self-scavenging pulse. The alternating net charge inflow and outflow of the prechamber is shown in Figure 7 and Figure 9. This alternation results in a pulse, which is important not only to establish a charge and discharge order but also to distinguish between the prechamber and the main chamber during any specific period of the combustion cycle.
4.2. Charge and Discharge of the Prechamber
Figure 9 compared the pressures at the inlet (black line), outlet (red line), middle side of the prechamber (green line), and the top of the prechamber (blue line). Results show that the pressure at the inlet and outlet ducts are mostly higher than the pressure in the middle, while pressure at the top side of the prechamber (blue line) is much lower during the inlet stroke (0–180°). This incremental pressure difference is the reasoning for the first charge of the prechamber. The pressure differences between the ducts and inner areas of the prechamber are provided in Figure 9.
The next charge configurations occur right after BDC when all of the pressures from various places become similar from the beginning to the middle of the compression stroke (180° to 270°). All pressure and pressure differences increased to push a charge from the main high-pressure chamber to the low-pressure prechamber (Figure 9). Directions of the mass flow rates from both ducts were positive, indicating that the charge flowed into the prechamber from both sides of the inlet and outlet during this period, for both the chamfered and sharp edge designs (Figure 7).
When the mass flow rate at the inlet duct increases in the positive direction, the mass flow rate of the outlet duct decreases in the negative direction, combined with the pulsations of inlet and outlet ducts, some fluctuations occur, as shown in Figure 10. The trends in the mass flow indicate the charge and discharge directions. The negative mass flow rate dominates for both the inlet and outlet ducts over the first 40° of the intake stroke (Figure 10), which is evidence of discharge flow occurring at the beginning of the inlet stroke.
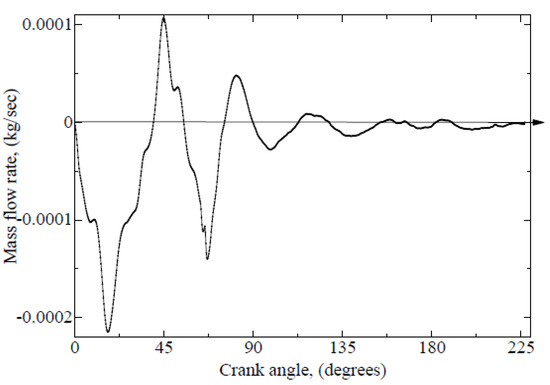
Figure 10.
Net mass flow rates of the inlet and outlet ducts of the prechamber for chamfered-edge design.
After the discharge mass flow rate at the TDC, there is a positive mass flow rate in the direction from the inlet valve to the prechamber inlet duct. The highest mass flow rate occurred at 45° after the beginning of the intake stroke. The weakest charge flow occurred at 220° after the TDC. The mass flow direction fluctuated through the intake stroke. The increment of the positive mass flow rate following the velocity increment in the direction shown in Figure 6 indicates the potential to introduce a mixture into the prechamber at the beginning of the intake stroke.
The charge flow begins between 50° to 60° and increases rapidly to its maximum value around the halfway point of the stroke. After this, it fluctuates, before gradually decreasing after the second increment.
A wave-like fluctuation was observed in the total mass flow rate in the inlet and outlet ducts of the prechamber as well as the pressure fluctuation in the experimental results [25]. The pulse amplitude of the fluctuation decreased with an increasing crank angle.
The phase duration of the pulsation is shown in Figure 8. According to the trend in this figure, the pulse step (the number of pulses from the beginning, indicating the difference between pulse duration) changes relative to the crank angle. Therefore, it is assumed that the charge flow during the intake stroke is not continuous but instead is a combination of alterations between the discharge and charge processes.
At the beginning of the inlet stroke, both valves are opened, and the pressure difference required us to direct the charge flow to the prechamber was not stable and if the charged mass entered the prechamber. The charged mass changes the density in the prechamber and creates a pressure difference on the opposite side. This pressure increment causes a discharge, and then the pressure drop reoccurs, resulting in the charge flow insertion. The net mass flow rate characteristics resemble an ”inverted liquid bottle effect.“ [30,31].
In Figure 11, the mass flow rate of the inlet duct fluctuates from the beginning of the inlet stroke and the outlet mass flow rate (The positive and negative values represent charges and discharges into the prechamber, respectively). The steps and directions of the fluctuations are identical. As the inlet mass flow increases, the outlet mass flow decreases. Consequently, the mass flow rate into the prechamber increases because the outlet mass flow rate is decreasing. This indicates that the charging process is occurring. When the charge flow decreases, the outlet flow increases. This indicates that a discharge process is occurring. The delta between the discharge and charging process results in a net mass flow rate fluctuating with the same frequency as the inlet and outlet mass flow fluctuations. Furthermore, the charge flow and outlet mass flow rates are increasing from 20 CAD. In this case, there are no fluctuations, and both the inflow and outflow increase smoothly. Therefore, the net mass flow rate is negligibly smooth, and there is no difference between the charge and discharge flow. The inflow is going out at the same rate as it enters, and there is no difference in the mass of the prechamber volume.
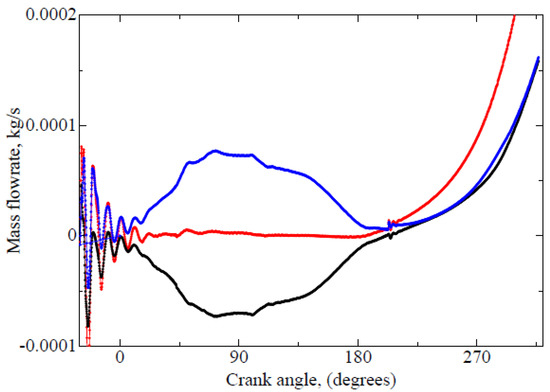
Figure 11.
Inlet (blue) and outlet (black) and net (red) mass flowrates of the ducts of the prechamber for the chamfered-edge design of a 2.36 mm position.
If there is some fluctuation in the net mass flow rate, then the prechamber will be charged and discharged. If there is no pulsation in the net mass flow rate, then the charging possibility is negligible. It is especially important to charge the fresh mixture and discharge exhaust smoke from the prechamber. Finally, it is also important to pre-clean exhaust smoke from the prechamber.
Like the “upside-down liquid bottle phenomenon,” without a large enough pressure difference or vibration fluid inside the prechamber, nothing will come out. If there is enough of a pressure difference to trigger the pulsation, then the mass flow will go into the prechamber until the pressure is high enough to push the exhaust used gas out from the prechamber. This means the vortexes in the prechamber and main chamber are interacting through the inlet and outlet ducts of the prechamber. The phase of intense vortex interaction during the vortex pairing is followed by a “calming” period that corresponds to the vortex roll-up after the coalescence [32]. This process was repeated until the pressure or velocity difference between the prechamber and the main chamber became negligible.
5. Conclusions
This research was accomplished by investigating different prechamber modifications and conducting a series of CFD simulations. Since the flow conditions inside the cylinder influence the combustion quality and mixing process of air and fuel, the fueled prechamber was shown to be an essential factor in engine efficiency. The efficiency of the unfueled prechamber relies on the charging possibility of the prechamber with a fuel reach mixture. It was important to understand how to charge flow characteristics and pulsed manners can cause a difference in the density and pressure profile.
Cold flow analysis provides insight on the cylinder pressure and temperature development, which is a crucial factor for pre-combustion conditions, which in turn provide an understanding of the influence of the design parameters on flow-related physical conditions independent from the influence of chemical reactions. In this study, we focused on the charge flow of the prechamber in the input stroke. However, we found another possibility involving the compression stroke. The pressure and temperature for the analyzed engine were similar to that of other engines. Peak pressure and temperature were 690 kPa and 535 K, which is comparable to other engine systems studied by other researchers. Mass flow rates were compared between two different inner edge configurations of the prechamber. Simulation results show that the inner edge shape of the prechamber inlet and outlet ducts do not have a considerable influence on the charge flow at the beginning of the inlet stroke. The difference in the charge flow is only within a short cap of the crank angle from 125° to 265° and is around 15%.
Results show that charging an unfueled, unscavenged prechamber with a fuel-rich mixture is possible. The improved configuration makes it possible not only to charge the prechamber with the fuel-rich mixture but also prevents the rich mixture from leaking into the main chamber during the compression stroke.
This is also known as the “Inverted liquid bottle effect.” If the flow does not fluctuate in the inlet and outlet duct of the prechamber, then the charging possibility of the prechamber is negligible. However, if the mass flow rate through the ducts increases, the charging possibility becomes the net value of the charge and discharge mass, as shown in Figure 11. If the mass flow rates in the inlet and outlet ducts fluctuate, then the net mass flow will also fluctuate. The amplitude of this fluctuation reduces step by step until the pressure difference becomes negligible.
The influences of the inner edge on the flow state are significant from the end of the intake stroke to the beginning of the compression stroke. General configurations for both the chamfered and sharp edge designs were similar. As the piston approached the bottom dead center, the chamfered inner edge design caused a decrease in the discharge flow rate, which enhanced the charge flows on both sides of the inlet and outlet ducts and was compromised in the middle of the prechamber during a compression stroke. The prechamber with a sharp inner edge design had some discharge flow from the end of the intake stroke, and the charge flows from the inlet duct dominated during the compression stroke.
From CFD simulation results, it can be concluded that:
- Usable charge flow for the unfueled unscavenged prechamber exists.
- Charge flow of the unfueled prechamber can be divided into two parts:
- During the intake stroke (from TDC to BDC).
- During the compression stroke (from BDC to TDC).
- The first part of the charge flow is not continuously directed into the prechamber during the intake stroke.
During the intake stroke, the charge flow fluctuates in a pulsed manner. When the charge flow dominates, the discharge flow does not occur. When discharge flow dominates, the charge flow is reduced. This type of pulse effect is useful for producing density and pressure differences, which lead to the inlet charge mass and discharge used gas. It is also useful for keeping the rich mixture inside the prechamber. The fluctuating effect and its amplitudes of the first charge are useful to:
- Predict the charge possibilities of the prechamber for further development.
- Maintaining charge without leakage during the second charge by its valve-like altering.
The charge flow of the prechamber depends on the design and position of its inlet and outlet ducts. Storing a charged enriched mixture inside the prechamber during a compression stroke is as crucial as filling the prechamber with the richest fuel mixture. The charge flow found for the unfueled prechamber can be fueled, and the local fuel enrichment in the prechamber can be used as a jet igniter for the lean mixture in the main combustion chamber by using a richer portion of the fuel, which is injected when the inlet valve is open. This allows for minor modifications to be done on the existing port-injected engine to operate as a Gasoline Direct-injected engine.
Further, there are immense practical applications to this study, as a large percentage of transportation vehicles still use the port-injected SI engine.
Author Contributions
Conceptualization, N.G.; Methodology, N.G.; Software, N.G.; Validation, N.G., O.Y.; Formal Analysis, N.G.; Investigation, N.G.; Resources, N.G; Data Curation, N.G; Writing-Original Draft Preparation, N.G.; Writing-Review & Editing, N.G. and O.Y. and A.H.; Visualization, N.G.; Supervision, O.Y.; Project Administration, N.G. and O.Y.; Funding Acquisition, N.G. and O.Y. All authors have read and agreed to the published version of the manuscript.
Funding
This research was funded by Japanese Grant Aid for Human Resource Development Scholarship grant number B0012017MNGD02.
Conflicts of Interest
The authors declare no conflict of interest.
Nomenclature
| Moment of inertia of fluid mass about swirl axis, kg/m2 | |
| Moment of inertia of fluid mass about tumble axis, kg/m2 | |
| k | Turbulent kinetic energy, m2/s2 |
| Magnitude fluid angular momentum with respect to swirl axis, kg.m2/s | |
| Magnitude fluid angular momentum with respect to tumble axis, kg.m2/s | |
| N | Engine operating speed, rpm |
| Rs | Swirl ratio, dimensionless |
| Rt | Turbulent ratio, dimensionless |
| Greek symbols | |
| Angular velocity rotating flow with respect to swirl axis, rad/s | |
| Abbreviations | |
| BDC | Bottom Dead Centre |
| CFD | Computerized fluid dynamics |
| IC | Internal Combustion |
| TDC | Top Dead Centre |
| CAD | Crank Angle Degree |
| PFI | Port Fuel Injection |
| GDI | Gasoline Direct Injection |
| BC | Black Carbon |
| THC | Total Hydrocarbon |
| PM | Particulate Matter |
| PN | Particulate Number |
| SI | Spark Ignition |
References
- Khatib, H. IEA World Energy Outlook 2011—A comment. Energy Policy 2012, 48, 737–743. [Google Scholar] [CrossRef]
- Baumgartner, L.S.; Wohlgemuth, S.; Zirngibl, S.; Wachtmeister, G. Investigation of a Methane Scavenged Prechamber for Increased Efficiency of a Lean-Burn Natural Gas Engine for Automotive Applications. SAE Int. J. Engines 2015, 8, 921–933. [Google Scholar] [CrossRef]
- Alvarez, C.E.C.; Couto, G.E.; Roso, V.R.; Thiriet, A.B.; Valle, R.M. A review of prechamber ignition systems as lean combustion technology for SI engines. Appl. Therm. Eng. 2018, 128, 107–120. [Google Scholar] [CrossRef]
- Zimmerman, N.; Wang, J.M.; Jeong, C.-H.; Wallace, J.S.; Evans, G.J. Assessing the Climate Trade-Offs of Gasoline Direct Injection Engines. Environ. Sci. Technol. 2016, 50, 8385–8392. [Google Scholar] [CrossRef]
- Zhu, R.; Hu, J.; Bao, X.; He, L.; Lai, Y.; Zu, L.; Li, Y.; Su, S. Tailpipe emissions from gasoline direct injection (GDI) and port fuel injection (PFI) vehicles at both low and high ambient temperatures. Environ. Pollut. 2016, 216, 223–234. [Google Scholar] [CrossRef]
- Zheng, X.; Zhang, S.; Wu, Y.; Zhang, K.M.; Wu, X.; Li, Z.; Hao, J. Characteristics of black carbon emissions from in-use light-duty passenger vehicles. Environ. Pollut. 2017, 231, 348–356. [Google Scholar] [CrossRef]
- Bunce, M.; Blaxill, H.; Kulatilaka, W.; Jiang, N. The Effects of Turbulent Jet Characteristics on Engine Performance Using a Pre-Chamber Combustor. SAE Int. Warrendale PA SAE Tech. Pap. 2014, 1, 1195. [Google Scholar]
- Filho, F.A.R.; Baêta, J.G.C.; Teixeira, A.F.; Valle, R.M.; de Souza, J.L.F. E25 stratified torch ignition engine emissions and combustion analysis. Energy Convers. Manag. 2016, 121, 251–271. [Google Scholar] [CrossRef]
- Sakai, Y.; Kunii, K.; Tsutsumi, S.; Nakagawa, Y. Combustion Characteristics of the Torch Ignited Engine. SAE Trans. 1974, 83, 3504–3512. [Google Scholar]
- Ryu, H.; Chtsu, A.; Asanuma, T. Effect of Torch Jet Direction on Combustion and Performance of a Prechamber Spark-Ignition Engine; Society of Automotive Engineers: Warrendale, PA, USA, 1987. [Google Scholar]
- Gentz, G.; Gholamisheeri, M.; Toulson, E. A study of a turbulent jet ignition system fueled with iso-octane: Pressure trace analysis and combustion visualization. Appl. Energy 2017, 189, 385–394. [Google Scholar] [CrossRef]
- Gentz, G.; Thelen, B.; Gholamisheeri, M.; Litke, P.; Brown, A.; Hoke, J.; Toulson, E. A study of the influence of orifice diameter on a turbulent jet ignition system through combustion visualization and performance characterization in a rapid compression machine. Appl. Therm. Eng. 2015, 81, 399–411. [Google Scholar] [CrossRef]
- Gholamisheeri, M.; Wichman, I.S.; Toulson, E. A study of the turbulent jet flow field in a methane fueled turbulent jet ignition (TJI) system. Combust. Flame 2017, 183, 194–206. [Google Scholar] [CrossRef]
- Attard, W.P.; Fraser, N.; Parsons, P.; Toulson, E. A Turbulent Jet Ignition Pre-Chamber Combustion System for Large Fuel Economy Improvements in a Modern Vehicle Powertrain. SAE Int. J. Engines 2010. [Google Scholar] [CrossRef]
- Attard, W.P.; Toulson, E.; Huisjen, A.; Chen, X.; Zhu, G.; Schock, H. Spark Ignition and Pre-Chamber Turbulent Jet Ignition Combustion Visualization. In Proceedings of the SAE 2012 World Congress & Exhibition, Detroit, MI, USA, 24–26 April 2012; p. 823. [Google Scholar] [CrossRef]
- Toulson, E.; Watson, H.C.; Attard, W.P. Gas Assisted Jet Ignition of Ultra-Lean LPG in a Spark Ignition Engine. In Proceedings of the SAE World Congress & Exhibition, Detroit, MI, USA, 20–23 April 2009; p. 506. [Google Scholar] [CrossRef]
- Jamrozik, A.; Tutak, W.; Kociszewski, A.; Sosnowski, M. Numerical simulation of two-stage combustion in SI engine with prechamber. Appl. Math. Model. 2013, 37, 2961–2982. [Google Scholar] [CrossRef]
- Jamrozik, A.; Tutak, W. A study of performance and emissions of SI engine with a two-stage combustion system. Chem. Process. Eng. 2011, 32, 453–471. [Google Scholar] [CrossRef]
- Yamaguchi, S.; Ohiwa, N.; Hasegawa, T. Ignition and burning process in a divided chamber bomb. Combust. Flame 1985, 59, 177–187. [Google Scholar] [CrossRef]
- Roubaud, A.; Röthlisberger, R.; Favrat, D. Lean burn cogeneration biogas engine with unscavenged combustion prechambers: Comparison with natural gas. Int. J. Appl. Therm. 2002, 5, 169–175. [Google Scholar]
- Ricardo, H.R. Internal-Combustion Engine. U.S. Patent No. 4,054,108, 9 July 1918. [Google Scholar]
- Heywood, J.B. Internal Combustion Engine Fundamentals; McGraw-Hill: New York, NY, USA, 1988. [Google Scholar]
- Wall, J.C.; Heywood, J.B. The Influence of Operating Variables and Prechamber Size on Combustion in a Prechamber Stratified-Charge Engine. In Proceedings of the 1978 SAE International Fall Fuels and Lubricants Meeting and Exhibition, Toronto, ON, Canada, 13–16 November 1978; p. 780966. [Google Scholar] [CrossRef]
- Tully, E.J.; Heywood, J.B.P. Lean-Burn Characteristics of a Gasoline Engine Enriched with Hydrogen from a Plasmatron Fuel Reformer. SAE Trans. 2003. [Google Scholar] [CrossRef]
- Benajes, J.; Novella, R.; Gomez-Soriano, J.; Martinez-Hernandiz, P.J.; Libert, C.; Dabiri, M. Evaluation of the passive pre-chamber ignition concept for future high compression ratio turbocharged spark-ignition engines. Appl. Energy 2019, 248, 576–588. [Google Scholar] [CrossRef]
- Nyamsuren, G.; Fukudome, K.; Ogami, Y. CFD Investigation of Self-Scavenging Prechamber for the Lean Flammability of a Gasoline Engine. Proc. Conf. Kansai Branch 2018, 93, 1012. [Google Scholar] [CrossRef]
- Norum, V.L. Analysis of Ignition and Combustion in Otto Lean-Burn Engines with Prechambers. Ph.D. Thesis, Norges Teknisk-Naturvitenskapelige Universitet, Trondheim, Norway, 2008. [Google Scholar]
- Ahmad, T.; Plee, S.L.; Myers, J.P. Fluent Theory Guide; SAS IP, Inc.: Canonsburg, PA, USA, 2010; p. 814. [Google Scholar]
- Kurniawan, W.; Abdullah, S.; Shamsudeen, A. A Computational Fluid Dynamics Study of Cold-flow Analysis for Mixture Preparation in a Motored Four-stroke Direct Injection Engine. J. Appl. Sci. 2007, 7. [Google Scholar] [CrossRef]
- Liang, J.; Luo, X.; Liu, Y.; Li, X.; Shi, T. A numerical investigation in effects of inlet pressure fluctuations on the flow and cavitation characteristics inside water hydraulic poppet valves. Int. J. Heat Mass Transf. 2016, 103, 684–700. [Google Scholar] [CrossRef]
- Gao, P.; Liu, T.; Yang, T.; Tan, S. Pressure drop fluctuations in periodically fluctuating pipe flow. J. Mar. Sci. Appl. 2010, 9, 317–322. [Google Scholar] [CrossRef]
- Karabasov, S.A.; Goloviznin, V.M. Direct Numerical Simulations of Compressible Vortex Flow Problems. Adv. Fluid Dyn. 2012. [Google Scholar] [CrossRef]


© 2020 by the authors. Licensee MDPI, Basel, Switzerland. This article is an open access article distributed under the terms and conditions of the Creative Commons Attribution (CC BY) license (http://creativecommons.org/licenses/by/4.0/).