The results of the experiments in this study are thematically structured in two parts. First, the oil flow visualizations regarding the flow directions of 0°, 5°, and 10° are presented. The respective external flow fields captured using PIV are shown afterward. In this study, the inflow without crosswind is referred to as the baseline case.
3.1. Surface Traces without Crosswind
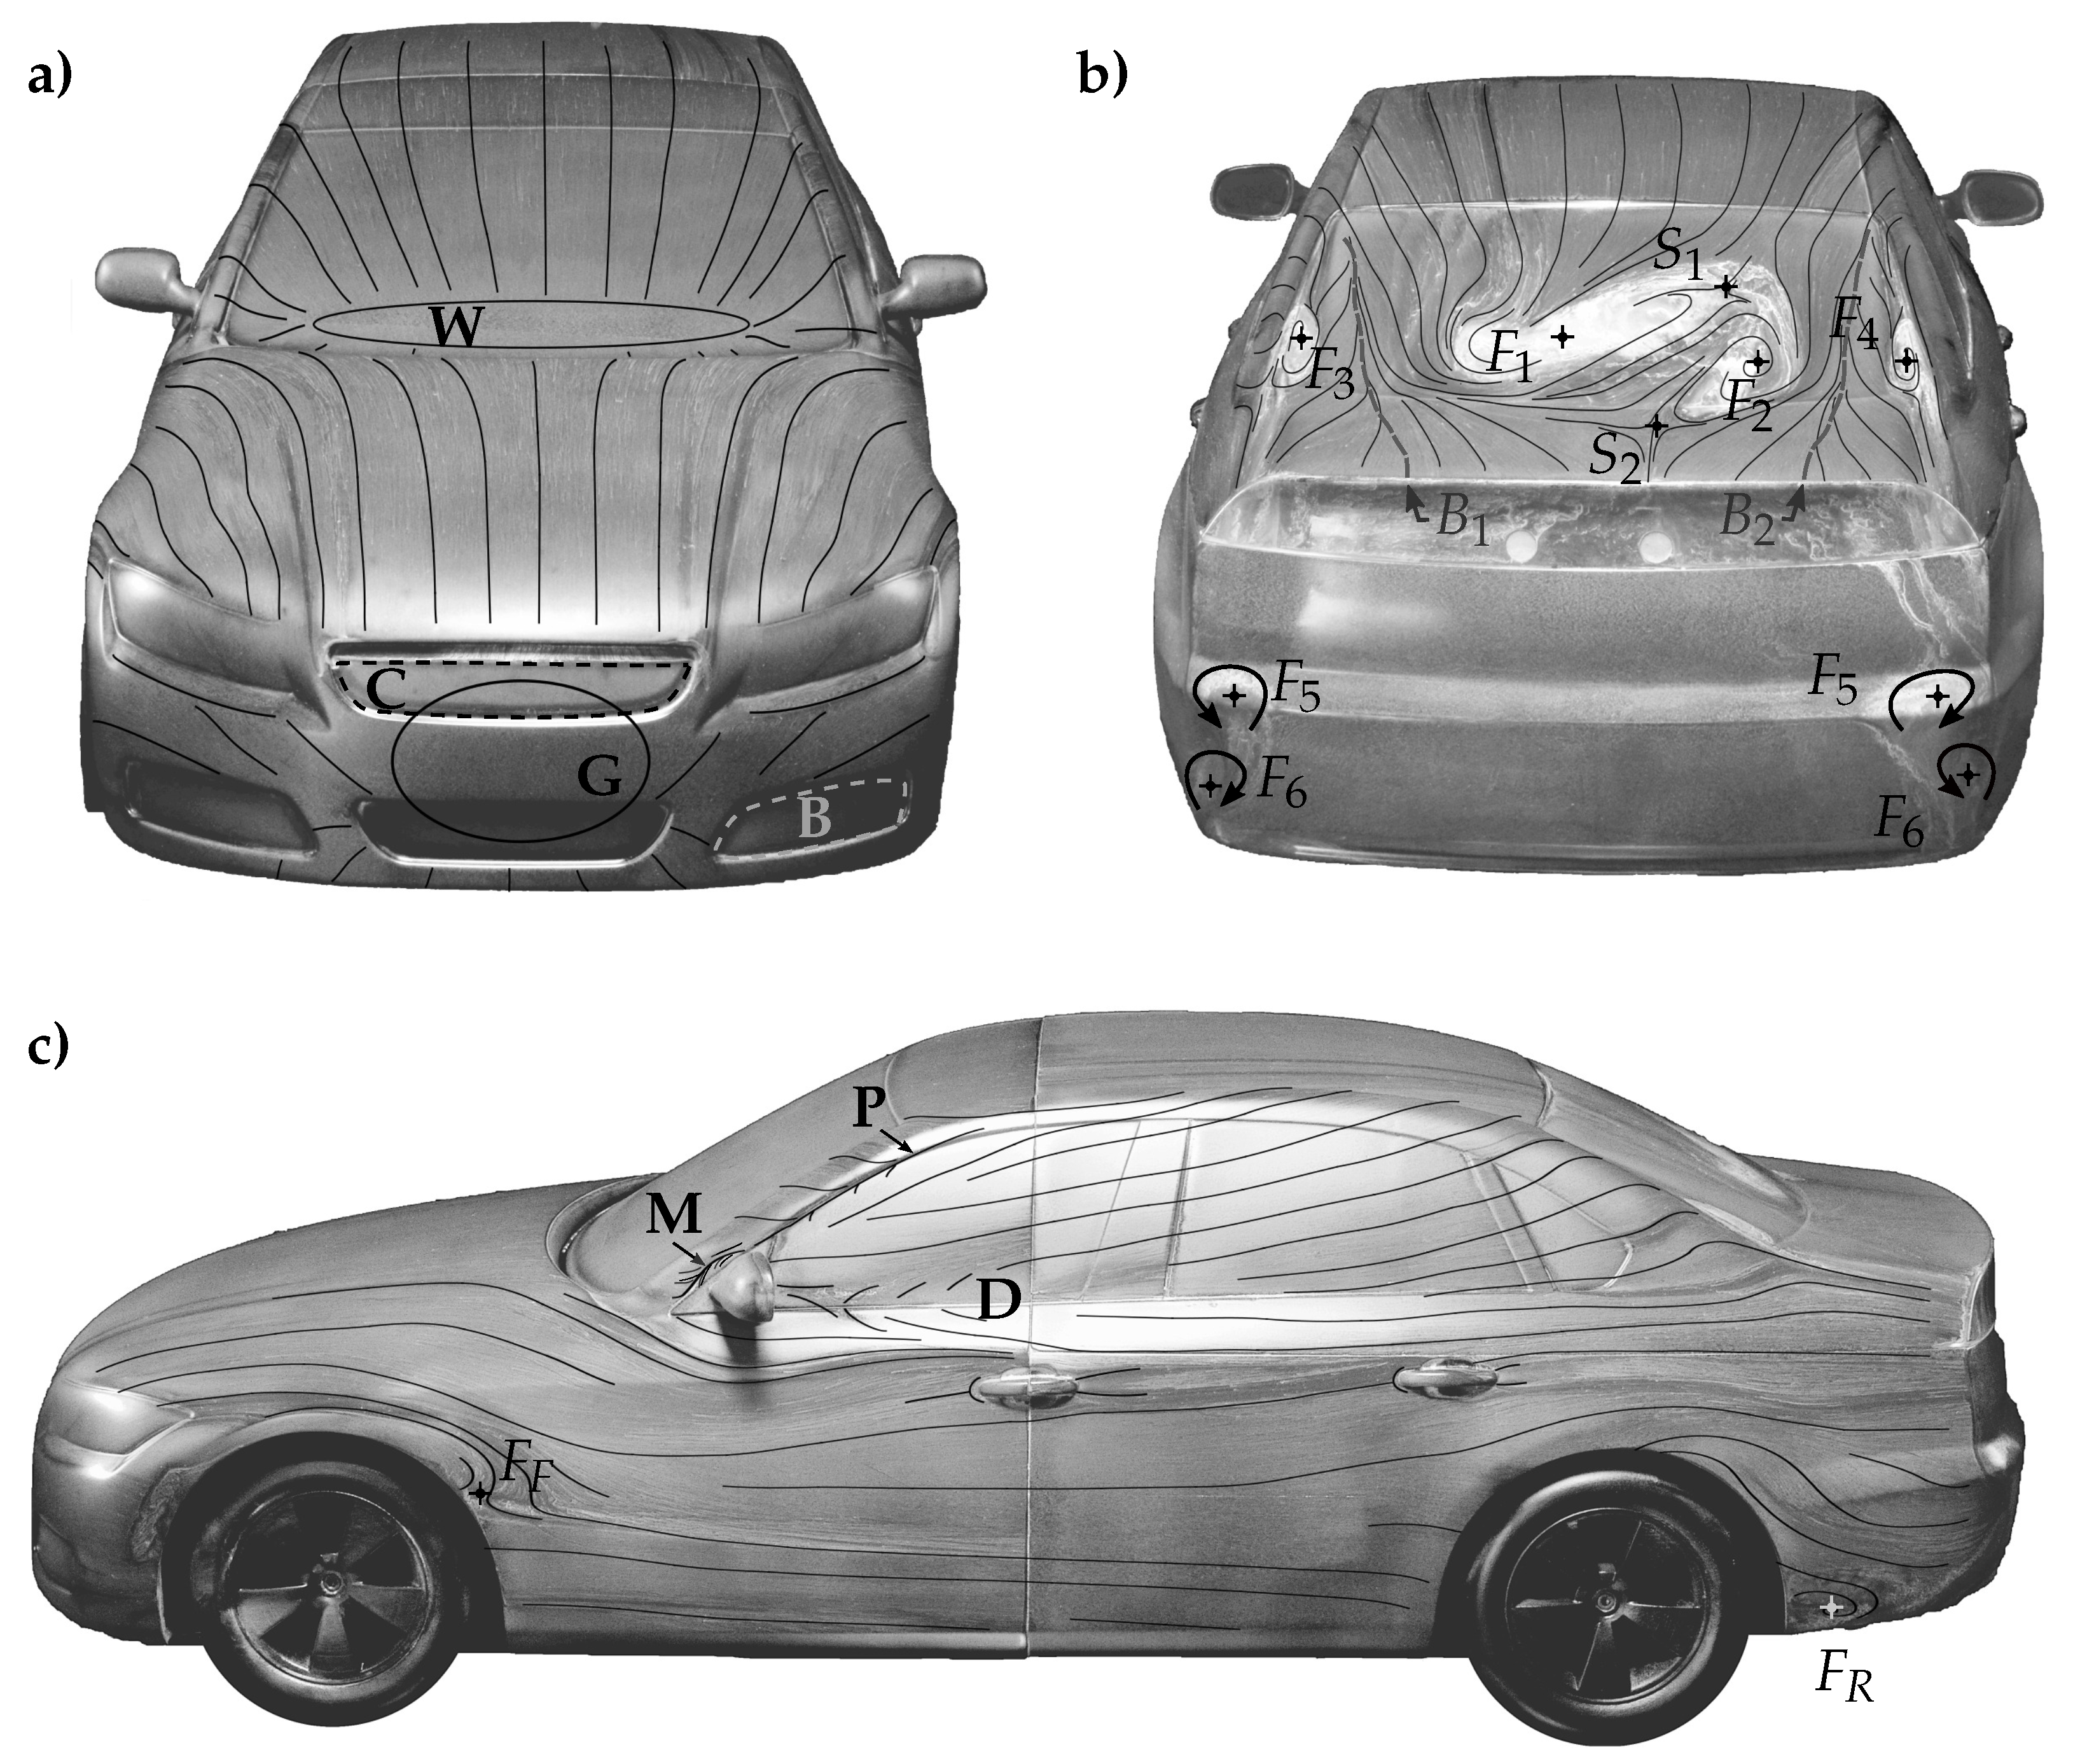
Figure 4 illustrates the surface traces on the DrivAer model at
of
in the front, rear, and side views. Only one side of the model is shown here as both sides look the same. The main flow characteristics of the oil traces are emphasized by superimposed limiting streamlines obtained from the in-house trace software.
The surface traces on the model front are side-symmetrical and characterized by two stagnation points. One is located on the lower windshield and another is on the lower grille. Both are indicated by W and G, respectively. However, it is not possible to depict the exact locations, as almost no oil traces are visible within the areas. A closer examination of the front fascia reveals further stagnation lines located on the side and center grills, as shown by the dashed lines B and C, respectively. However, these can be attributed to the closed grill design of the model that prevents any flow.
Figure 4b shows the oil traces on the back of the model. Distinct oil patterns can be seen in the upper part of the rear window and on the upper trunk deck. A closer examination shows that this asymmetrical structure consists of two counter rotating vortex structures that are located directly next to each other. The focus points are indicated with
and
. Both upstream and downstream of the central structure are orthogonal saddle points that formed (see
and
, respectively). The existence of an asymmetric flow pattern on rear windows (often referred to as backlight) of a notchback has been repeatedly documented in several studies [
19,
20]. Nevertheless, the basic driving mechanism is not yet fully understood. Sims et al. [
20] showed that this asymmetric flow topology is always formed for certain geometric vehicle rear-end designs. Furthermore, oil mixture pooling is visible on the outer sides of the rear window (see points
and
). The mixture dried in circular paths reflects the direction of the rotation of the C-pillar vortices. Furthermore, on both sides of the rear window and the trunk deck, the characteristic patterns of the C-pillar vortices were visible, with the oil pattern lines pointing outwards. In addition, the bifurcation lines
and
were visible on both sides.
The development of C-pillar vortices depends considerably on the rear geometry of the vehicle. Basic studies can be found in Ahmed et al. [
21]. No oil traces are visible on the vertical trunk surface because of the flow separation along the downstream direction of the vehicle and the resulting low air speed. However, two focus points are visible on each side. The patterns around the focus point
is caused by the inclined surface of the bumper and, around the focus point
, is induced by the flow in the lower trunk corner, which is often seen on vehicles and bluff bodies [
22,
23]. Ekman et al. [
24] simulated the entire setup of the DrivAer, including the wind tunnel from this study. They showed that there are noticeable differences among the underlying turbulence models of the simulation. In an effective agreement, the vehicle drag between experiment and simulation were found for the SBES model. The best results to reproduce the oil traces were also obtained by the SBES model. The surface pressure correlation varied with turbulence model and vehicle regions considered.
Figure 4c illustrates the oil traces on the vehicle side. As both sides look the same, only one side is shown. Two small recirculation areas are present along the downstream direction of the front and rear wheels around the focus points
and
. The influence of the A-pillar vortex on the oil traces is visible on the upper part of the side window. The traces in this area are significantly directed upward, provoking a separation line directly below the A-pillar edge, as shown by line
P. A stagnation point and an attachment line are also present on the mirror cover (not shown here). At the upstream part of the side mirror exists a further detachment line
M, which is provoked by high static pressure. Below the mirror, there are distinctive flow redirections, which indicate high local pressure gradients around the side mirror. The interference of the side mirror trailing edge with the side window and the side door up to the B-pillar is clearly visible in the
D area by the diverging traces.
3.2. Surface Traces with Crosswind
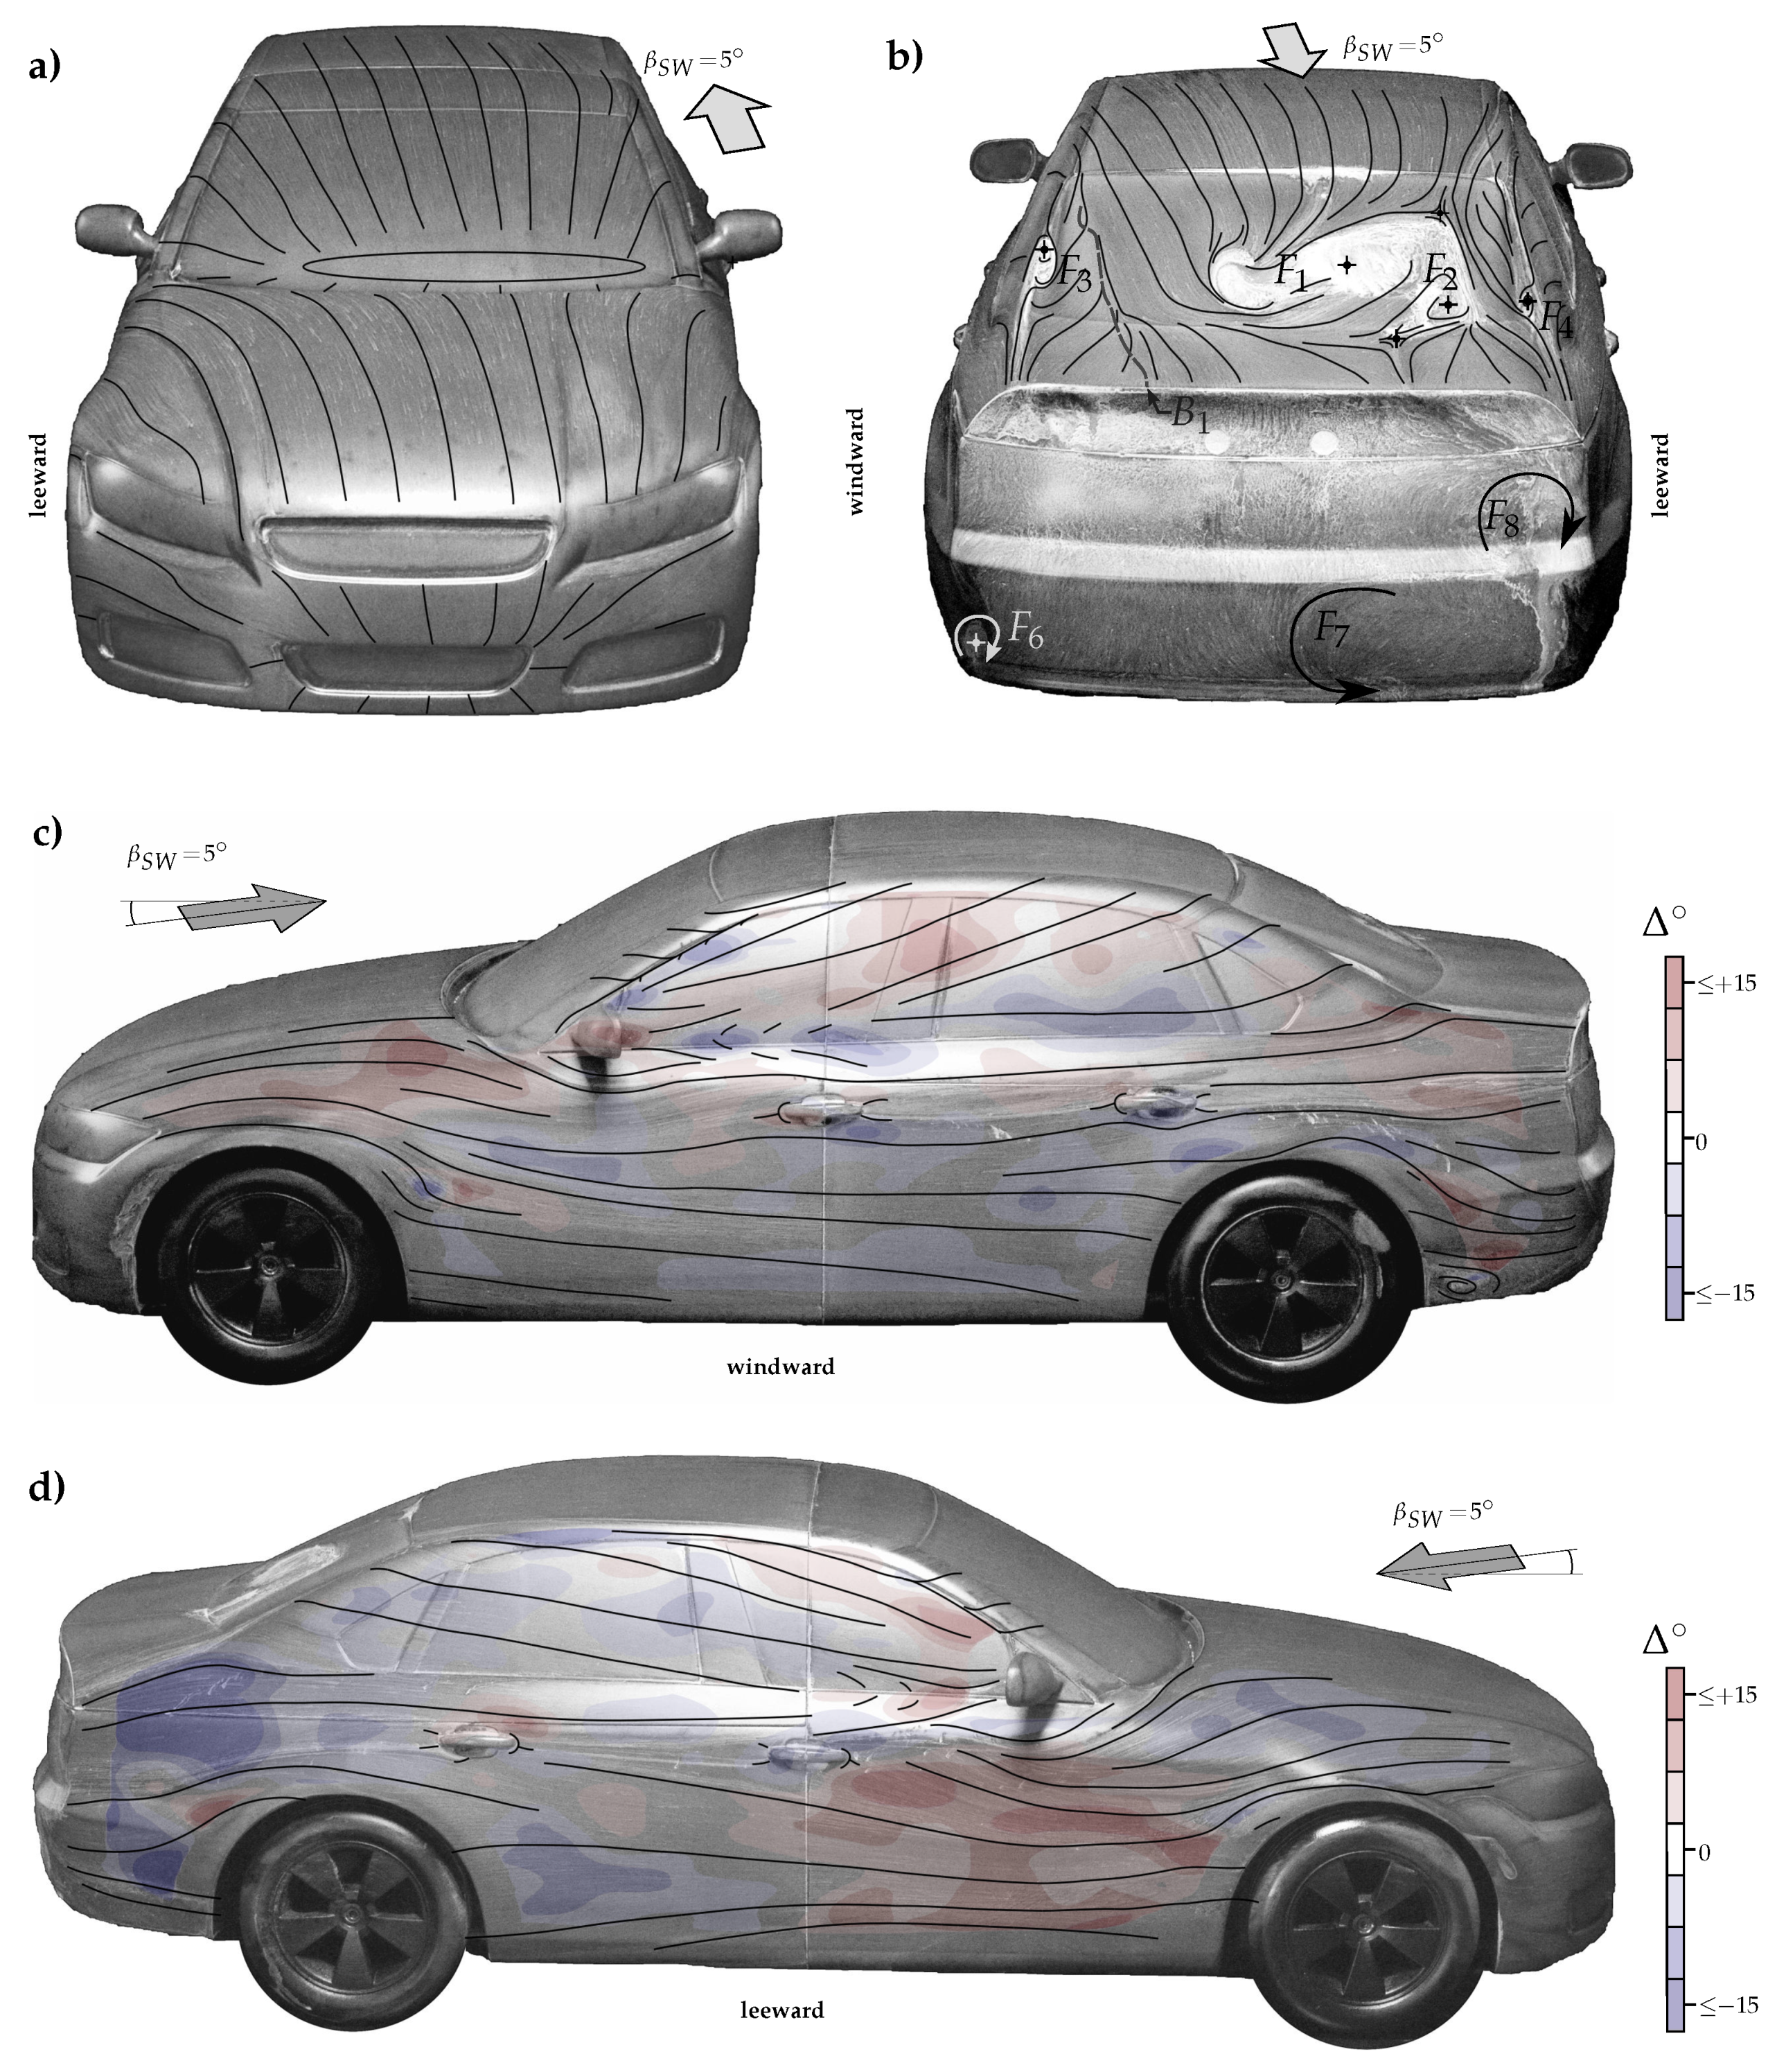
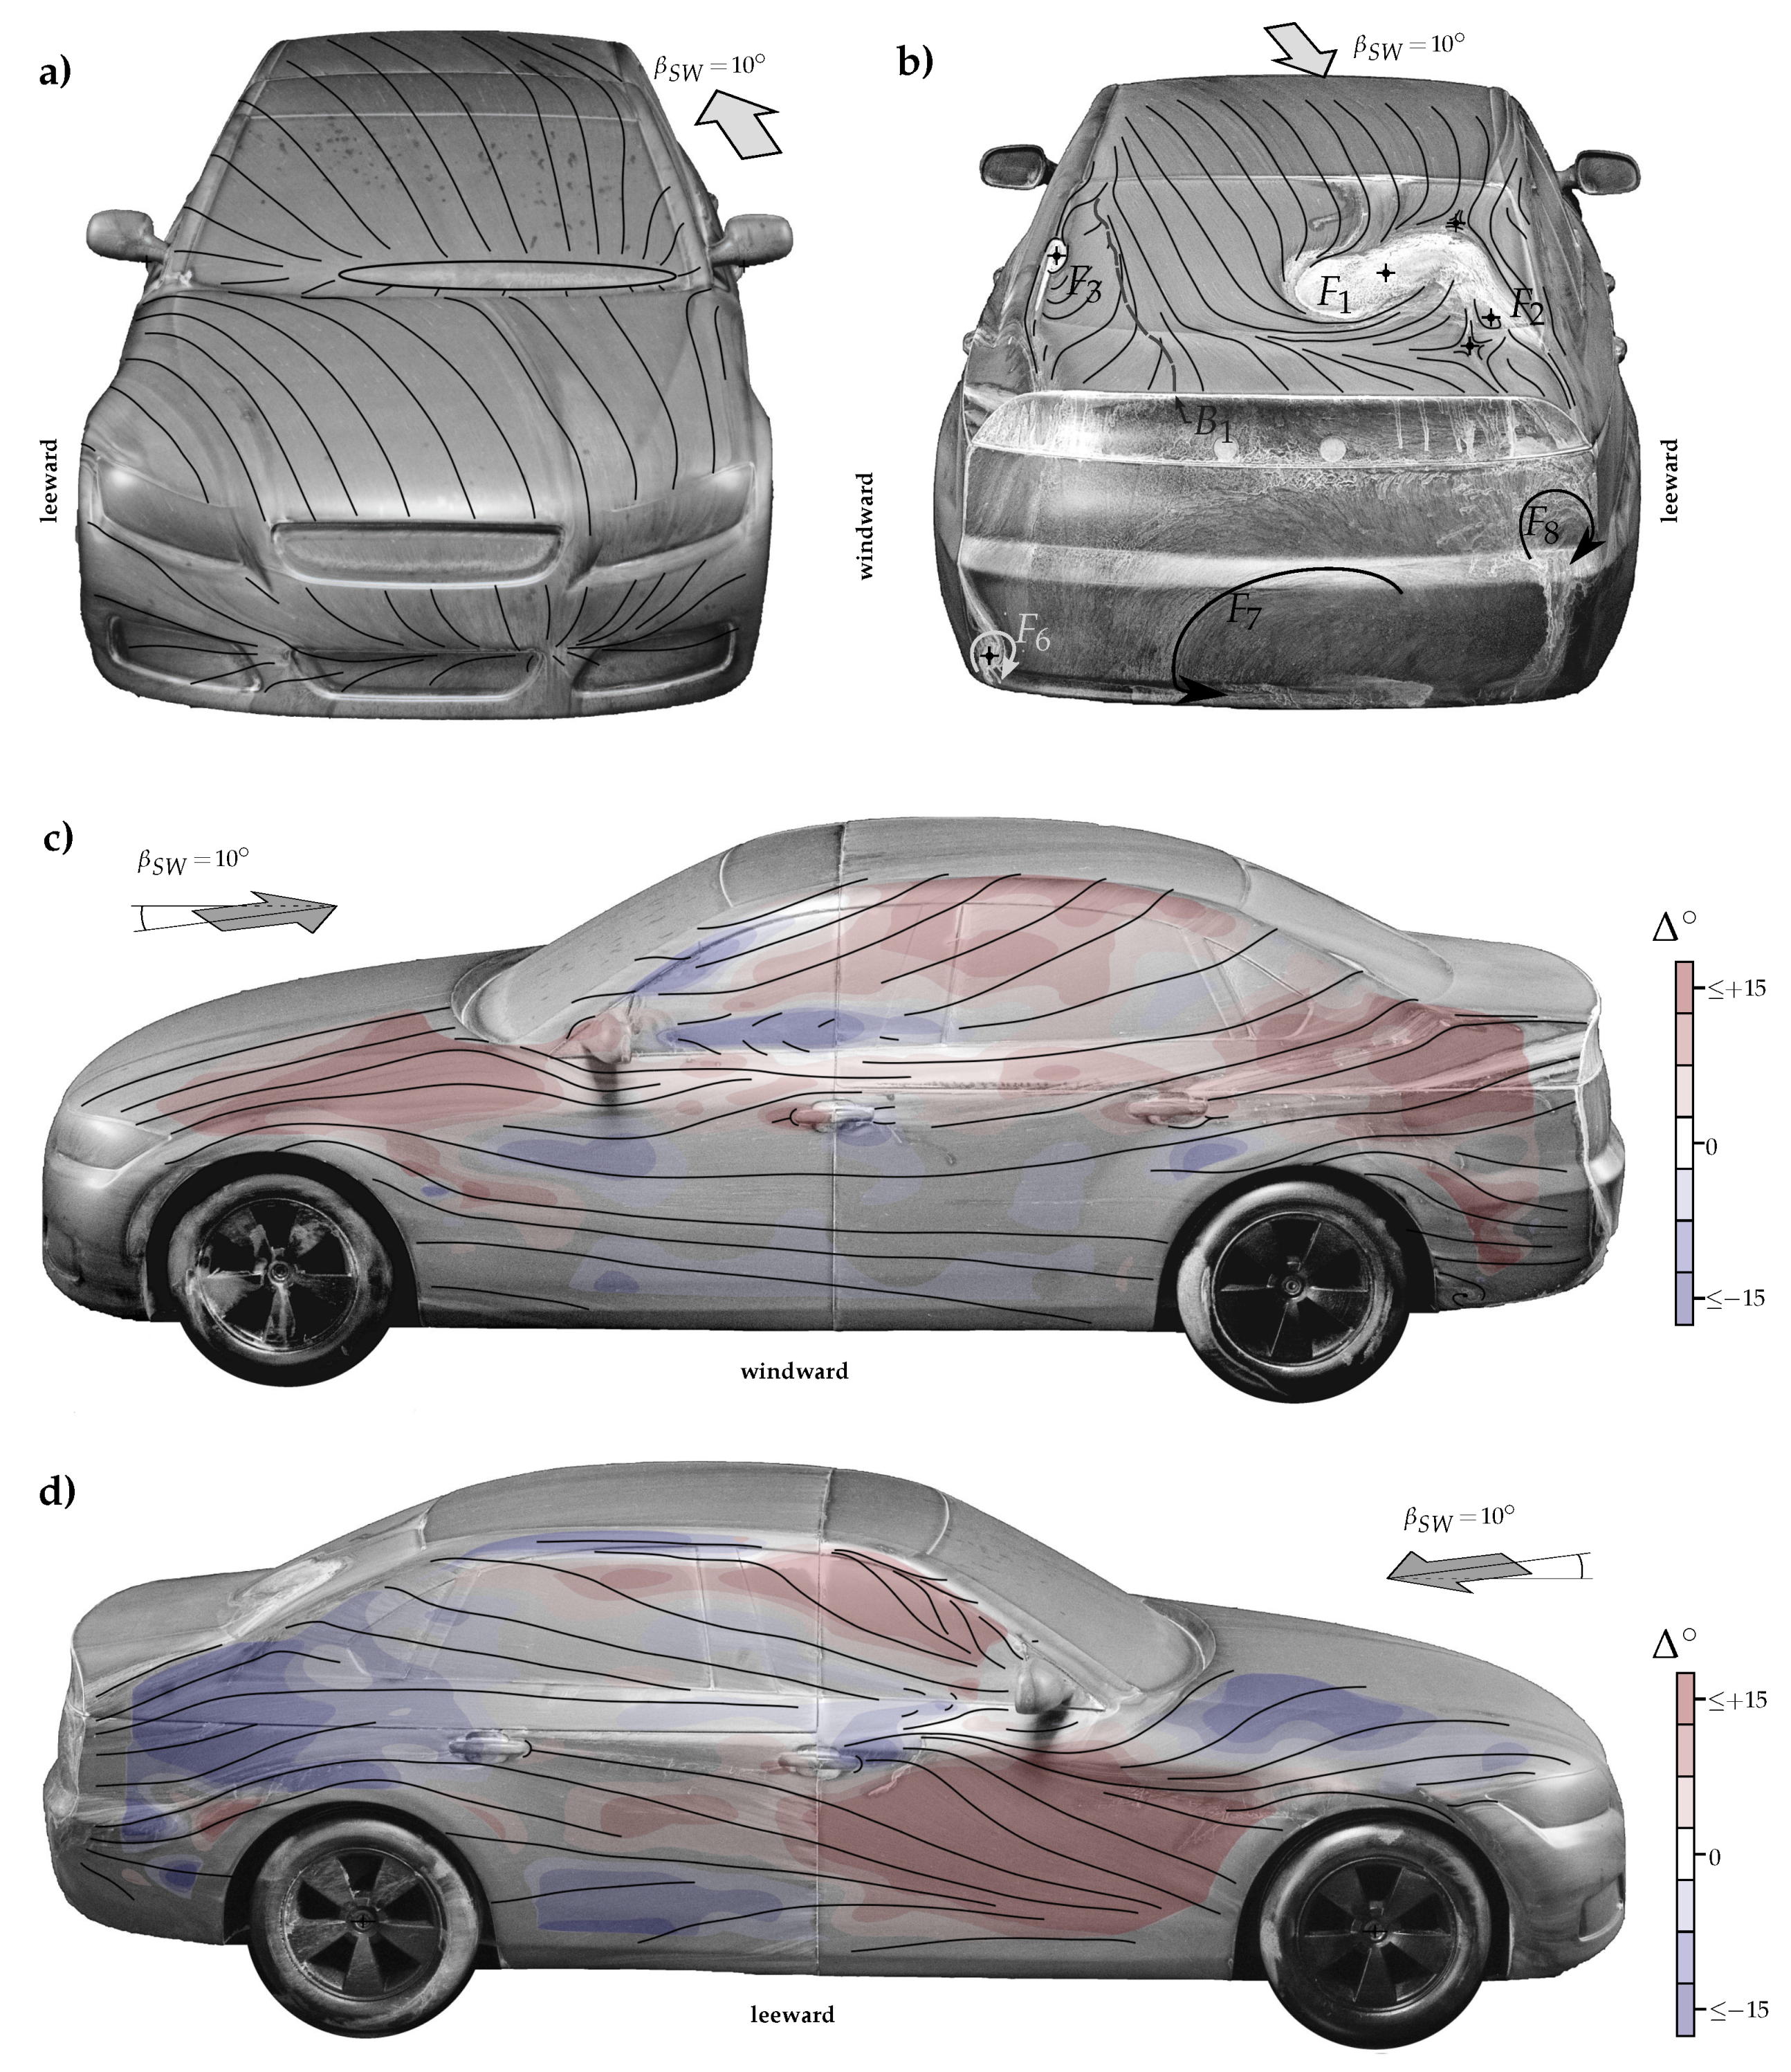
Figure 5 and
Figure 6 show photos of the dried oil traces for
of
and
in the front-, sides-, and rear views, respectively. Similarly, as shown in
Figure 4, characteristic oil traces from the in-house trace software are superimposed into the photos to emphasize the main flow qualities. Moreover, a superimposed, colored map on the sides of the model shows the changes in flow direction between the crosswind case and the baseline case. Red areas indicate more upward directed oil traces compared with the baseline case. Blue areas represent the opposite course. The color map was only used for the model sides because the changes are subtle and difficult to see.
The flow pattern at the front end was no longer side-symmetric under crosswind conditions. The stagnation points at the lower windshield and the grill shifted considerably to the windward side. The oil traces on the leeward side of the front end indicated that a significant portion of the flow passes across the engine hood and the A-pillar toward the model side into the leeward region. The contrary behavior was seen on the windward side of the front end. Particularly at
of
, there was almost no flow around the A-pillar and the engine hood side area towards the vehicle side. The changed flow around the front section has a significant impact on the flow at the sides, as shown later. Studies have shown that the side wind significantly changes the flow around the A-pillars and, thus, the development of the A-pillar vortex [
25,
26]. At the top right of the figures, the traces are visible on the rear side of the model. The large asymmetric flow pattern composed of the focus points
and
on the rear window were clearly shifted leeward and reduced in spatial dimensions compared to the baseline case. The C-pillar vortex on the windward side and the focus point
were still present at side wind conditions. The characteristic oil pattern on the rear window and boot deck caused by the C-pillar vortex extended further toward the center of the vehicle, as can be seen by the bifurcation line
. This was concordant with the pressure measurements shown in
Figure 2, where the local maximum pressure caused by this vortex also gradually shifted leeward. A completely opposite effect was observed for the C-pillar on the leeward side. While at
of
, a small focus point
was visible, at
, it disappeared completely because of the reduced flow around the C-pillar. In addition, the flow structure consisting of
and
in this area could also have an influence.
Several oil traces, which were caused by secondary flows and were previously not present at
, were visible on the vehicle base. In the lower part at the center of the base, a large structure was visible at
and
, which is indicated with
. On the leeward side of the base surface, another vortical structure was visible around the focus point
. Exact localization of both positions of the focus points was impossible as only a few discrete traces were present at the center of the structures. At the lower corner on the windward side, the focus point
, which represented the only remaining structure compared to
, was present (
Figure 4).
Figure 5 and
Figure 6c show the oil traces on the windward side of the model at
and
, respectively. In the lower midsection of the side doors, there were only minimal effects of the crosswind. The flow directions of the oil traces were almost identical at
,
, and
. However, on the engine hood, the roof rail, and the trunk, significant changes were visible, especially at
. The red areas reveal a distinct upwind compared to
. Moreover, the wake of the side mirror was displaced upward and lay now completely on the vehicle side window. A blue area is visible below the A-pillar. Already, according to the front view, the flow around the windward A-pillar reduced with the side wind, which led to a reduced intensity of the A-pillar vortex. Consequently, the shear stresses on the oil mixture through the A-pillar vortex were also reduced, causing the oil mixture to be less clearly transported upward. Finally, the flow separations downstream of the wheels around the focus points
and
were no longer present.
Figure 5 and
Figure 6d illustrate the oil traces on the leeward side of the model at
and
, respectively. The trace pattern on the leeward side differed completely from those on the windward side. A significant influence of the crosswind was especially visible in the front area through the red area, which reveals oil traces directed upwards compared to
. The reason for this cannot be disclosed here, as no data of the external flow field were available. The literature shows that a longitudinal vortex can occur on the leeward side of the engine hood in crosswind, e.g., on the Willy model [
8]. This longitudinal vortex can be responsible for the upward shear stresses. A further red area was visible below the A-pillar because of the intensified vortex, as the flow around the A-pillar was considerably more pronounced at side wind conditions. The increase in the intensity of the A-pillar vortex in the DrivAer model at crosswind conditions was also reported in the results of other studies [
25]. The impact of this intensified A-pillar vortex on the wake will be discussed later in the PIV results. The oil traces further downstream on the rear area of the model side on the fender showed a downward direction (blue area). The reason for this cannot be clarified as no information on the flow field data existed in this area either. However, it is evident that the flow topology on the vehicle side prevents the flow around the C-pillar and, thus, the development of the C-pillar vortex.
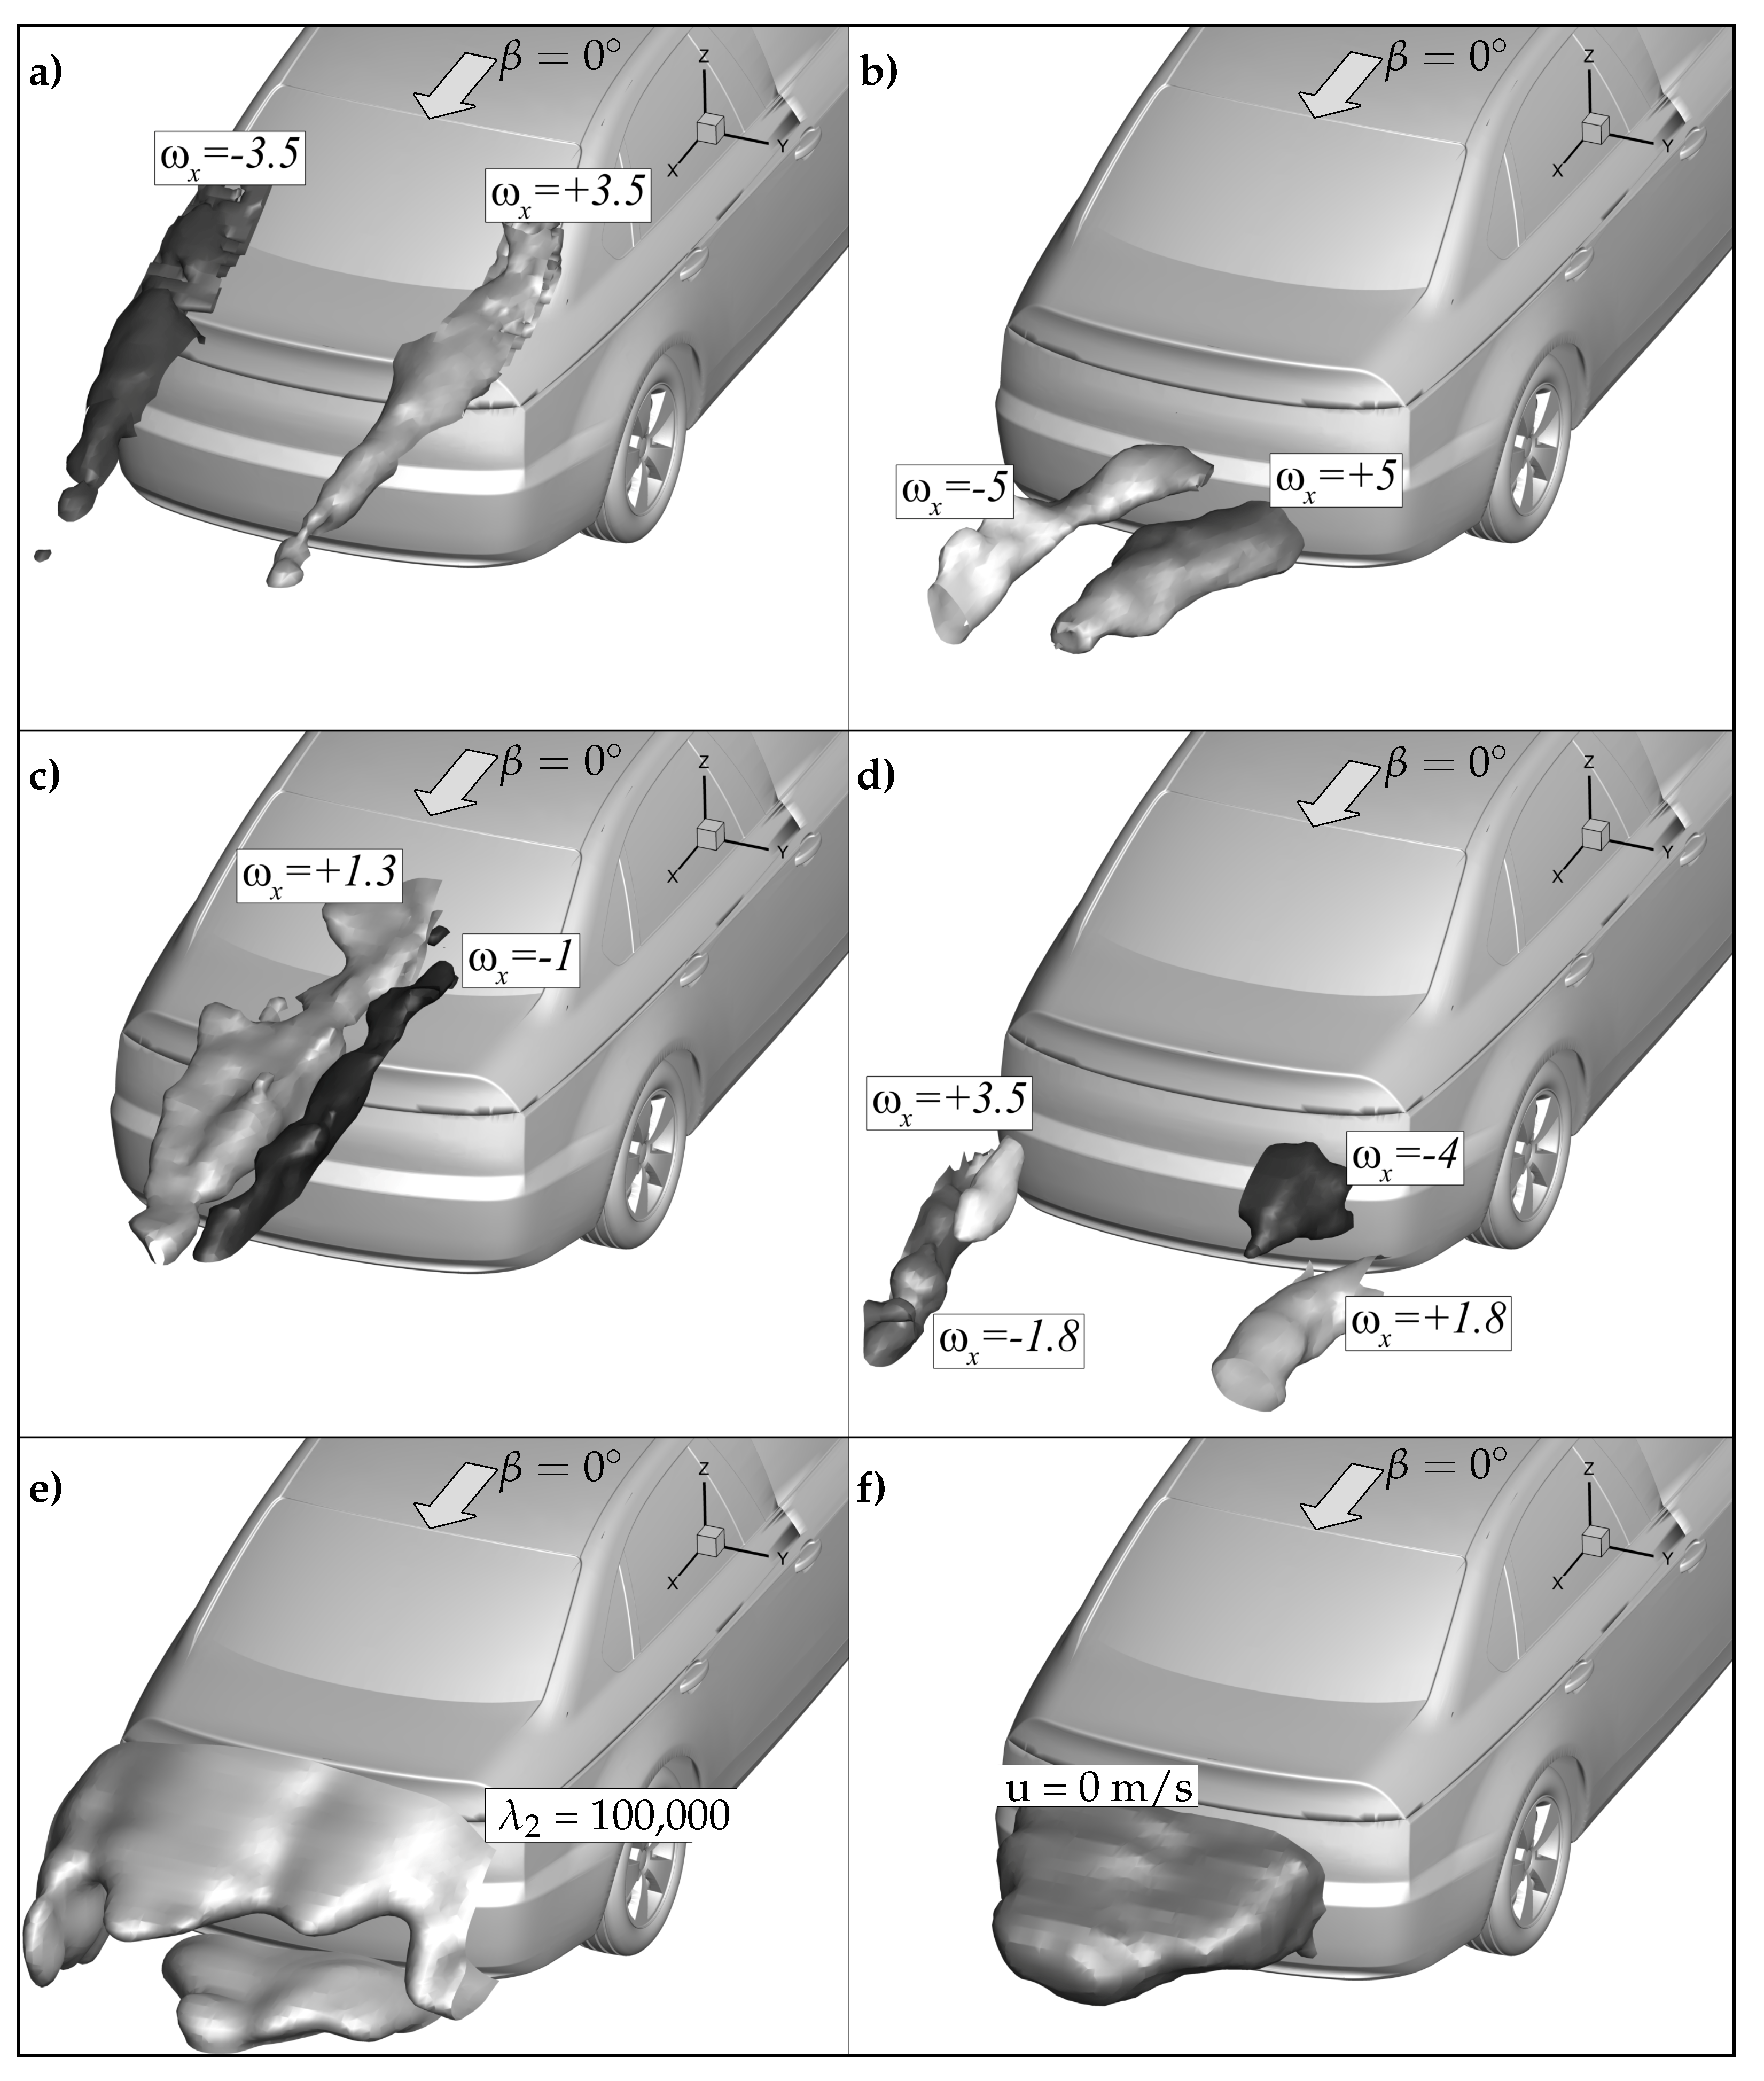
3.3. Wake Flow Field without Side Wind
Figure 7a–f shows the flow field without the crosswind downstream direction of the model. In the top four images, selected longitudinal vortices are shown by isosurfaces of dimensionless vorticity
, which is determined by
where
is the vorticity.
Figure 7a,c visualizes the vortices along the downstream direction of the rear window. The two longitudinal vortices of the C-pillars look qualitatively similar for
. Both isosurfaces extend to the end of the captured measurement region and thus confirm the robustness of the vortices. In the middle part of the rear window, there are two counter rotating vortex structures, with the vortex on the left side much more pronounced than that on the other side. However, both intensities are considerably lower than those of the C-pillar vortices. The flow structures identified by PIV shows excellent accordance with the surface traces of the oil paint in
Figure 4. Both the locations of the oil mixture pooling around the focus points
to
and the courses of the attachment lines at the rear window and at the boot deck can be attributed to these flow structures. Qualitative overviews of the courses of the vortex cores both in the top view and in the side view are shown separately later.
Figure 7b,d shows the downstream vorticity
of the vehicle base. At the center of the base, there are two large-scale counter-rotating vortices. Although their vorticity is very high, their existences remained undiscovered in the flow visualization, which suggests that they do not exist directly at the base surface. Two further vortices are visible at each side of the vehicle base. The intensity of the base vortex is slightly less than that of the upper vortex, which is induced by the geometric shape of the bumper. The isosurfaces of the vortices are similar on both sides and differ only in the respective direction of the rotation. The comparison with
Figure 4 shows that these side vortices are accountable for
and
.
The downstream vortex criterion
of the model is shown in
Figure 7e. This criterion is applicable to identify vortex structures in a three-dimensional and complex flow field.
is defined as the second eigenvalue of the equation
, where
and
. The exponent
T denotes the transpose operation, and
J is defined as the gradient velocity tensor
. As can be seen, there is a so-called downstream ring vortex on the base. It only gets bifurcated at the low corners, which is probably caused by the rear wheels’ wake. The small enlargements at the upper part of the ring vortex reflect the impact of the C-pillar vortices. Thus, the effect of the C-pillar vortices is less significant in this area. The examination of the vorticities,
and
, in this area shows that the vorticity level is approximately five times as high as that of the C-pillar vortices (not shown here).
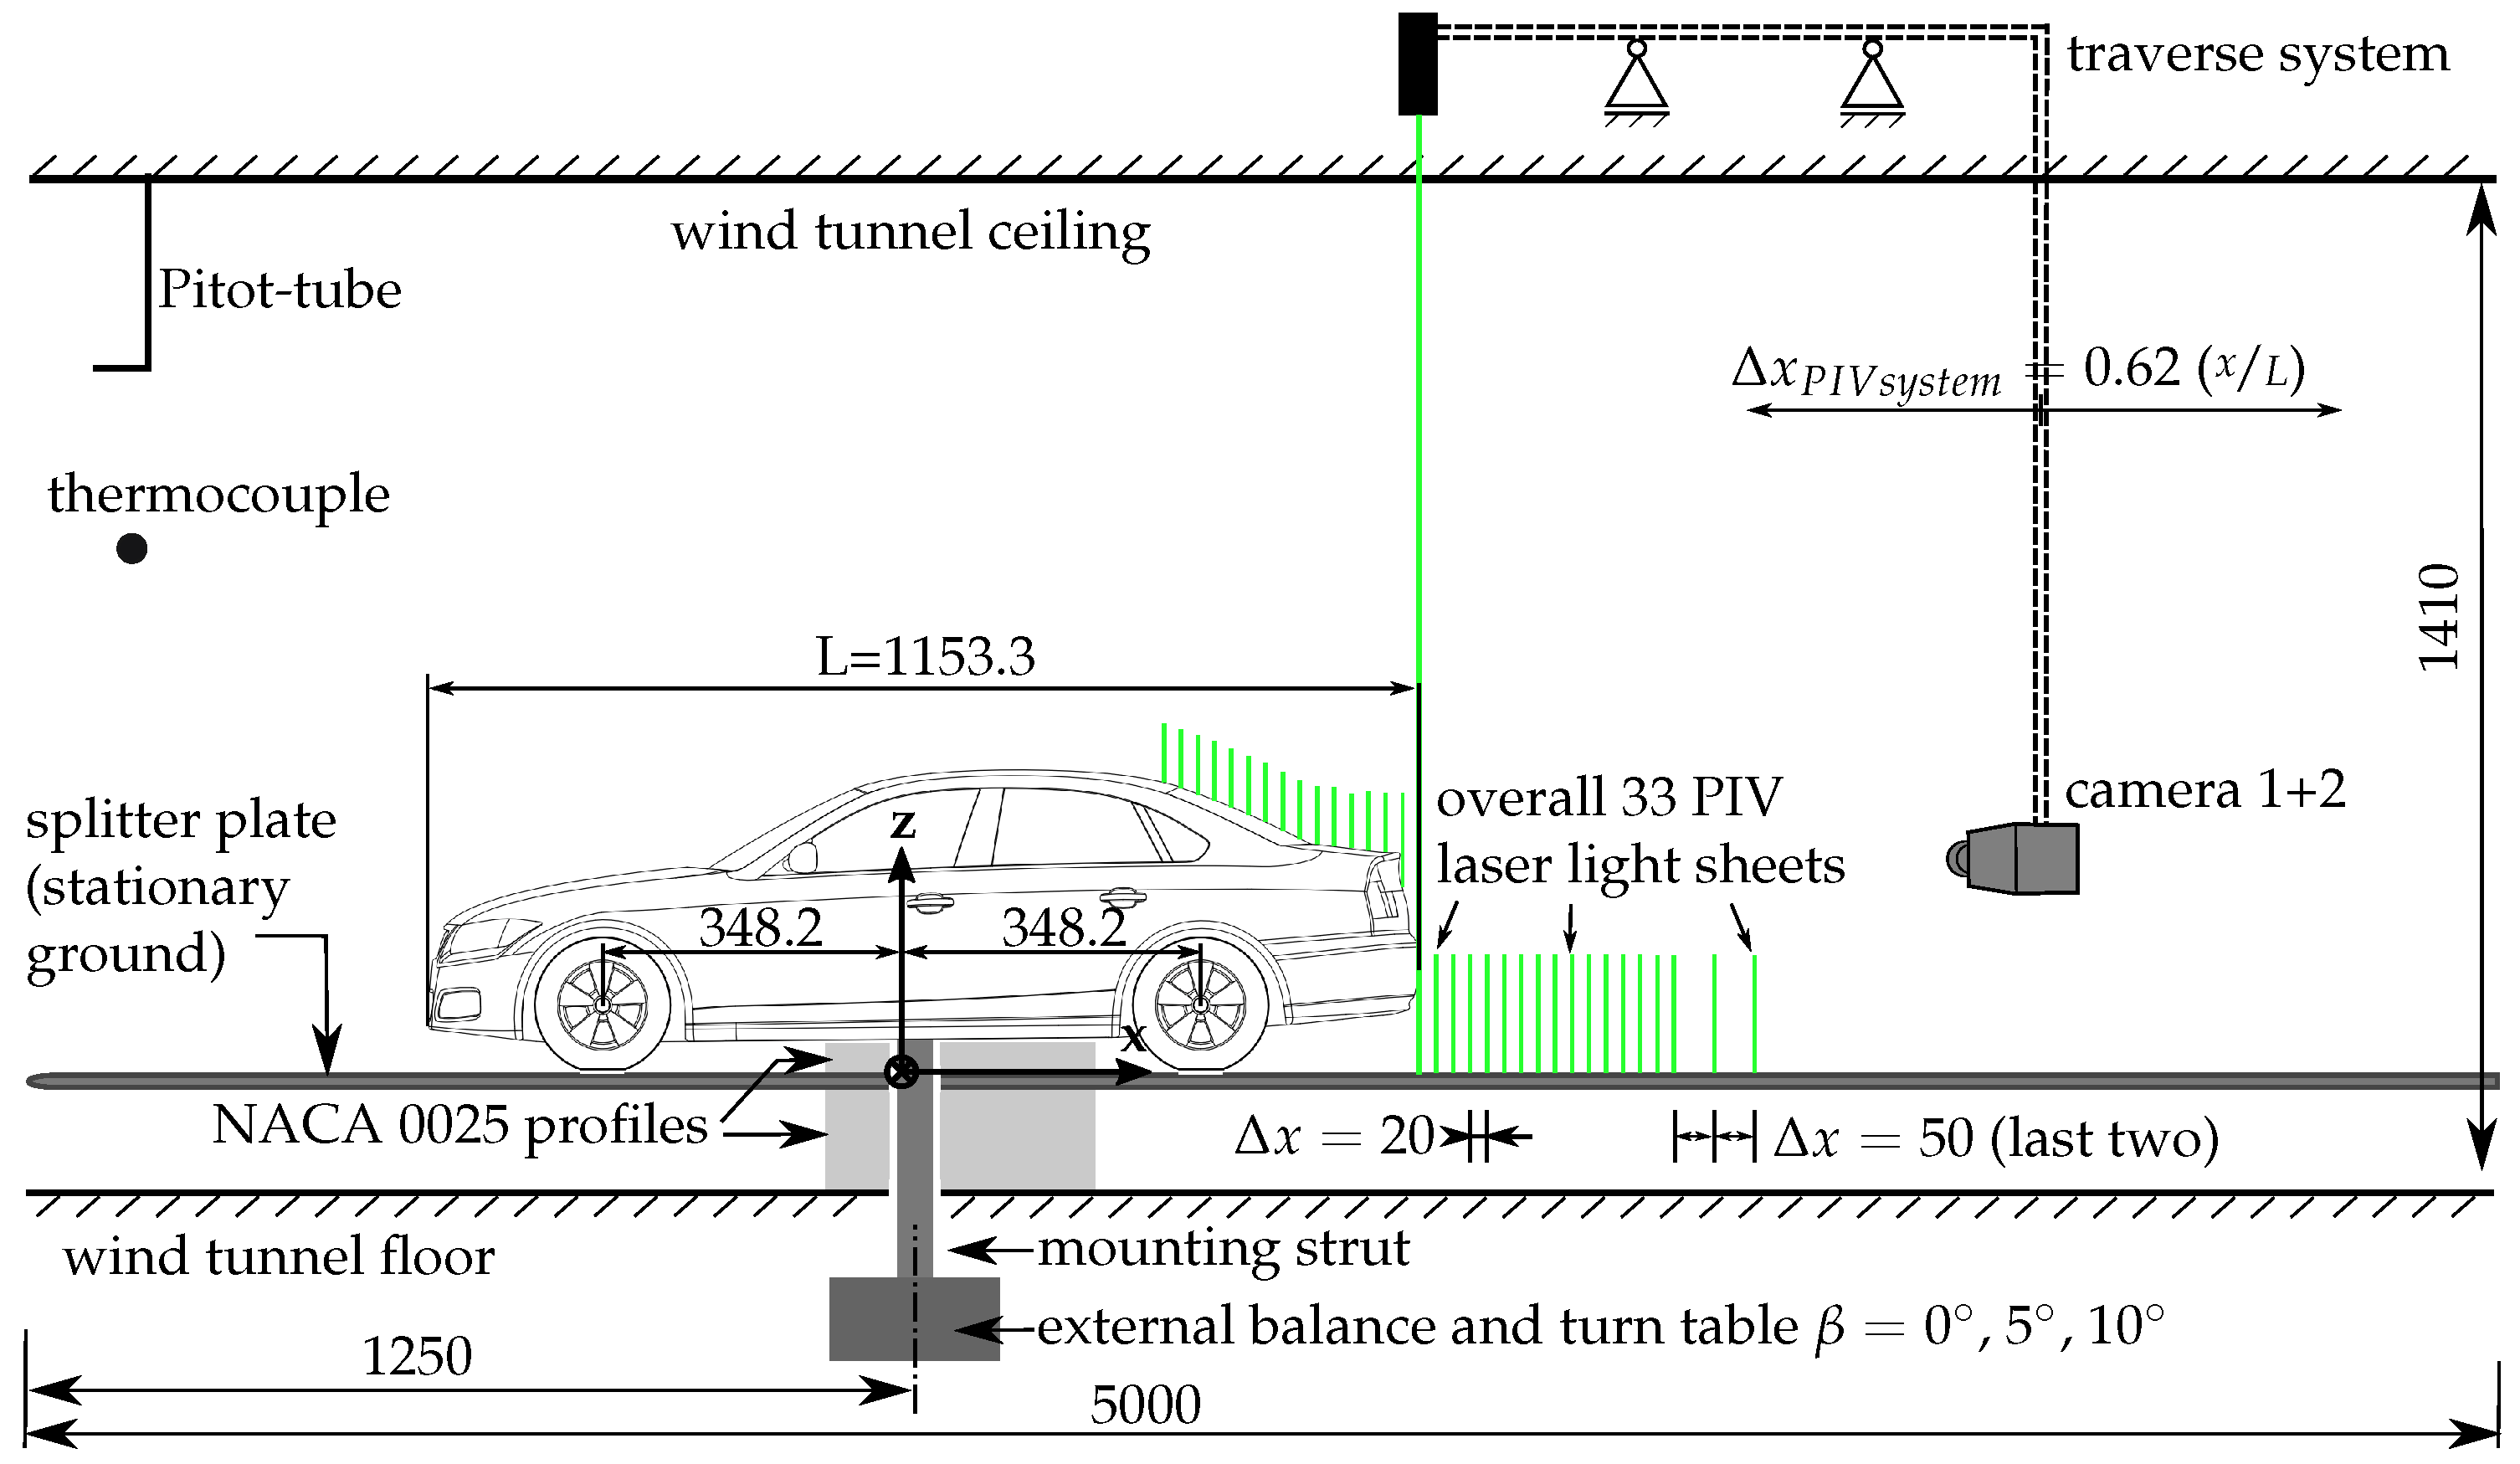
Figure 7f illustrates the contour of zero downstream velocity
m/s of the model. The contour is shaped slightly asymmetrical, which may be caused by a large number of vortices in that area. The maximum extension x/L in the plane of symmetry is approximately 0.15. In an earlier study by Wieser et al. [
10], where the laser light sheet was parallel to the x–z plane and at
y = 0 mm, a maximum length of
was determined. Thus, there is an excellent agreement between the two studies, although the setup of the measurement was different.
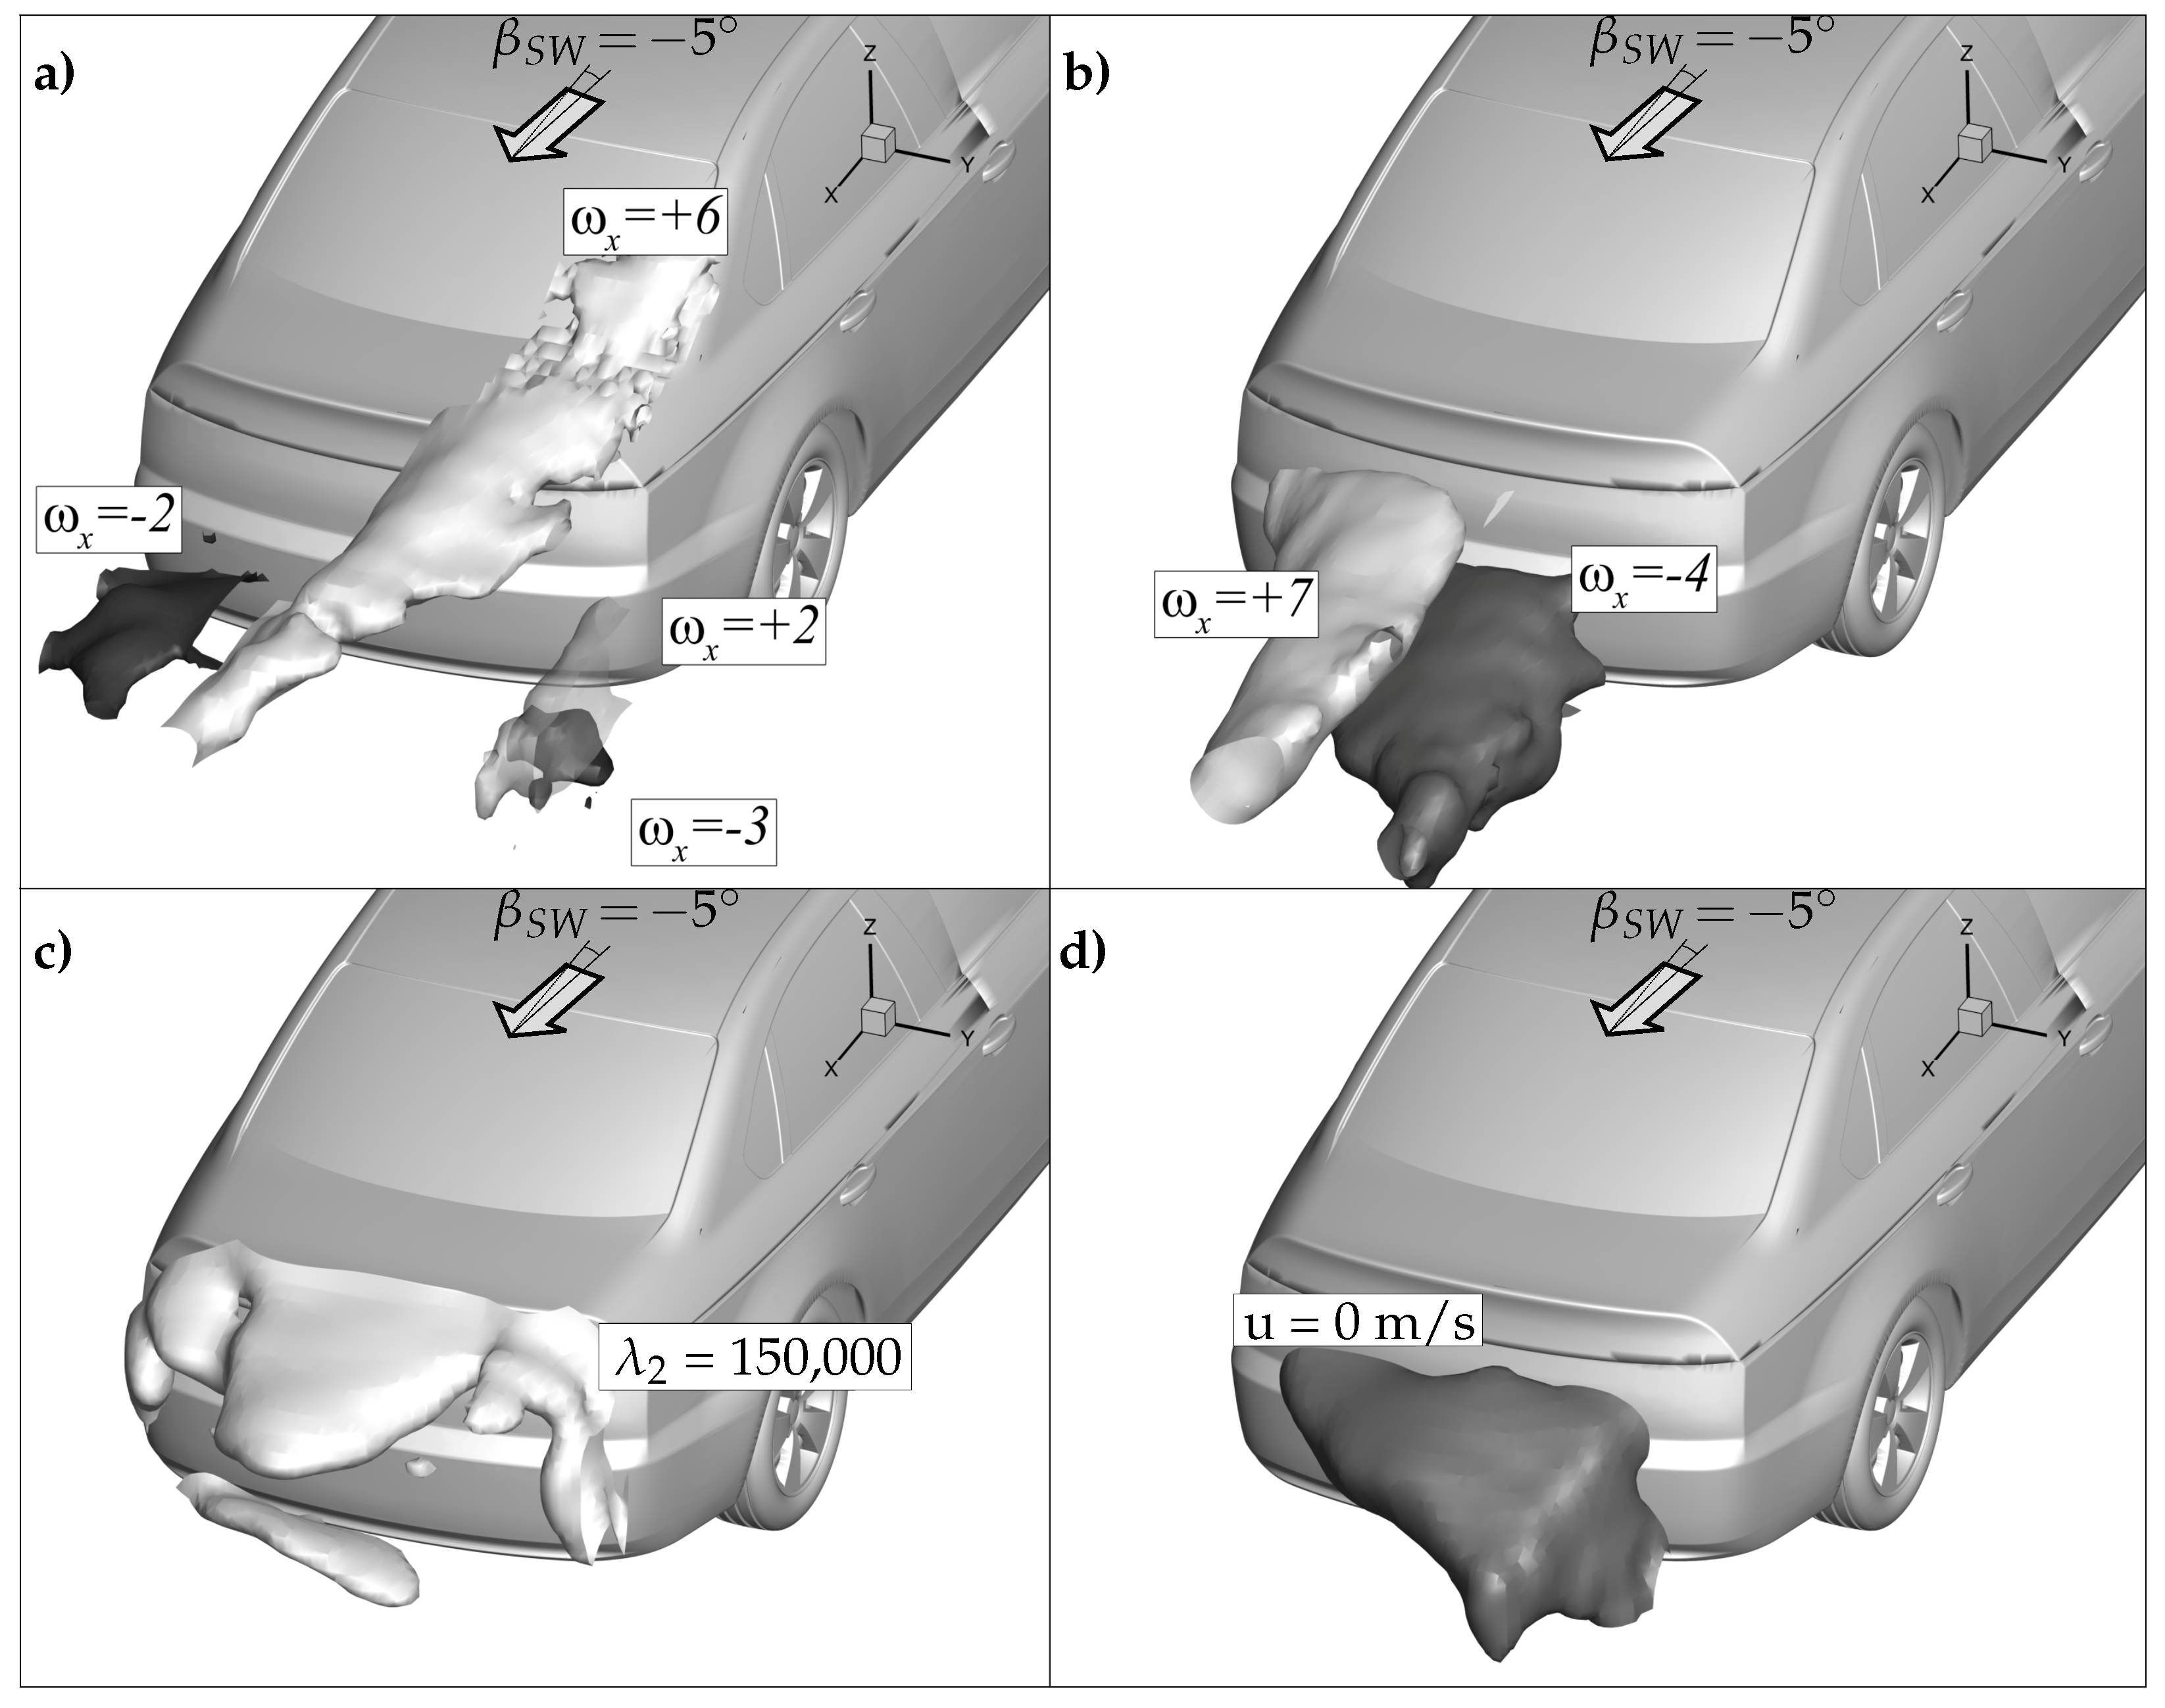
3.4. Wake Flow Field with Side Wind
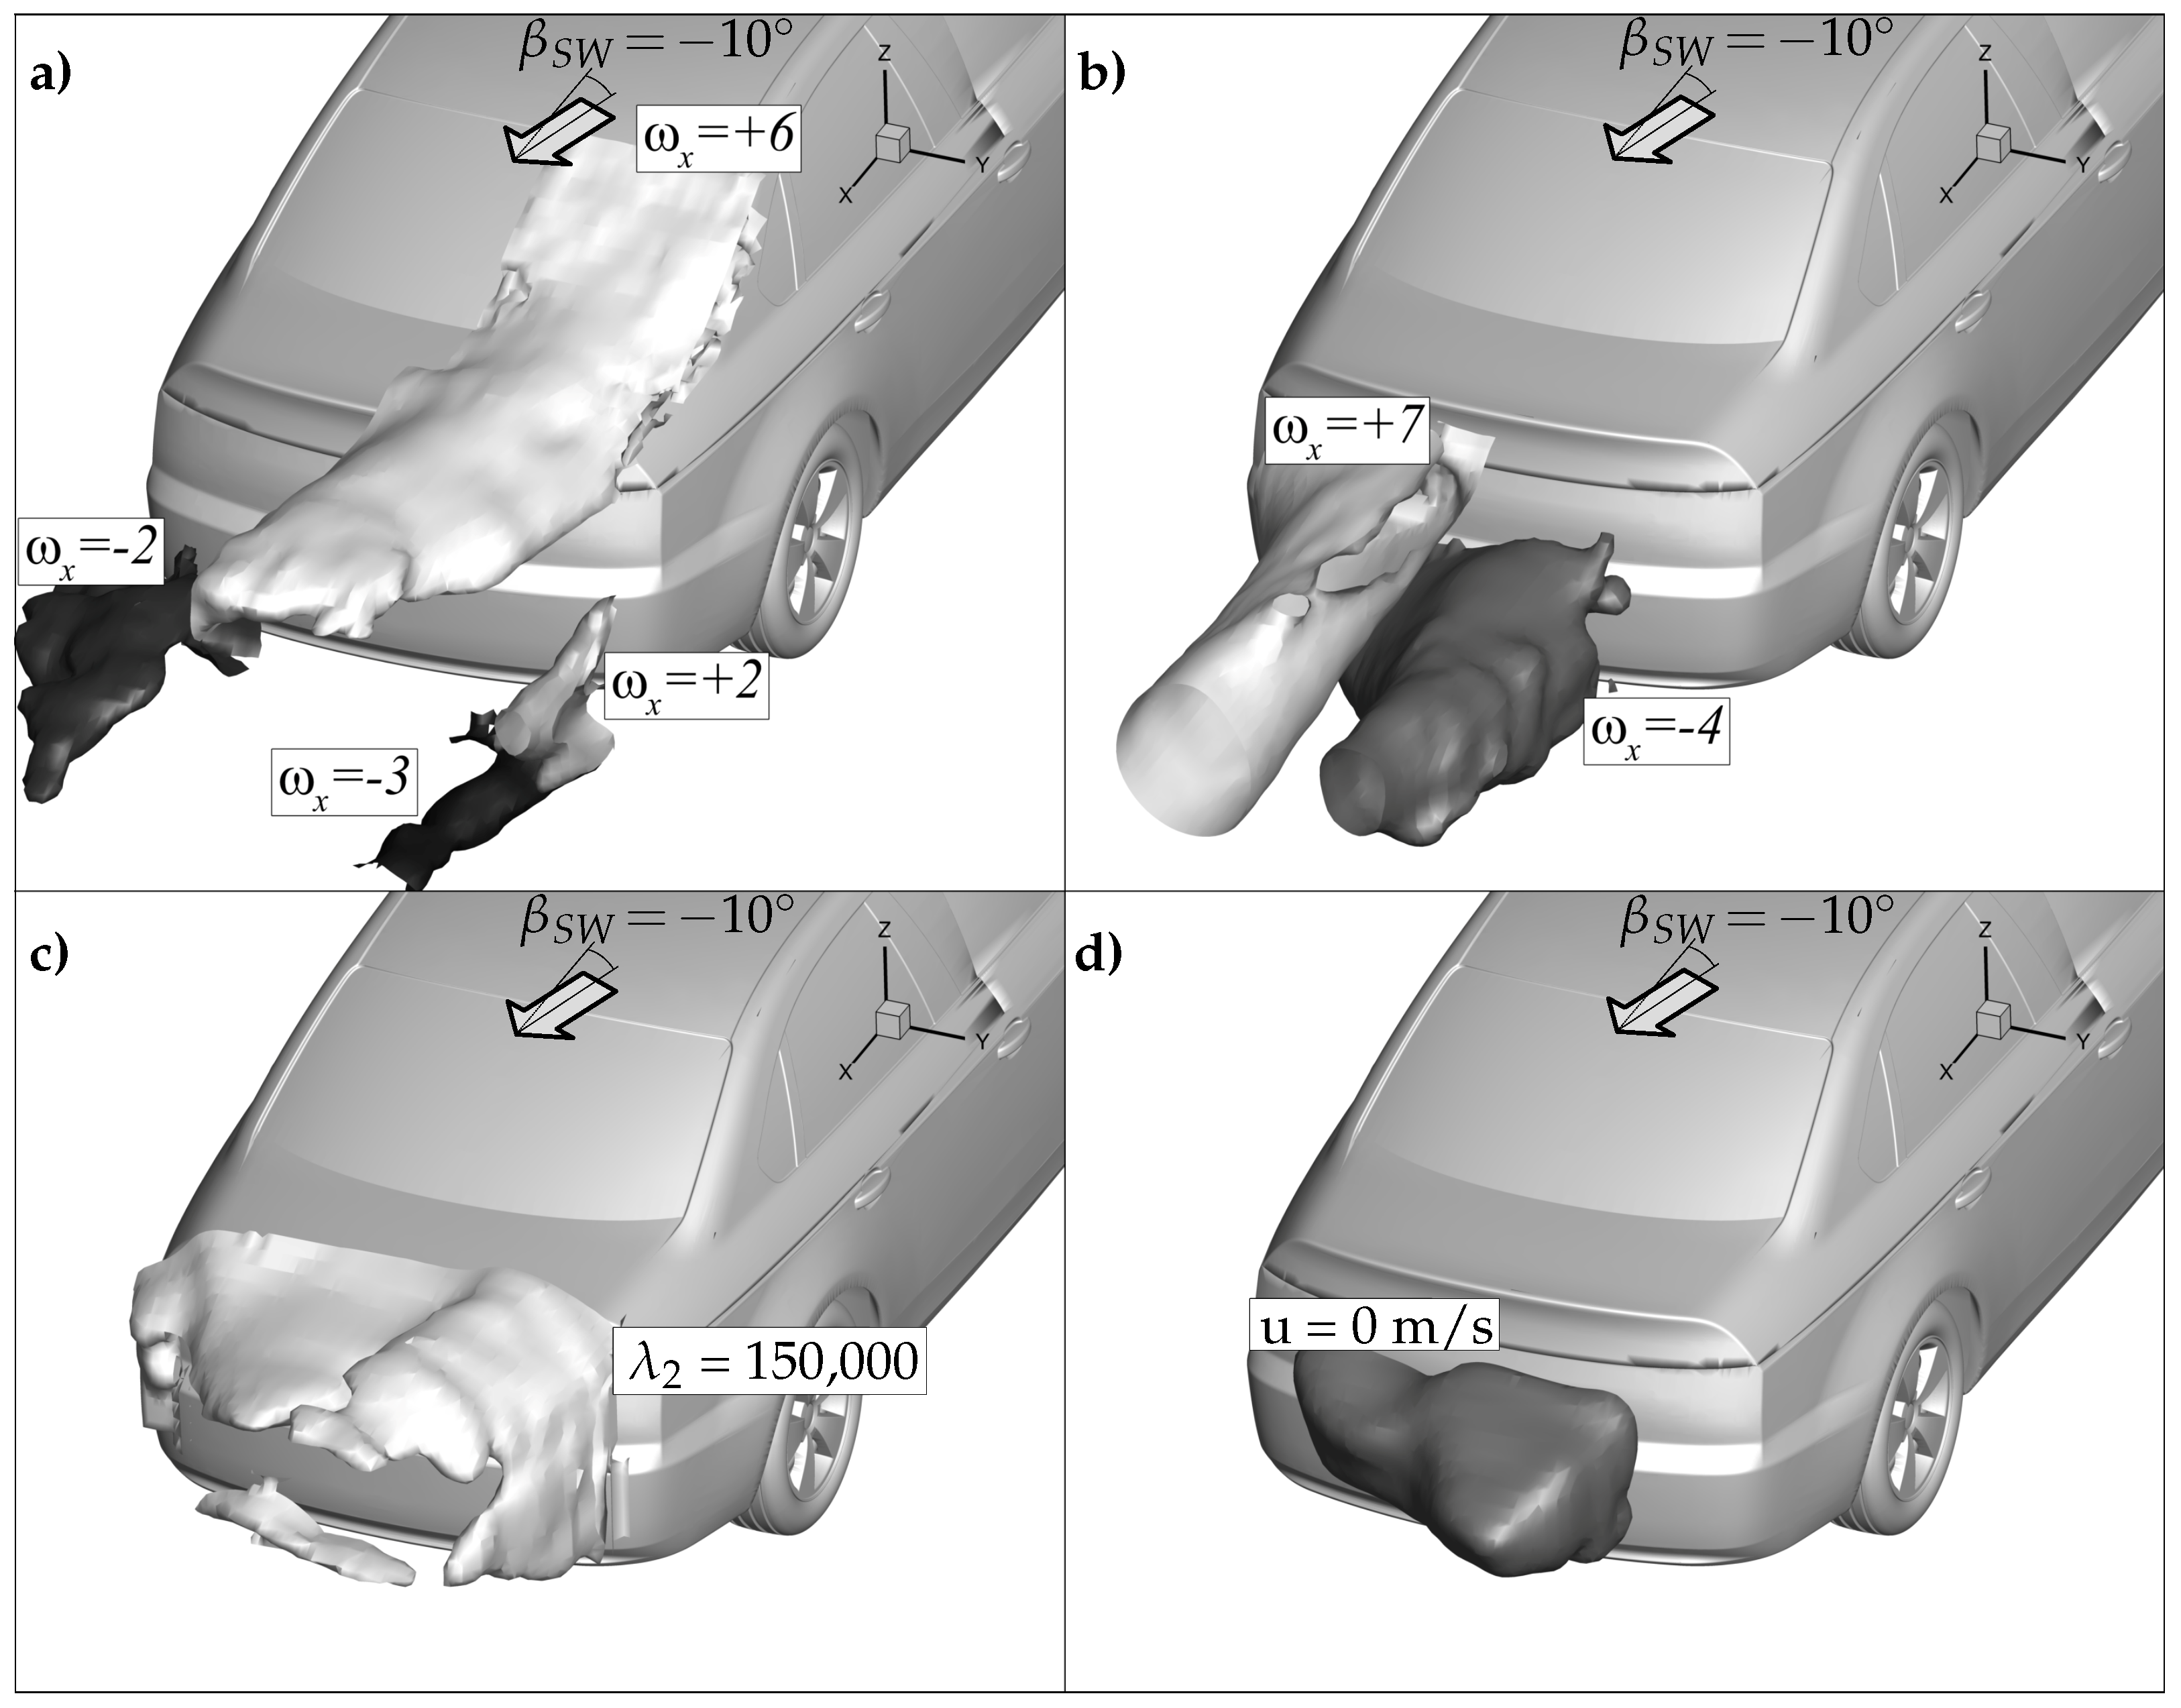
Figure 8 illustrates the external flow field at a side wind condition of
of
. The arrow sign in the figures indicates the direction of the freestream. Please note that the crosswind direction of the PIV measurement and that of the flow visualization are the inverse of each other because of different wind tunnel experiments:
.
Figure 8a visualizes
of the windward downstream C-pillar vortex of the rear window. It can be seen that the vortex level rises significantly with crosswind. The size of the isosurface with
is considerably larger than it was seen at
at
. The C-pillar vortex extends across the entire top side of the vehicle. The increase in the vortex was already observed in the flow visualization as the characteristic footprint in the oil traces was also significantly increased. The comparison with the pressure distribution in
Figure 2 proves that the locations of the pressure minima and maxima coincide with the course of the C-pillar vortex, as marked in the points ①, ②, and ④. The vortices in the middle of the rear window, emanating from the focus points
and
, appeared to be insignificant and were almost invisible in the PIV; therefore, they are not shown here.
of the leeward C-pillar vortex will be addressed later. The flow visualization revealed the existence of three focus points (
,
, and
). The corresponding flow structures were identified in the PIV (
Figure 8b). The highest intensities of
were caused by the vortices of the focus points
and
. However, the PIV showed that both vortices were more centrally located than the traces in the oil paint suggested. The vortex at the lower windward corner, which was responsible for the focus point
, was much less intense with
. In addition to the vortices already mentioned, two more vortices were found in the PIV, which were not indicated in the flow visualization. One emerged from the underbody (
), and the other was on the lower lee side of the base surface (
). The
vortex criterion is shown in
Figure 8c. The level of the
isosurface had to be increased from 100,000 at
to 150,000 at
to display the isosurface completely. It can be seen that the formerly existing ring vortex characteristic decays into several fragments and becomes clearly asymmetrical. The reason for this was high differences in speed at the vehicle base (not shown here). The contour of zero downstream velocity
u = 0 m/s of the model base is visualized in
Figure 8d. Moreover, this isosurface was characterized by an asymmetrical deformation with the largest extension on the windward side. The deformation can be attributed to the high local velocity differences and the multiple vortices shown in
Figure 8a–e.
The increase of
from
to
causes further changes in the flow field. To illustrate the specific differences,
Figure 9 shows all results at
with the same limits as at
. It was found that all identified vortices at
of
also existed at
, even though the sizes of the vortex isosurfaces slightly changed. This is especially visible in the windward C-pillar vortex and the two base vortices (
Figure 9a,b).
Figure 9c shows
in the downstream region of the model base area. Moreover, in this contour, a clearly increased asymmetry and a larger extension in the driving direction was more apparent than it was seen at
. Furthermore, the contribution of the intensified C-pillar vortex was now also clearly visible based on this criterion. The enclosed area of the recirculation area of
ms
−1 shrank significantly under high crosswind conditions (
Figure 9d). For a clear illustration of the isocontours shown here and the recirculation area for all investigated inflow directions, a qualitative representation of top and side views is given at later stage.
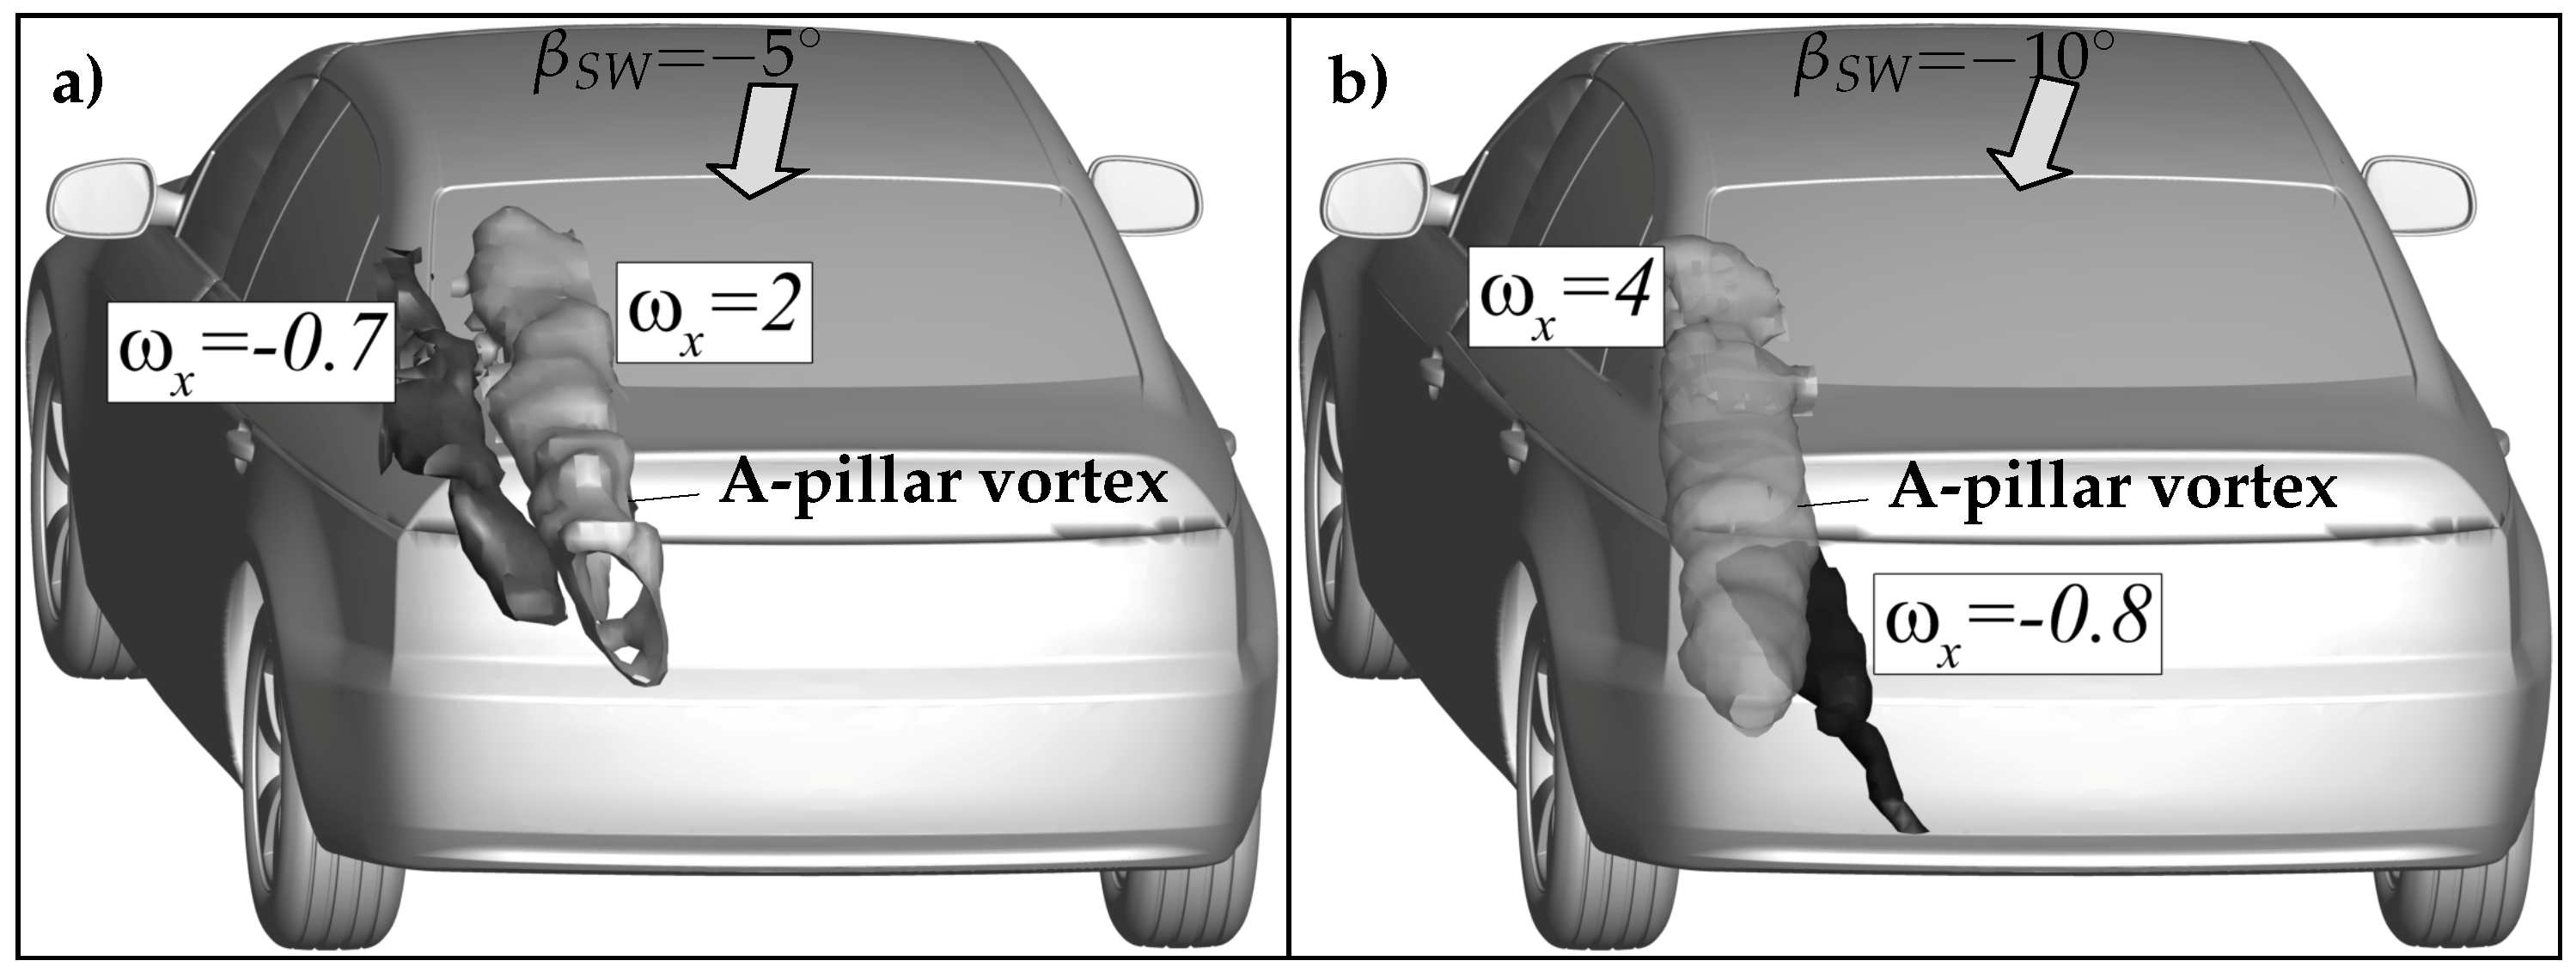
The development of the A-pillar and C-pillar vortices on the leeward side in crosswind has not yet been discussed.
Figure 10 shows both vortices for
and
. The inflow direction of
is not shown here as the A-pillar vortex was not observed in the PIV and the C-pillar vortex was already shown. The traces in the flow visualization already indicated that the A-pillar vortex seems to be successively stronger and that the C-pillar vortex is weaker under the increasing crosswind conditions. Both were confirmed by the flow field measurements.
Figure 10a shows that, at side wind of
, the A-pillar and C-pillar vortices were directly located next to each other. The vorticity level,
, of the C-pillar vortex decreased significantly by approximately 80% to
compared to that at
with
. In contrast, the vorticity of the A-pillar vortex was about three times higher than that of the C-pillar vortex, although it originated from further upstream.
A further increase from
to
has fundamentally changed the flow topology. The vorticity of the A-pillar vortex in
Figure 10b shows that its intensity approximately doubled while the C-pillar vortex was no longer detectable. The A-pillar vortex dominated the entire upper area of the flow field on the leeward side of the model. This observation perfectly complemented the results of the flow visualization. The traces showed an increased A-pillar vortex and a suppressed flow around the C-pillar. In addition, the focus point
of the C-pillar vortex was absent. Below the A-pillar vortex, there was a new longitudinal vortex. It is assumed here that this was induced by the A-pillar vortex as a secondary flow structure.
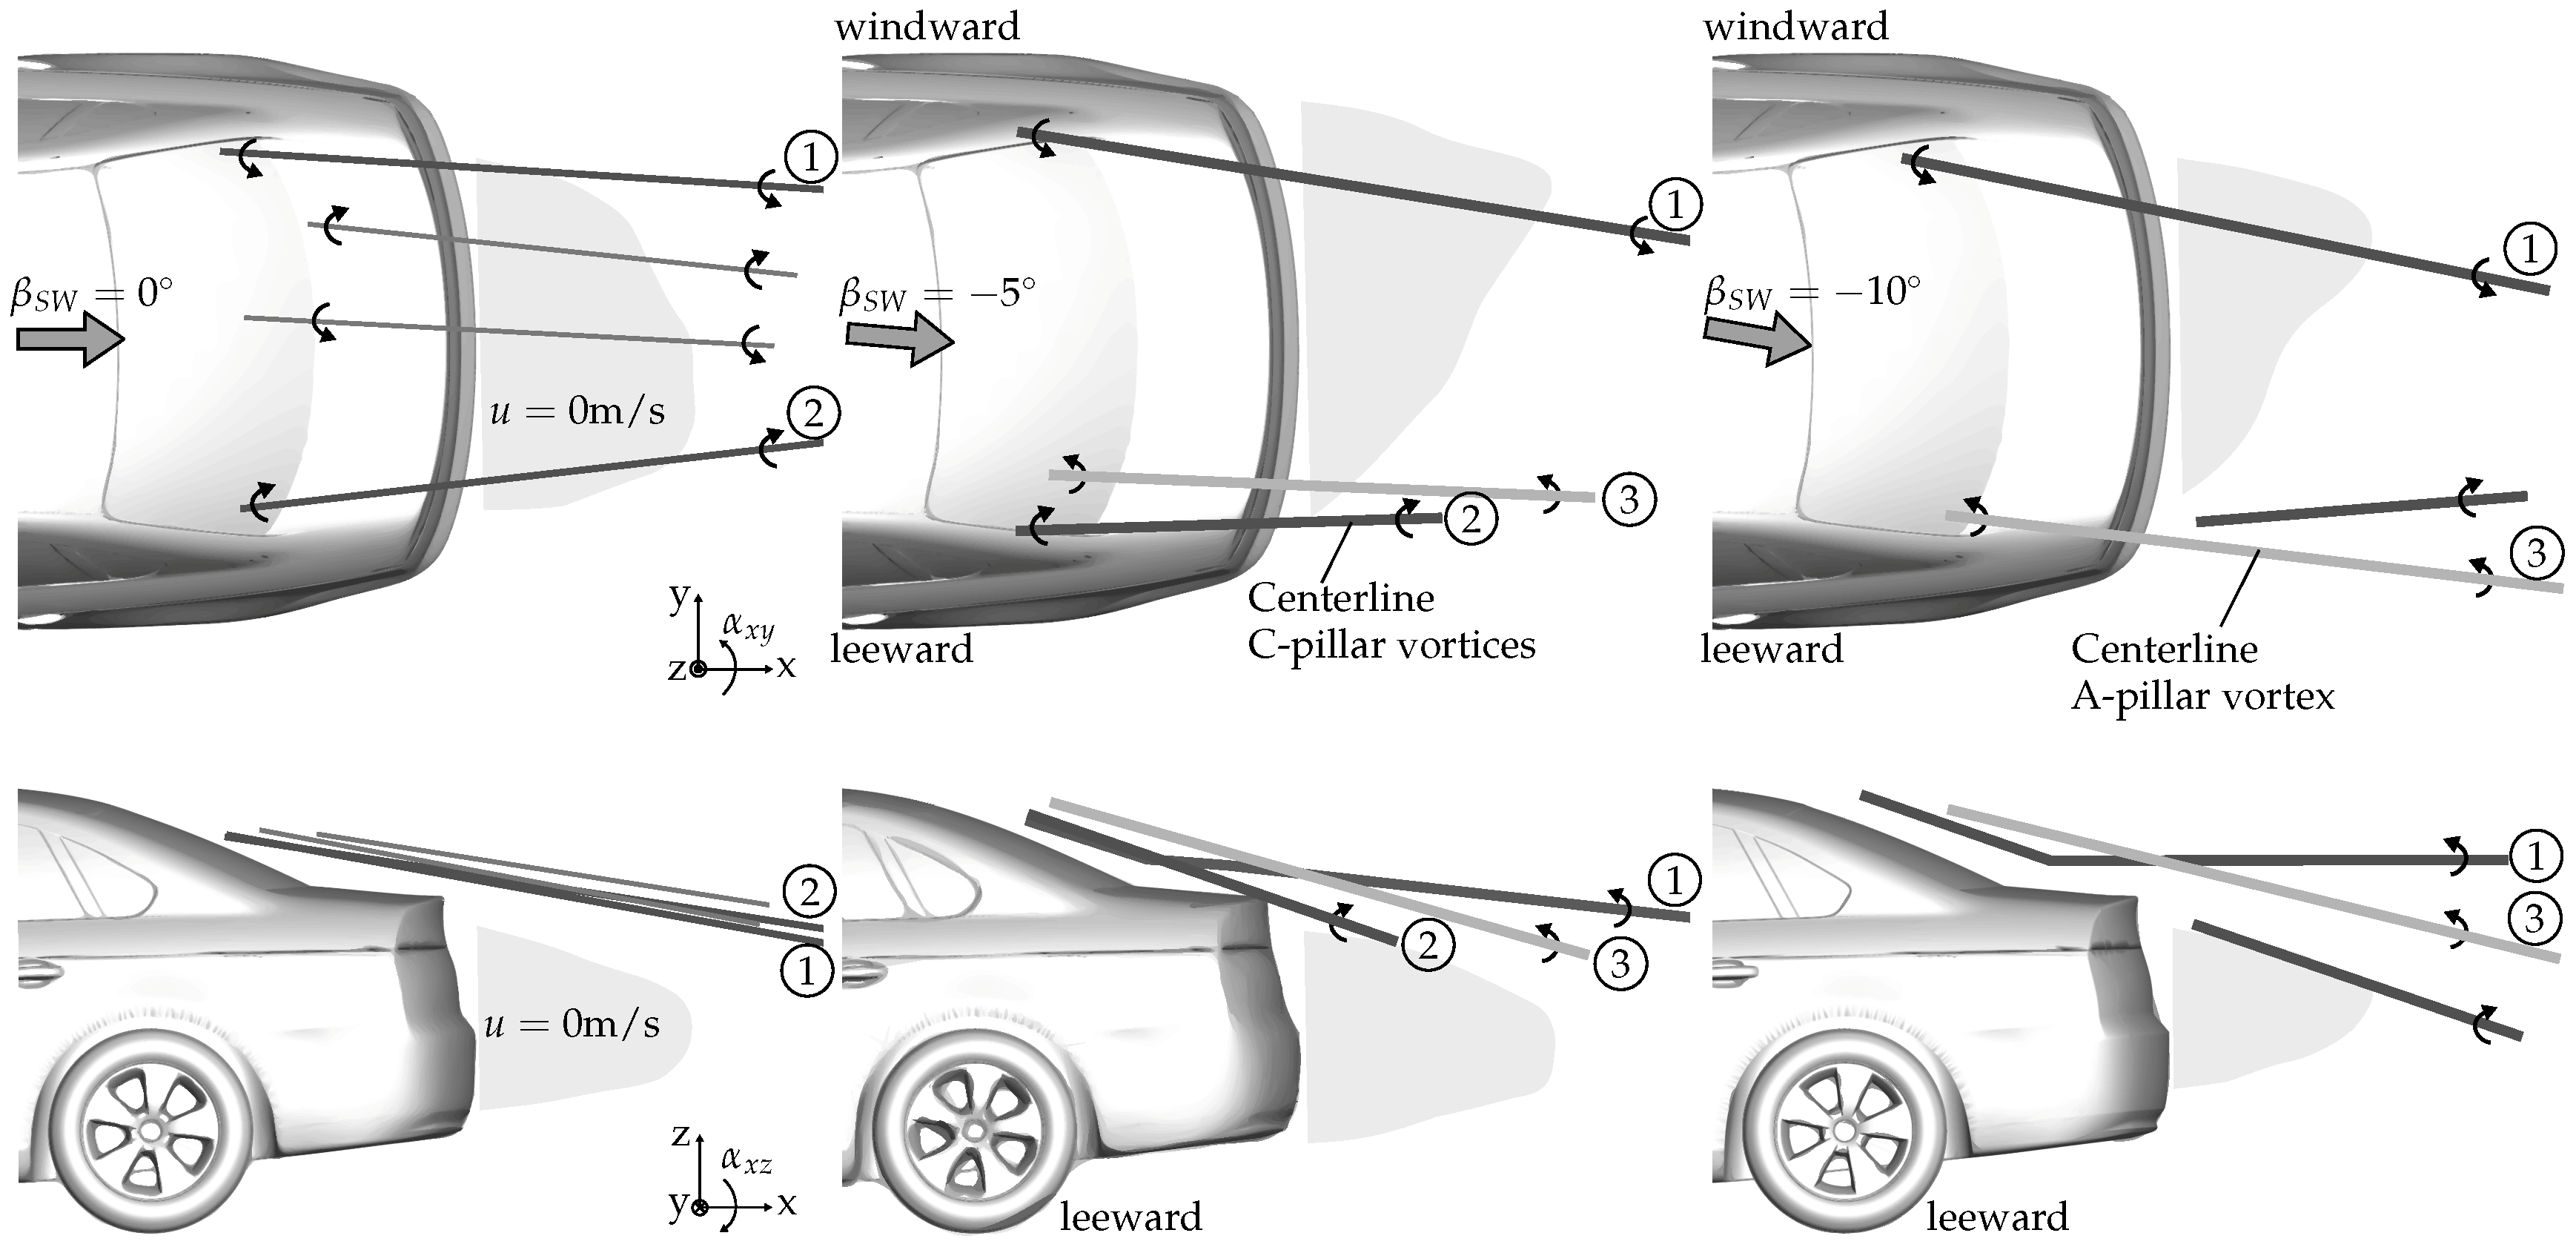
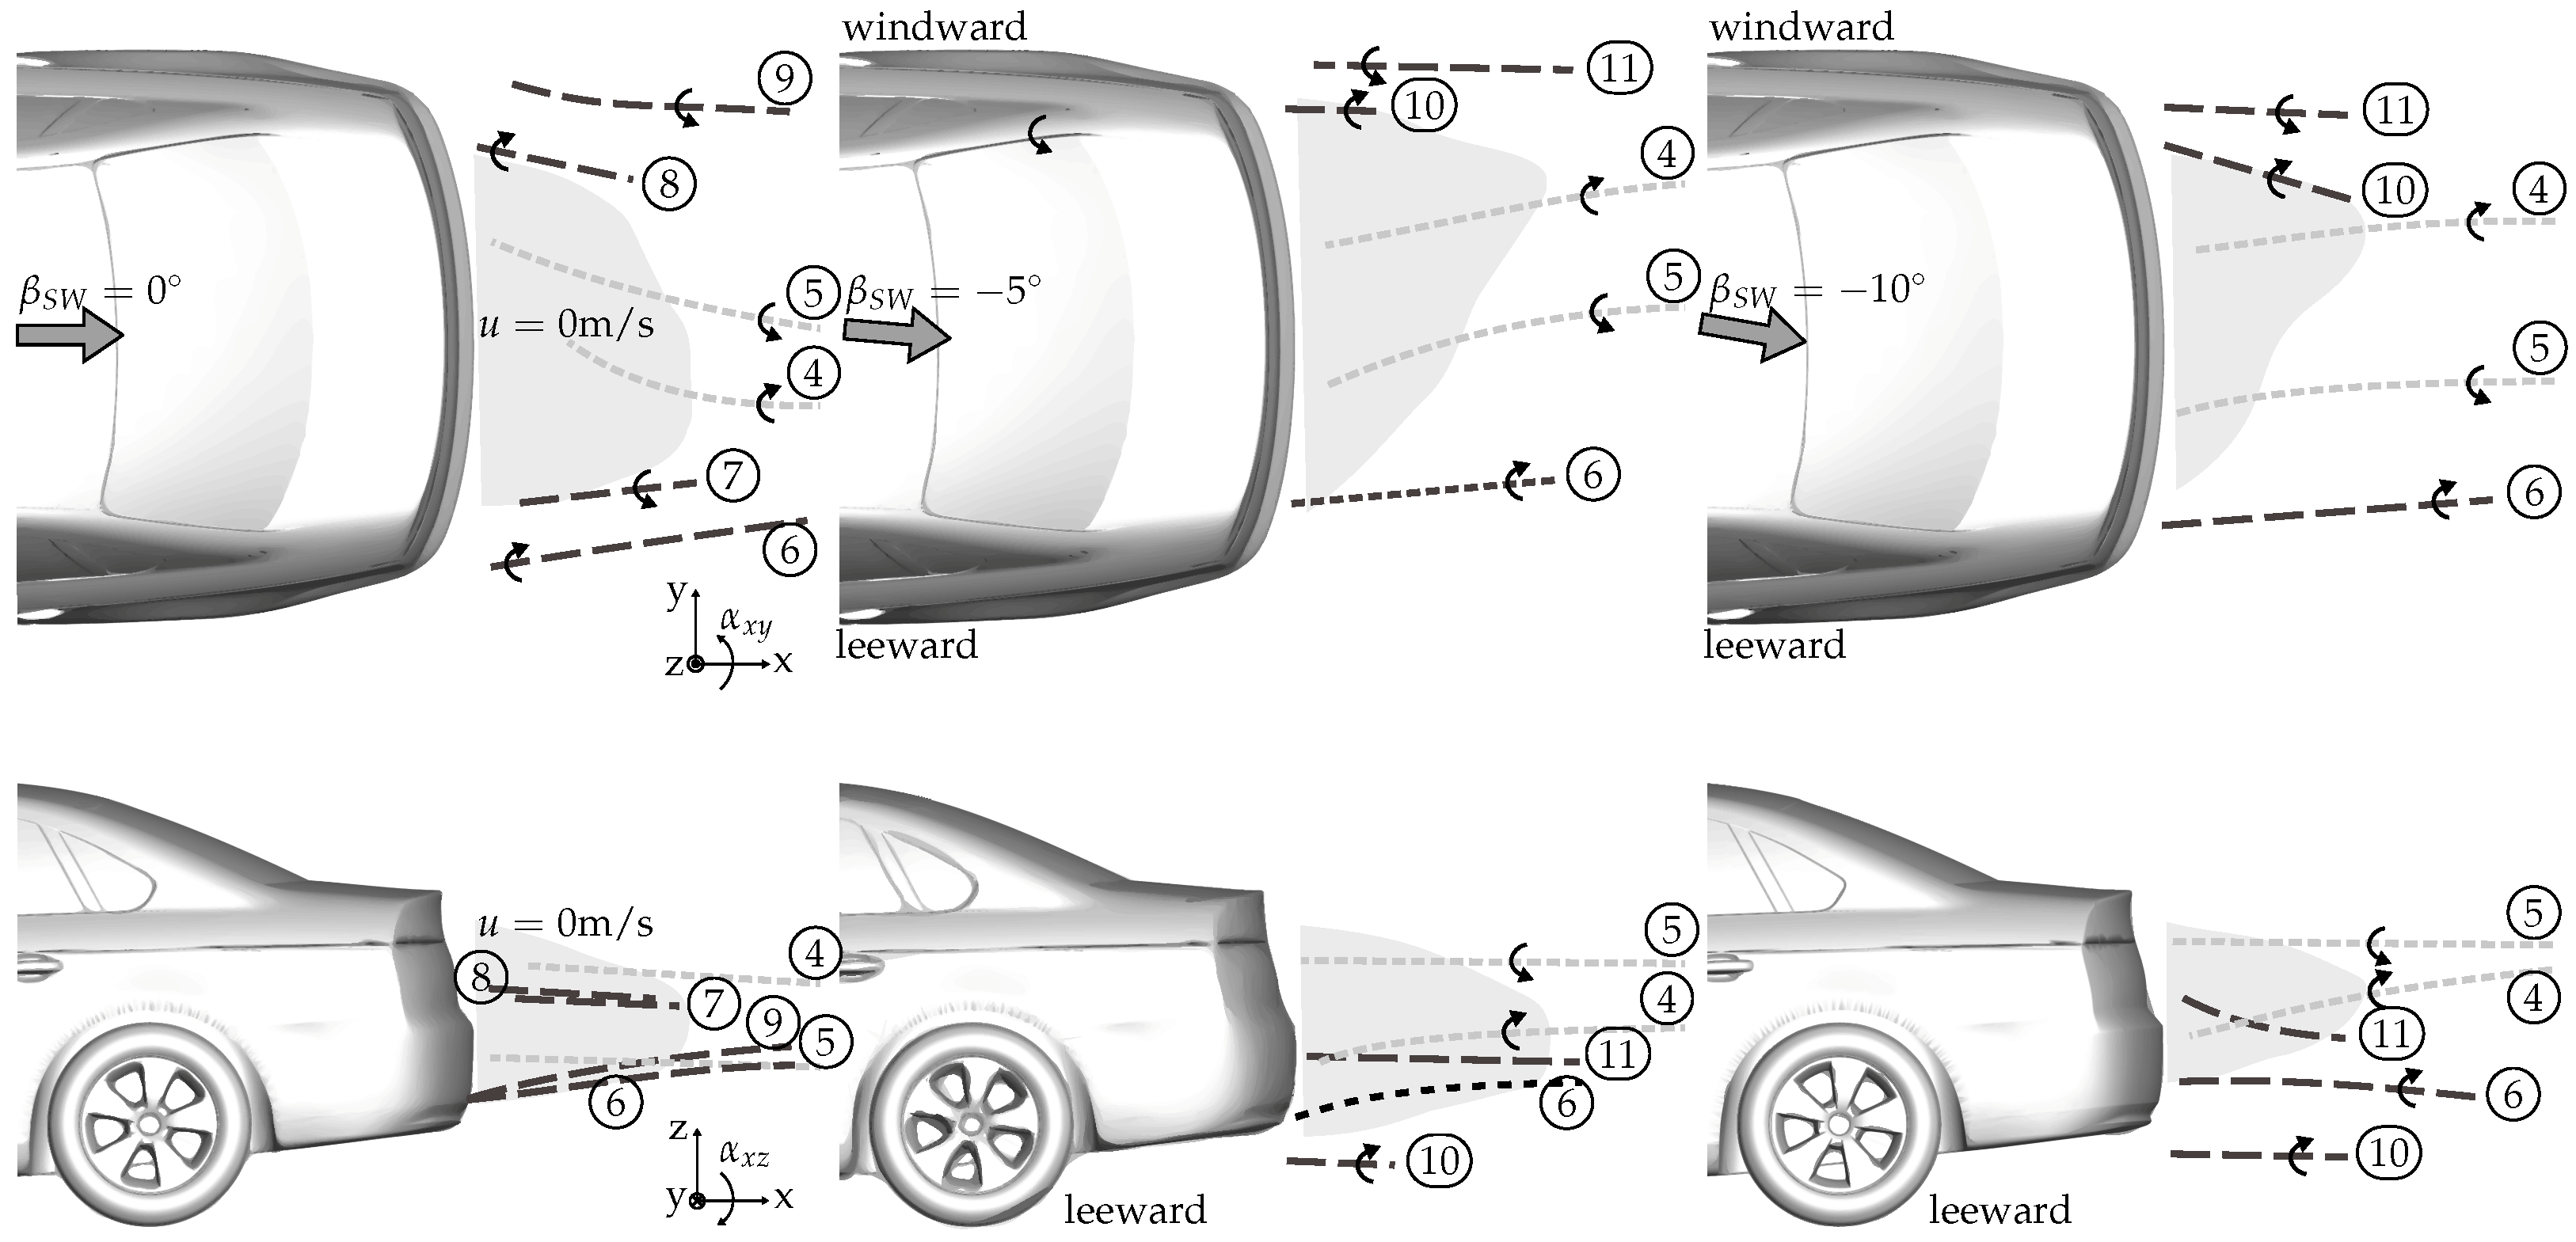
Figure 11 and
Figure 12 show qualitatively the courses of the vortices and the wake for all investigated inflows for the top and side views, respectively. The length of the vortex core traces is derived from the isosurfaces shown above and their vorticity intensities. For a better representation, the upper and lower parts of the flow field are shown separately. The aforementioned figures clearly show that the asymmetry of the flow field increases significantly under crosswind conditions and that the vortex propagation is clearly influenced. In addition, it can be seen that the quantity of vortex structures changes noticeably. While some vortices become weaker and disappear, new vortices are formed at other locations.
Table 1 lists the directions of the vortex courses visible in the upper region of
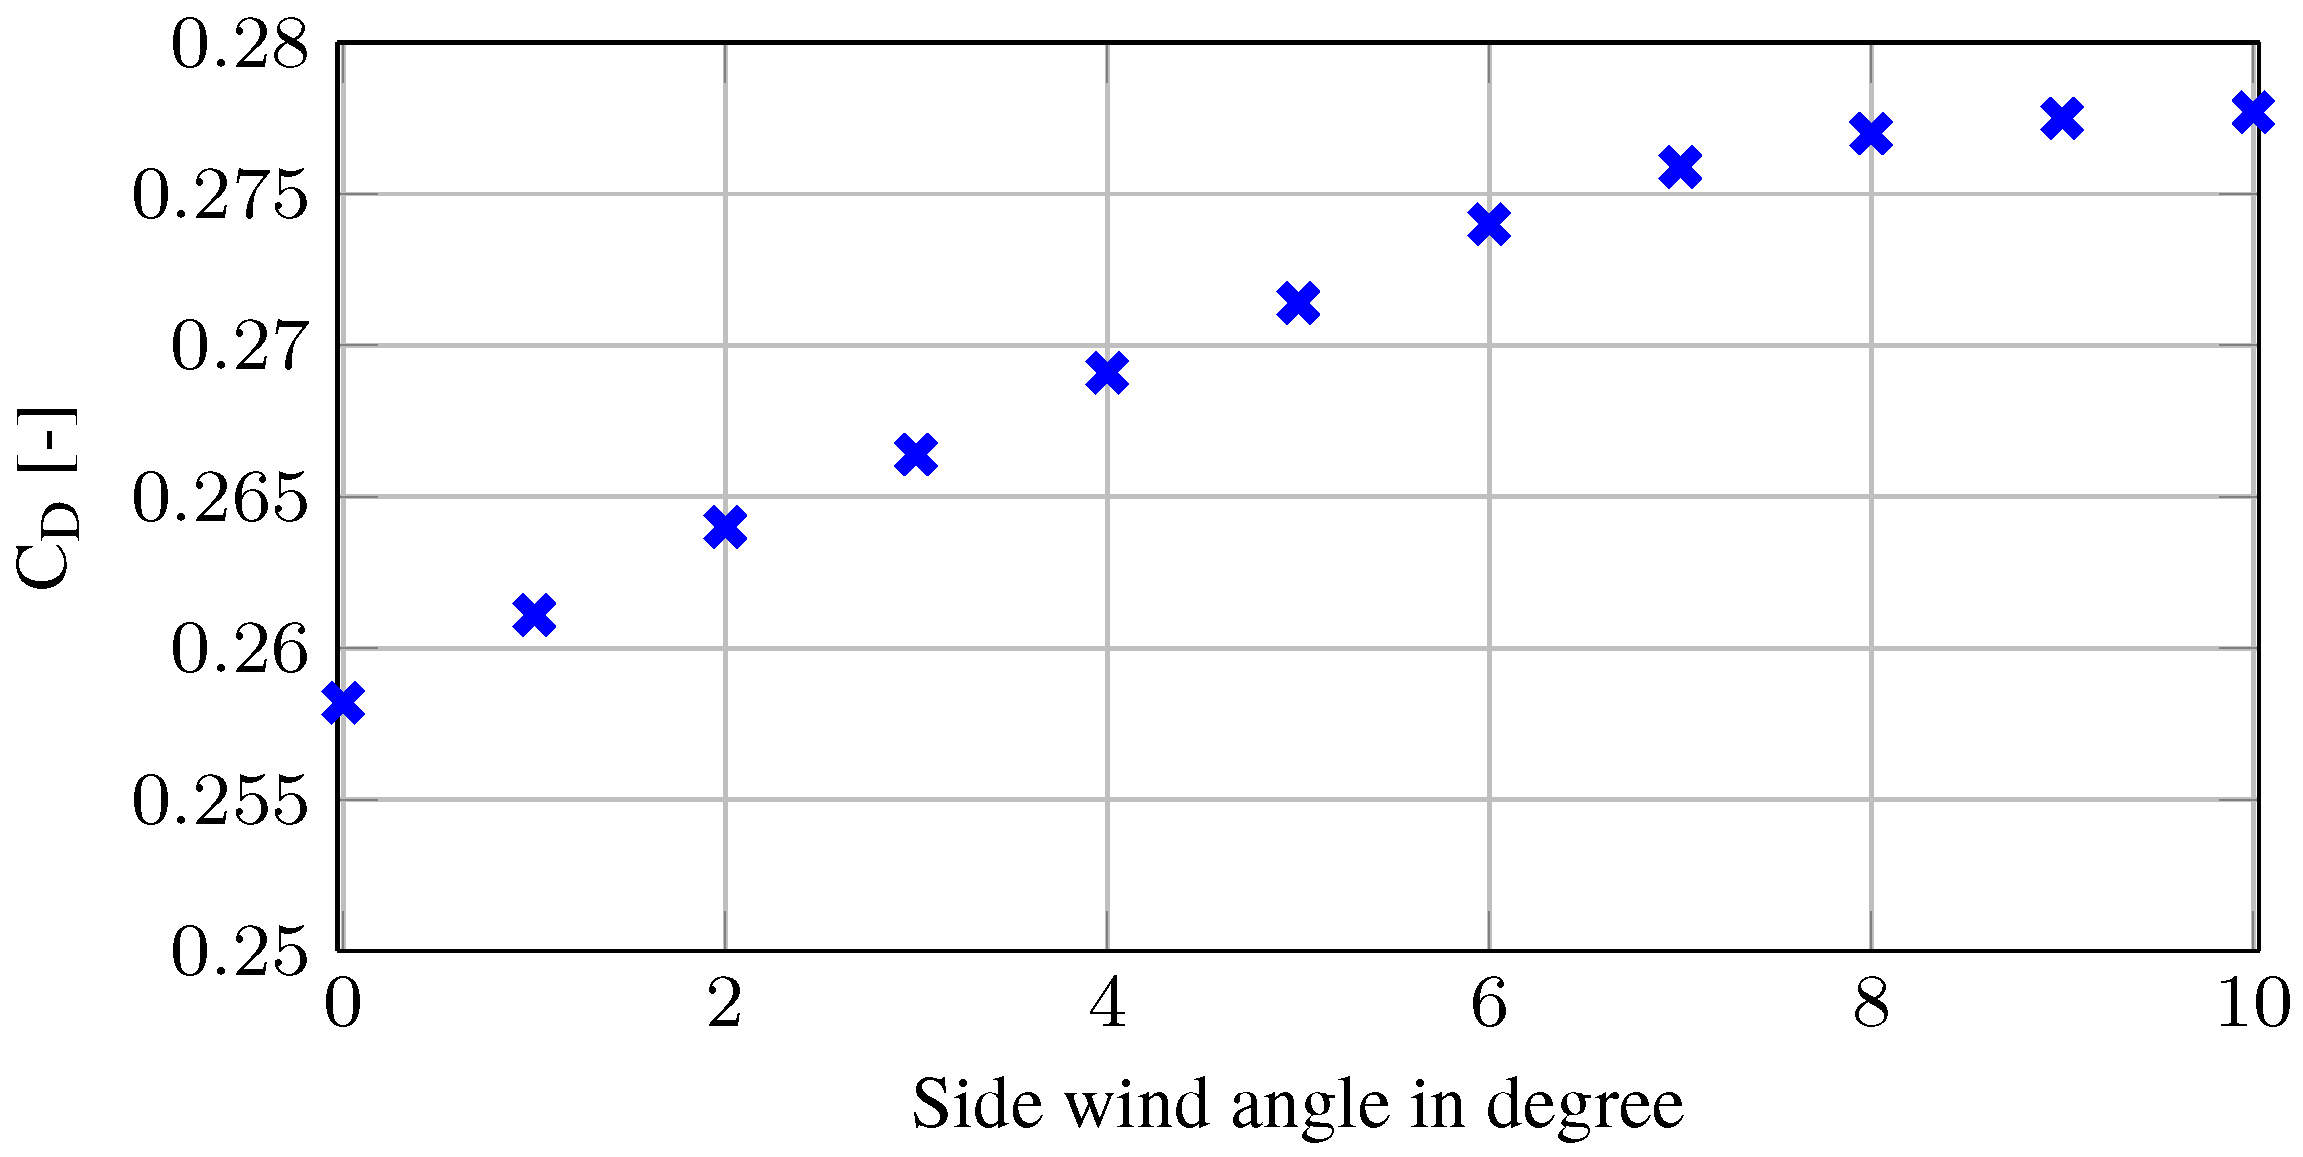
Figure 11. This is only done for this region because the courses are mainly straight. The downstream vortices of the base surface are more curved, short, and diffusely scattered, which makes it difficult to determine their directions. The length x/L of the recirculation area confirms the comparability and validity of the results of this study compared with the earlier studies having the same model setup.
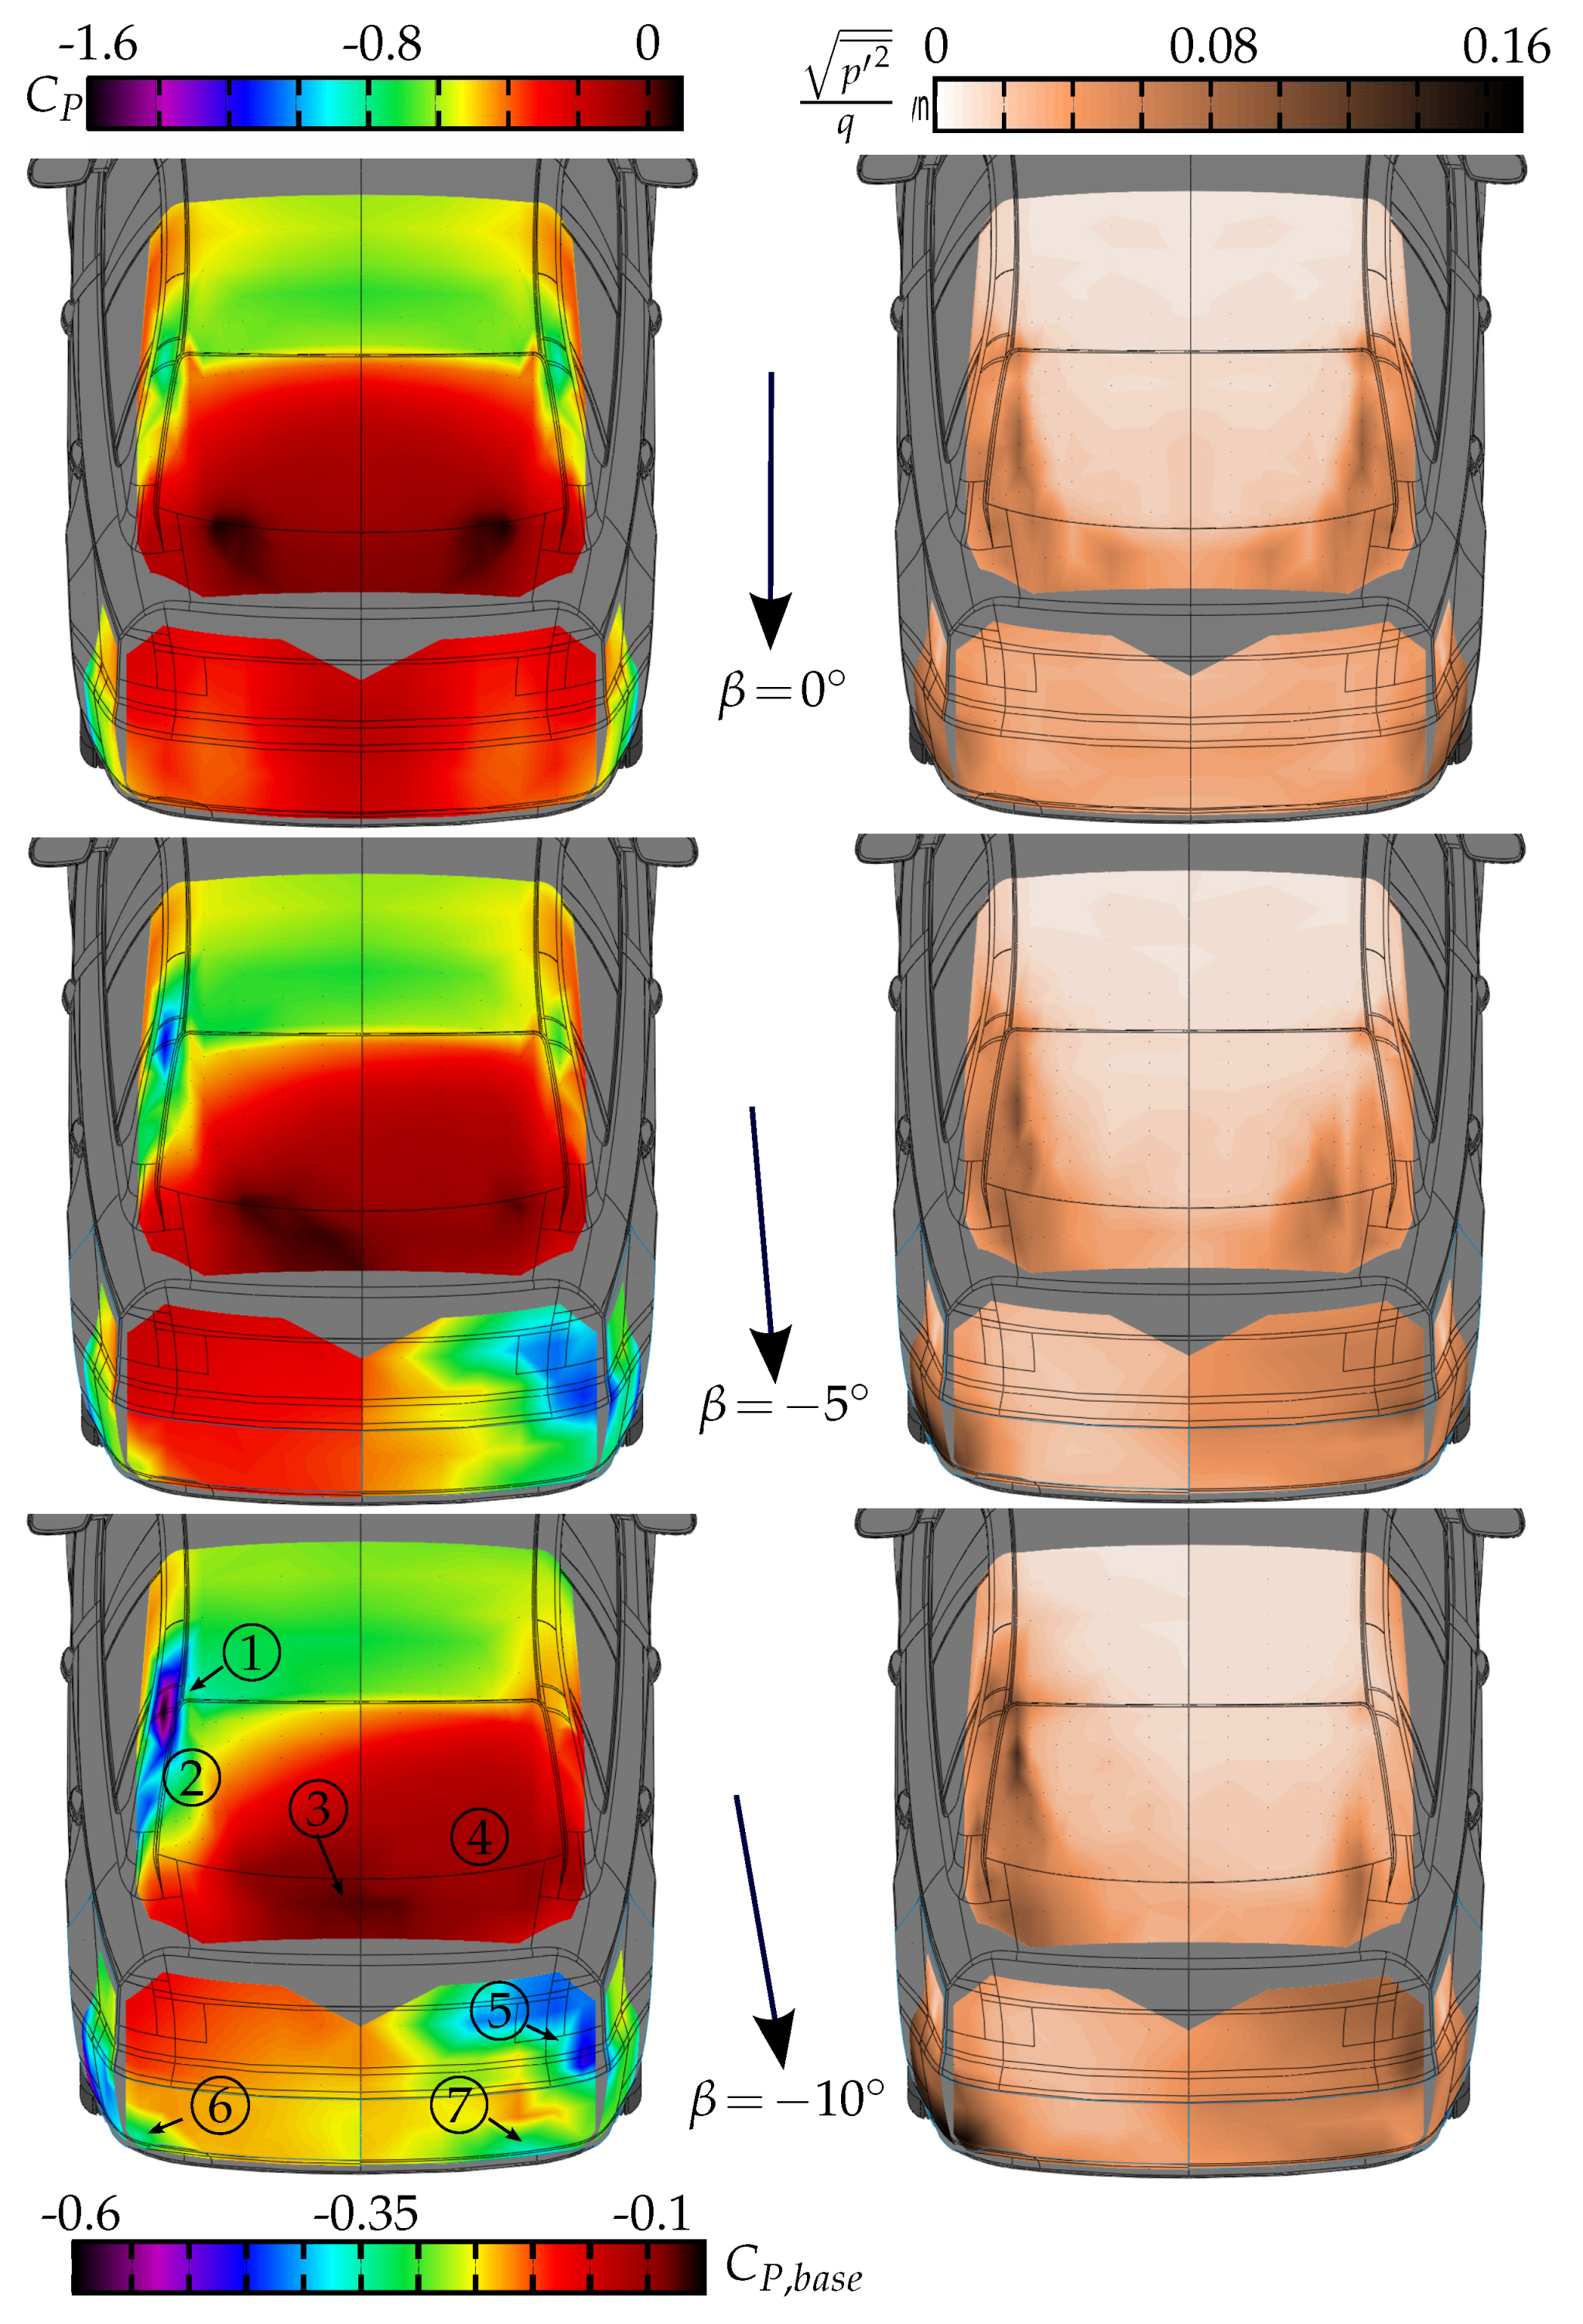
Finally, the influence of the vortices, which were extracted in earlier studies [
10] and were illustrated in
Figure 2, on the surface pressure is examined. It can be now seen that local pressure phenomena are directly related to the vortices, their locations of origin, or their directions of propagation. The C-pillar vortex led to a high pressure drop (see ②). Conversely, the C-pillar vortex on the trunk deck causes an increase in the local pressure because of the induced velocity (see ③). The same applies to the base surface. The lowest pressure values were obtained where strong vortex structures existed, especially under crosswind conditions. The low pressure points ⑤, ⑥, and ⑦ can be attributed to the vortices around the focus points
,
, and
, respectively.


