Article

A New Model for Environmental Assessment of the Comminution Process in the Chain of Biomass Energy Processing

by
Weronika Kruszelnicka
Department of Technical Systems Engineering, Faculty of Mechanical Engineering, University of Science and Technology in Bydgoszcz, 85-796 Bydgoszcz, Poland
Energies 2020, 13(2), 330; https://doi.org/10.3390/en13020330
Submission received: 9 November 2019 / Revised: 6 January 2020 / Accepted: 8 January 2020 / Published: 9 January 2020

Abstract

:
Acquiring energy contained in biomass requires its prior appropriate preparation. These treatments require some energy inputs, which significantly affect the reduction of the energy and the environmental balance in the entire life cycle of the biomass energy processing chain. In connection with the above, the aim of this work is to develop a methodology for the environmental assessment of biomass grinding in the processing chain for energy purposes. The research problem is formulated as follows: Is it possible to provide an assessment model that takes into account the environmental inputs and benefits of the grinding process of biomass intended for further energy use (for example, combustion)? How do the control variables of the grinding machine affect the environmental process evaluation? In response to these research problems, an original, carbon dioxide emission assessment index of the biomass grinding process was developed. The model was verified by assessing the process of rice and maize grinding on a real object—a five-disc mill—with various speed settings of the grinding disc. It was found that the carbon dioxide emission assessment model developed provides the possibility of comparing grinding processes and identifying the grinding process with a better CO2 emission balance, where its values depend on the control parameters of the mill.

Graphical Abstract

1. Introduction

Grinding processes are one of the most commonly used preparatory processes for energy carriers (fossil and alternative) intended for combustion and co-combustion [1,2] and biofuel production [3,4,5]. These biomass forms may include plant-based lignocellulose waste [6,7], sewage waste [8,9], and animal-based meat processing waste [10]. To enhance the utilization of these biomass forms for direct combustion [11,12] or as a biorefinery feedstock [1,7], size reduction approaches typically constitute a significant pre-treatment step that must be undertaken [13]. This is because size reduction operations serve to enhance accessibility to the stored carbon present in biomass. Such size reduction is predominantly carried out on cylindrical mills, drum mills, ball mills, hammer mills, and disc mills [13,14]. Hammer and disc mills yield the best results in terms of the grinding product quality, energy consumption, and efficiency [1,13]. The main goals of grinding granular biomass, as well as other energy materials (e.g., coal, wood), include the reduction of dimensions, the release of substances contained in the material structure, and an increase in the material-specific surface area so that the energy contained in its structure can be released faster [15,16,17,18]. In order to maximize the potential of ground raw materials, energy consumption during grinding (processing) should be as low as possible [19]. Unfortunately, mills and grinders currently in use are still characterized by high energy consumption and low efficiency [15,20]. Undertaking research, creating structural and technological solutions aimed at improving the energy and environmental efficiency of grinding systems, is significant. The key element is the implementation of eco-innovative systems, starting with assessment at the design stage with the use of a multi-criteria analysis, as one example [21,22]. Criteria for the selection of grinding technology and the assessment of its operation should clearly indicate solutions that meet the assumptions of sustainable development [23,24,25].
Assessment criteria that refer to the concept of environmental efficiency can be interpreted as the efficiency of innovative and environmental actions and the consequences of the environmental impact of machines, devices, and engineering equipment [26]. The concept of a product assessment based on the so-called eco-efficiency and related indexes is becoming more and more popular [26,27]. The major assumption of eco-efficiency is to work out a technological solution with the best cost-to-benefit ratio while maintaining a reduction of the environmental impacts [27,28]. Huppes and Ishikawa [29] proposed four indexes to be used for the assessment of a technology’s (Table S1) environmental productivity (Table S1, Equation (1)), environmental intensity of production (Table S1, Equation (2)), environmental improvement cost (Table S1, Equation (3)) and environmental cost-effectiveness (Table S1, Equation (4)) which is a combination of the relations between the environmental indexes and the economic results. LCA (life cycle assessment) is a method for assessing environmental impacts [30]. LCC (life cycle costing) is used for assessing economic efficiency [31] and PSIA product impact social assessment is a method used for assessing social impacts [32]. LCA and LCC methods for assessing the grinding process constitute just one of many other elements to be used to assess technological biomass processing in its entirety, either for energy or food production purposes [30,33,34,35,36]. MFA (material flow analysis) is another assessment method that focuses on the flow of material between particular stages of the technological process [37]. Knowledge of the quantitative demand for materials in the manufacturing process is also used by the MAIA (material intensity analysis), which is based primarily on determining MIPS (material input per service unit index) (Table S1, Equation (5)), which defines the amount of natural resources needed to manufacture a product or provide a service [38]. X factor, defined as the ratio of the eco-efficiency of the product under assessment to that of the reference product, described in [39], can also be used for eco-efficiency assessment (Table S1, Equation (6)). X factor makes it possible to determine how far the manufactured product is from the performance level of the reference product. It allows one to compare different manufacturing variants of the same product on the basis of the ratio of the product being assessed to the reference product’s ecoefficiency level (Table S1, Equation (6)). Tahara et al. [40] have proposed the ICEICE (integrated CO2 efficiency index for company evaluation) including indirect and direct CO2 emissions in combination with economic effects and total CO2 efficiency, direct CO2 efficiency, and indirect CO2 efficiency calculated on the basis of indexes (Table S1, Equations (7)–(9). Bennet et al. [41] have developed an optimization tool—Eco Compass—which can be used to support decision making processes in business to meet the demand according to sustainable development assumptions. Kasner [42] has proposed an integrated life cycle index (Table S1, Equation (10)) to determine efficiency in obtaining benefits from technological costs involved in the entire life cycle, which includes manufacturing costs, operational costs, and post-use management costs. This index takes advantage of data regarding the environmental impact obtained with the use of LCA [43]. The indexes and criteria presented herein can successfully be adapted for evaluation of the grinding process through appropriate modeling. Eco-efficiency models developed for technology make it possible to compare the technologies under consideration (products) in a scalar form and select a technology that is best in terms of productivity, the economy, and the environment [44].
Only a few works address the environmental assessment of the grinding process exclusively in terms of ecology [45,46,47,48,49]. In many works, specific energy consumption and fragmentation degree have been indicated as two basic criteria for the assessment of this process [50,51,52,53]. Flizikowski et al. [45] proposed an environmental efficiency index to assess the grinding process defined as a ratio of CO2 emissions produced by grinding to the biomass energy use for outlays in the form of emissions of equivalent CO2 in the process of grinding (Table S2, Equation (1)). Mroziński et al. [46] showed an index of environmental non-destructivity defined as a ratio of equivalent CO2 emissions to electric energy consistent with this equivalent (Table S2, Equation (2)). Kruszelnicka et al. [48] discussed a material energy efficiency index, which refers to indirect emissions involved in the process of energy of different materials (Table S2, Equation (3)). In other studies [47,49], Kruszelnicka proposed a sustainable emissivity index for the environmental assessment of grinding, which also refers to indirect emissions involved in grinding (Table S2, Equation (4)), making it possible to optimize the grinder disc process parameter settings.
In view of the above, the aim of the work is to develop a methodology for the carbon dioxide emission assessment of biomass grinding in the processing chain for energy purposes. The research problem is formulated as follows: Is it possible to create an assessment model that takes into account the environmental inputs and benefits of the grinding process of biomass intended for further energy use (for example combustion)? How do the control variables (the angular velocity of the cutting edges of working elements) of the grinding machine affect the carbon dioxide emissions of the process [54]? To obtain an answer to the research problem, a model was developed for the carbon dioxide emission assessment of the grinding process, including the relations between the benefits from energy biomass grinding and the environment-related costs used for grinding. Verification of the model was carried out on a real object—a five-disc mill. Dependences between the angular speed settings of the grinding discs and the values of the proposed assessment model were identified to indicate parameters that provide the assessment index with the best values. A mathematical model of the proposed sustainable CO2 emissions indicator, the test stands and the experiment conditions are described in Section 2. Section 3 contains the results and a discussion. The discussion has been summarized and the most important conclusions are included in Section 4.

2. Materials and Methods

2.1. Model of a Sustainable CO2 Emissions Index

The proposed model of a sustainable CO2 emissions index is based on the assumption of environmental assessment models of the grinding process (Table S2, Equations (1) and (2)) presented in [45,46]. Equivalent CO2 emissions in the grinding process are closely related to its energy consumption [45,46,47,48,49]. Considering a system whose aim is to reduce the process, product, machine, and environmental impacts (e.g., by eliminating CO2) while maintaining its higher efficiency and providing a high-quality product as well as energy efficiency, the integrated energy purpose of product (for example, combustion) sustainable CO2 emissions index can be expressed as [54,55]
WZCO2 = ∆BCO2/NCO2
where
  • ΔBCO2—environmental benefits—change in CO2 emissions,
  • NCO2—environmental costs of grinding—energy consumption.
The one factor influencing the positive change in carbon dioxide balance can be described as CO2 emissions, for example, from the burnt ground energy biomass XBCO2, because biomass is a renewable fuel, which during the growth phase, absorbs an amount of carbon dioxide equal to the emissions from its energy use [56]. Additionally, in industrial emission monitoring systems, CO2 emission indexes from biomass are treated as zero [57]. These should be reduced by equivalent CO2 emissions related to energy consumption in the grinding process XRCO2 in accordance with the equation on environmental benefits [54]:
BCO2 = XBCO2XRCO2
where
  • XBCO2—CO2 emissions from the energy use (for example, combustion) of ground biomass, kgCO2eq,
  • XRCO2—the amount of CO2 emissions associated with the use of electricity in the grinding process, kgCO2eq.
The results of previous research show that the energy properties of biomass (especially its digestibility, exergy) change depending on the degree of fineness (post-grinding particle size) [46,55,58]; therefore, it was accepted that emissions from the combustion of ground biomass XBCO2 are expressed as the sum of emissions from the combustion of biomass divided into size classes, according to the equation [54]:
XBCO2 = mB·∑(JACO2i·WBi·qi)
where
  • mB—mass of ground biomass, kg,
  • JACO2i—unit CO2 emissions for the i-th size class of biomass, kg·kWh−1,
  • WBi—calorific value of the i-th size class of biomass, kWh·kg−1,
  • qi—mass share of the i-th size class of biomass.
The emissions involved in electricity consumption during grinding are described as follows [54]:
XRCO2 = EcM·JKCO2
where
  • EcM—total energy consumption of the grinding machine during the grinding of a mass of biomass mB, kWh,
  • JKCO2—emissions of carbon dioxide for the production of electric energy from coal, kgCO2eq·kWh−1.
In this case, environmental costs were assumed as total energy consumption EcM for biomass grinding. Taking into account the above and Dependencies (3) and (4), the sustainable CO2 emissions index will take the form [54]:
WZCO2 = (XBCO2XRCO2)/EcM = (mB·∑(JACO2i·WBi·qi) − EcM·JKCO2)/EcM
Knowing that the mass of the ground biomass mB is related to grinding efficiency Q:
Q = mB/tmB = Q·t
  • Q—grinding efficiency, kg·h−1,
  • t—time, h,
and that the energy used in the grinding process EcM is equal to
EcM = ∑Pi·t = Pc·t
where
  • Pi—power on the i-th grinding element,
  • Pc—total power of the grinder.
Then Equation (5) assumes the following form:
WZCO2 = (Q·t·∑(JACO2i·WBi·qi) − Pc·t·JKCO2)/Pc·t
which after being reduced by time t, gives
WZCO2 = (Q·∑(JACO2i·WBi·qi) − Pc·JKCO2)/Pc
In this way, Equation (9), including the most important characteristics of the grinding process, that is, efficiency, the power of the grinding unit, and the product degree of fineness, is provided. Both the power and the product degree of fineness depend on the angular speeds of rotating elements. In the case of multi-disc grinders, this concerns the angular speeds of the grinding discs. Thus, it can be supposed that the values of the sustainable emissivity index will also depend on the angular speeds of the discs, which have been verified in this study.
For the machine idle gear, when EcM > 0 and mB = 0, the quantity of emissions from groundmass is equal to 0, which yields:
WZCO2(min) = (−Pc·JKCO2)/Pc = − JKCO2
Thus, the lowest value of emissions that can be assumed by the sustainable indicator is emissions equal to unit emissions from electrical energy produced from coal (Figure 1).
The level of emissions of CO2eq from fossil fuels to be sustained by emissions from alternative fuels occurs at WZCO2 = 0 (Figure 1), that is, when
Q·∑(JACO2i·WBi·qi) − Pc·JKCO2 = 0
Q·∑(JACO2i·WBi·qi) = Pc·JKCO2
In order to reach energy sustainability (with an assumption that the mass to be ground will be used for the production of electrical energy to power the grinder), the value of electric energy produced from the combustion of biomass EB should be at least equal to that used in the grinding process:
EcM = EB
The level of energy obtained from combusted biomass is
EB = Q·t·kkWBi·qi
where:
  • WBmin—minimal calorific value from the set of values of the i-th biomass fractions WBi,
  • kk = 0.4—co-generation coefficient [59].
Substituting Equations (7) and (14) for Equation (13) yields:
Pc = Q·kkWBi·qi
In an associated production of electric energy from heat energy obtained from biomass combustion, unit emissions (per 1 kWhe of generated electric energy) JACO2ie is expressed in the following way:
JACO2ie = JACO2i/kk
hence, the value of the sustainable CO2 emissions index for sustainable WZCO2(e) is
WZCO2(e) = (Q·kkWBi·qi·JACO2ieQ· kk· JKCO2WBi·qi)/Q·kkWBi·qi
after reduction it is
WZCO2(e) = ∑WBi·qi·JACO2i/∑WBi·qiJKCO2
and considering Equation (16):
WZCO2(e) = (∑WBi·qi·JACO2i/kk)/∑WBi·qiJKCO2
The minimal value of the sustainable CO2 emissions index occurs for energy sustainability when 100% (qi = 1) of the grinding product (combusted biomass) is the fraction with the lowest unit CO2 emissions, thus yielding:
WZCO2(emin) = (WB(JACO2min)·qi·JACO2min/kk)/WB(JACO2min)·qiJKCO2
Considering that qi = 1, Equation (20) takes the form:
WZCO2(emin) = WB(JACO2min)·JACO2min/kk·WB(JACO2min)JKCO2
and being reduced:
WZCO2(emin) = JACO2min/kkJKCO2
Equation (22) implies that
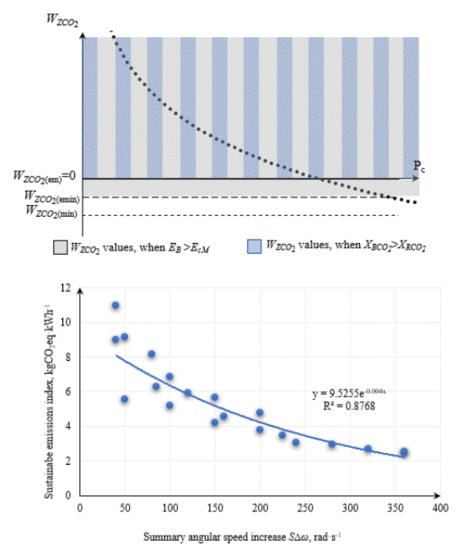
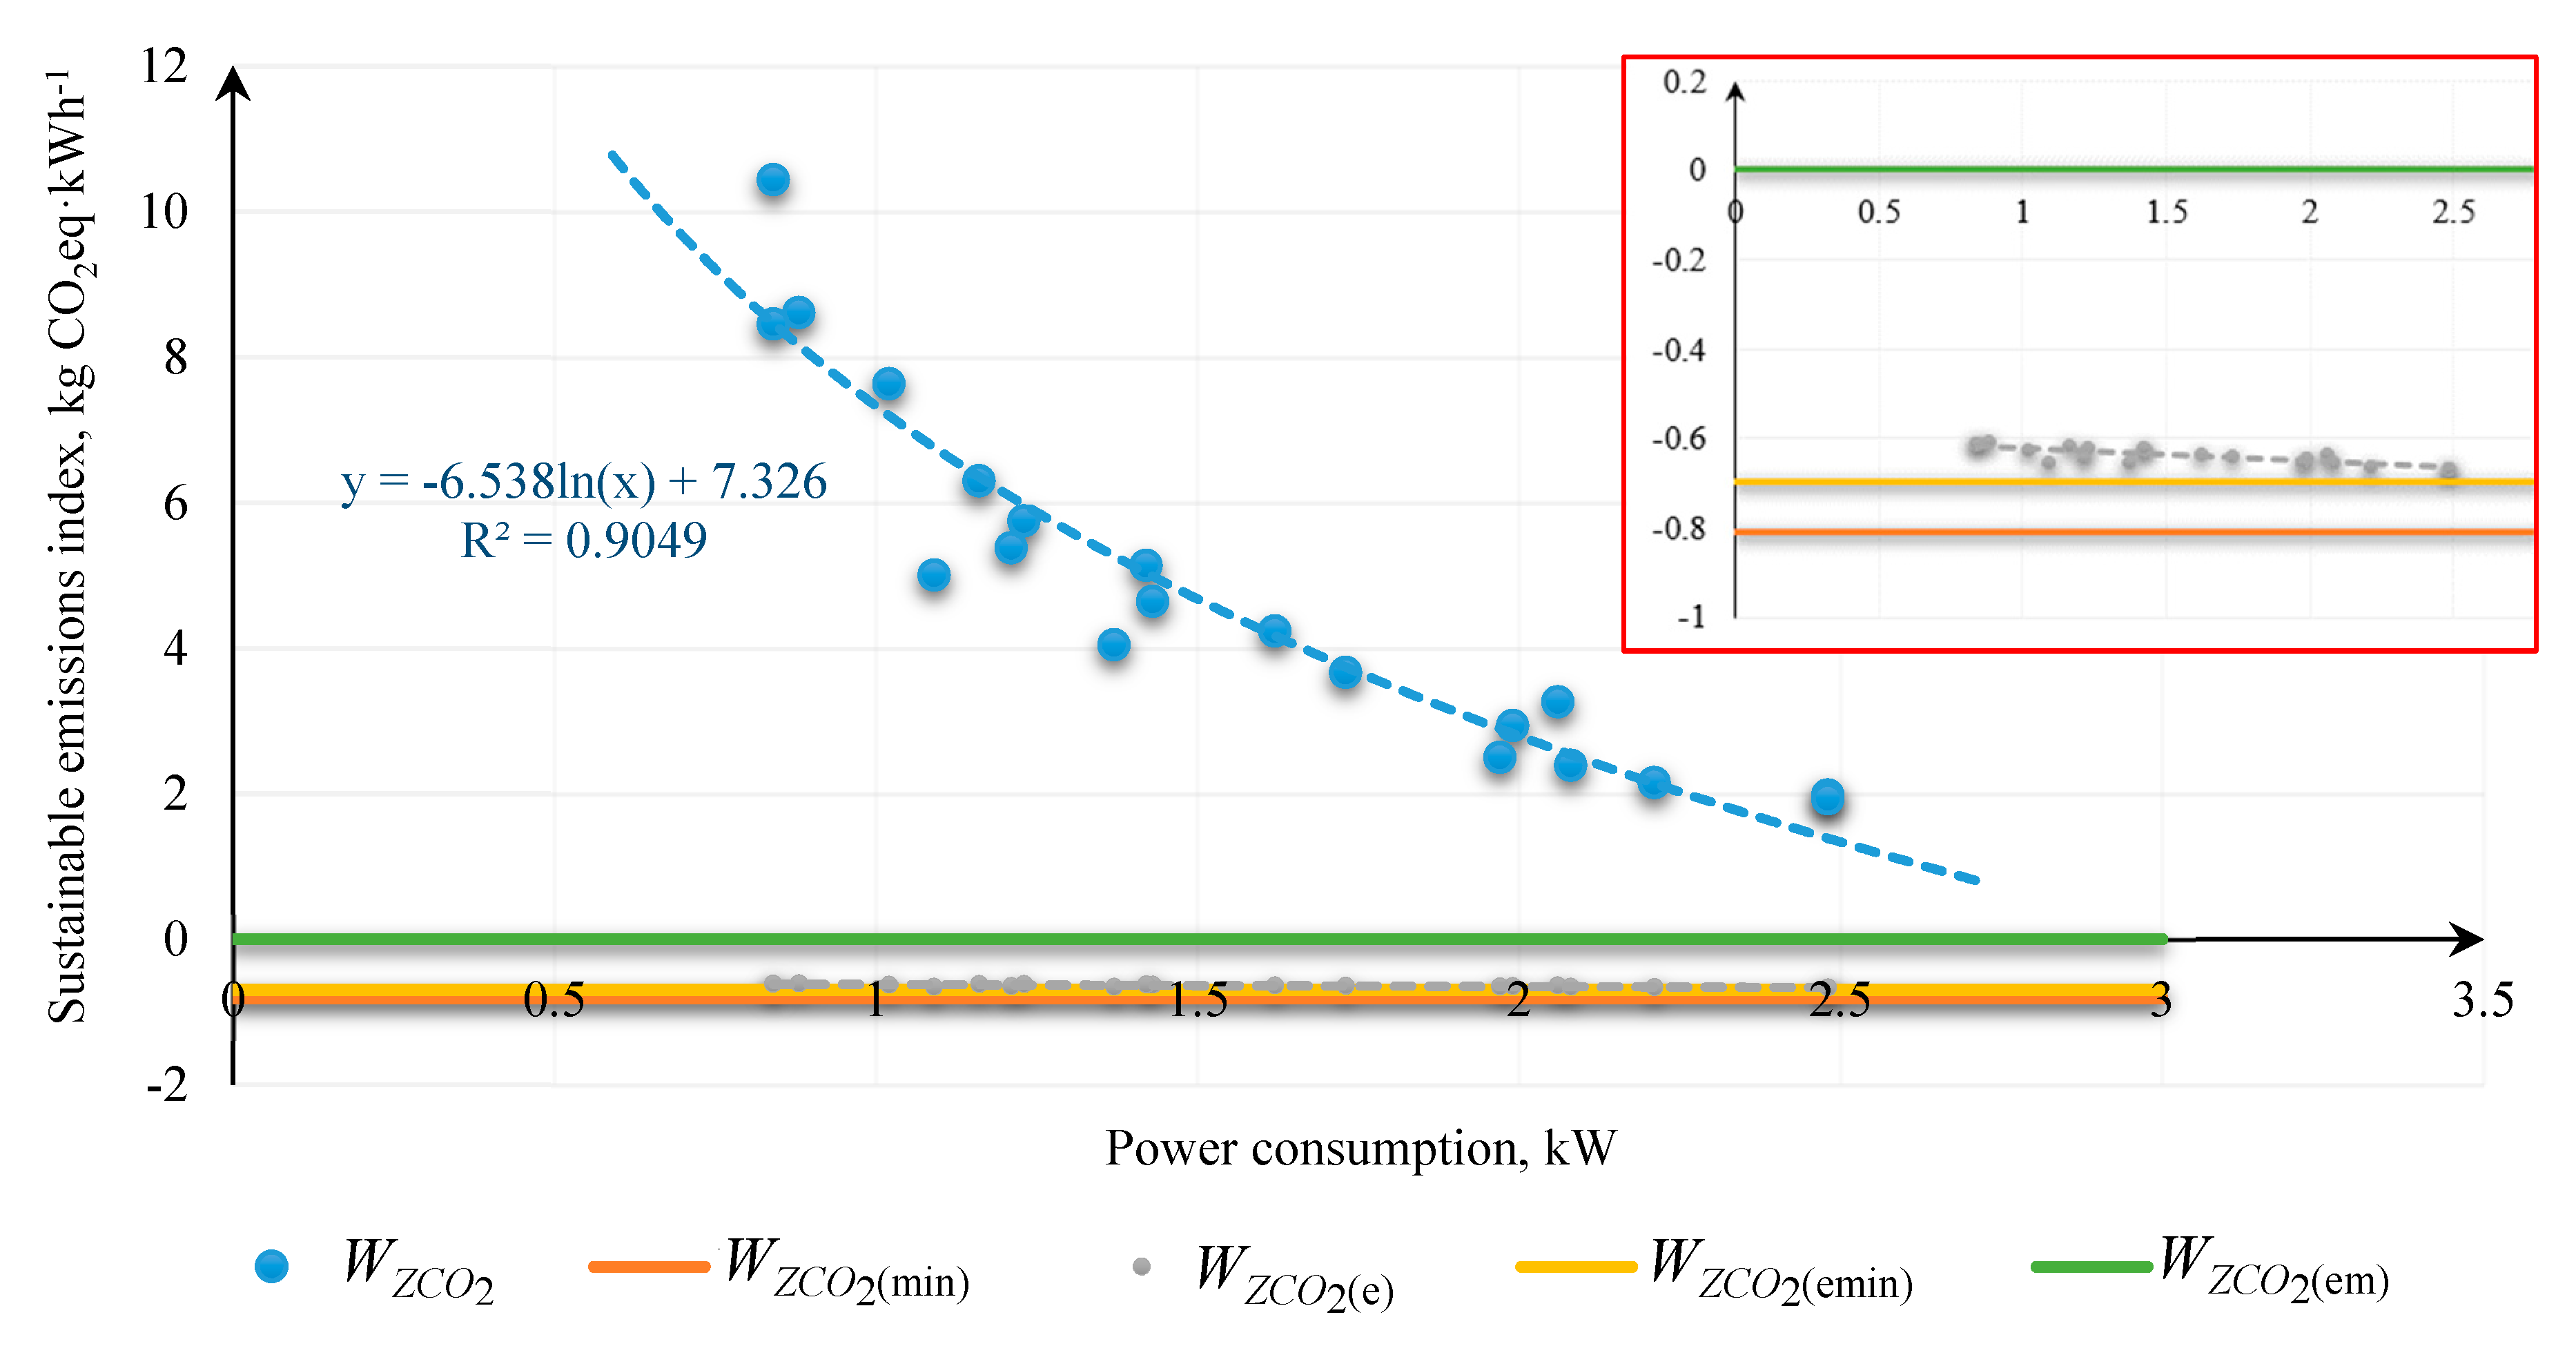
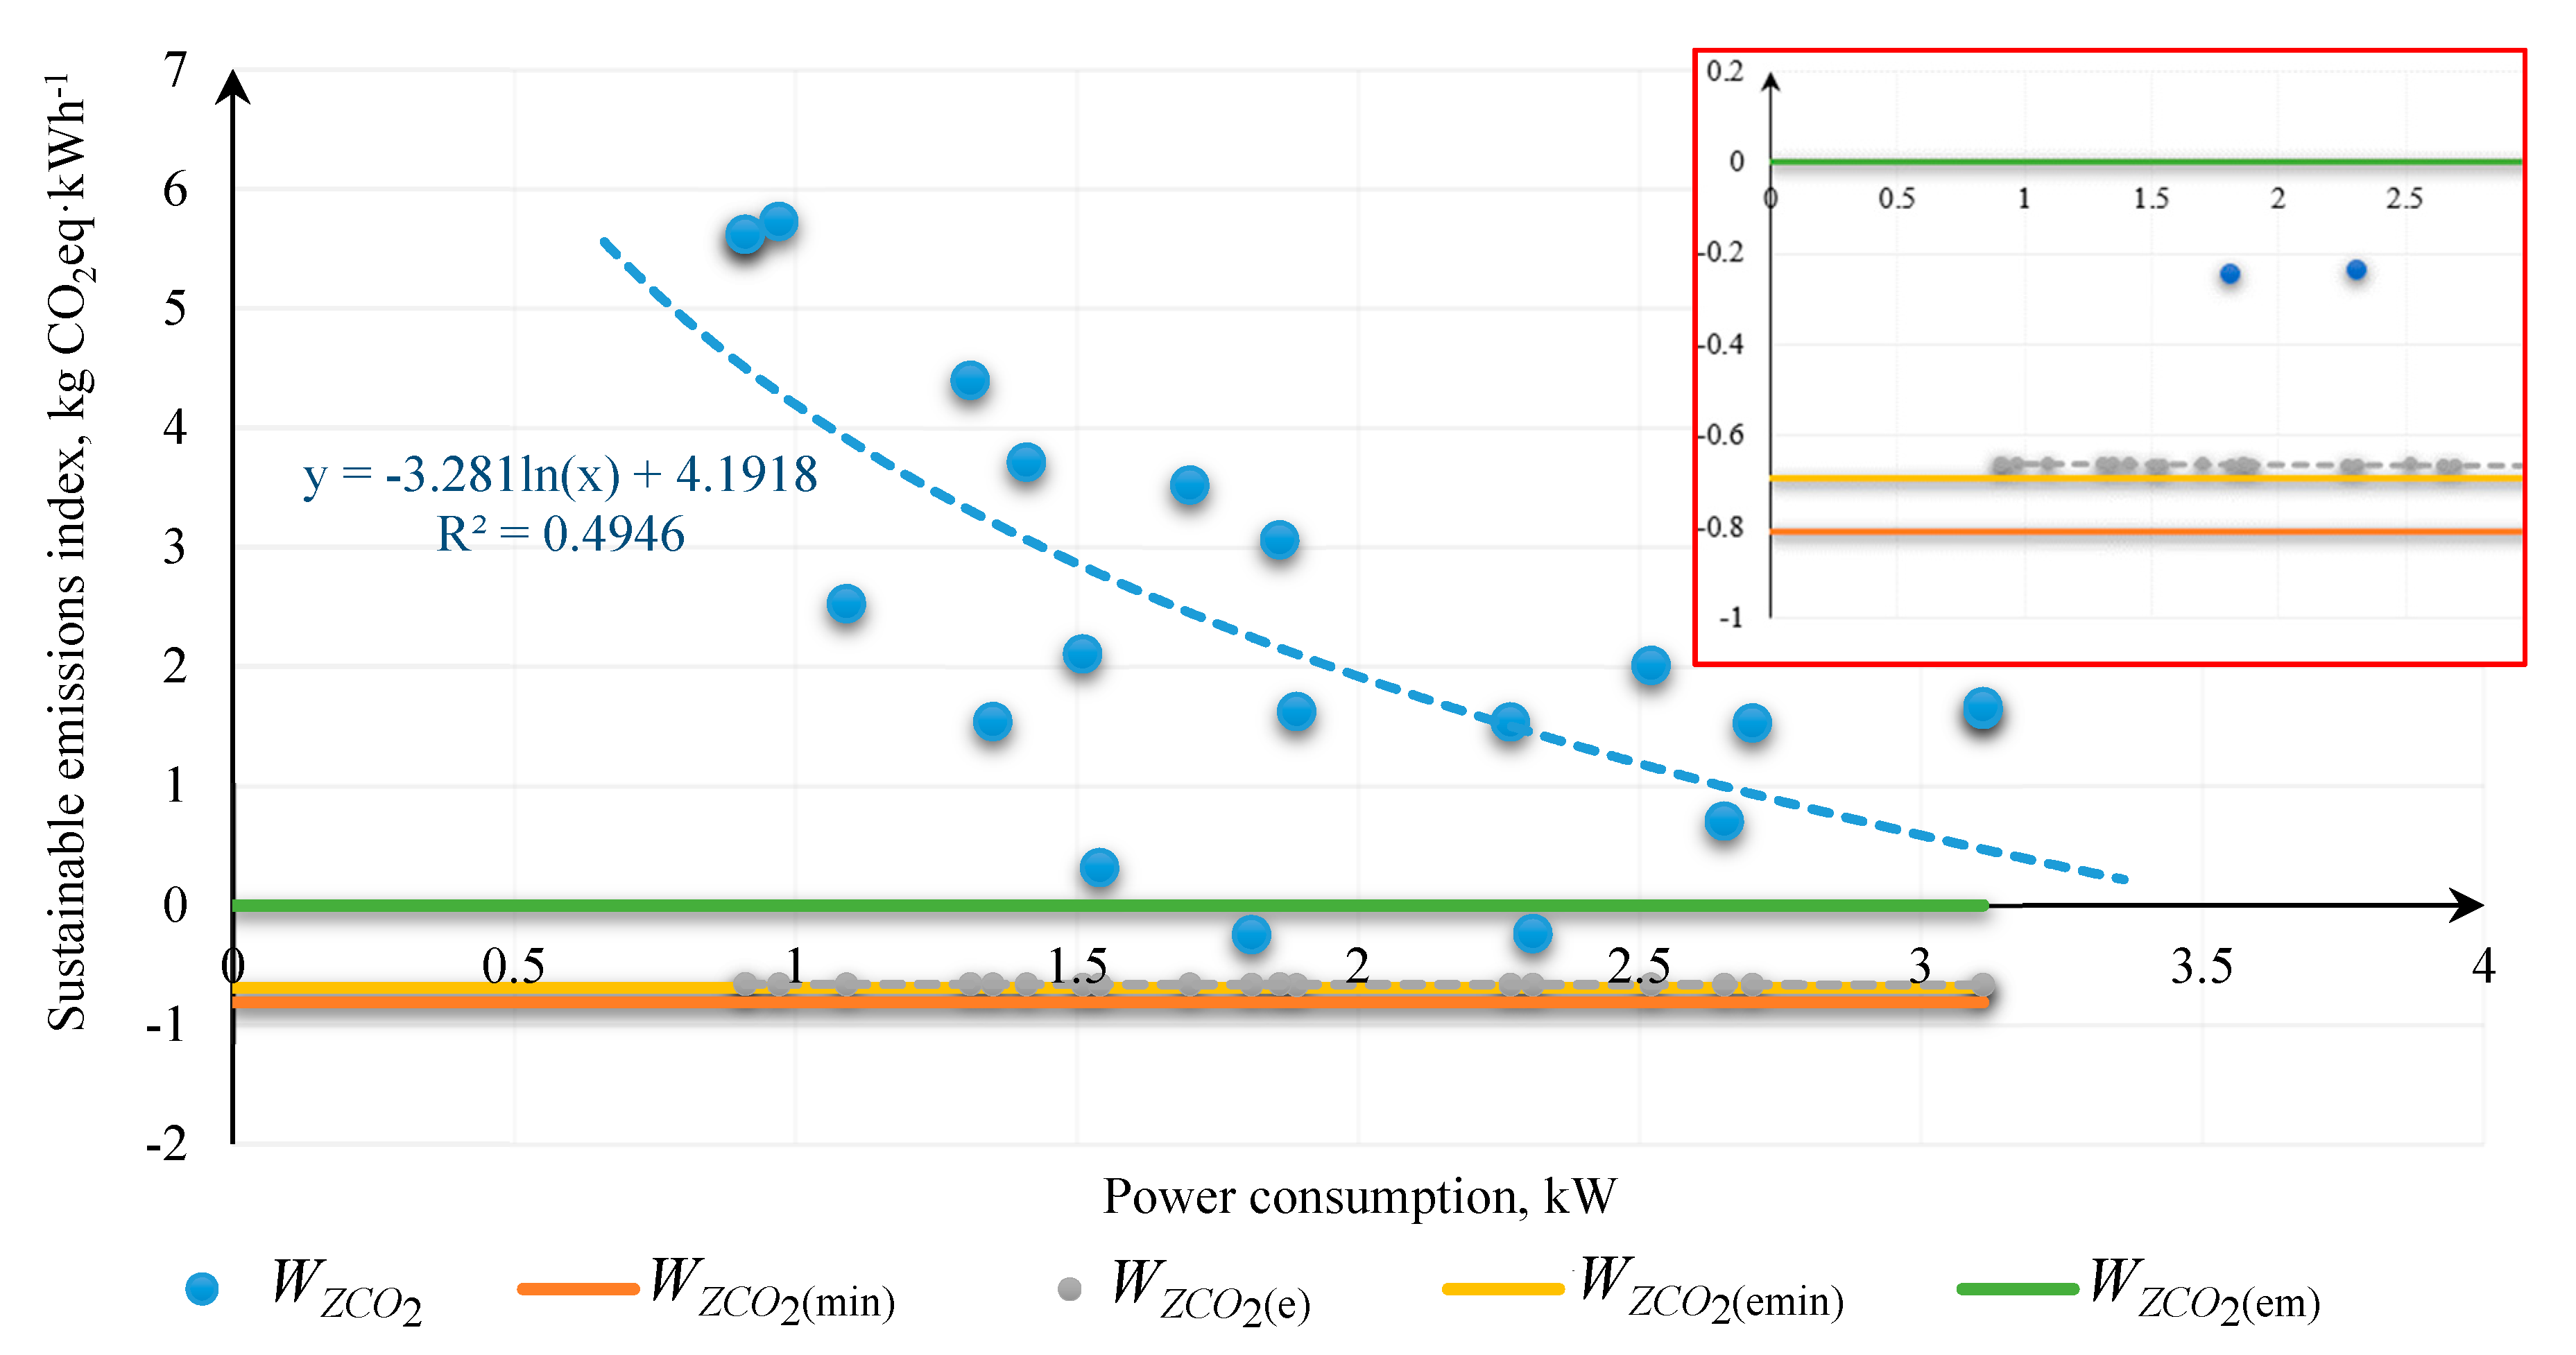
  • if JACO2min/kk > JKCO2 then WZCO2 (e) > 0,
  • if JACO2min/kk < JKCO2 then WZCO2 (e) < 0.

2.2. Conditions of Experimental Model Verification

Verification of the model of the sustainable CO2 emissions index involved carrying out an experiment with the use of a real object. Tests were performed in the following order:
  • Choice and preparation of the test stand;
  • Choice and preparation of the biomass to be tested;
  • Determination of grinding conditions and the tests program;
  • Comminution of the biomass while monitoring functional characteristics of grinding
  • Determination of calorific values and emission values for given biomass fractions after comminution;
  • Calculation of the value of the sustainable CO2 emissions index;
  • Analysis of the relations between the emissions index and the angular speed of the working elements cutting edges.
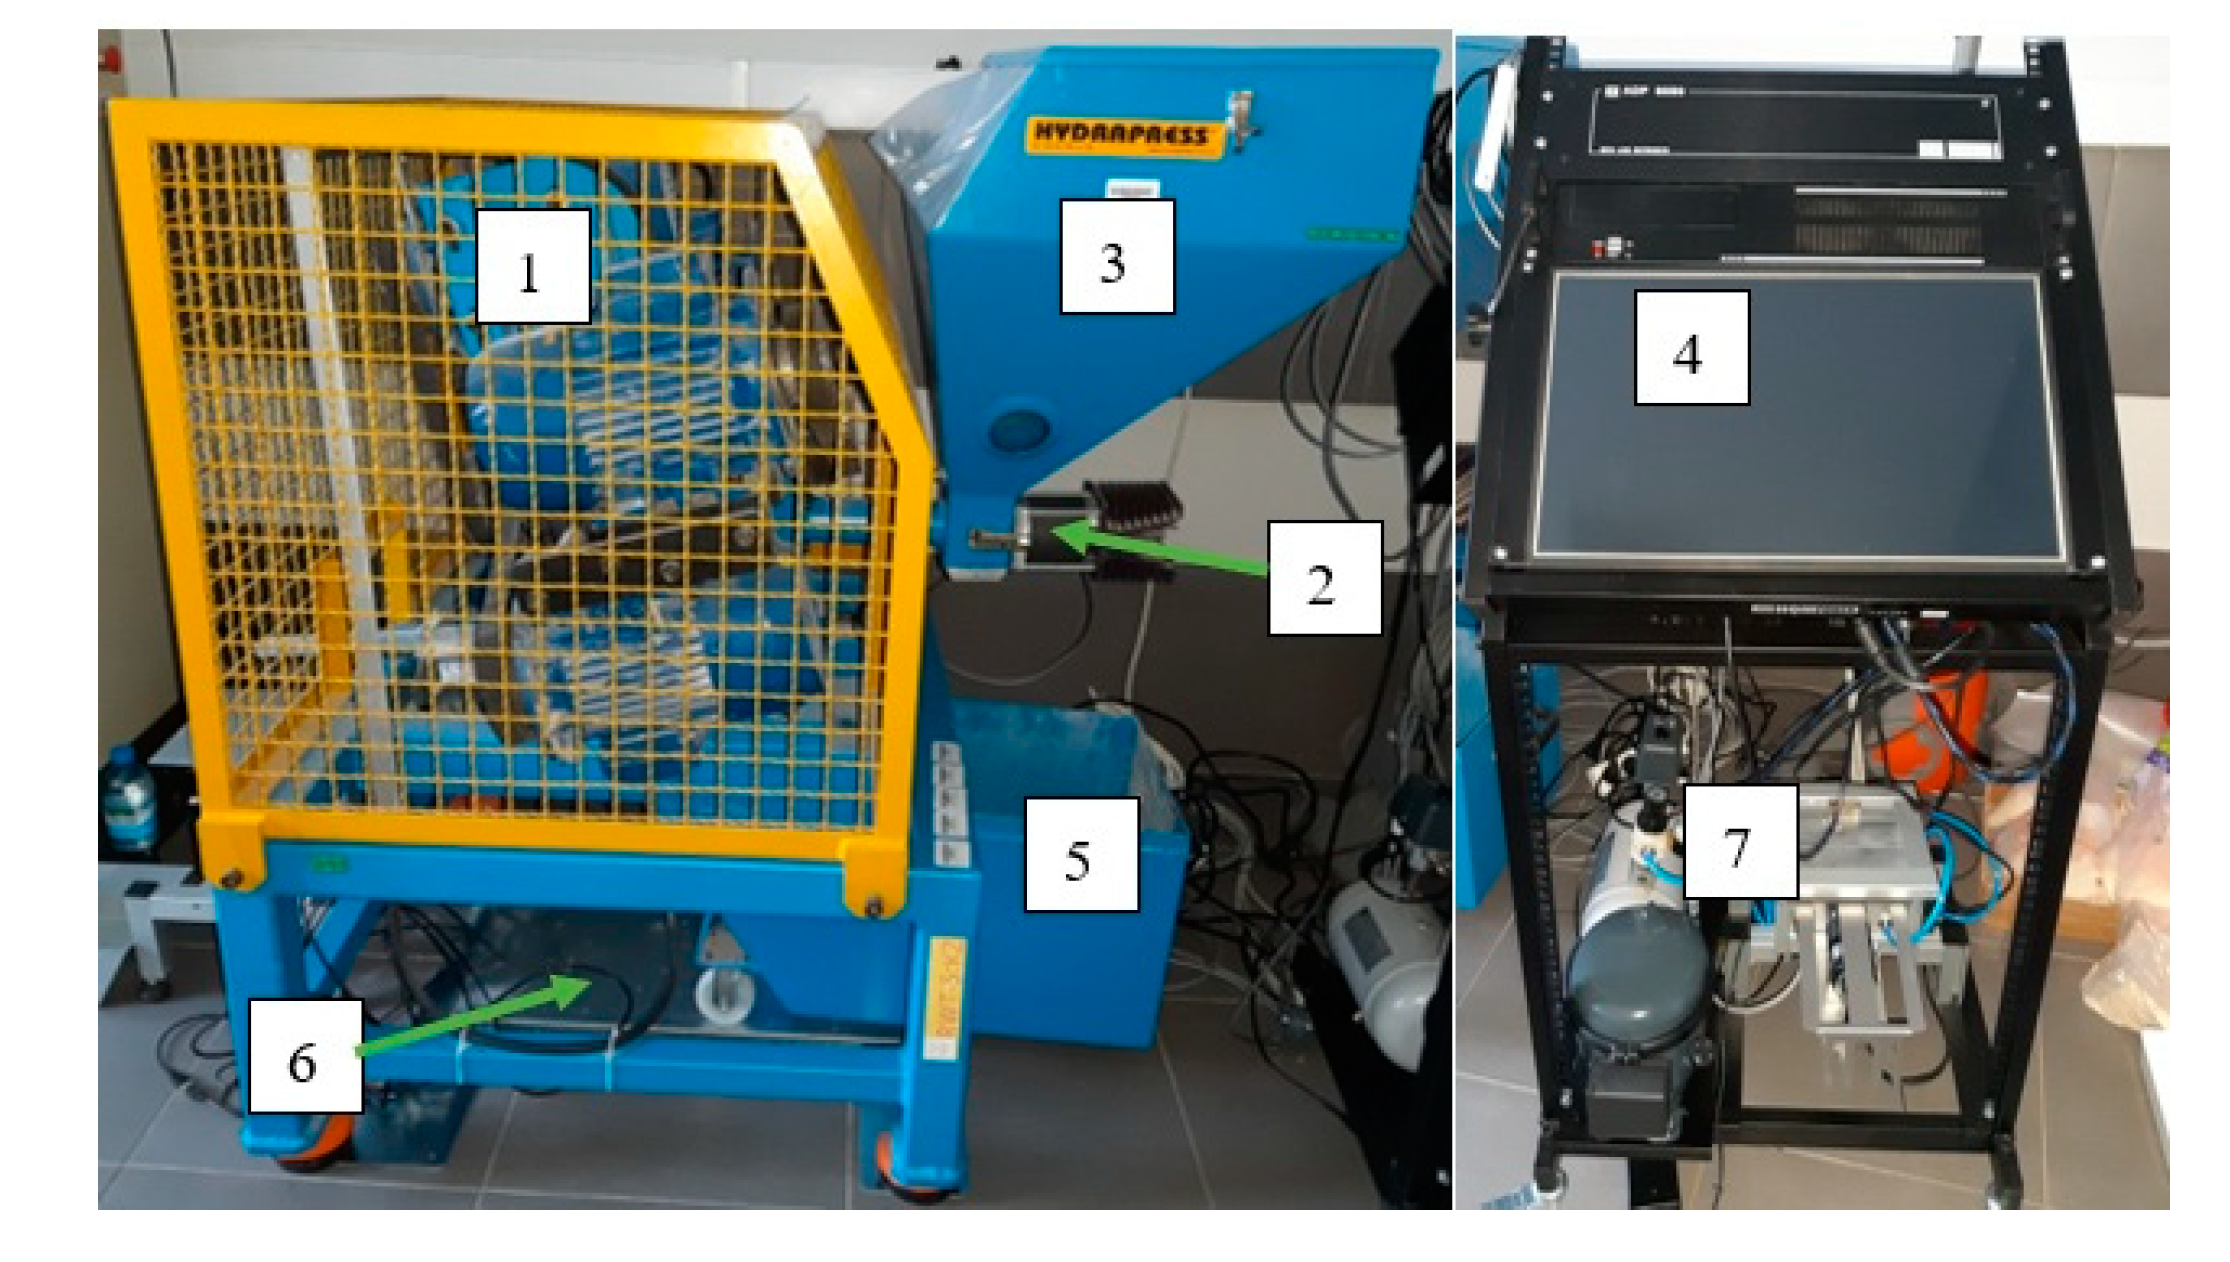
2.2.1. Test Stand

A mathematical model of the sustainable CO2 emissions index for the grinding process in the biomass processing chain has been developed to be implemented in a self-regulating control grinding system. The tests were conducted for a five-disc mill drive. The test stand consisted of a grinding unit (of a five-disc grinder) equipped with modules to control and monitor the functional characteristics of the mill control unit and the feed system. Figure 2 shows a view of the test stand.
The main elements of the grinder include the housing, body, working chamber, hopper, product reception basket, and grinding unit. The grinding unit includes five discs powered by five electric motors which make it possible to control and monitor the grinding characteristics independently for each disc. Table 1 provides the most important structural characteristics of the grinder discs.

2.2.2. Comminuted Biomass

The study involved samples of corn and rice grains that were not suitable for food or animal feed uses. Corn is widely used in the energy sector, especially in biogas production. In Canada, it has also been used for direct combustion in special stoves [60,61]. Rice, as the plant with the greatest cultivation area, has great potential to be used for energy production. It is most commonly used in the form of briquettes [62]. Both comminuted grains can be a good substitute for coal, considering their relatively high heating values [61,63,64,65].
Before grinding, the moisture of the grains was assessed on a MAC 210/NP moisture balance (RADWAG, Radom, Poland) on the basis of the sample mass difference before and after drying, in accordance with the weighing method given in ISO norm 1446 [66,67]. The moisture of the rice grains was 13.47% ± 0.02%, while for corn it was 12.68% ± 0.02%, and the average dimension D80 of the grains was determined on the basis of granulometric analysis carried out in accordance with ISO norm 13322-2:2006 [68], by means of a CAMSIZER device (Retsch Technology GmbH, Haan, Germany), where the results were 2.14 ± 0.02 mm and 8.15 ± 0.02 mm, respectively. Before the grinding process, grains were subjected to prior initial drying. The rice used in the study was deprived of its husk, while the corn was separated from the cobs. Before being burned, pellets were made from ground material that was divided into appropriate dimensional fractions.

2.2.3. Comminution Process Conditions

Emissivity assessment was carried out for a five-disc mill, for the comminution of two grainy materials: rice and corn. In each case, 1 kg of the material was used; both power intake and torques that occurred on particular discs were recorded. Data were recorded every 5 s. Grinding efficiency was determined according to Equation (6). The biomass granulometric content after grinding was determined by means of a CAMSIZER device (Retsch Technology GmbH, Haan, Germany), according to ISO norm 13322-2:2006 [68]. The material was delivered by means of a slide feeder with a fixed input equal to 112 kg·h−1. The angular speeds of the discs were accepted as process variables in order to find out their impact on the sustainable CO2 emissions index. Summary Sω change in the angular speed on all the discs, starting with the minimal level, that is, from 20 rad·s−1, was accepted as the variable of the analysis of the relations between the emissions index values and the angular speed.
The experiment plan included five different test programs (PB) and angular speed settings depending on the manner of the speed growth ∆ω (Table 2), accepted according to [49]. Angular speed settings were repeatedly changed in the range from 20 to 100 rad·s−1 with a certain gradient ∆ω (Table 2). Next, the values of the proposed sustainable CO2 emissions index were determined for each configuration.

2.2.4. Determination of Calorific and Emissions Values for Given Biomass Fractions after Comminution

Rice and corn grains were comminuted and divided into dimensional fractions with the use of steel sieves (Table 3). The division was made by means of a sieve shaker Analysette 3 PRO (Fritsch GmbH, Idar-Oberstein, Germany) in accordance with DIN norm 66165 [69]. After the division into fractions, a pellet maker was used to prepare pellets. Next, 1.5 kg samples were combusted in a pellet Greń furnace of the EG-Pellet type (GREN sp. z o.o., Pszczyna, Poland). CO2 emissions measurements were performed by means of a dedicated exhaust fumes analyzer ULTRAMAT 23 (Siemens AG, Nürnberg, Germany) for approximately 10 min for each sample. The analyzer measures the content of carbon dioxide (CO2), carbon monoxide (CO), nitrogen oxide (NO), sulfur dioxide (SO2), and dioxide (O2) in the exhaust emissions.
Calorific values of the pellets prepared from the ground biomass with dimensions presented in Table 3 were determined in earlier tests whose results can be found in the authors’ other publications [55].

2.2.5. Analytical Methods

Tools for statistical analysis available in MS Excel (Microsoft, Redmond, Washington, USA) and Statistica (TIBCO Software Inc., Palo Alto, CA, USA) were used to analyze the results. Basic descriptive statistics of sustainable emissivity were determined. Relations between angular speeds of the grinder discs and emissivity were examined using correlation analysis with Spearman’s method and the analysis of regression and the adequacy of the proposed models. The significance level was accepted as p < 0.05.

3. Results and Discussion

3.1. Input Variables of the Sustainable CO2 Emissions Model

The following assumptions and limitations were adopted for this study:
  • CO2 emissions involved in the production of electric energy from coal is 0.812 kgCO2·kWh−1 [70].
  • In the emissions analysis of this paper, only emissions from the grinding and energy-use processes were considered. Emissions relating to the pelletization process were excluded. The analysis was limited to energy use in the form of pellet combustion. No other methods were considered, such as gasification, fermentation, or digestion.

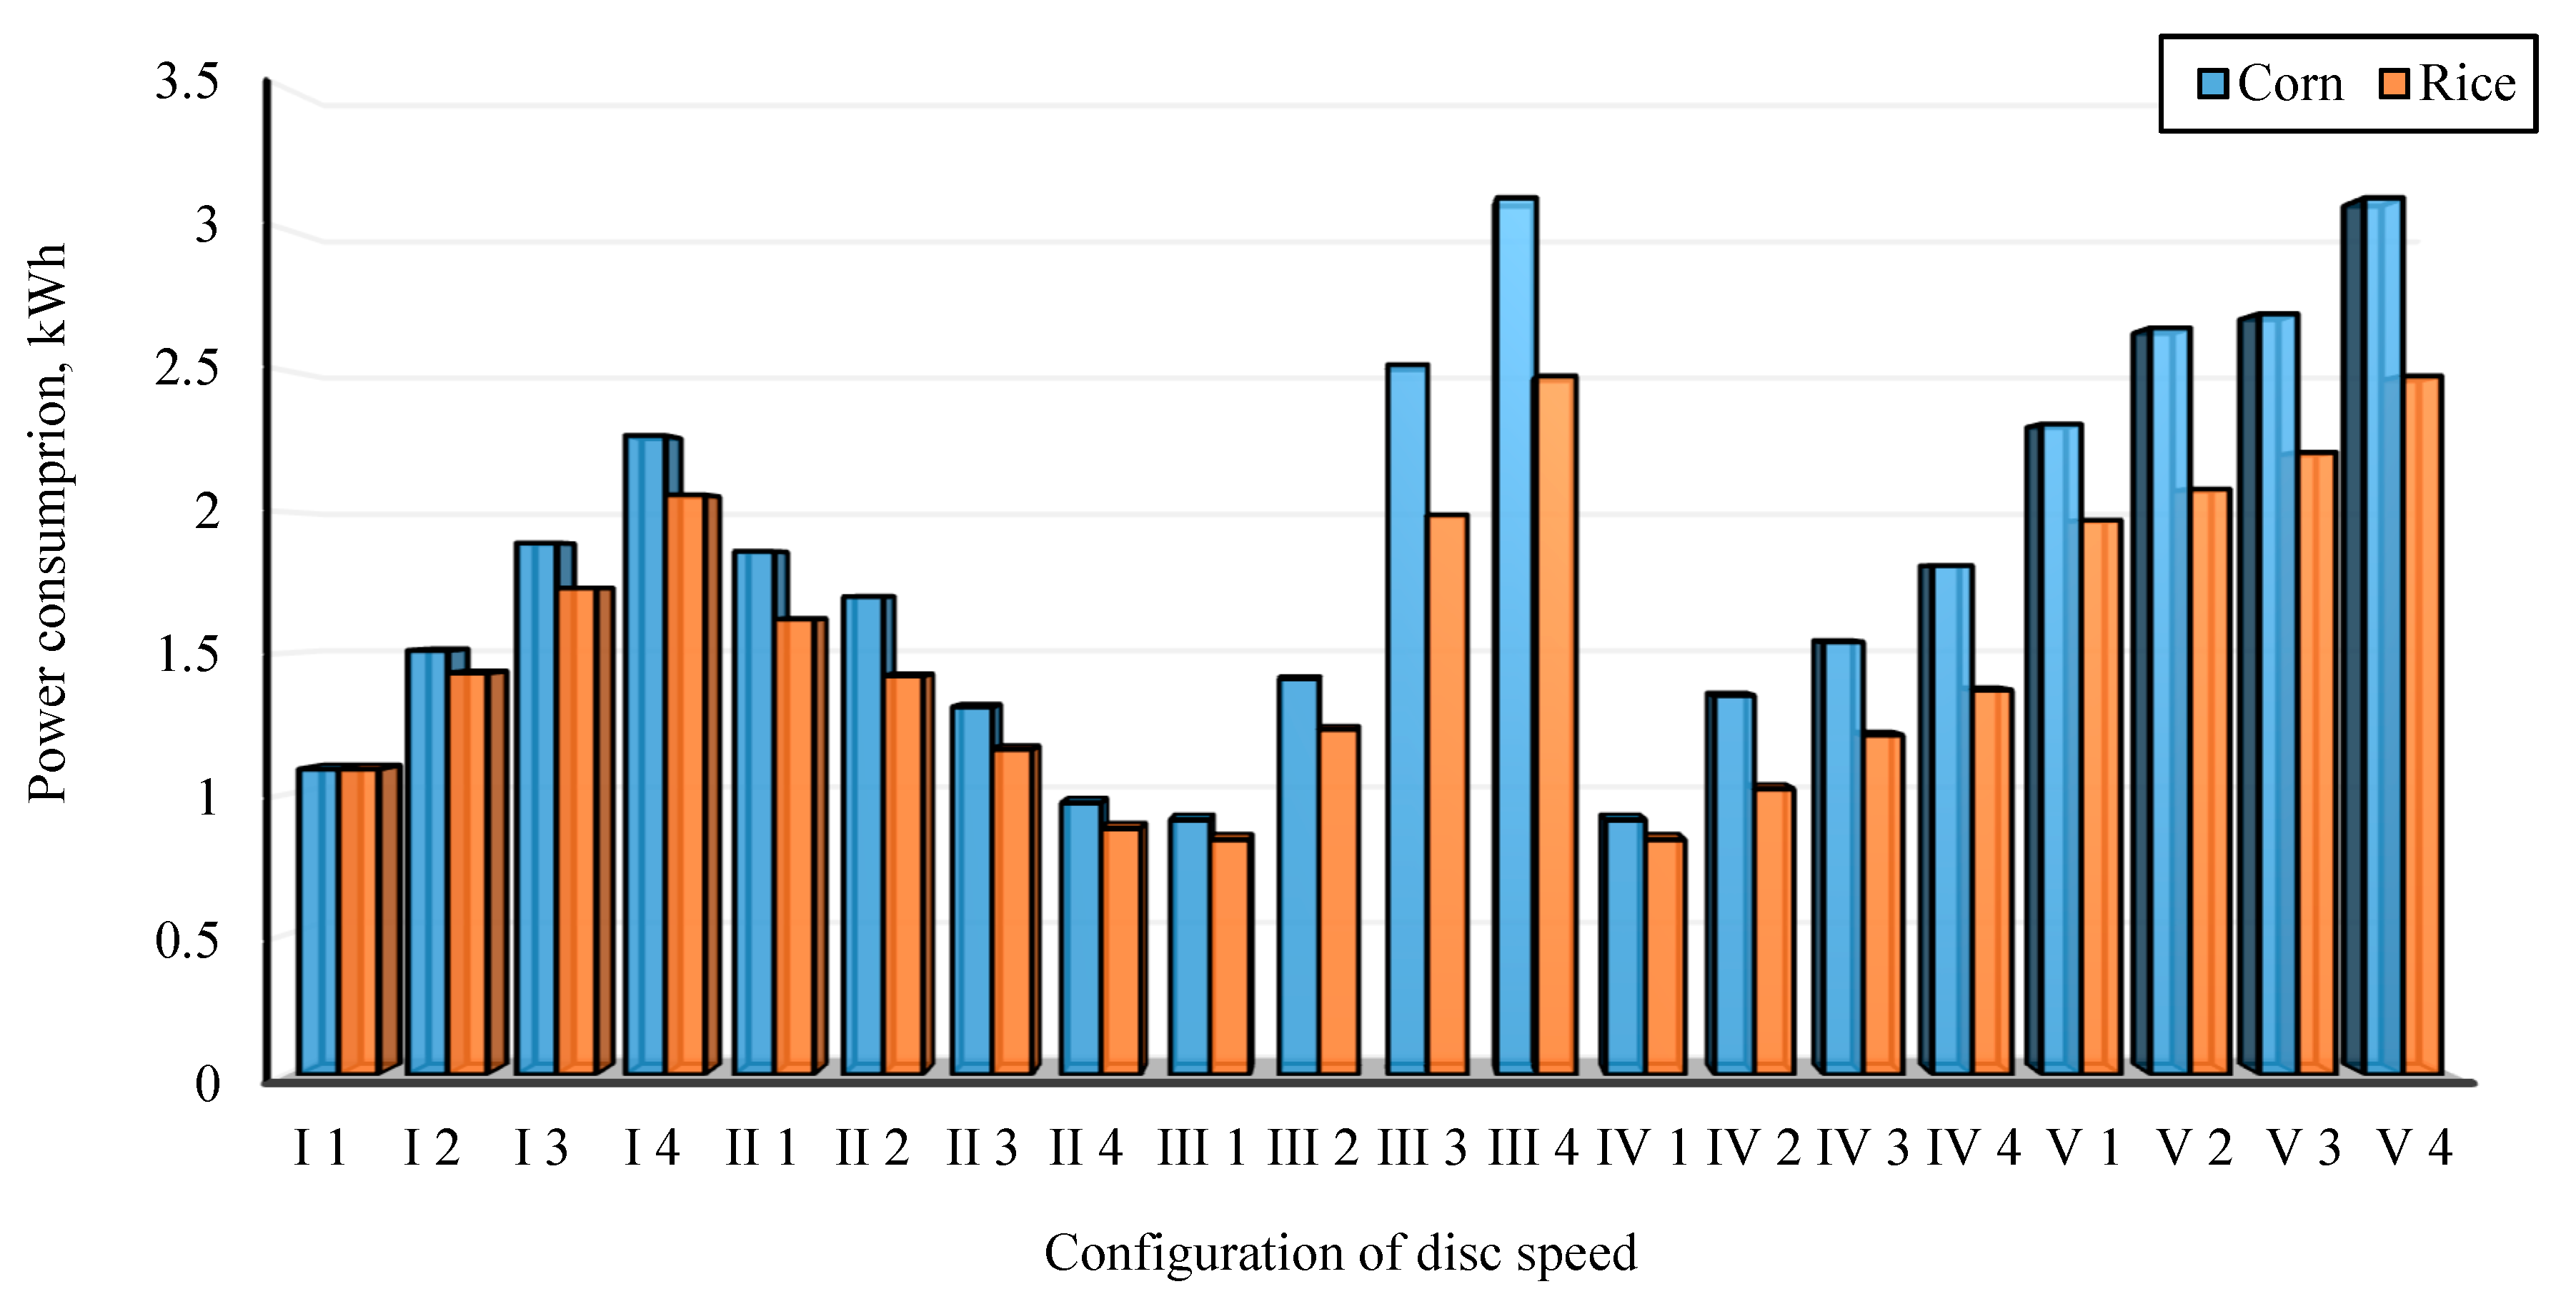
3.1.1. Power Consumption

The power input on each disc of the five-disc grinder was recorded during the experiment. Figure 3 shows the grinder’s total power input for each configuration of the five testing programs (Table 2).
An increase in the angular speed of the multi-disc grinder was caused by power consumption growth (Figure 3). It can also be noted that the highest power input was found for high-speed disc settings (setting no. 4 from PB III and setting no. 4 from PB V) and lowest for low angular speeds (setting no. 1 from PB III and setting no. 1 from PB IV). The power input for all the settings was higher for corn grinding. The power requirement during corn grinding is higher than that during rice grinding, and this results from the strength properties of both types of grains, which largely depend on their physical properties, e.g., humidity and internal structure [71]. The forces used to destroy the corn grain should be higher than those used to permanently deform the rice grain, which translates into a higher resistance to the movement of the working elements of the crusher (cutting discs) and results in an increased power requirement in the case of corn grinding [47]. The above statements result from the different internal structures of the grains examined—differences in the structure of the endosperm and tegument (the ground rice was deprived of its husk) [72,73,74].

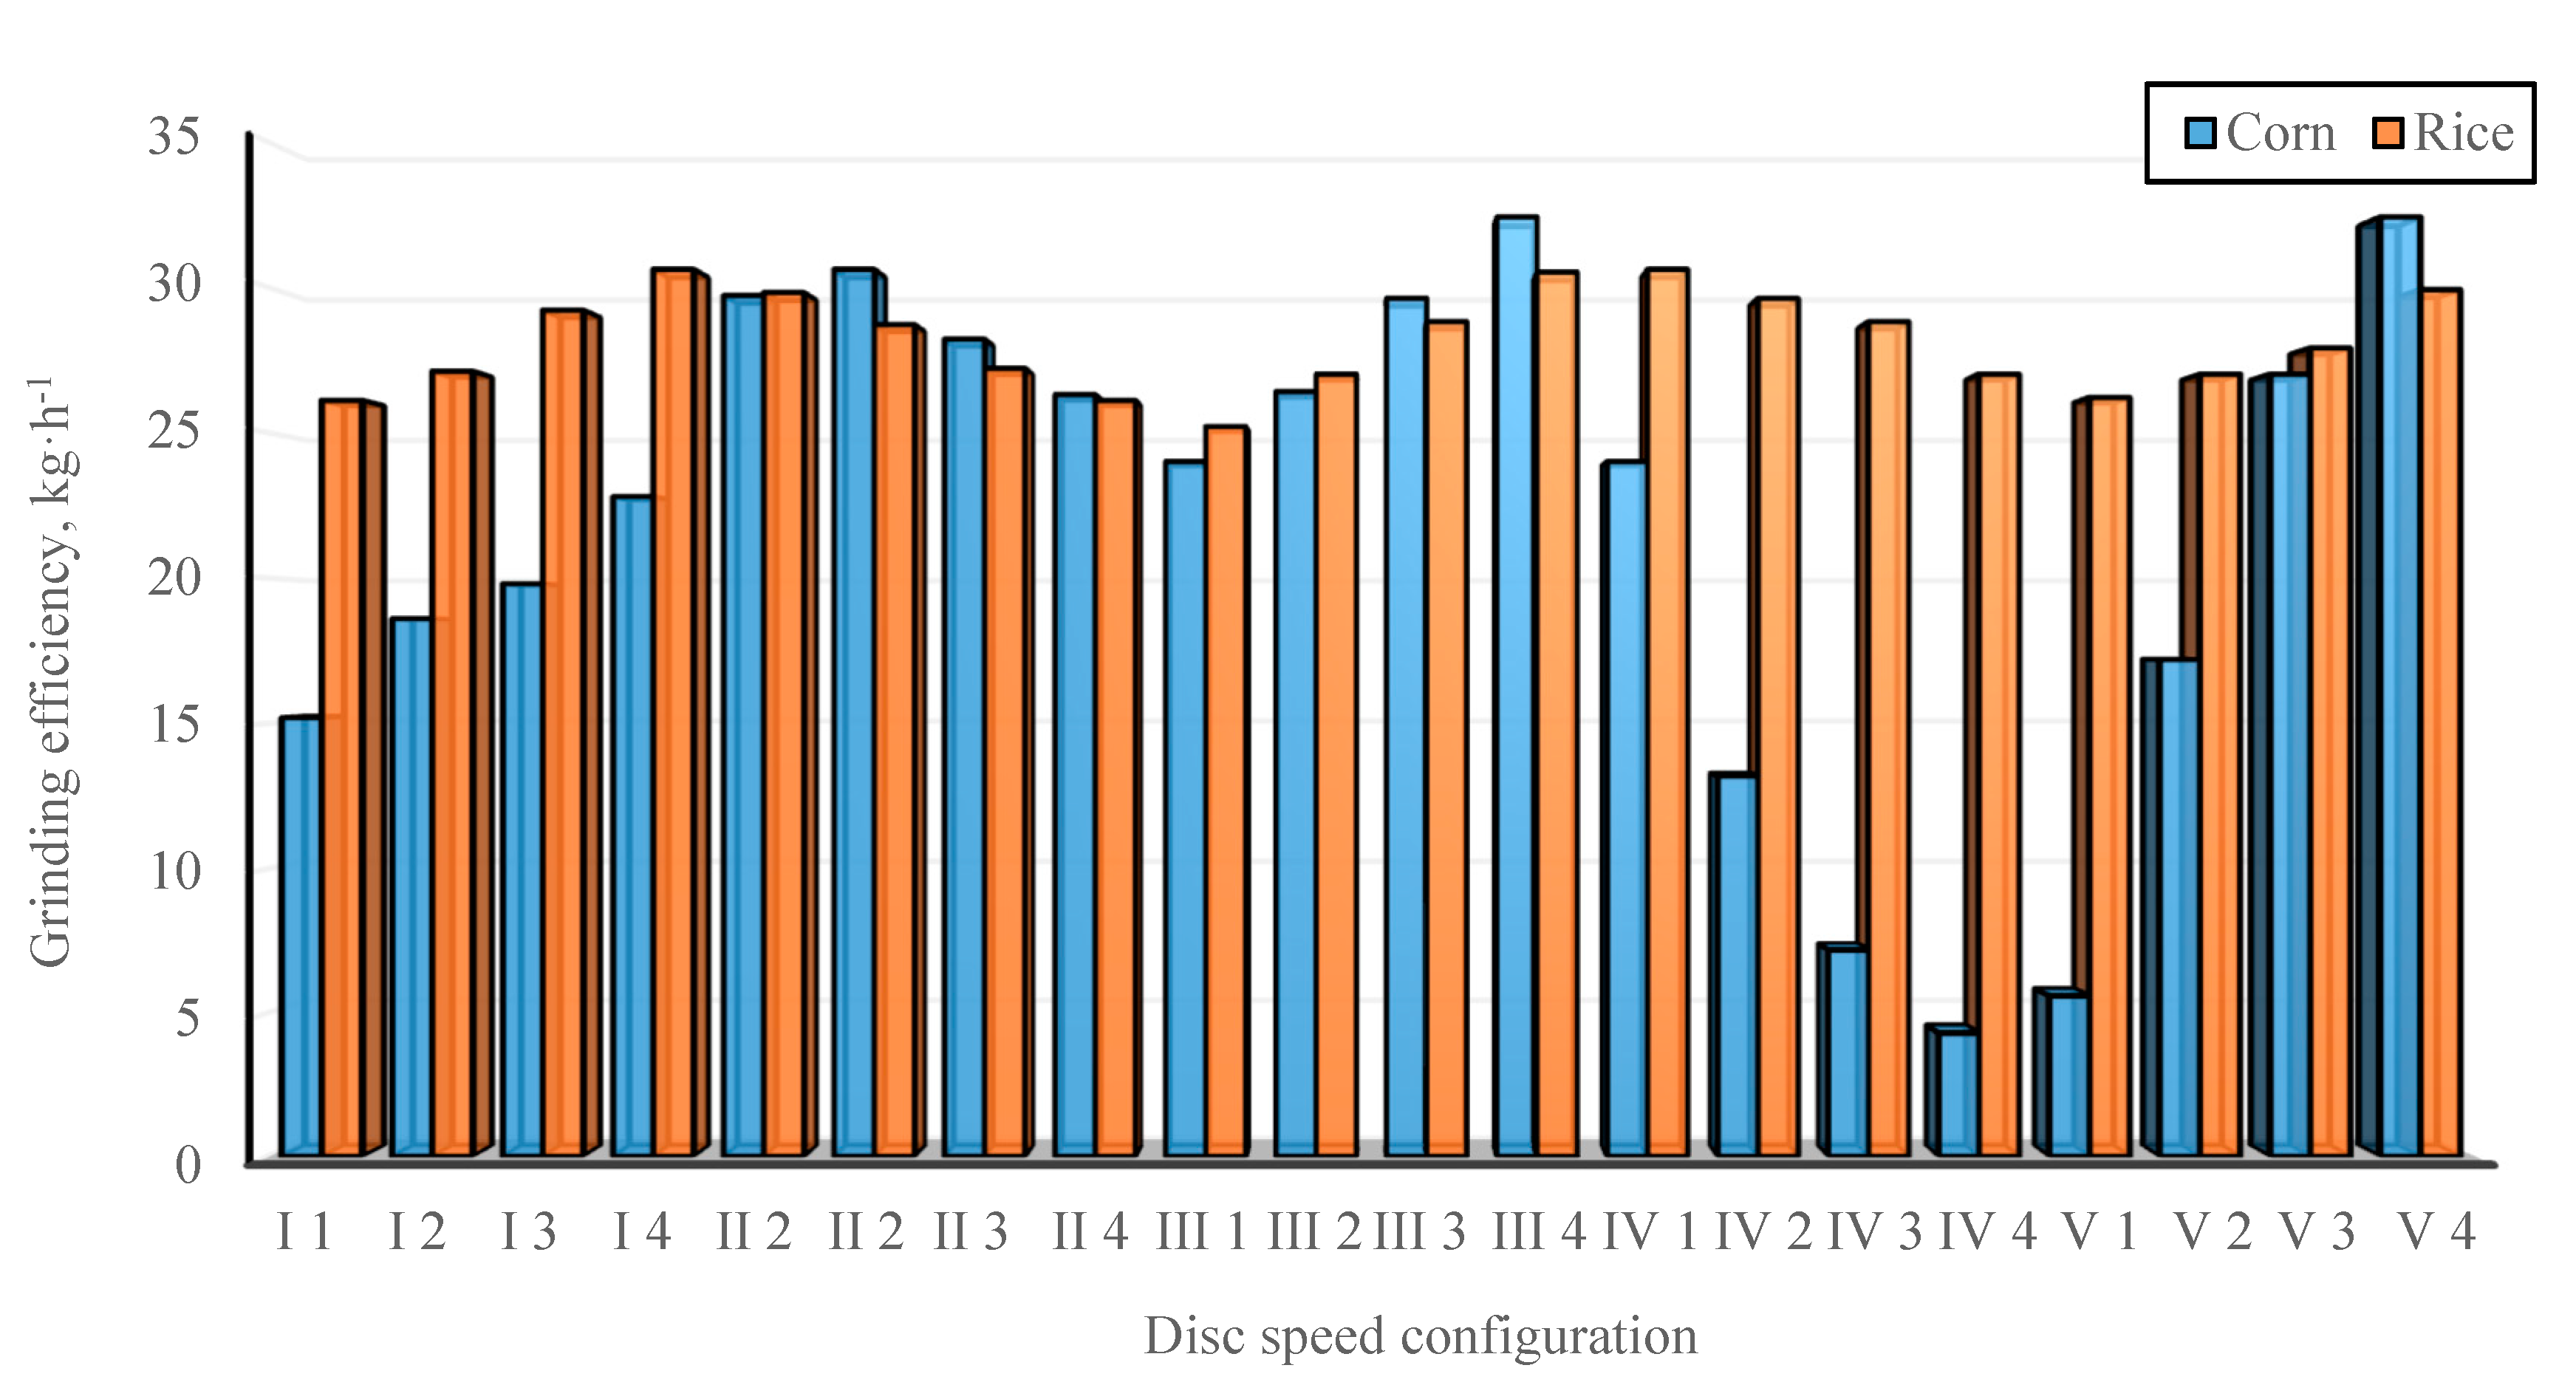
3.1.2. Grinding Efficiency

Figure 4 shows the results of monitoring the grinding process efficiency for each configuration of the disc angular speed setting according to five research programs (Table 2). Grinding efficiency increased along with an increase in the disc angular speeds (Figure 4). It can also be seen that the highest efficiency was found for the disc high angular speed settings (setting no. 4 from PB III and setting no. 4 from PB V).

3.1.3. Granulometric Content of Biomaterial after Grinding

Knowledge of the percentage share of the accepted dimensional fractions of biomass is needed to determine the values of the sustainable CO2 emissions index. For this purpose, a granulometric analysis of the ground material was performed with the use of a CAMSIZER device (Retsch Technology GmbH, Haan, Germany). Table 4 shows the results of this analysis for particular settings of the disc angular speed for rice and corn. The results show that the fraction percentage share was different for each disc angular speed setting configuration.

3.1.4. Unit Emissions Index JACO2i for the i-th Dimensional Fraction

A unit CO2 emissions index for a given biomass fraction was determined on the basis of the analysis of the CO2 content in exhaust emissions. The values of the unit JACO2i index are presented in Table 5. It can be noticed that CO2 emissions increased along with an increase in the size of the particles of the biomass, which was used for the preparation of pellets.

3.1.5. Calorific Values

Calorific values for given dimensional fractions of biomass were accepted according to [55]. Table 6 shows the calorific values calculated into kWh·kg−1.

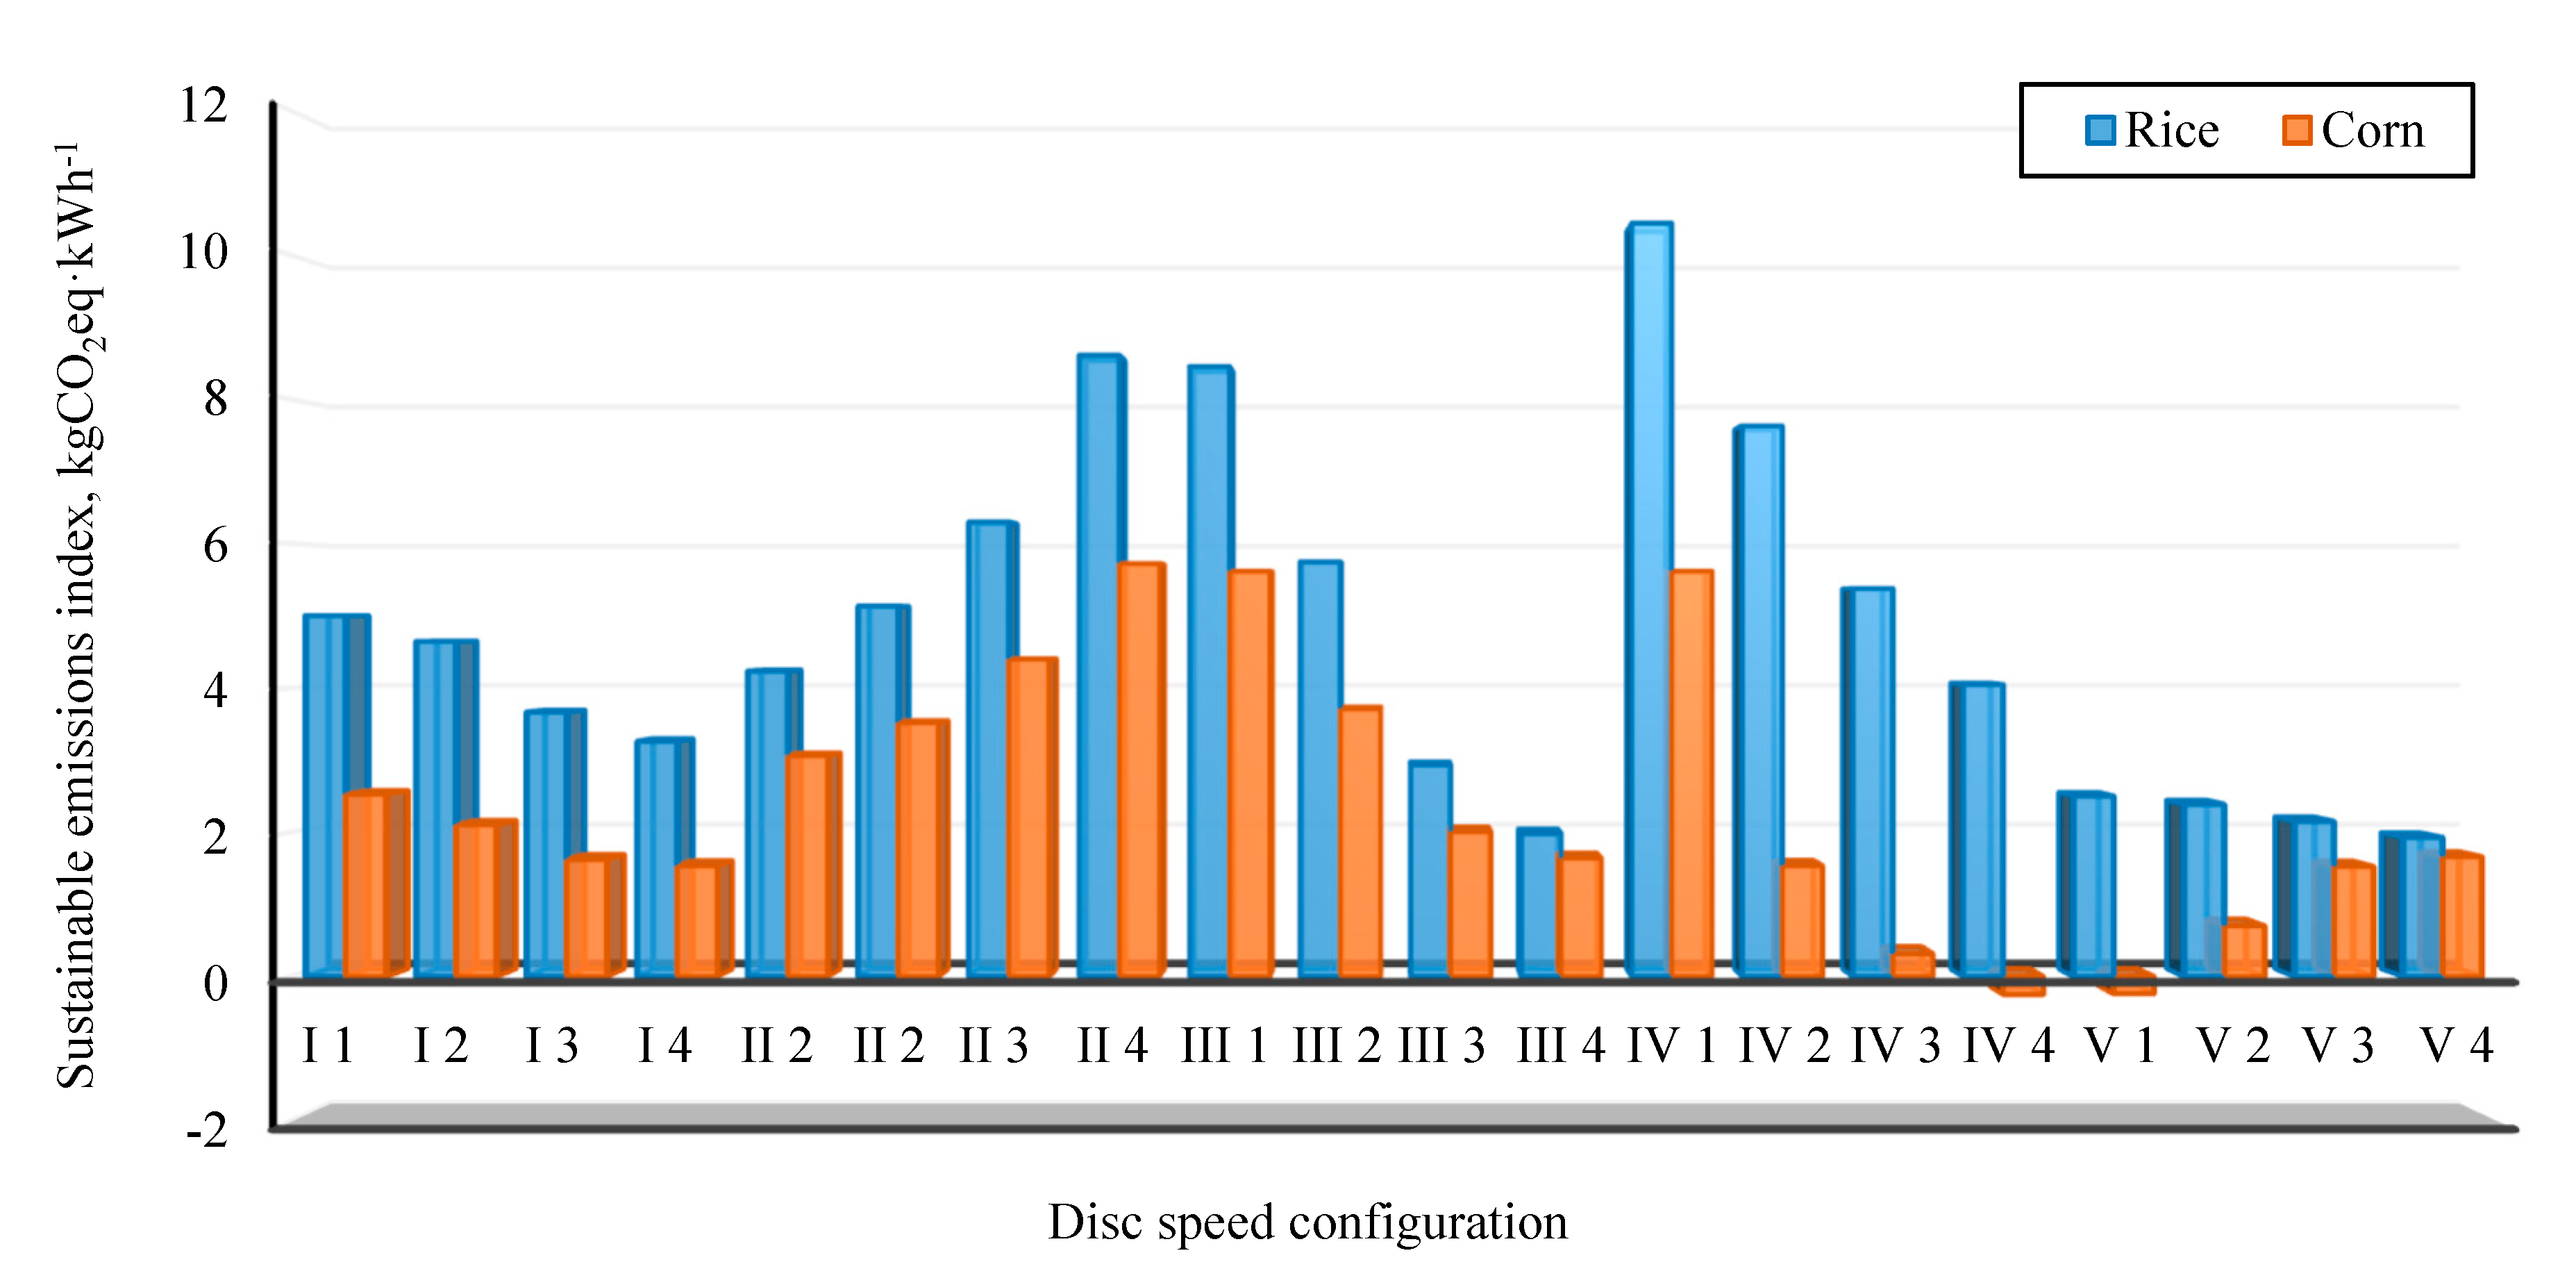
3.2. Carbon Dioxide Emissions Assessment of Grinding by Means of the Sustainable CO2 Emissions Index

The grinding processes carried out in particular research programs were subjected to emissions assessment. For this purpose, the values of the sustainable CO2 emissions index were determined for each case on the basis of both Equation (9) and the values of the variables obtained (Figure 3 and Figure 4, and Table 2, Table 3, Table 4, Table 5 and Table 6). Figure 5 shows the results of the sustainable CO2 emissions index calculation for the tested multi-disc grinder disc angular speed configurations and the two ground materials—rice and corn.
When analyzing the variability of the sustainable CO2 emissions index, it should be noted that the desired condition is to reduce the energy consumption for grinding EcM and increase the environmental benefits ΔBCO2, i.e., replacing CO2 emissions from coal with CO2 emissions from biomass combustion. In this case, the value of the proposed index should increase. When comparing the grinding processes, the more favorable in terms of emissions will be the one for which the sustainable CO2 emissions index assumes higher values [54].
Based on the results, it was found that the best, in terms of emissivity, both for rice and corn grinding, were settings VI1 of the angular speed of the grinder discs (Figure 5). The least advantageous for rice grinding were settings V4, and for corn, settings IV4 (Figure 5). It was noticed that better emissivity results were obtained for the configuration in which the disc angular speed was low (for example, I1, II4, III1, IV1). The values of the sustainable emissions index were higher for rice grinding than for corn grinding in all the disc angular speed configurations, which was caused primarily by lower energy consumption during rice grinding and higher grinding efficiency. The values of the emissions index provided sufficient grounds to state that the emissions from electric energy used in the rice comminution process were sustainable or in fact higher than the emissions from combustion of the comminuted biomass for all the analyzed disc angular speed settings because WZCO2 > WZCO2(em) = 0 (Figure 5 and Figure 6). In the case of corn grinding, two configurations (IV4 and V1) did not provide emissions sustainability (WZCO2 > WZCO2(em) = 0).
The minimal value of the sustainable emissions index CO2 WZCO2(min), determined on the basis of Equation (10), was −0.812 kgCO2eq·kWh−1 with the assumption that the electric energy used in the process of grinding was produced from coal (Figure 6 and Figure 7). In the case of electric energy produced from natural gas, this would be −0.201 kgCO2eq·kWh−1, from biogas: −0.196 kgCO2eq·kWh−1, from diesel oil: −0.276 kgCO2eq·kWh−1 [75].
The dependences shown in Figure 6 and Figure 7 indicate that there is no obvious correlation between power consumption and the sustainable CO2 emissions index when grinding corn, mainly due to the physico-mechanical properties of the corn grains that affect the grinding process. The influence of the working unit on the materials being ground and the mass flow phenomena in the grinding chamber are also crucial. The results obtained clearly show that the grinding process is different for both materials, which is influenced by differences in the physical and mechanical properties of both grains. In the case of corn, among other things, a greater unevenness of the grinding process (transient idling phases) was observed as a result of the material deposited in the grinding chamber as a consequence of the phenomenon of particle agglomeration, which was not observed in the case of rice. The balanced CO2 emission rate depends, apart from power consumption, on yield and the share of fractions of different particle sizes. The lack of an obvious relationship between power consumption and a balanced CO2 emission factor in maize grinding is due to the less clear relationship between power consumption (angular speeds of the grinding discs) and the yield and grain size composition of the grinding product than for rice. This, in turn, is also dictated by the difference in grain properties such as size. The ratio between grain size and disc gap is of particular importance for the yield and granulometric composition of the product. Rice grains are smaller so that they are crushed and drained through the inter-disc slots more quickly than larger maize grains, which must collide with the cutting edges of the shredder more times than rice grains before they leave the shredding chamber. The above-mentioned aspects make less regularity in the shredding of maize, resulting in a moderate relationship between power consumption and sustainable CO2 emissions.
The minimal value of the emissions index for energy sustainability WZCO2(emin) for rice grinding was −0.699 kgCO2eq·kWh−1 (Figure 6), whereas for corn grinding, it was −0.690 kgCO2eq·kWh−1 (Figure 7). The value of the emissions index for energy sustainability WZCO2(e) for the analyzed configurations of the disc angular speed settings are marked with a grey line (Figure 6 and Figure 7). The data show that the level of energy sustainability was exceeded for all the tested disc angular speed settings (Figure 6 and Figure 7), that is, the energy produced from biomass combustion was higher than the energy used in the process of grinding (obtainment of the comminuted product).

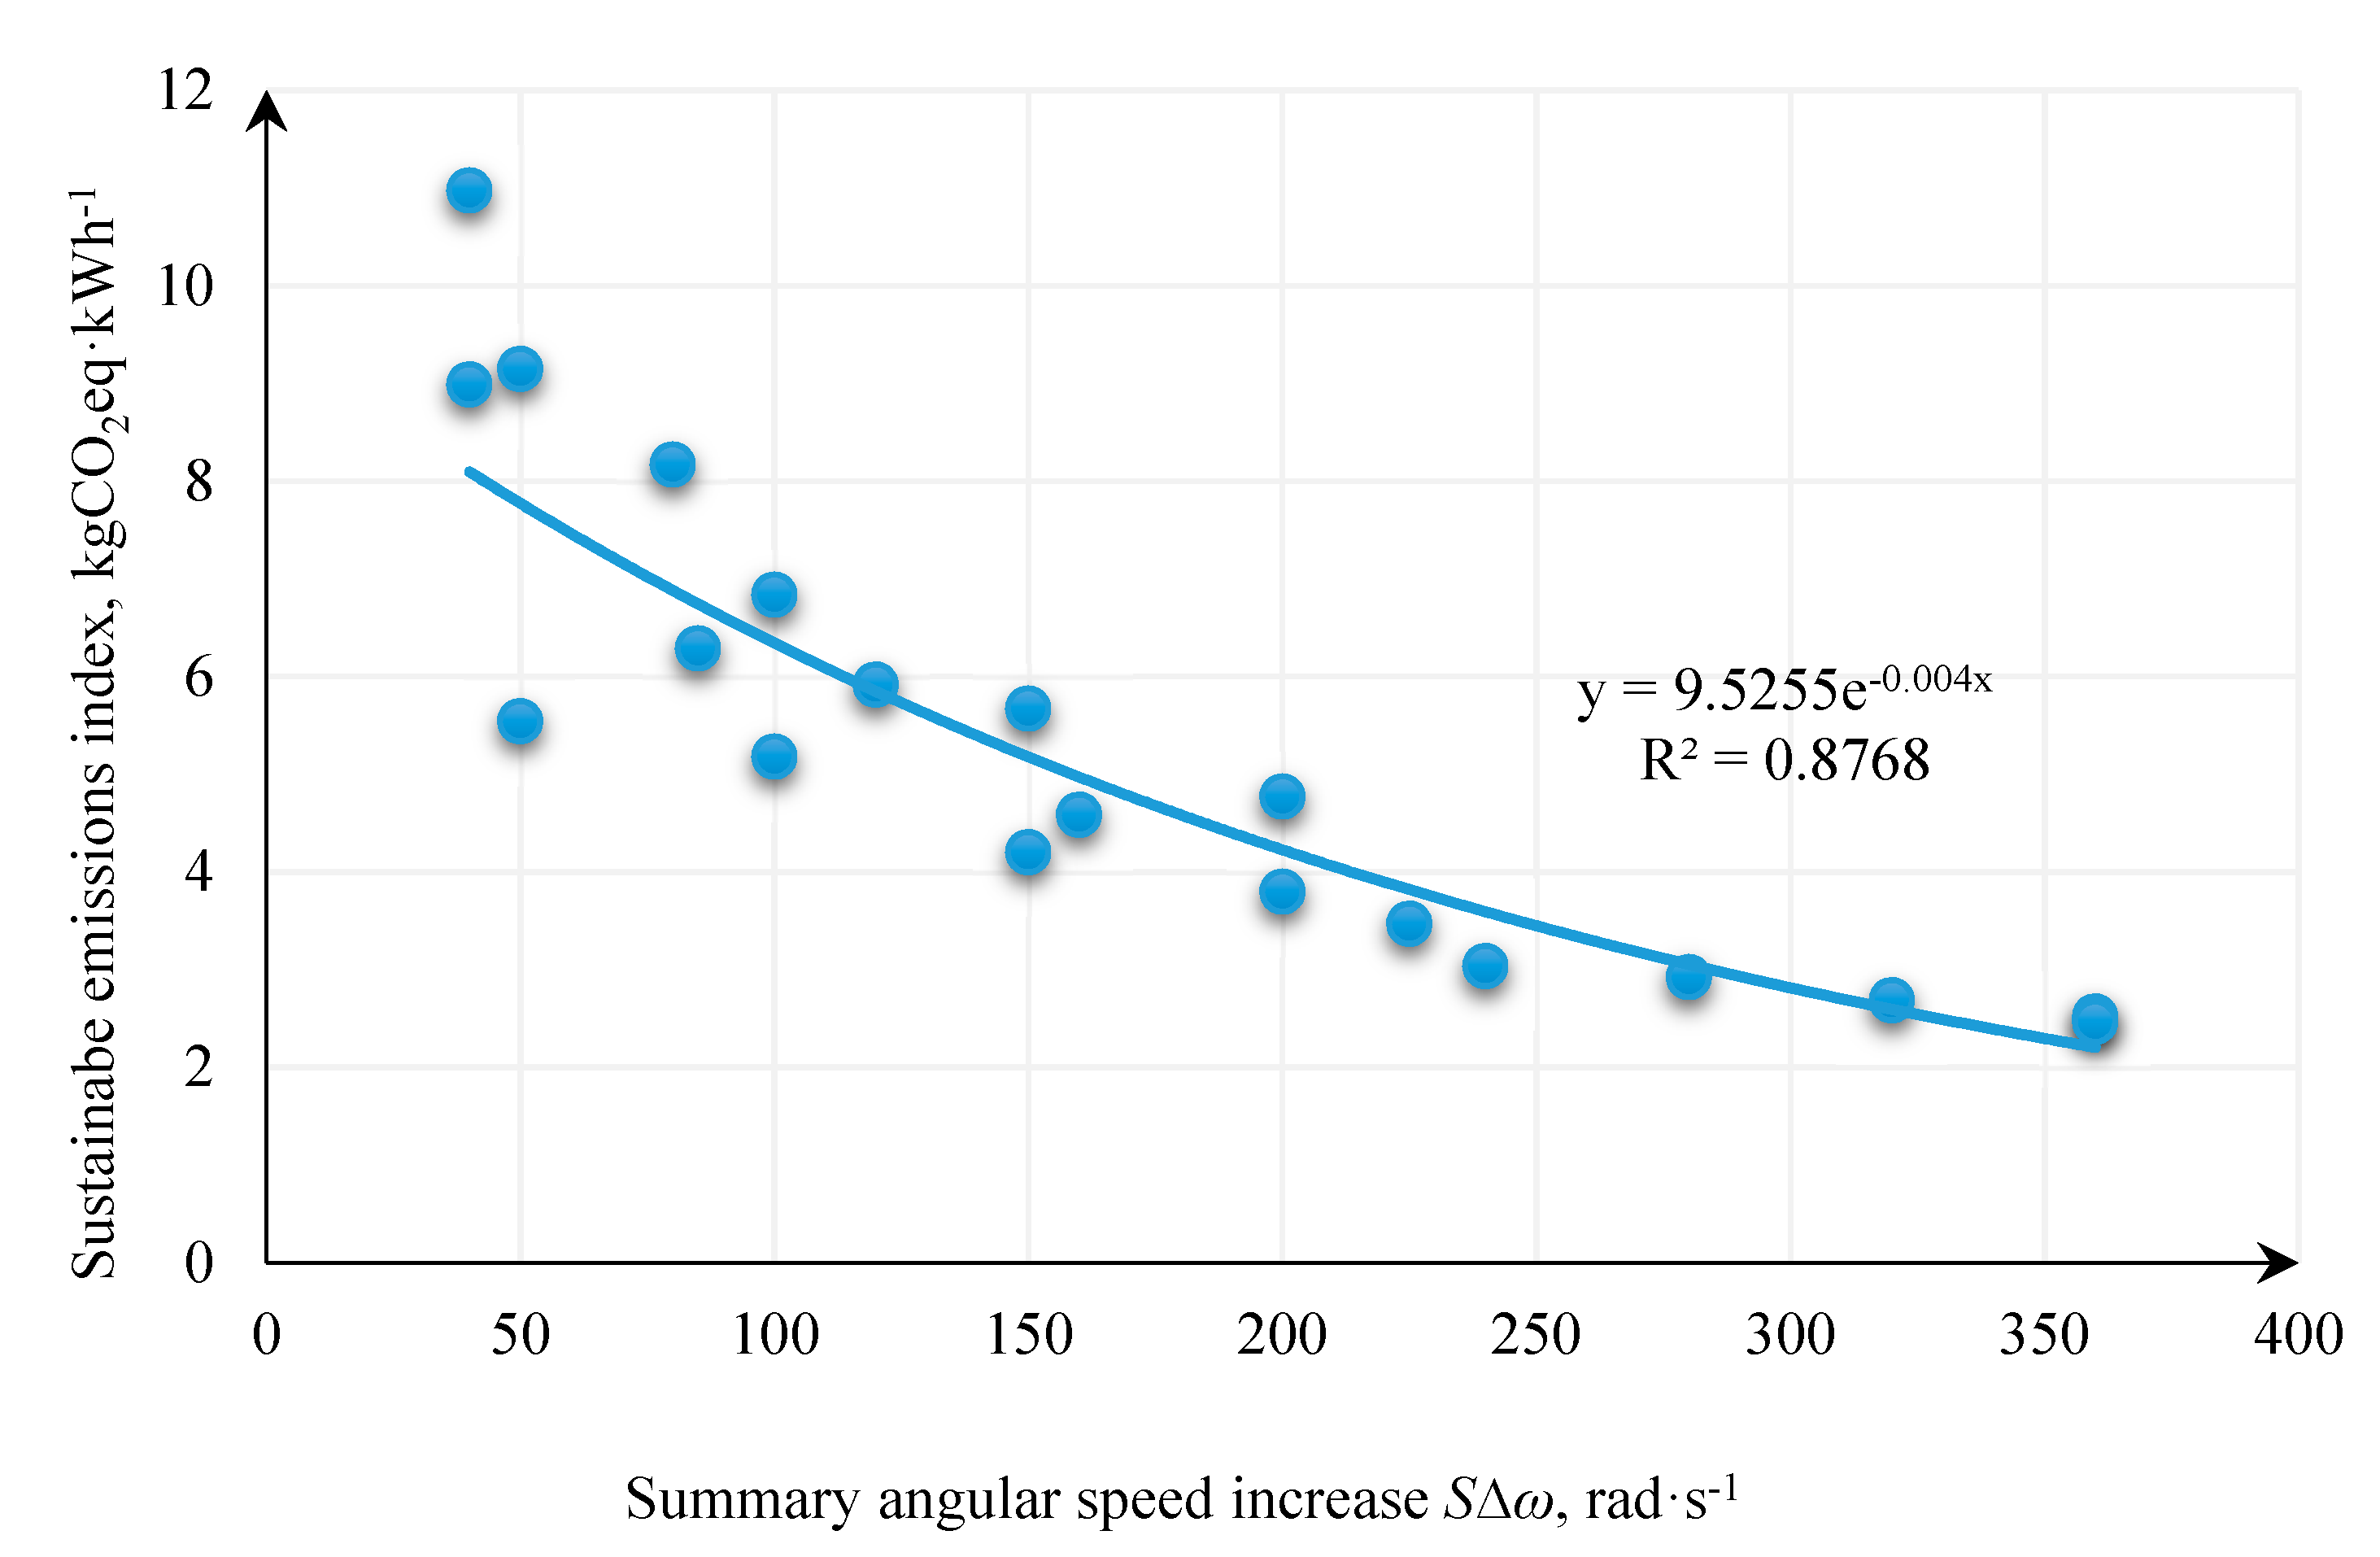
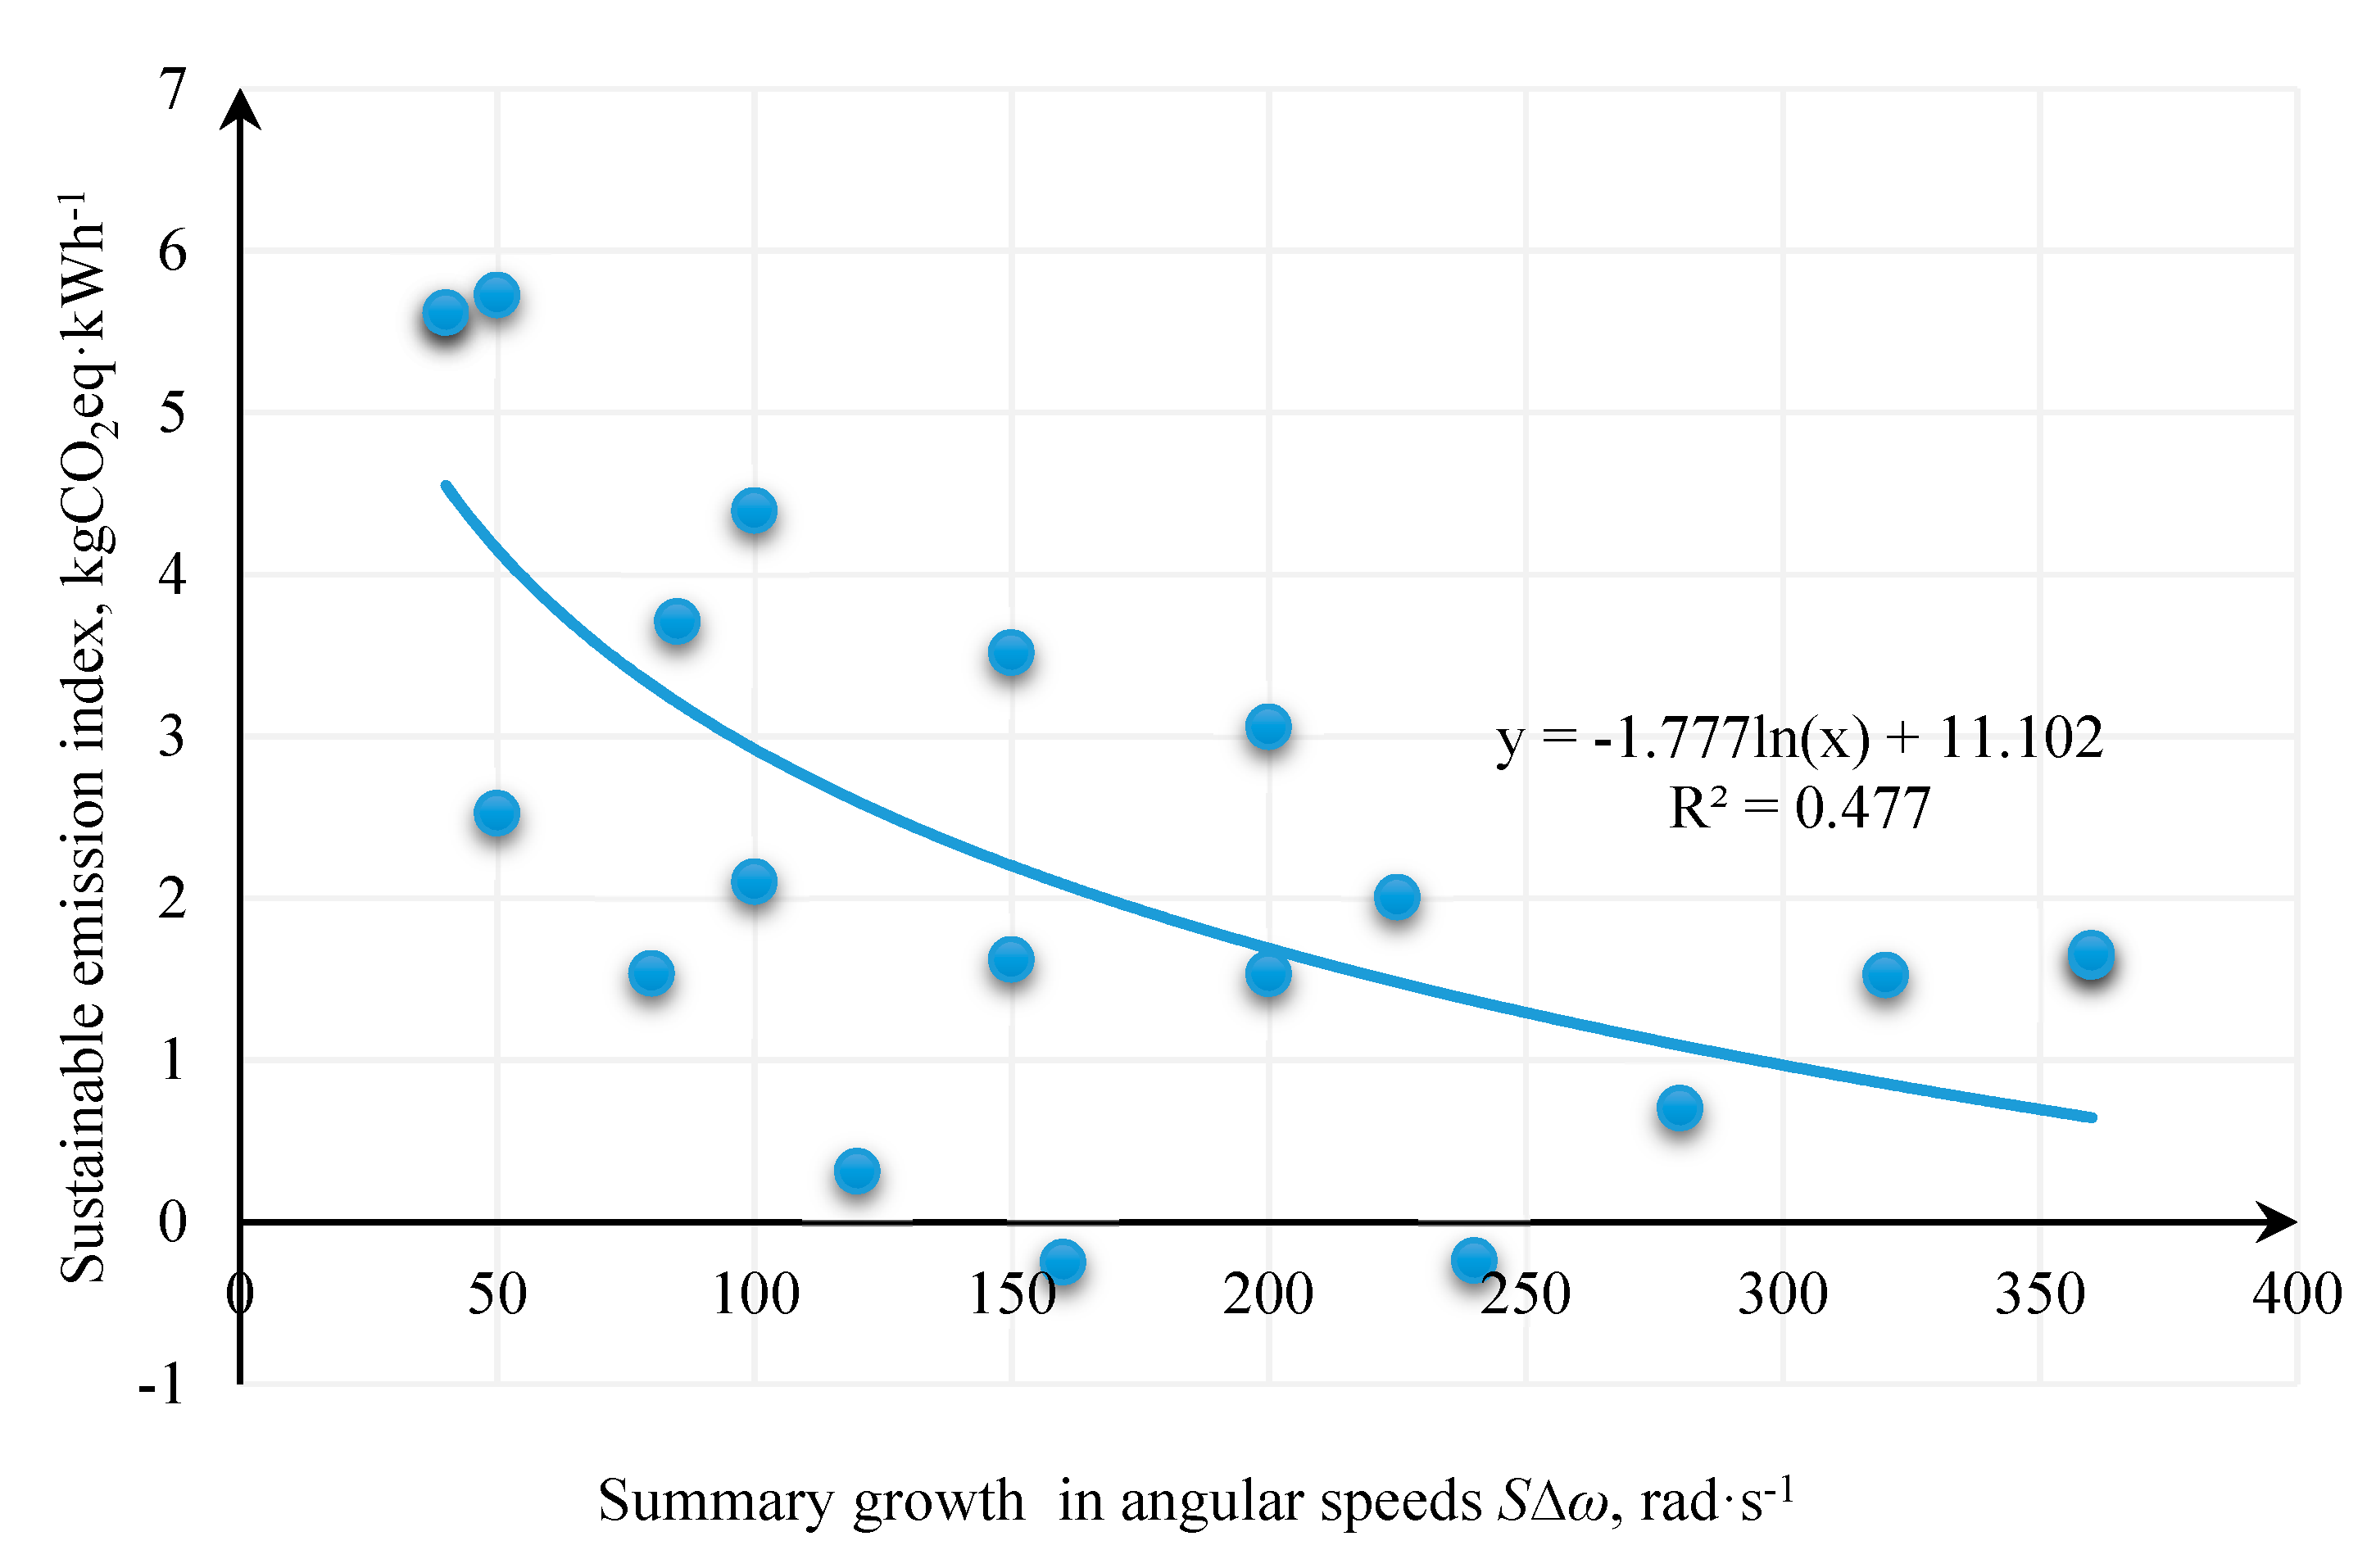
3.3. Analysis of the Relations between the Values of the Sustainable CO2 Emissions Index and the Angular Speed of the Working Elements of the Cutting Edges

To determine the relations between the values of the sustainable CO2 emissions index and the variable speeds of the working discs, a statistical analysis of the variables was carried out. Table 7 presents the most important statistics that describe the variables and the results of the sustainable CO2 emissions index. Based on the skewness and kurtosis values, it was found that the distribution of the values of variables and the results of the sustainable CO2 emissions index differs from the normal distribution. Therefore, Spearman’s coefficient was used in the correlation analysis to describe monotonic relations between the variables.
Correlation analysis using Spearman’s method revealed that the values of the sustainable CO2 emissions index are negatively correlated with speed increase SΔω (Table 8). For rice grinding, negative correlations between the sustainable CO2 emissions index and the first, third, and fifth disc angular speeds were found as well as the summary increase in angular speeds SΔω. The results show that along with an increase in the multi-disc grinder angular speeds the values of the sustainable CO2 emissions index decrease. This results, among others, from the dependence of power consumption and efficiency on angular speeds (of the rotating elements) as demonstrated in [25,47,76,77], which show that power consumption and efficiency increase along with an increase in grinder disc angular speeds, which, in the case of the sustainable CO2 emissions index, means a decrease in its value.
Multiple regression analysis was carried out for the analyzed variables of the rice grinding process using the backward stepwise method. A simple linear regression analysis was carried out for corn due to its correlation with Sω only. Table 9 shows the results of the regression analysis. The only model with significant coefficients for rice was a linear model of variable Sω, which demonstrated a 74.6% variability of the sustainable emissions index. With regard to corn grinding, the linear model of variable Sω explained merely 32.7% of the sustainable emissions index.
Bearing in mind that linear models account for less than 80% of the variability of the sustainable emissions, the adequacy of nonlinear models was checked. The non-linear model which best described the changes in the sustainable emissions index of rice grinding on a five-disc grinder depending on the total increase in angular velocity on the discs SΔω was an exponential model and its coefficient of determination was R2 = 0.889 (Figure 8). For corn grinding, the best model was a logarithmic one (Figure 9). The dependencies provided indicate that the sustainable emissions index of grinding decreases along with an increase in the grinder disc angular speed.
The dependencies presented in Figure 8 and Figure 9 can be used to determine the CO2 emissions level predicted for the analyzed five-disc grinder, for the other materials and for emissivity control of the grinding process—establishing optimal values for the settings of the grinding process parameters (angular velocities), providing a reduction in CO2 emissions from alternative fuels while decreasing energy use.
The sustainable CO2 emissions index, in accordance with Equation (9), depends on power consumption. The power consumption, in turn, depends on the speed of the angular discs (in this case, on the total speed increase) and the moments associated with this, as well as the moments and movement resistance from the grinding of the material. Since angular speeds and power consumption are interrelated, as is the case with the relationship between power consumption and the sustainable CO2 emissions index, the absence of a clear relationship between the summary velocity gain in the case of corn grinding (Figure 9) is due to its physico-mechanical properties and a different grinding process than in the case of rice, as described in Section 3.2.
The index presented in this paper can be designated for other types of materials besides grain and wood biomass. It can be used to compare the emissions parameters during the processing of materials for energy purposes and to indicate the parameters of the grinding process that will ensure the highest possible increase in environmental benefits in the form of a change in CO2 emissions per unit of grinding machine power. If other materials, e.g., lignocellulose biomass, are ground, it can be expected that the results would be different from those presented in this paper, which is of course related both to the different specificity of the grinding process itself and to the fact that the physico-mechanical properties of the cellulose materials differ significantly from those of grains used in this study.

4. Conclusions

The aim of the work—to develop a mathematical model of the sustainable CO2 emissions index for the carbon dioxide emissions assessment of the biomass grinding process—was achieved. The methodology for evaluating the emissivity of grinding made it possible to provide a measurable assessment of the process with a focus on energy consumption and emissivity. An analysis of the sustainable CO2 emissions index allows the authors to state that
  • the sustainable CO2 emissions index of rice and corn grinding on a five-disc mill, depending on the disc angular speed increase SΔω, can be described with high accuracy using a nonlinear model (Figure 8 and Figure 9);
  • it was observed that the sustainable CO2 emissions index decreases with an increase in the value of SΔω;
  • from the point of view of emissivity, it is better to grind at lower disc angular speeds;
  • higher values of the emissions index were obtained for rice, and from the point of view of emissivity, rice is better than corn in energy applications.
The values of the sustainable CO2 emissions index will vary depending on the source of energy fueling the grinding processes. The minimal value of the sustainable emissions index WZCO2(min) was −0.812 kgCO2eq·kWh−1 with the assumption that the electric energy used in the process of grinding was produced from coal (Figure 6 and Figure 7). In the case of electric energy produced from natural gas, it would be −0.201 kgCO2eq·kWh−1, from biogas: −0.196 kgCO2eq·kWh−1, from diesel oil: −0.276 kgCO2eq·kWh−1. The best emissions balance would occur if the electricity fueling the grinding process came from a biogas plant. Different index values would also occur if biomass energy use from non-combustion methods were considered.
The index presented in this paper can be designated for other types of materials besides grain and wood biomass. It can be used to compare the emissions parameters during the processing of materials for energy purposes and to indicate the parameters of the grinding process, which would ensure the highest possible increase in environmental benefits in the form of a change in CO2 emissions per unit of grinding machine power.
The model proposed in this study is dedicated strictly for industrial applications for real-time assessment of CO2 emissions. The model implemented in the monitoring end control system of biomass pretreatment processes can, in a short time (using the input of real-time data from industrial sensors, counters, and meters), calculate the balance of emissions. This offers the possibility of indicating the best process parameters, for example, disc speed, which makes it possible to reduce the emissions of carbon dioxide from fossil fuels. In general, the proposed model can be part of an industrial control system because it is easy to calculate its values, depending on real-time data from sensors.

Supplementary Materials

The following are available online at https://www.mdpi.com/1996-1073/13/2/330/s1, Table S1: Eco efficiency indexes of technology presented in the literature, Table S2: Environmental assessment indexes for grinding according to the literature.

Author Contributions

The work was prepared entirely by the author Weronika Kruszelnicka. All authors have read and agreed to the published version of the manuscript.

Funding

Scientific work was financed by the budget resource for science in 2017–2021 as a research project under the “Diamentowy Grant” program.

Conflicts of Interest

The author declare no conflict of interest. The funders had no role in the design of the study; in the collection, analyses, or interpretation of the data, in the writing of the manuscript, or in the decision to publish the results.

References

  1. Miao, Z.; Grift, T.E.; Hansen, A.C.; Ting, K.C. Energy requirement for comminution of biomass in relation to particle physical properties. Ind. Crop. Prod. 2011, 33, 504–513. [Google Scholar] [CrossRef]
  2. Tomporowski, A.; Flizikowski, J. Motion characteristics of a multi-disc grinder of biomass grain. Przem. Chem. 2013, 92, 498–503. [Google Scholar]
  3. Abo El-Khair, B.E.-S.; Manal, G.M.; Shimaa, R.H. Complementary production of biofuels by the green alga Chlorella vulgaris. Int. J. Renew. Energy Res. 2015, 5, 936–943. [Google Scholar]
  4. Adapa, P.K.; Tabil, L.G.; Schoenau, G.J. Factors affecting the quality of biomass pellet for biofuel and energy analysis of pelleting process. Int. J. Agric. Biol. Eng. 2013, 6, 1–12. [Google Scholar]
  5. Aguado, R.; Cuevas, M.; Pérez-Villarejo, L.; Martínez-Cartas, M.L.; Sánchez, S. Upgrading almond-tree pruning as a biofuel via wet torrefaction. Renew. Energy 2020, 145, 2091–2100. [Google Scholar] [CrossRef]
  6. Chandra, R.; Takeuchi, H.; Hasegawa, T. Methane production from lignocellulosic agricultural crop wastes: A review in context to second generation of biofuel production. Renew. Sustain. Energy Rev. 2012, 16, 1462–1476. [Google Scholar] [CrossRef]
  7. Che Kamarludin, S.N.; Jainal, M.S.; Azizan, A.; Safaai, N.S.M.; Daud, A.R.M. Mechanical pretreatment of lignocellulosic biomass for biofuel production. Appl. Mech. Mater. 2014, 625, 838–841. [Google Scholar] [CrossRef]
  8. Jiang, L.; Liang, J.; Yuan, X.; Li, H.; Li, C.; Xiao, Z.; Huang, H.; Wang, H.; Zeng, G. Co-pelletization of sewage sludge and biomass: The density and hardness of pellet. Bioresour. Technol. 2014, 166, 435–443. [Google Scholar] [CrossRef] [PubMed]
  9. Poudel, J.; Ohm, T.-I.; Lee, S.-H.; Oh, S.C. A study on torrefaction of sewage sludge to enhance solid fuel qualities. Waste Manag. 2015, 40, 112–118. [Google Scholar] [CrossRef]
  10. Ware, A.; Power, N. Biogas from cattle slaughterhouse waste: Energy recovery towards an energy self-sufficient industry in Ireland. Renew. Energy 2016, 97, 541–549. [Google Scholar] [CrossRef] [Green Version]
  11. Abelha, P.; Vilela, C.M.; Nanou, P.; Carbo, M.; Janssen, A.; Leiser, S. Combustion improvements of upgraded biomass by washing and torrefaction. Fuel 2019, 253, 1018–1033. [Google Scholar] [CrossRef]
  12. Basu, P. Chapter 11—Biomass Combustion and Cofiring. In Biomass Gasification, Pyrolysis and Torrefaction, 3rd ed.; Basu, P., Ed.; Academic Press: Cambridge, MA, USA, 2018; pp. 393–413. ISBN 978-0-12-812992-0. [Google Scholar]
  13. Eisenlauer, M.; Teipel, U. Comminution of biogenic materials. Can. J. Chem. Eng. 2017, 95, 1236–1244. [Google Scholar] [CrossRef]
  14. Hu, J.; Chen, Y.; Ni, D. Effect of superfine grinding on quality and antioxidant property of fine green tea powders. LWT Food Sci. Technol. 2012, 45, 8–12. [Google Scholar] [CrossRef]
  15. Salman, A.D.; Ghadiri, M.; Hounslow, M. Particle Breakage; Elsevier: Amsterdam, The Netherlands, 2007; ISBN 978-0-08-055346-7. [Google Scholar]
  16. Mannheim, V. Examination of Thermic Treatment and Biogas Processes by Lca. Ann. Fac. Eng. Hunedoara Int. J. Eng. 2014, 12, 225–234. [Google Scholar]
  17. Mannheim, V.; Siménfalvi, Z. Determining a Priority Order between Thermic Utilization Processes for Organic Industrial Waste with LCA.; WIT Press: Southampton, UK, 2012; pp. 153–166. [Google Scholar]
  18. Johnson, N.W. Review of Existing Eco-efficient Comminution Devices. Unpublished work. 2013. Available online: http://www.ceecthefuture.org/wp-content/uploads/2013/02/Bills-review-of-Eco-eff-devices.pdf (accessed on 5 November 2019).
  19. Kruszelnicka, W.; Flizikowski, J.; Tomporowski, A. Auto-monitoring system of grainy biomass comminution technology. IOP Conf. Ser. Mater. Sci. Eng. 2018, 393, 012076. [Google Scholar] [CrossRef]
  20. Wołosiewicz-Głąb, M.; Foszcz, D.; Saramak, D.; Gawenda, T.; Krawczykowski, D. Analysis of a grinding efficiency in the electromagnetic mill for variable process and feed parameters. In E3S Web of Conferences; EDP Sciences: Les Ulis, France, 2017; Volume 18, p. 01012. [Google Scholar]
  21. Jachimowski, R.; Szczepanski, E.; Klodawski, M.; Markowska, K.; Dabrowski, J. Selection of a Container Storage Strategy at the Rail-road Intermodal Terminal as a Function of Minimization of the Energy Expenditure of Transshipment Devices and CO2 Emissions. Rocz. Ochr. Sr. 2018, 20, 965–988. [Google Scholar]
  22. Tomporowski, A.; Flizikowski, J.; Kasner, R.; Kruszelnicka, W. Environmental Control of Wind Power Technology. Rocz. Ochr. Środowiska 2017, 19, 694–714. [Google Scholar]
  23. Kruszelnicka, W.; Tomporowski, A.; Flizikowski, J.; Kasner, R.; Cyganiuk, J. Basis of Biomass Grinders Sustainable Designing. Syst. Saf. Hum. Tech. Facil. Environ. 2019, 1, 542–549. [Google Scholar] [CrossRef] [Green Version]
  24. Marczuk, A.; Misztal, W.; Savinykh, P.; Turubanov, N.; Isupov, A.; Zyryanov, D. Improving Efficiency of Horizontal Ribbon Mixer by Optimizing Its Constructional and Operational Parameters. Eksploat. Niezawodn. 2019, 21, 220–225. [Google Scholar] [CrossRef]
  25. Tomporowski, A.; Flizikowski, J.; Kruszelnicka, W. A new concept of roller-plate mills. Przem. Chem. 2017, 96, 1750–1755. [Google Scholar]
  26. Szymańska, E. Efektywność przedsiębiorstwa-definiowanie i pomiar. Rocz. Nauk Rol. 2010, 97, 152–164. [Google Scholar]
  27. Kleiber, M.; Czaplicka-Kolarz, K. Ekoefektywność Technologii: Praca Zbiorowa; Wydawnictwo Naukowe Instytutu Technologii Eksploatacji—Państwowego Instytutu Badawczego: Radom, Poland, 2011; ISBN 978-83-7789-050-9.
  28. Aoe, T. Eco-efficiency and ecodesign in electrical and electronic products. J. Clean. Prod. 2007, 15, 1406–1414. [Google Scholar] [CrossRef]
  29. Huppes, G.; Ishikawa, M. Eco-efficiency and Its xsTerminology. J. Ind. Ecol. 2005, 9, 43–46. [Google Scholar] [CrossRef]
  30. Schneider, L.; Finkbeiner, M. Life Cycle Assessment of EU Oilseed Crushing and Vegetable Oil Refining; Technische Universitat Berlin: Berlin, Germany, 2013; p. 59. [Google Scholar]
  31. Homagain, K.; Shahi, C.; Luckai, N.; Sharma, M. Life cycle cost and economic assessment of biochar-based bioenergy production and biochar land application in Northwestern Ontario, Canada. For. Ecosyst. 2016, 3, 21. [Google Scholar] [CrossRef] [Green Version]
  32. Fontes, J. Handbook for Product Social Impact Assessment; PRe Sustainability: Amersfoort, The Netherlands, 2016. [Google Scholar]
  33. Pierobon, F.; Eastin, I.L.; Ganguly, I. Life cycle assessment of residual lignocellulosic biomass-based jet fuel with activated carbon and lignosulfonate as co-products. Biotechnol. Biofuels 2018, 11, 139. [Google Scholar] [CrossRef] [Green Version]
  34. Liu, W.; Wang, J.; Richard, T.L.; Hartley, D.S.; Spatari, S.; Volk, T.A. Economic and life cycle assessments of biomass utilization for bioenergy products. Biofuels Bioprod. Biorefining 2017, 11, 633–647. [Google Scholar] [CrossRef]
  35. Johnson, L.; Lippke, B.; Oneil, E. Modeling biomass collection and woods processing life-cycle analysis. Prod. J. 2012, 62, 258–272. [Google Scholar] [CrossRef]
  36. Fantozzi, F.; Buratti, C. Life cycle assessment of biomass chains: Wood pellet from short rotation coppice using data measured on a real plant. Biomass Bioenergy 2010, 34, 1796–1804. [Google Scholar] [CrossRef] [Green Version]
  37. Brunner, P.H.; Rechberger, H. Practical Handbook of Material Flow Analysis. In Advanced Methods in Resource and Waste Management; CRC/Lewis: Boca Raton, FL, USA, 2004; ISBN 978-1-56670-604-9. [Google Scholar]
  38. Liedtke, C.; Bienge, K.; Wiesen, K.; Teubler, J.; Greiff, K.; Lettenmeier, M.; Rohn, H. Resource Use in the Production and Consumption System—The MIPS Approach. Resources 2014, 3, 544–574. [Google Scholar] [CrossRef] [Green Version]
  39. Ściążko, M.; Czaplicka-Kolarz, K. Model Ekologicznego i Ekonomicznego Prognozowania Wydobycia i Użytkowania Czystego Węgla. T. 2, Ekoefektywność Technologii Czystego Spalania Węgla; Główny Instytu Górnictwa: Katowice, Poland, 2004. [Google Scholar]
  40. Tahara, K.; Sagisaka, M.; Ozawa, T.; Yamaguchi, K.; Inaba, A. Comparison of “CO2 efficiency” between company and industry. J. Clean. Prod. 2005, 13, 1301–1308. [Google Scholar] [CrossRef]
  41. Bennett, M.; James, P.; Klinkers, L. Sustainable Measures—Evaluation and Reporting of Environmental and Social Performance; Greenleaf Publishing Ltd.: Sheffield, UK, 1999. [Google Scholar]
  42. Kasner, R. Ocena Korzyści i Nakładów Cyklu Życia Elektrowni Wiatrowej; Politechnika Poznańska: Poznań, Poland, 2016; p. 186. [Google Scholar]
  43. Tomporowski, A.; Flizikowski, J.; Opielak, M.; Kasner, R.; Kruszelnicka, W. Assessment of Energy Use and Elimination of Co2 Emissions in the Life Cycle of an Offshore Wind Power Plant Farm. Pol. Marit. Res. 2017, 24, 93–101. [Google Scholar] [CrossRef] [Green Version]
  44. Burchart-Korol, D.; Kruczek, M.; Czaplicka-Kolarz, K. Wykorzystanie ekoefektywności w ocenie poziomu ekoinnowacyjności. In Innowacje w Zarządzaniu i Inżynierii Produkcji; Oficyna Wydawnicza Polskiego Towarzystwa Zarządzania Produkcją: Opole, Poland, 2013. [Google Scholar]
  45. Flizikowski, J.; Wełnowski, J.; Dudziak, P. Analysis end eco-technological evaluation of micro-grain supersonic milling. Part I. Models and indicators. Inżynieria I Apar. Chem. 2017, 56, 161–163. [Google Scholar]
  46. Mroziński, A.; Flizikowski, J.; Macko, M. Inżynieria Rozdrabniania Biomasy; Grafpol: Wrocław, Poland, 2016; ISBN 978-83-64423-35-2. [Google Scholar]
  47. Kruszelnicka, W. Analiza Procesu Wielotarczowego Rozdrabniania Biomasy w Ujęciu Energochlonności i Emisji CO2. Ph.D. Thesis, Uniwersytet Technologiczno-Przyrodniczy im. Jana i Jędrzeja Śniadeckich w Bydgoszczy, Bydgoszcz, Poland, 2019. [Google Scholar]
  48. Kruszelnicka, W.; Bałdowska-Witos, P.; Flizikowski, J.; Tomporowski, A.; Kasner, R. Energy balance of wood biomass utilization. Part I—Characteristics of the problem and research methodology. TEKA Kom. Mot. Energ. Roln 2017, 17, 55–60. [Google Scholar]
  49. Kruszelnicka, W.; Bałdowska-Witos, P.; Kasner, R.; Flizikowski, J.; Tomporowski, A.; Rudnicki, J. Evaluation of emissivity and environmental safety of biomass grinders drive. Przem. Chem. 2019, 98, 1494–1498. [Google Scholar]
  50. Fuerstenau, D.W.; Abouzeid, A.-Z.M. The energy efficiency of ball milling in comminution. Int. J. Miner. Process. 2002, 67, 161–185. [Google Scholar] [CrossRef]
  51. Kawatra, S.K. Advances in Comminution; Society for Mining, Metallurgy, and Exploration: Littleton, CO, USA, 2006; ISBN 978-0-87335-246-8. [Google Scholar]
  52. Tomporowski, A.; Flizikowski, J.; Wełnowski, J.; Najzarek, Z.; Topoliński, T.; Kruszelnicka, W.; Piasecka, I.; Śmigiel, S. Regeneration of rubber waste using an intelligent grinding system. Przem. Chem. 2018, 97, 1659–1665. [Google Scholar]
  53. Naimi, L.J.; Sokhansanj, S.; Bi, X.; Lim, C.J.; Womac, A.R.; Lau, A.K.; Melin, S. Development of Size Reduction Equations for Calculating Energy Input for Grinding Lignocellulosic Particles. Appl. Eng. Agric. 2013, 29, 93–100. [Google Scholar] [CrossRef]
  54. Kruszelnicka, W. New model for ecological assessment of comminution process in energy biomass processing chain. In Proceedings of the Renewable Energy Sources-Engineering, Technology, Innovation, Krynica, Poland, 12–14 June 2019. [Google Scholar]
  55. Kruszelnicka, W. Study of Physical Properties of Rice and Corn Used for Energy Purposes. In Renewable Energy Sources: Engineering, Technology, Innovation; Wróbel, M., Jewiarz, M., Szlęk, A., Eds.; Springer International Publishing: Manhattan, NY, USA, 2020; pp. 149–162. [Google Scholar]
  56. Szyszlak-Barglowicz, J.; Zajac, G.; Slowik, T. Research on Emissions from Combustion of Pellets in Agro Biomass Low Power Boiler. Rocz. Ochr. Sr. 2017, 19, 715–730. [Google Scholar]
  57. Kowalczyk-Juśko, A. Redukcja emisji zanieczyszczeń dzięki zastąpieniu węgla biomasą spartiny preriowej. Probl. Inżynierii Rol. 2010, 18, 69–77. [Google Scholar]
  58. Kruszelnicka, W.; Bałdowska-Witos, P.; Flizikowski, J.; Tomporowski, A. Investigation of grain biomass properties as an alternative fuel. Int. Sci. J. Trans Motauto World 2018, 3, 45–48. [Google Scholar]
  59. Dańko, R.; Szymała, K.; Holtzer, M.; Holtzer, G. Skojarzone wytwarzanie energii elektrycznej i ciepła w systemie kogeneracji. Arch. Foundry Eng. 2012, 12, 6. [Google Scholar]
  60. Buffington, D.E. Burning Shalled Corn—A Renewable Fuel Source. Agric. Biol. Eng. 2005, H, 78. [Google Scholar]
  61. Lizotte, P.-L.; Savoie, P.; De Champlain, A. Ash Content and Calorific Energy of Corn Stover Components in Eastern Canada. Energies 2015, 8, 4827–4838. [Google Scholar] [CrossRef] [Green Version]
  62. Pode, R. Potential applications of rice husk ash waste from rice husk biomass power plant. Renew. Sustain. Energy Rev. 2016, 53, 1468–1485. [Google Scholar] [CrossRef]
  63. Moe, P.W.; Tyell, H.F.; Hooven, N.W. Physical Form and Energy Value of Corn Grain. J. Dairy Sci. 1973, 56, 1298–1304. [Google Scholar] [CrossRef]
  64. Panzeri, D.; Cesari, V.; Toschi, I.; Pilu, R. Seed Calorific Value in Different Maize Genotypes. Energy Sour. Part A Recovery Util. Environ. Eff. 2011, 33, 1700–1705. [Google Scholar] [CrossRef]
  65. Shen, J.; Zhu, S.; Liu, X.; Zhang, H.; Tan, J. Measurement of Heating Value of Rice Husk by Using Oxygen Bomb Calorimeter with Benzoic Acid as Combustion Adjuvant. Energy Procedia 2012, 17, 208–213. [Google Scholar] [CrossRef] [Green Version]
  66. Determination of Moisture Content. Available online: http://www.ico.org/projects/Good-Hygiene-Practices/cnt/cnt_sp/sec_3/docs_3.2/Determine%20m%20c.pdf (accessed on 21 October 2019).
  67. International Organization for Standardization. Green Coffee—Determination of Water Content—Basic Reference Method; International Organization for Standardization: Geneva, Switzerland, 2001; ISO 1446:2001. [Google Scholar]
  68. International Organization for Standardization. Particle Size Analysis—Image Analysis Methods—Part 2: Dynamic Image Analysis Methods; International Organization for Standardization: Geneva, Switzerland, 2006; ISO 13322-2:2006. [Google Scholar]
  69. International Organization for Standardization. DIN DIN 66 165-1 and 2: Sieve Analysis, Fundamentals (1) and Procedure (2); International Organization for Standardization: Geneva, Switzerland, 2016. [Google Scholar]
  70. CO2 Emission Factors [Wskaźniki Emisji CO2]. Available online: https://prawomiejscowe.pl/api/file/GetZipxAttachment/155/1147170/preview (accessed on 22 October 2019).
  71. Tumuluru, J.S.; Tabil, L.G.; Song, Y.; Iroba, K.L.; Meda, V. Grinding energy and physical properties of chopped and hammer-milled barley, wheat, oat, and canola straws. Biomass Bioenergy 2014, 60, 58–67. [Google Scholar] [CrossRef]
  72. Warechowska, M. Some physical properties of cereal grain and energy consumption of grinding. Agric. Eng. 2014, 1, 239–249. [Google Scholar]
  73. Greffeuille, V.; Mabille, F.; Rousset, M.; Oury, F.-X.; Abecassis, J.; Lullien-Pellerin, V. Mechanical properties of outer layers from near-isogenic lines of common wheat differing in hardness. J. Cereal Sci. 2007, 45, 227–235. [Google Scholar] [CrossRef]
  74. Greffeuille, V.; Abecassis, J.; Barouh, N.; Villeneuve, P.; Mabille, F.; Bar L’Helgouac’h, C.; Lullien-Pellerin, V. Analysis of the milling reduction of bread wheat farina: Physical and biochemical characterisation. J. Cereal Sci. 2007, 45, 97–105. [Google Scholar] [CrossRef]
  75. Rogowska, D.; Lubowicz, J. Analiza możliwości obniżenia emisji gazów cieplarnianych w cyklu życia bioetanolu paliwowego. Naft. Gaz 2012, 68, 1044–1049. [Google Scholar]
  76. Smejtkova, A.; Vaculik, P. Comparison of power consumption of a two-roll mill and a disc mill. Agron. Res. 2018, 16, 1486–1492. [Google Scholar]
  77. Boehm, A.; Meissner, P.; Plochberger, T. An energy based comparison of vertical roller mills and tumbling mills. Int. J. Miner. Process. 2015, 136, 37–41. [Google Scholar] [CrossRef]
Figure 1. Graphic interpretation of the sustainable CO2 emissions index.
Energies 13 00330 g001
Figure 2. Test stand for monitoring the process of multi-disc grinding, 1—five-disc mill, 2—slide feeder, 3—hopper, 4—control panel, 5—product reception basket, 6—scales for the product, 7—chamber for measuring the size of the product after grinding.
Energies 13 00330 g002
Figure 3. Total power input of a five-disc grinder for the analyzed angular speed settings of working discs.
Energies 13 00330 g003
Figure 4. Grinding efficiency for the analyzed settings of the disc angular speeds.
Energies 13 00330 g004
Figure 5. Results of the sustainable CO2 emissions index for each disc speed configuration.
Energies 13 00330 g005
Figure 6. Sustainable CO2 emissions index for rice grinding on a multi-disc grinder in a function of power input.
Energies 13 00330 g006
Figure 7. Sustainable CO2 emissions index for corn grinding on a multi-disc grinder in a function of power consumption.
Energies 13 00330 g007
Figure 8. Sustainable CO2 emissions index for rice grinding in a function of summary speed increase Sω.
Energies 13 00330 g008
Figure 9. Sustainable CO2 emissions index for corn grinding in a function of summary speed increase Sω.
Energies 13 00330 g009
Table 1. Structural characteristics of a five-disc grinder working discs RWT-KZ5.
ParameterDisc 1Disc 2Disc 3Disc 4Disc 5
Disc diameter Dn (mm)274274274274274
Number of holes ln (psc.)1422273339
Diameter of holes dn (mm)30232117.517.5
Radius of hole arrangement in a row 1 (mm)8582.479.579.582
Radius of hole arrangement in a row 2 (mm)101.5107.495.599.5102
Radius of hole arrangement in a row 3 (mm)--110.5114.5117
Table 2. Settings of the five-disc mill control parameters.
Test ProgramConfiguration No.Sωωω1ω2ω3ω4ω5
rad·s−1rad·s−1rad·s−1rad·s−1rad·s−1rad·s−1rad·s−1
I15052025303540
2100102030405060
3150152035506580
42002020406080100
II12002010080604020
2150158065503520
3100106050403020
45054035302520
III140202040204020
285204525452545
3225257550755075
4360201008010080100
IV140202040204020
280402060206020
3120602080208020
416080201002010020
V1240801002010020100
2280601004010040100
3320401006010060100
4360201008010080100
Table 3. Dimensions of rice and corn fractions used for pellets.
Fraction Dimension (µm)
Rice0–630630–12501250–2000>2000
Corn0–500500–12501250–2000>2000
Table 4. Granulometric content of biomaterial after grinding for the analyzed disc angular speed settings.
Fraction Percentage Share (%)
Config.RiceCorn
0–630 μm630–1250 μm1250–2000 μm>2000 μm0–500 μm500–1250 μm1250–2000 μm>2000 μm
I19.429.356.44.92.432.242.323.1
23.413.867.815.02.938.240.118.8
36.921.062.49.73.047.538.311.2
45.818.463.512.32.944.739.413.0
II15.818.463.512.31.826.942.029.3
22.912.766.617.82.230.941.025.9
32.310.166.820.82.030.837.030.2
40.96.467.125.62.432.236.329.1
III11.79.066.422.91.927.935.834.4
22.811.765.719.82.131.137.829.0
38.922.560.38.32.031.342.324.4
413.335.048.73.02.339.244.414.1
IV11.79.066.422.91.927.935.834.4
22.413.767.716.22.433.238.026.4
36.323.462.18.22.436.248.714.7
48.428.158.15.42.233.048.116.7
V17.027.360.55.21.938.142.517.5
29.427.258.25.22.144.142.711.1
312.430.853.73.12.242.244.411.2
413.335.048.73.02.233.048.116.7
Table 5. Unit index JACO2i of CO2 emissions of the i-th fraction.
RiceCorn
Fraction Dimension (μm)Unit Emissions Index (kg·kWh−1)Fraction Dimension (μm)Unit Emissions Index (kg·kWh−1)
0–6300.04530–5000.04859
630–12500.035660–12500.05432
1250–20000.07451250–20000.059701
>20000.11428>20000.068181
Table 6. Calorific values of selected fractions of rice and corn calculated based on [55].
RiceCorn
Fraction Dimension (μm)Calorific Value (kWh·kg−1)Fraction Dimension (μm)Calorific Value (kWh·kg−1)
0–6303.970–5003.91
630–12503.9360–12504.05
1250–20003.891250–20004.02
>20003.85>20003.96
Table 7. Results of the basic statistical analysis for the sustainable CO2 emissions index distribution.
RpMSKV x ¯ sMin.Max.
WZCO2Corn5.961.830.54−0.5376.312.421.84−0.245.72
Rice8.514.140.8−0.0850.734.822.451.9310.44
Sω3202600.6−0.7263.11165.5104.4440360
ω180200.32−1.8266.5454.0035.9320100
ω280400.54−0.7244.0351.7522.7820100
ω380250.51−1.2657.8354.0031.2320100
ω480400.54−0.7244.0351.7522.7820100
ω580200.32−1.8266.5454.0035.9320100
x ¯ —mean value, s—standard deviation, M—median, Max—maximal value, Min—minima value, Rp—range, V—variability coefficient, S—skewness, K—kurtosis.
Table 8. Analysis of sustainable CO2 emissions index correlation with independent variables.
ω1ω2ω3ω4ω5SΔω
CornRho Spearman’s−0.107−0.258−0.307−0.557−0.480−0.617 *
p-value0.6530.2720.1880.0110.0320.004
RiceRho Spearman’s−0.609 *−0.232−0.855 *−0.434−0.853 *−0.946 *
p-value0.0040.3250.0000.0560.0000.000
* Significant correlations: Rho Spearman’s >0.6, p-value <0.05; ω1, ω2, ω3, ω4, ω5—disc angular speeds, rad·s−1, SΔω—summary increase in angular speeds, rad·s−1.
Table 9. Results of regression analysis for the sustainable CO2 emissions index.
Coefficientst-stat.p-Value *FSignificanceR2
CornConstant4.096.168.08 × 10−68.750.0080.3271
SΔω−0.01−2.960.008
RiceConstant8.1715.131.11 × 10−1153.009.13 × 10−70.7464
SΔω−0.02−7.289.13 × 10−7
SΔω—summary angular speed increase, * results p > 0.5 were accepted as significant.

