Article

Numerical and Experimental Study on Convective Heat Transfer Characteristics in Foam Materials

1
School of Mechanical, Electronic and Control Engineering, Beijing Jiaotong University, Beijing 100044, China
2
Beijing Key Laboratory of Flow and Heat Transfer of Phase Changing in Micro and Small Scale, Beijing 100044, China
3
The Key Laboratory of Solar Thermal Energy and Photovoltaic System, IEE-CAS, Beijing 100190, China
*
Authors to whom correspondence should be addressed.
Energies 2020, 13(2), 348; https://doi.org/10.3390/en13020348
Submission received: 29 November 2019 / Revised: 22 December 2019 / Accepted: 8 January 2020 / Published: 10 January 2020

Abstract

:
Foam materials are widely used in heat exchange because of their high porosity and large specific surface area. Correctly characterizing heat transfer characteristics is the key to ensuring efficient heat transfer. In this paper, single-blow transient test technology is used to experimentally measure the temperature. Silicon carbide ceramics with various thicknesses ranging from 30 to 105 mm and different pore structures were used in the experiments. The test was carried out at the velocity ranging from 0.5 to 1.8 m/s. The air temperature distributions of the inlet and outlet were obtained by processing the experimental data, and the regularity of the average volumetric heat transfer coefficient was obtained and analyzed. Subsequently, the simplified tetrakaidecahedron models with a porosity of 0.85 and 0.75 were used to analyze the heat transfer characteristics. The local thermal equilibrium and local thermal non-equilibrium at the pore scale were analyzed. By comparing the simulation with the experiment, it shows that the larger thickness affects local thermal equilibrium and leads to a decrease in the volumetric heat transfer coefficient. The conclusion can be used to guide the optimization of the design of foam material-mediated heat exchange equipment.

Graphical Abstract

1. Introduction

Foam material is a type of porous, lightweight, high-strength, low-density media [1], which has high heat transfer characteristics and strong flow mixing characteristics due to its inherent properties such as high porosity, large specific surface area, disordered pore distribution, tortuous flow path [2]. Hence, foam materials are widely used in various heat exchange fields, including heat exchangers [3], heat sinks [4,5,6], electronic cooling [7], cooling towers [8], volumetric absorbers [9,10,11], catalytic reactors [12,13], etc.
The purpose of devising maximum effective heat transfer efficiency and using smaller and lighter material is well recognized when using foam material as the heat exchange medium for products [14]. Due to the specific structure of the foam material, the magnitude of the volumetric heat transfer coefficient is as high as 104 to 106 W/(m3·K), and the convective heat transfer of the fluid-solid phase contributes greatly to the overall heat transfer. Therefore, it is appropriate to use the convective volumetric heat transfer coefficient to characterize and evaluate the heat transfer performance [15].
Experimental research and numerical simulation are common methods for solving this coefficient. For experiment, researchers typically measure wall and internal temperature and the temperatures at the inlet and outlet of the foam [16,17,18], where the measurement of internal temperature of fluid-solid is usually achieved by drilling, which will destroy the characteristics of the flow field. However, none of these methods directly yields heat transfer details in the fluid-solid interface. For this reason, based on the experimental data, the numerical inversion method has been used to obtain the volumetric heat transfer coefficient [19]. Based on this principle, the steady-state method in which a heat source is fixed to a wall-heated foam material and the single-blow method in which a fluid heated or cooled foam material are proposed [20,21]. Under the experimental conditions, the steady-state method has a temperature gradient in the channel, and the volumetric heat transfer coefficient mostly depends on the thermal conductivity of the solid phase. For the single-blow method, the temperature of the channel section can be ensured to be uniform by processing the experimental test section, and it becomes a mainstream scheme [22,23]. In this method, the volumetric heat transfer coefficient correlations are determined on foam materials with different geometric structures, such as those described by Dietrich [18] and Xia [19].
From such measurements, the determined coefficients represent the average effect of convective heat transfer, while the heat transfer regularities of the internal details need to be simulated in the pore scale. Therefore, numerical simulations are analyzed by using the “true” microstructure obtained by XCT (micro computed tomography) and the simplified ideal geometry [24,25,26,27]. For instance, Zafari [26] simulated scanned structure to analyze internal heat transfer details and obtained the Nusselt number. Wu [27] used the simplified tetrakaidecahedron to obtain the correlation of the local volumetric heat transfer coefficient.
Although a large number of correlations relate to porosity, pore size, and velocity are obtained through experiments and numerical simulations [20,28,29,30,31,32]. The phenomenon of local thermal equilibrium (LTE) easily occurs inside the foam due to the complex structure and the high volumetric heat transfer coefficient. At this time, the temperature of the fluid-solid phase is equal, which means that the local convective heat transfer is equal to zero. Comparing the foams that have been in local thermal non-equilibrium (LTNE), the appearance of LTE weakens the ability to enhance heat transfer, and the heat transfer efficiency will be overestimated if the current correlation use continues. In addition, from the perspective of heat transfer, the LTE phenomenon in the foam is more obvious when the thickness is larger, so the thickness should be considered as a key factor. In fact, most studies are based on the specific thickness. The LTE phenomenon has been ignored when the thickness is larger and limits the scope of the application of the existing correlation.
In this paper, experiments on foam ceramics with different geometric structures are carried out based on the principle of the single-blow method. The influence of thickness on LTE and average volumetric heat transfer coefficient are discussed. Further, the experimental data show that the average volumetric heat transfer coefficient decreases with increasing thickness. Apart from this, to better understand the characteristics of foam and remedy the limitations of the experimental method, the simplified tetrakaidecahedron geometries are used to analyze the effect of pore structure and thickness on heat transfer. Moreover, the results show that the phenomenon of LTE and LTNE change along the thickness direction.

2. Experiment and Analysis

2.1. Experimental System

The experiment system is depicted in Figure 1. By arranging two sets of AB valves and two fans, the experimental system was designed to be regulated by hot air and cold air control system and to form the main measurement loop and a balanced differential pressure bypass. Foam ceramic samples (thickness varying from 30 to 105 mm, PPI from 30 to 60, and porosity from 0.75 to 0.85) placed on the test section were tested with a different velocity varying from 0.5 to 1.8 m/s. At first, under the hot air control, a hot fan transported air with a constant flow rate through heater 1 to heat the foam material and construct a stable initial environment (range from 323 to 324 K). Then, by switching valves A to B to implement a transient heat transfer test, a cold fan transported air with a constant flow rate through the thermostatic cold bath and the heater 2 to provide a sudden temperature change (range from 285 to 286 K) for the foam ceramics. The transient air temperatures at the inlet (i) and outlet (ii) were recorded by the data acquisition system. The inversion method was adopted to determine the volumetric heat transfer coefficient. More details about the experiment, such as the layout and model of the test instrument, data reduction, foam parameters, experimental uncertainty, etc., are described in detail in another experimental article that has been submitted.

2.2. Experimental Results

The experimental measurement was carried out by varying the velocity from 0.5 to 1.8 m/s, and the specimens with various thicknesses ranging from 30 to 105 mm, different PPI from 30 to 60. Different porosities ranging from 0.75 to 0.85 were investigated for subsequent analysis of the results.

2.2.1. The Temperature Change in Foams

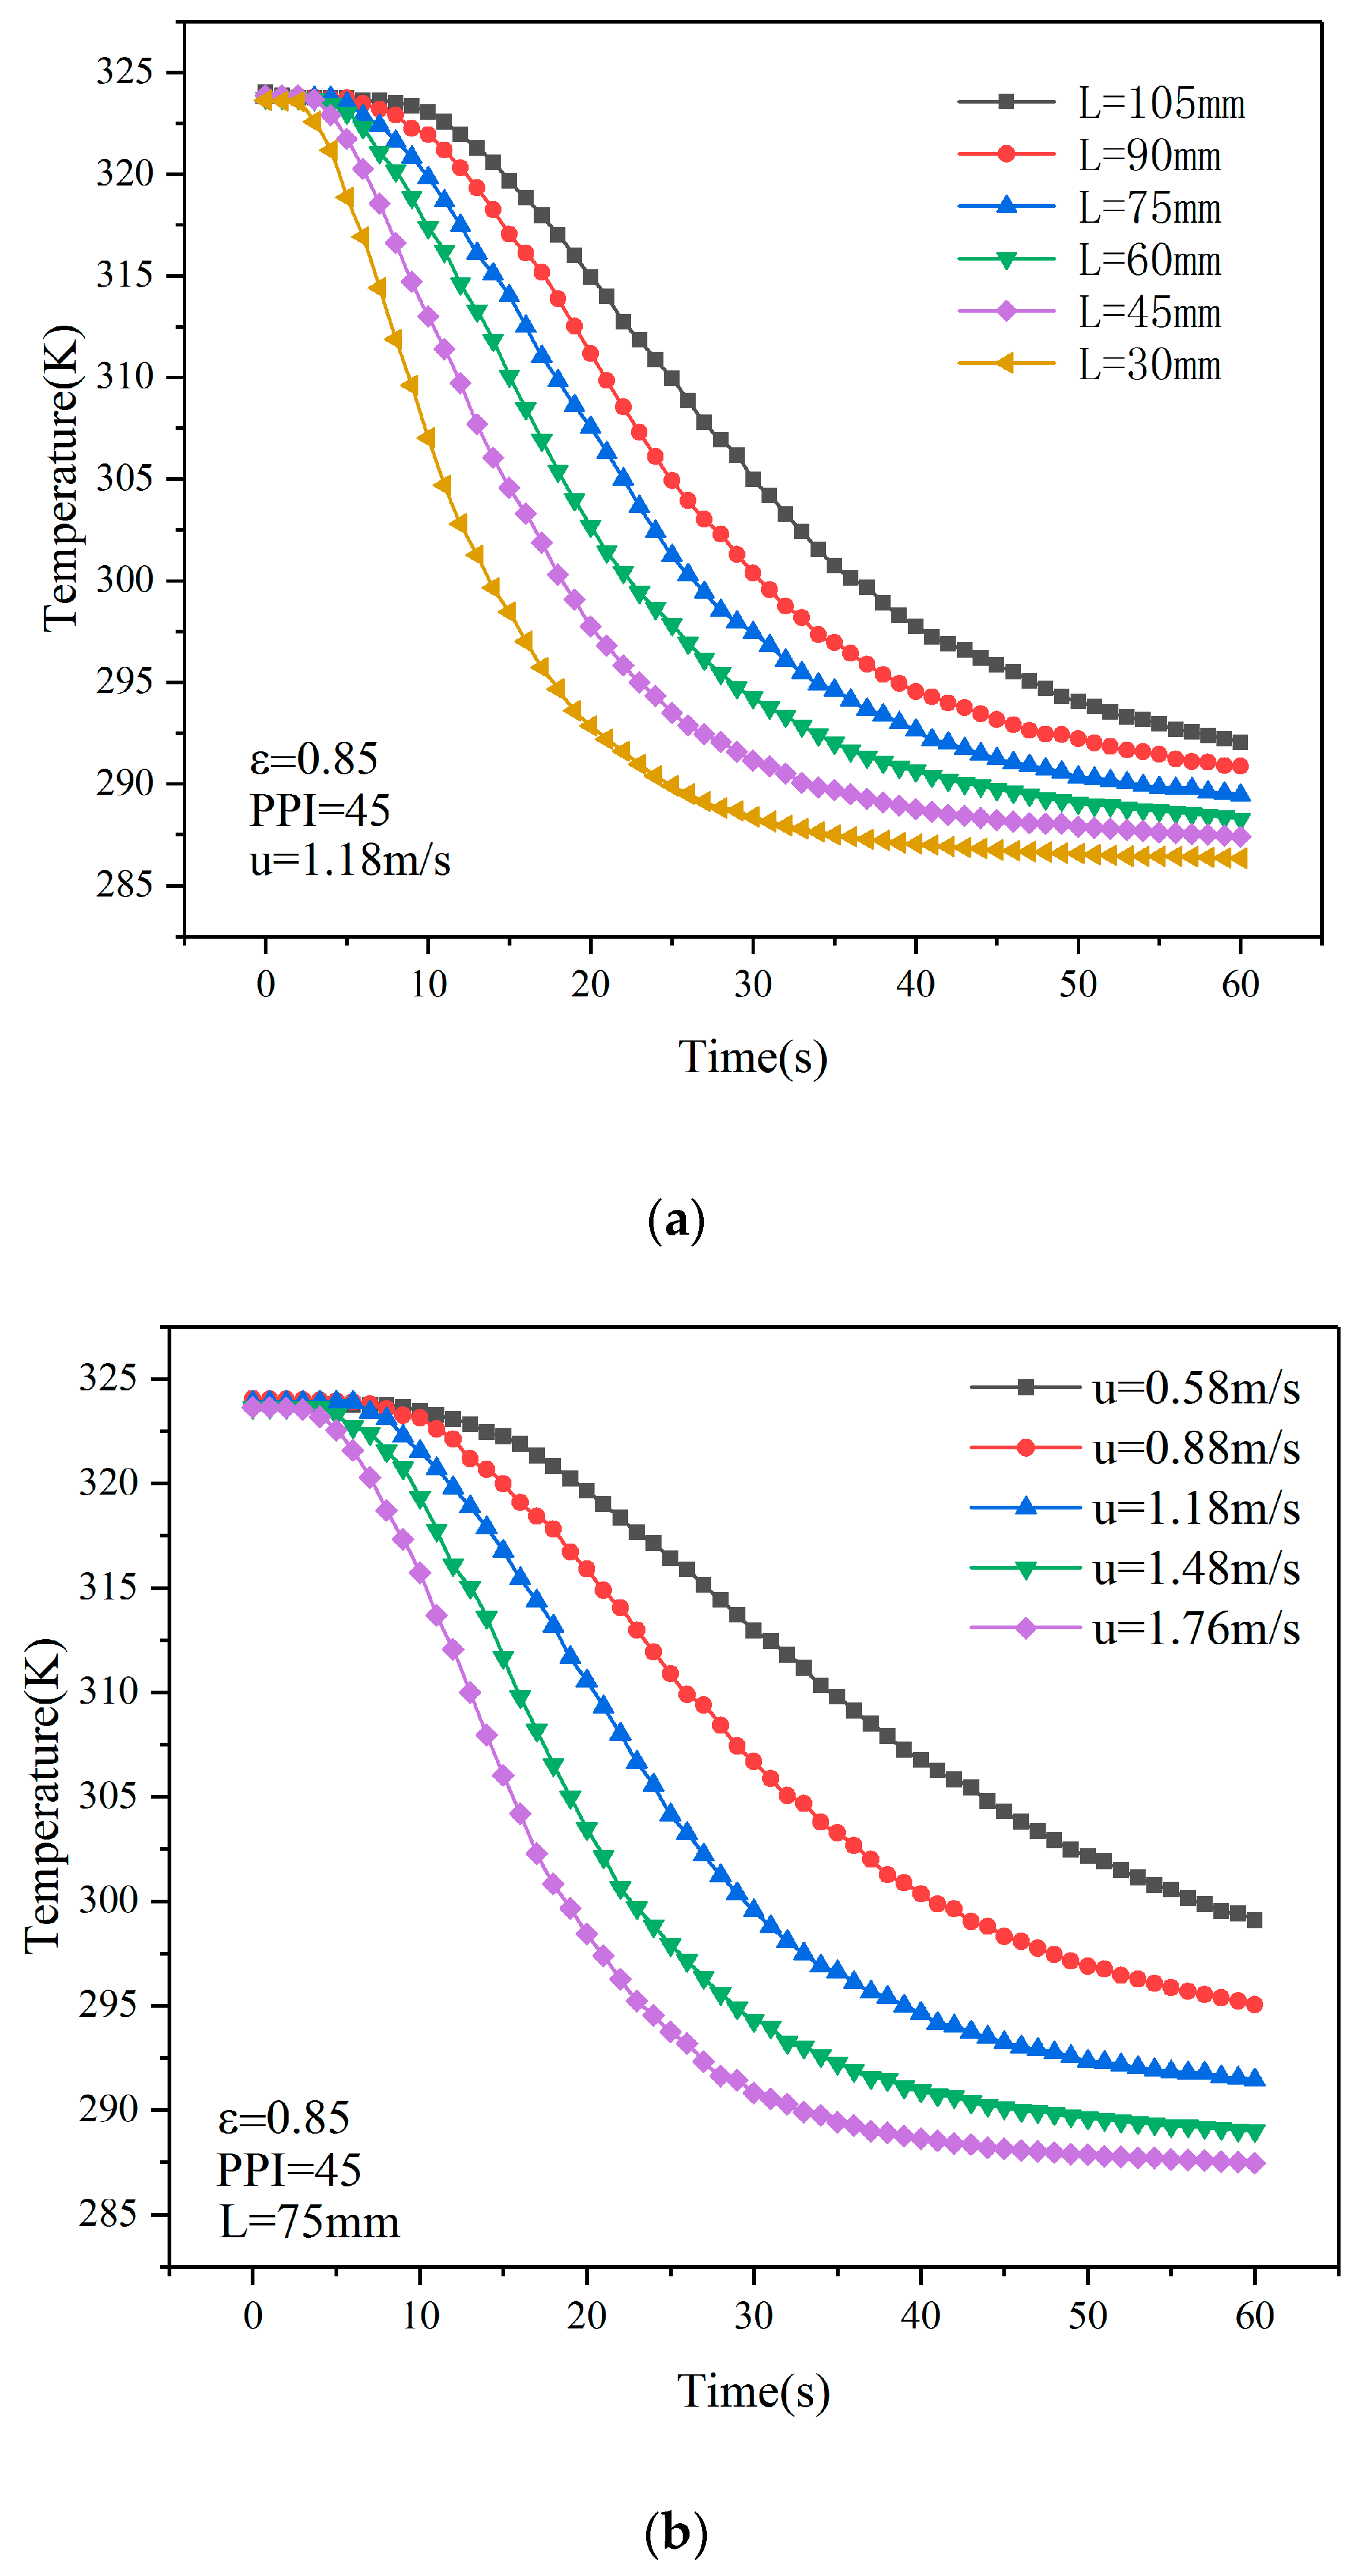
The curve of the outlet air temperature change in foams under different parameters is shown in Figure 2. As it clearly appears, during the first ten seconds, the outlet air temperature of the sample is approximately equal to the initial temperature. It is considered that the LTE occurs inside the foam ceramic within a short period of time, and for the condition of larger thickness or lower flow velocity, the LTE phenomenon will last longer.
From the point of view of heat exchange, the thickness reflects the number of solid skeletons, which determines the total amount of convective heat transfer. The flow velocity determines the heat carried by air. During a certain period of time, when the heat carried by air is less than the total amount of convective heat transfer, the LTE phenomenon will appear in the foam ceramic. Therefore, under the same conditions, the larger the thickness, the easier the LTE occurs.

2.2.2. The Volumetric Heat Transfer Coefficient in Foams

The volumetric heat transfer coefficients are estimated by the inversion method, the details of the change are shown in Figure 3.
It is clearly found that the change of the volumetric heat transfer coefficients has obvious regularity in the research conditions and thickness range of this paper, which shows that the volumetric heat transfer coefficient increases with the increase of flow velocity and decreases with the increase of thickness. Among them, the volumetric heat transfer coefficient with a thickness of 30 mm is approximately three times that of a thickness of 105 mm. In the existing studies, researchers pay more attention to the pore structure and propose correlations that are only related to porosity, pore size, and Reynolds number. The thickness is considered as an irrelevant parameter and is usually directly given as a fixed value, for example, foams with thicknesses of 120 and 50 mm have been tested by Xia [19] and Dietrich [18], respectively. However, this section proves that the volumetric heat transfer coefficient of foam materials with different thicknesses is not a constant.
From the analysis of the results in Section 2.2, it can be seen that the obvious LTE phenomenon occurs in materials with a large thickness, and at this time, the situation where local convection heat transfer is equal to zero will occur in a large range, resulting in a smaller volumetric heat transfer coefficient. Therefore, foam materials with different thicknesses have different volumetric heat transfer coefficients owing to the degree of influence of the thickness on the local thermal equilibrium. In particular, the larger the thickness, the greater the degree of influence, and the smaller the volumetric heat transfer coefficient. When studying the heat transfer characteristics of foam materials, thickness should be taken into account as an important influencing factor, which can avoid the overestimation of the volumetric heat transfer coefficient due to local thermal equilibrium caused by larger thickness.

3. Numerical Simulation

Although the above experiment has proved the existence of the LTE phenomenon, the experimental data can only visually show the LTE phenomenon at the beginning of the transient, and the processing results of the experimental data can only prove that the larger thickness leads to the decrease of the volumetric heat transfer coefficient. In addition, the details of the LTE and LTNE vary along the entire thickness, the flow and heat transfer inside the foam ceramic, and the specific influence of the pore structures on LTE are not available in the existing experimental methods. Therefore, it is necessary to numerically simulate the foam ceramics to systematically analyze the internal fluid-solid heat transfer characteristics, and the results will supplement the experimental results.
In this paper, the simplified geometries that can reflect the pore structure were employed to investigate the effect of the pore structure on the thermal equilibrium and to analyze the internal heat transfer along the thickness direction.

3.1. Geometric Model

By observing the true three-dimensional geometry of the experimental sample and considering the current research of the simplified model, the simplified tetrakaidecahedron was selected for research in this paper, as shown in Figure 4.
where the LS and d represent the length of ligament and cell diameter, respectively, the relationship between the relevant parameters in geometric modeling is referred to the formulas proposed by Wu [27], and the corresponding formulas are as follows:
d = 2.828 L s ;
ε = 1 9.425 8 2 ( d s L s ) 2 + 3.33 8 2 ( d s L s ) 3 ;
where ε is the porosity, ds is the strut diameter. In this study, the geometric parameters of the silicon carbide ceramic sample with a porosity of 0.85 and a PPI of 45 were selected as the basis for geometric design, and the corresponding cell diameter is 3.8 mm and the strut diameter is 0.608 mm. According to the Equations (1) and (2), a simplified geometric structure with a porosity of 0.85, a cell diameter of 3.8 mm and a strut diameter of 0.624 mm was obtained, which was about 2.5% compared to real strut diameter. In order to visually analyze the effect of pore structure on convective heat transfer, another geometric structure with a porosity of 0.75 and strut diameter 0.84 mm was obtained under the same cell diameter of 3.8 mm.

3.2. Computing Domain

Based on the consideration of the structure of simplified unit cell and the symmetry of the tetrakaidecahedron, this paper establishes a computational model by using the STAR-CCM+ software, as shown in the Figure 5. The four walls were set to symmetrical boundary conditions, and the solid skeleton surface was defined as a non-slip, non-penetrating wall surface. Besides, a large solid domain with thickness of L = 25d was employed to study the LTE phenomenon under pore scale, and the boundary conditions are given as velocity inlet and pressure outlet. The corresponding conditions are given, including initial temperature Ts = T0 = 323 K, inlet air temperature Tf,in = 283 K, velocity u = 1 m/s.

3.2.1. Grid Model and Physical Model

Affected by pore structure, there are phenomena such as impact and separation, when the fluid continuously impacts the solid skeleton. Therefore, a finer grid scheme is required. In this study, the polyhedral mesh and prismatic grid were used, and the mesh at the interface was encrypted. For the physical model, the K-Epsilon turbulence model was employed, the working fluid was air with constant thermophysical properties, referencing the temperature of 278 K, and the solid was silicon carbide. Last, a transient solution controller was selected for this simulation, the time-step was set to 20 steps in 1 s.

3.2.2. Grid Verification

In order to ensure the reliability of the simulation results, three grids parameters were set for comparison. The numbers of grids with a porosity of 0.85 are as presented in Table 1.
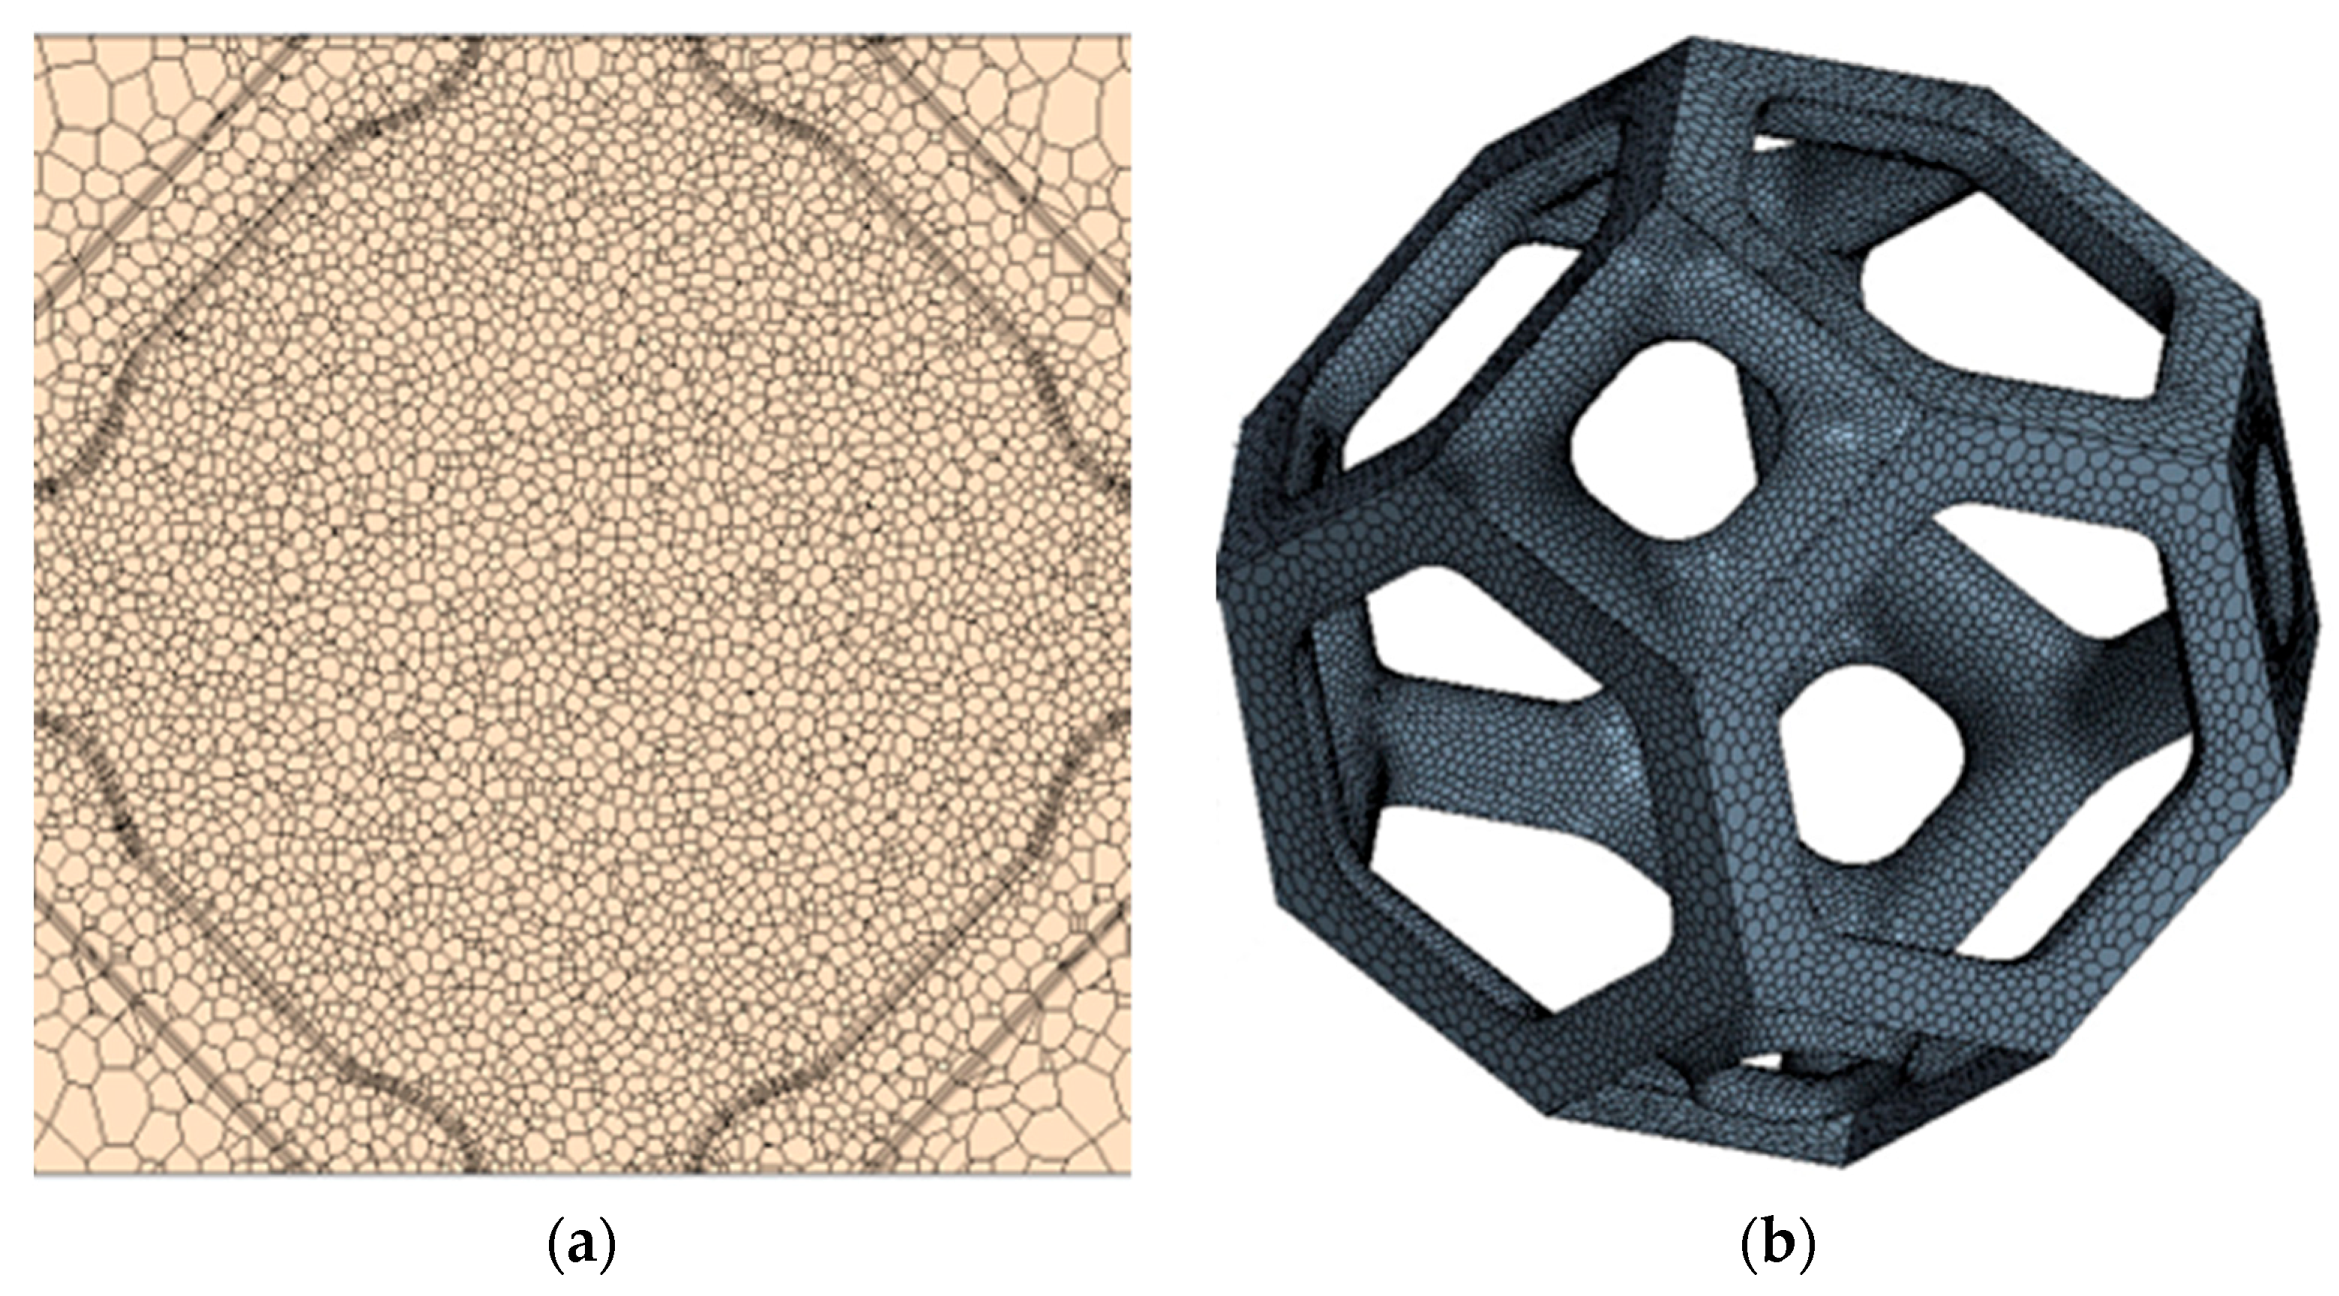
For these three grids, the velocity and pressure distribution along the flow direction are shown in Figure 6. Case 1 differs greatly from the other two schemes, while Case 2 and Case 3 almost overlap. By calculation, the relative error between Case 1 and Case 3 is 4.7%, and the relative error between Case 2 and Case 3 is only 0.08%. Thus, Case 2 is believed to perform the following simulation. The corresponding grid details can be seen in Figure 7.

4. Results and Discussion

Under the above boundary conditions, the numerical simulation results of fluid-solid coupling heat transfer are reported as follows.

4.1. The Characteristics of Flow Field

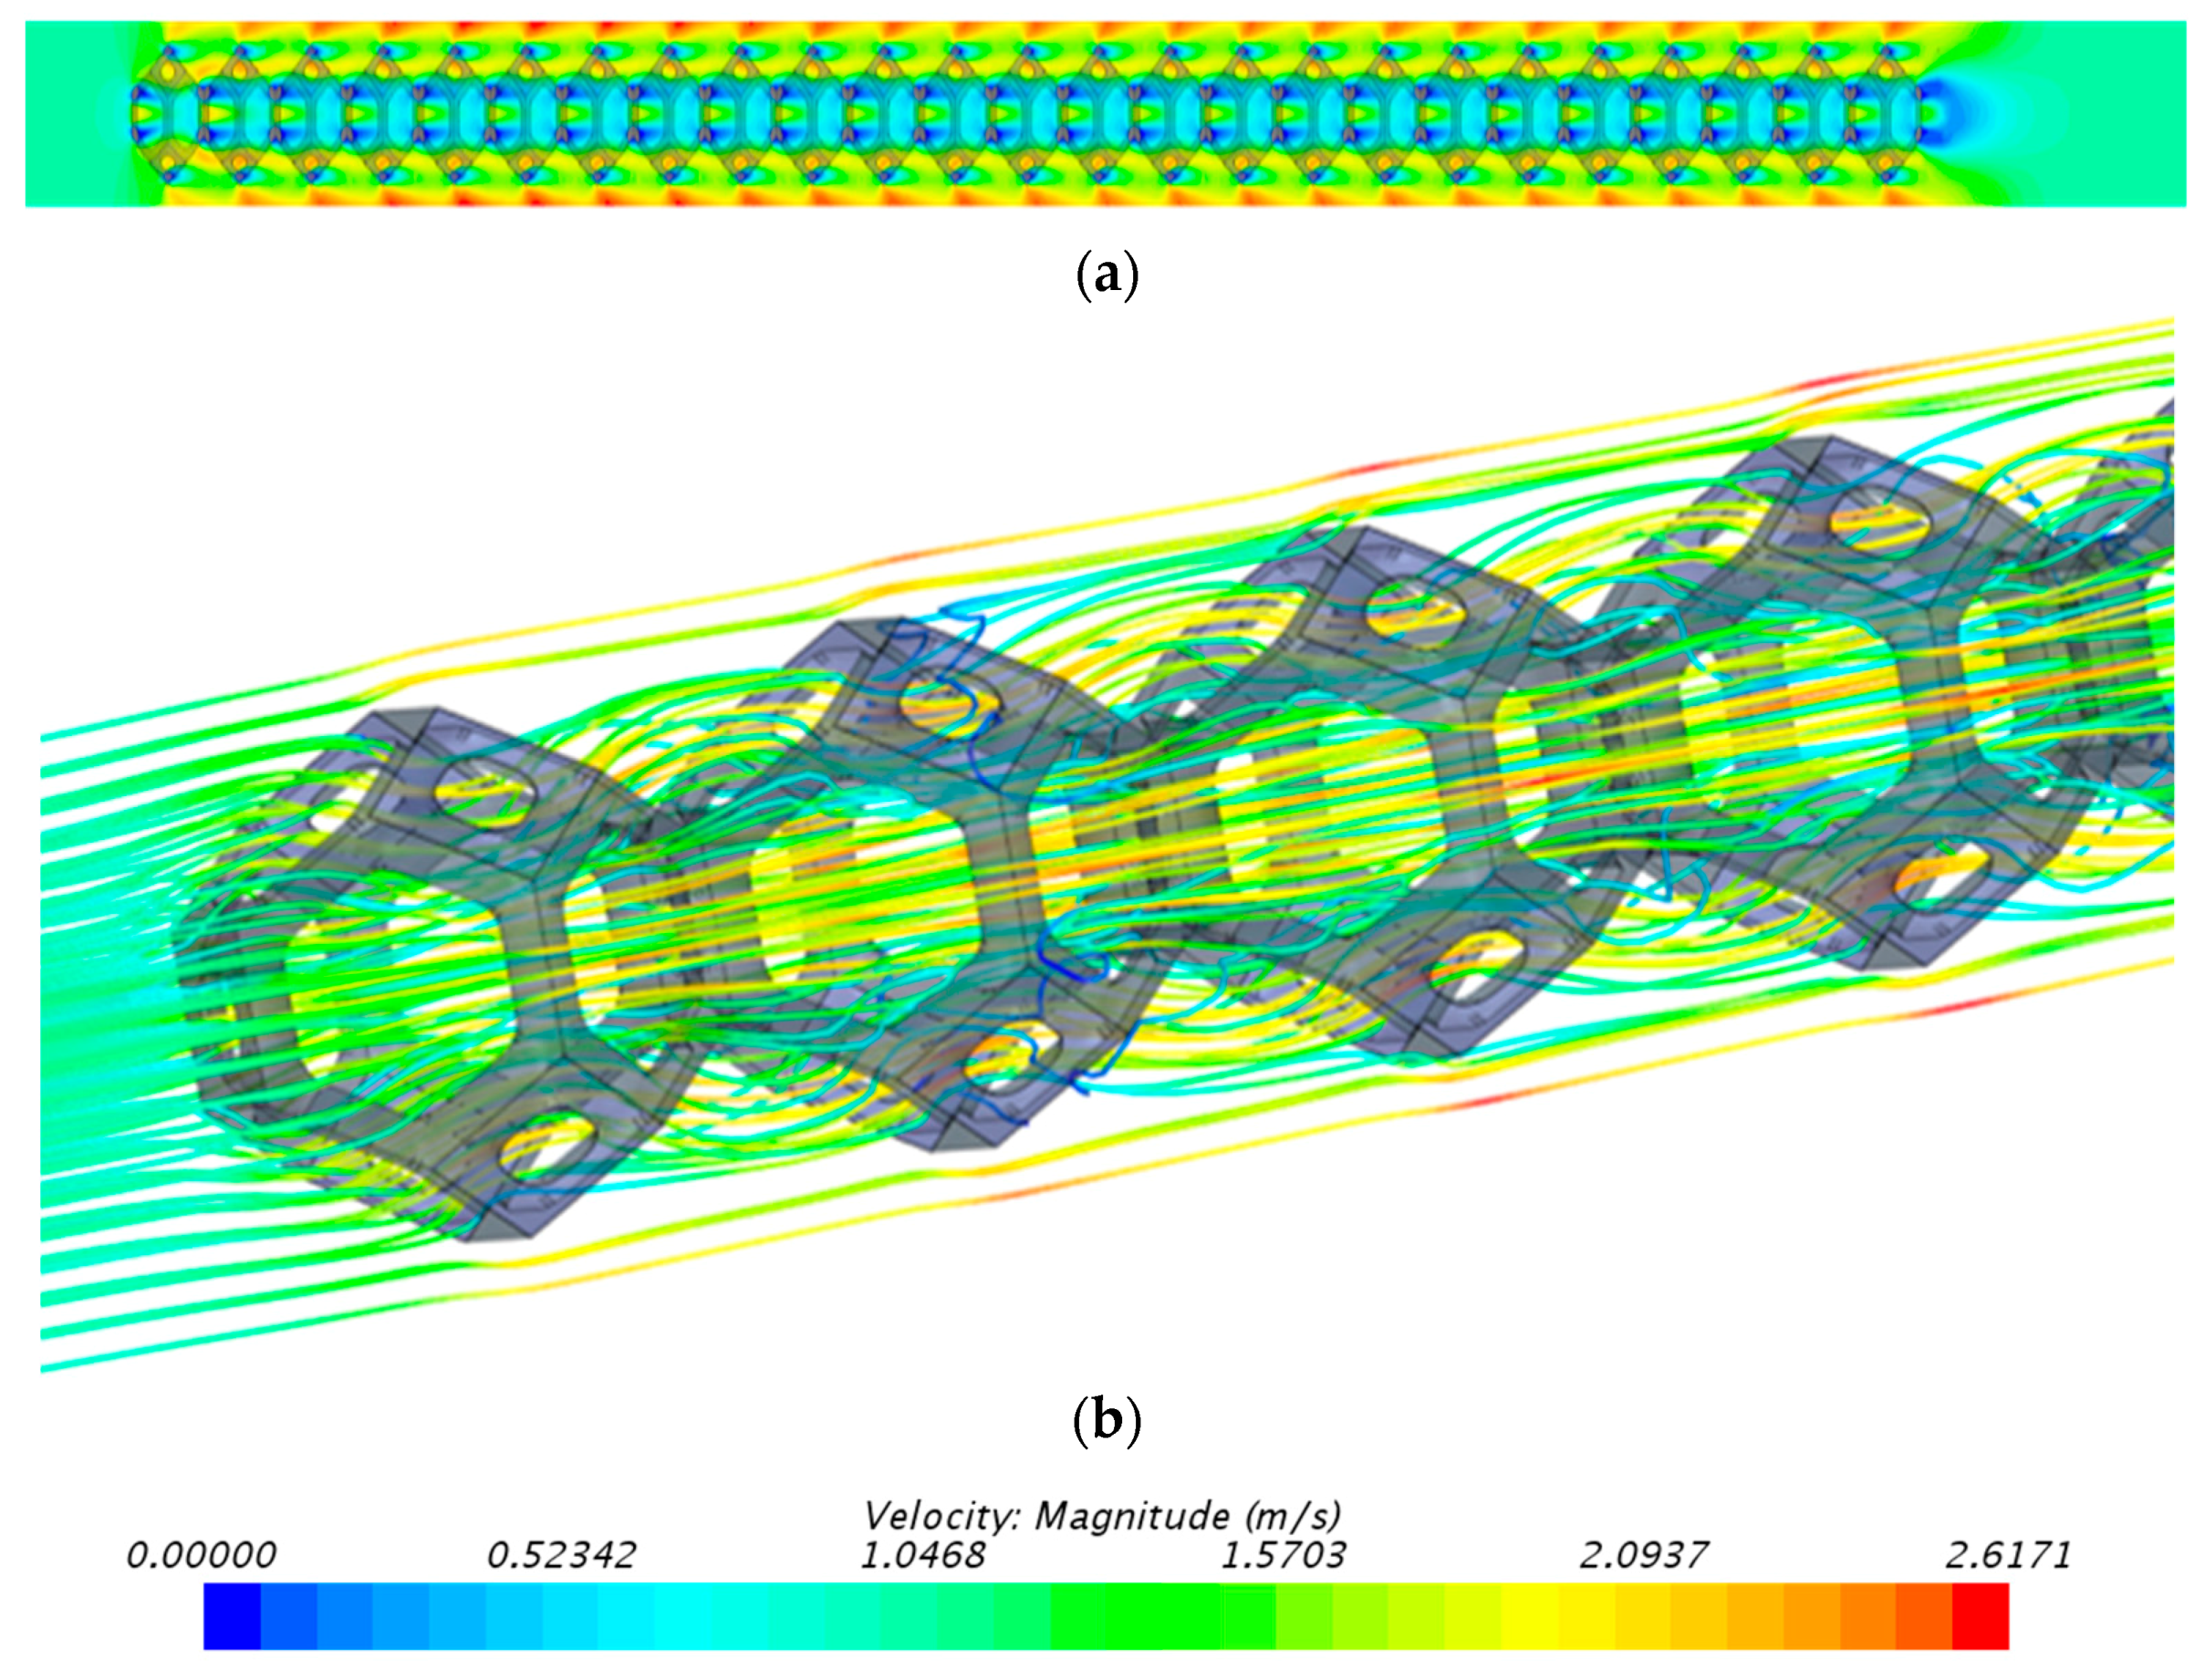
Figure 8 shows the variation of the velocity field for a porosity of 0.85.
From the overall view, the average velocity distribution in the calculation domain is uniform. Due to the symmetry of the geometric structure, the velocity exhibits a consistent regularity in each cell. While from the streamline diagram, it can be found that the flow path becomes tortuous and velocity accelerates near the pore and other regions affected by the pore structure of the foam.
Taking into account the local details, three planes were chosen for plotting, including the oblique cross-section, x = 0 center section, x = −1 mm cross-section, and Figure 9 shows the three plans, respectively. When the air impacts the solid skeleton, the velocity increases faster after passing through the pores, forming a flow acceleration region at the pores. Due to the resistance of the ligaments, there is a flow lag region behind the ligaments, which causes the velocity of the downstream part of the pore to be higher than that of the ligaments area.
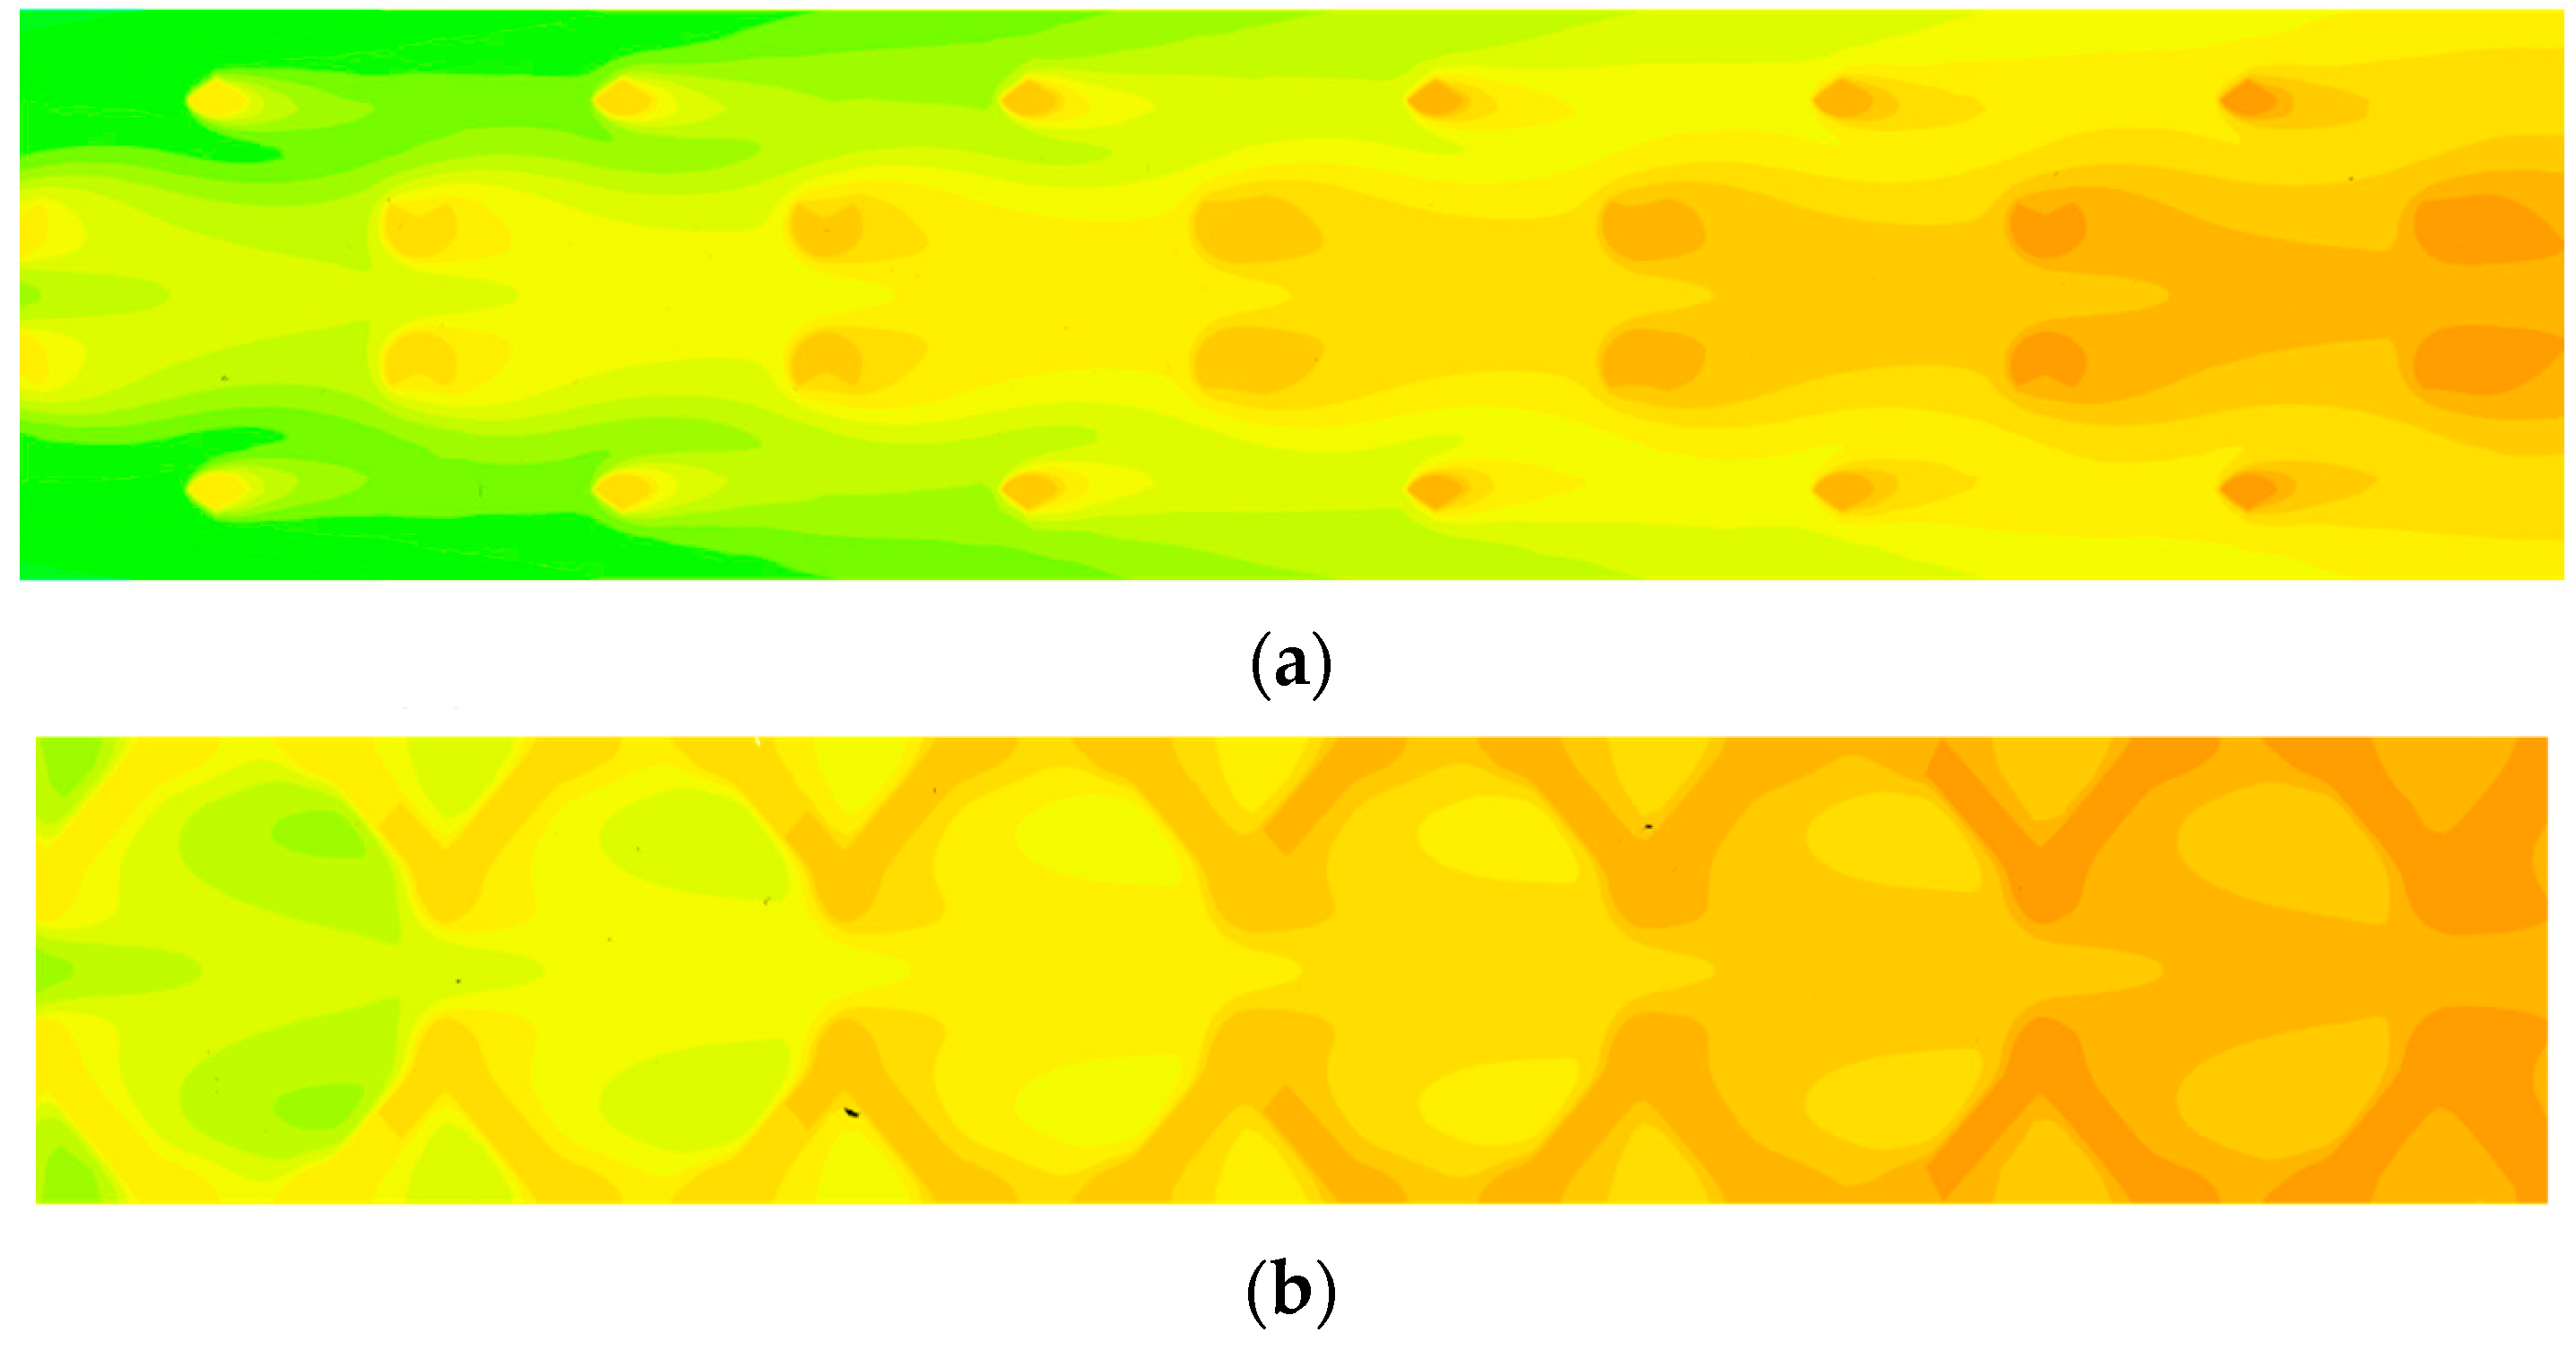
Figure 10 compares the flow characteristics of foam with a porosity of 0.85 and 0.75, it is found that the foam with porosity of 0.75 has larger strut diameter due to the lower porosity, which causes smaller pores and larger velocity, thereby increasing flow perturbation and velocity non-uniformity of the flow field, where the resistance of the ligaments is greater, and the phenomenon of the flow lag region is more obvious.

The Local Thermal Equilibrium and Local Thermal Non-Equilibrium

Figure 11a shows the variation of the internal temperature field of the foam ceramic with a porosity of 0.85 at different times in the oblique section. It can be found that the LTE phenomenon first occurs in the second half of the foam. Then, the area of this phenomenon in the second half gradually decreases and closes to zero at 10 s with time. Therefore, during this period, the temperature of the fluid-solid in the latter part of the foam is equal, and there is no convective heat transfer, which corresponds to the experimental result that the outlet air temperature is equal to the initial temperature at the beginning of the transient. As the transient process continues, the LTE phenomenon also begins to appear in the entrance section and gradually expands the scope of effect along the flow path, with an obvious LTE area at 60 s. Since a larger thickness is selected in this study, it requires more heat to achieve convective heat transfer. As the air continuously replenishes heat, the temperature difference between the fluid and solid at the inlet gradually decreases, causing the occurrence of the LTE phenomenon and the gradual backward movement of convective heat transfer, therefore, the LTE phenomenon occurs throughout the transient heat transfer progress. This effect gradually weakens in the second half of the foam ceramic and gradually increases in the front section, that is, there is always a case where the fluid-solid convection heat transfer is zero. Although a larger thickness foam can exchange more heat, once the above-mentioned LTE phenomenon exists in a large range, the effective heat exchange capacity will be greatly weakened. Therefore, for materials with a defined geometric structure, it is necessary to choose a suitable thickness to design the heat transfer product.
Comparing the temperature field of foam with a porosity of 0.85 and 0.75 in Figure 11a,b, since the skeleton with a porosity of 0.75 accounts for a large proportion, the cross-section area of the solid is larger and more heat is required per unit thickness to fully heat exchange and achieve equilibrium. Therefore, both the temperature change and the internal LTE phenomenon lag behind 0.85, causing the LTE phenomenon to continue to appear in the second half of heat transfer at 10 s, while the entrance section is still in the LTNE state at 60 s, which further makes the LTNE effect exist in a wide range. Therefore, in the case of large thickness, the smaller the porosity of the foam material with a similar structure, the more obvious the LTNE phenomenon is, which is beneficial to heat exchange.
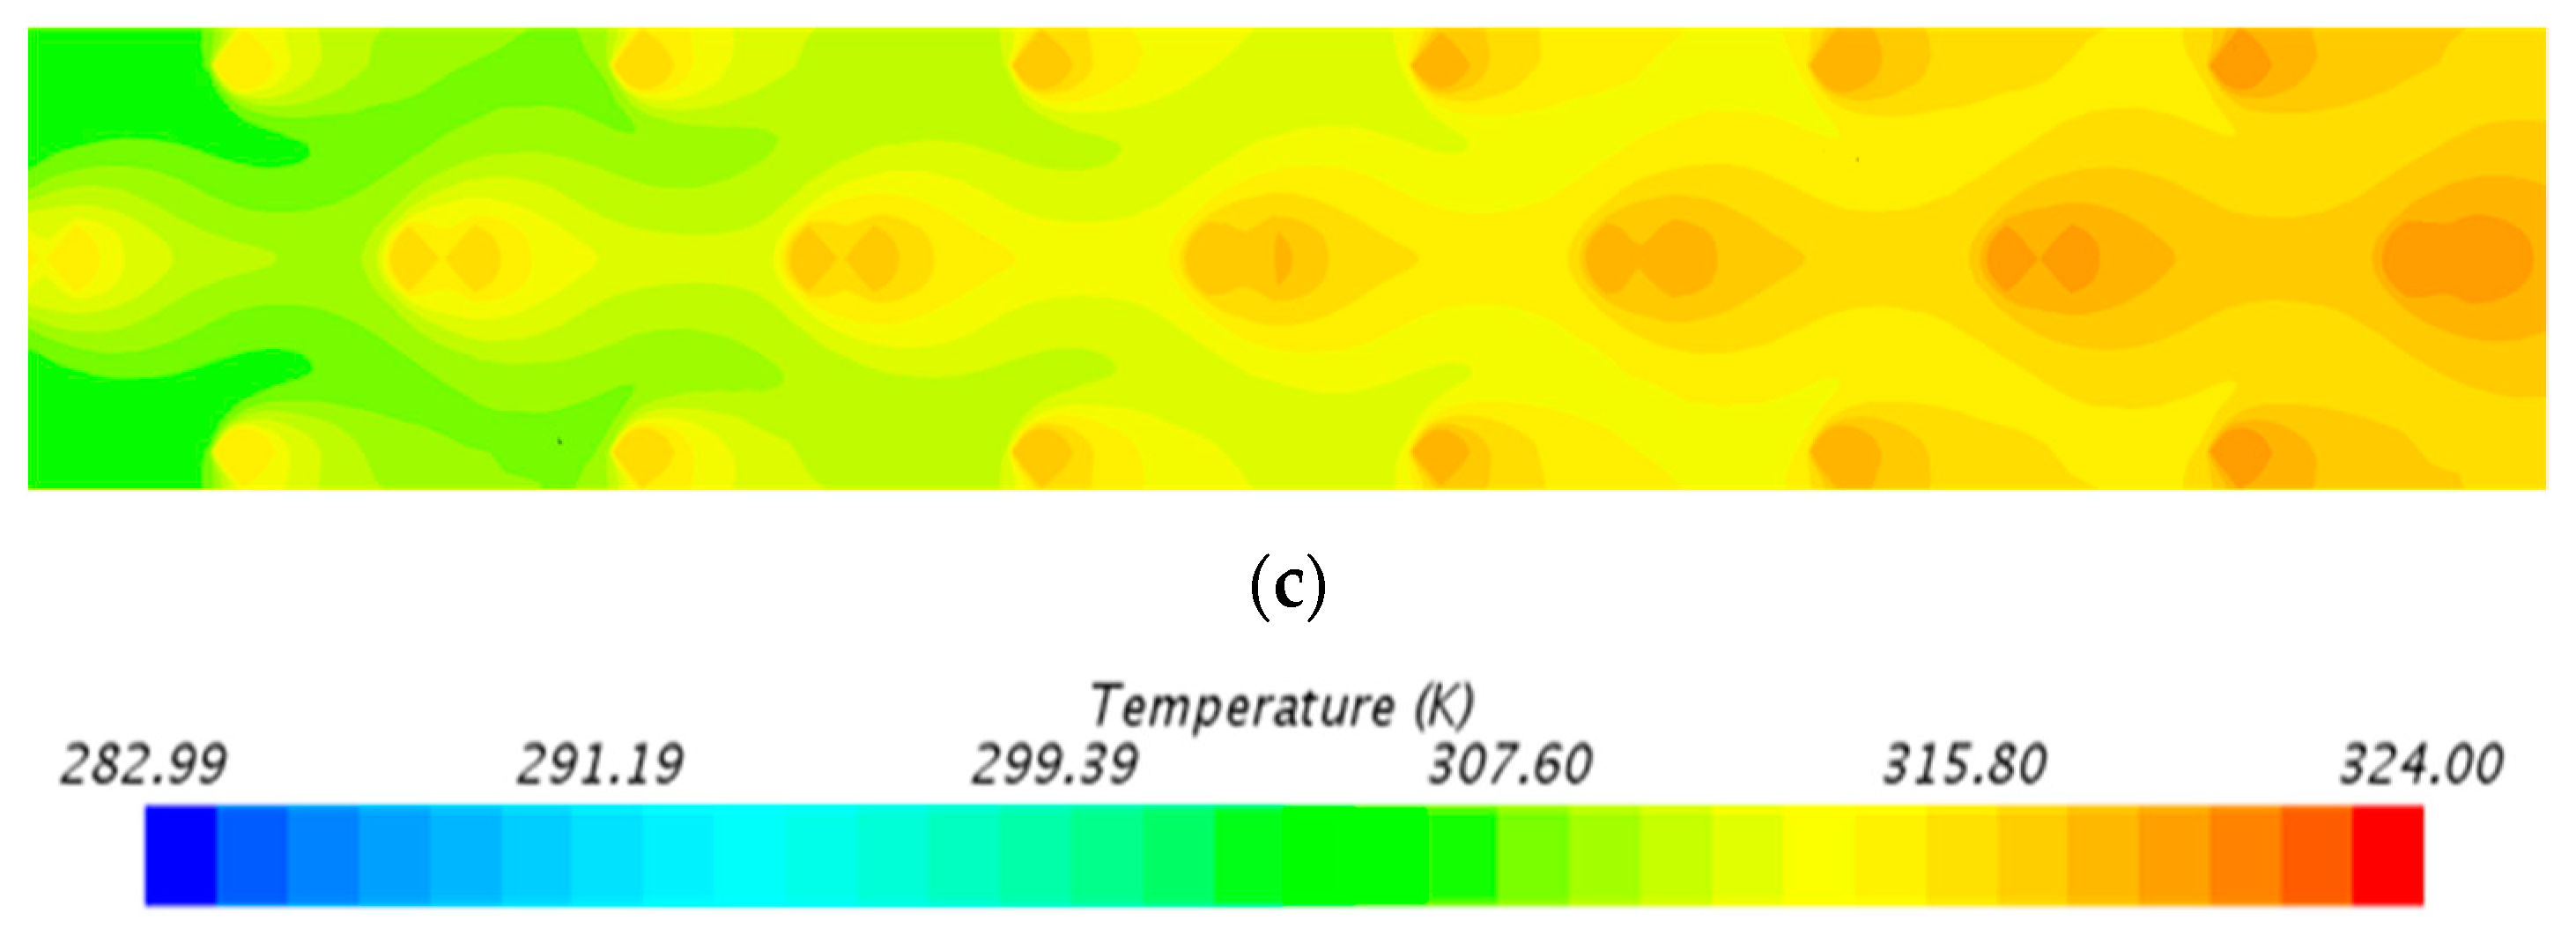
Observing the temperature field in the middle position of three different sections of the foam with a porosity of 0.85 as shown in Figure 12 at 10 s, and it is found that the temperature change near the pore is faster, and the temperature lag region appears behind the ligaments, the fluid-solid phase is in an LTNE state. At this time, the fluid-solid can fully exchange heat. In fact, this phenomenon mainly depends on the previous flow field characteristics, and the temperature distribution is consistent with the velocity distribution. The region with rapid temperature change is generated in the flow acceleration region and the temperature lag region is generated in the flow lag region, which can explain the obvious LTNE phenomenon. In particular, the foam with a porosity of 0.75 has stronger flow field characteristics, and its LTNE phenomenon will be more obvious and will work in a larger area, making the effective heat transfer area increase.
Through the study of the internal details of the foam ceramic, it can be concluded that for foam materials with a certain thickness and similar geometric structure, the porosity can change the pore structures and the amount of solid skeletons, thereby affecting the flow characteristics and causing LTE and LTNE. The smaller the porosity, the more obvious LTNE. However, smaller porosity also brings the problem of increased flow resistance, therefore it is important to balance the relationship between pressure loss and heat transfer in practical applications. In addition, for a specific pore structure, the fluid-solid convective heat transfer along the unit time is determined, when putting in a certain amount of heat, the larger thickness foam in the same time cannot completely exchange heat, and it is necessary to sacrifice time to supplement the heat, causing to LTE occur along with the whole transient heat transfer process. This leads to the experimental results in which there is a large hysteresis of air temperature at the outlet for larger thickness foam. Therefore, in the case of the same heat input, the thickness greatly affects the overall heat transfer performance, resulting in inaccuracy volumetric heat transfer coefficient.

5. Conclusions

In this work, the experiment with different geometries of silicon carbide and numerical simulation with simplified tetrakaidecahedron have been presented to understand the effects of key factors such as thickness and pore structure on local thermal equilibrium and heat transfer characteristics. The main conclusions are drawn as follows:
(1)
The local thermal equilibrium easily occurs in a state when the thickness is larger or the flow velocity is smaller, which leads to a decrease in the volumetric heat transfer coefficient. Ignoring local thermal equilibrium leads to a significant deviation in evaluating volumetric heat transfer characteristics.
(2)
The foam structure such as pores and ligaments change the flow path, along with the disordered flow velocity, which affects the flow field and heat transfer characteristics, resulting in different degrees of local thermal equilibrium and local thermal non-equilibrium in the foams. Moreover, for foams with the same thickness and similar structure, the smaller porosity has obvious LTNE phenomenon and effective convective heat transfer effects.
(3)
For foams with a defined geometric structure, the larger the thickness, the thermal equilibrium phenomenon alternates with time and there is a large range for a long time, resulting in a reduction in the effective heat exchange area and a decrease in heat exchange efficiency.
(4)
The thickness and pore structure should be considered when using foam as the heat transfer medium to maintain a long local thermal non-equilibrium state and obtain a large heat exchange efficiency in designing products.

Author Contributions

Conceptualization, L.Y. and Z.W.; data curation, H.L. and S.X.; formal analysis, Z.W.; funding acquisition, Z.W.; investigation, H.L. and S.X.; methodology, L.Y. and Z.W.; project administration, L.Y. and Z.W.; resources, L.Y. and Z.W.; software, H.L.; writing—original draft, H.L.; writing—review & editing, L.Y., Z.W. and S.X. All authors have read and agreed to the published version of the manuscript.

Funding

This research was supported by the National Natural Science Foundation of China (Grant No. 51676180).

Conflicts of Interest

The authors declare no conflict of interest.

Nomenclature

εporosity
PPIpores per inch
dsstrut diameter
Lslength of ligament
Ttemperature
hvvolumetric heat transfer coefficient
uvelocity
dcell diameter
Lthickness of foam
T0initial temperature
Tf,inInlet fluid temperature
TSsolid temperature

References

  1. Zhao, C.Y. Review on thermal transport in high porosity cellular metal foams with open cells. Int. J. Heat Mass Transf. 2012, 55, 3618–3632. [Google Scholar] [CrossRef]
  2. Panse, S.S.; Singh, P.; Ekkad, S.V.; Patterson, M.W. Thermal hydraulic performance augmentation by high-porosity thin aluminum foams placed in high aspect ratio ducts. Appl. Therm. Eng. 2019, 161, 114162. [Google Scholar] [CrossRef]
  3. Rashidi, S.; Kashefi, M.H.; Kim, K.C.; Samimi-Abianeh, O. Potentials of porous materials for energy management in heat exchangers—A comprehensive review. Appl. Energy 2019, 243, 206–232. [Google Scholar] [CrossRef]
  4. Feng, S.S.; Kuang, J.J.; Wen, T.; Lu, T.J.; Ichimiya, K. An experimental and numerical study of finned metal foam heat sinks under impinging air jet cooling. Int. J. Heat Mass Transf. 2014, 77, 1063–1074. [Google Scholar] [CrossRef]
  5. Rehman, T.-u.; Ali, H.M. Experimental investigation on paraffin wax integrated with copper foam based heat sinks for electronic components thermal cooling. Int. Commun. Heat Mass Transf. 2018, 98, 155–162. [Google Scholar] [CrossRef]
  6. Al-Athel, K.S. A computational methodology for assessing the thermal behavior of metal foam heat sinks. Appl. Therm. Eng. 2017, 111, 884–893. [Google Scholar] [CrossRef]
  7. Bayomy, A.M.; Saghir, M.Z.; Yousefi, T. Electronic cooling using water flow in aluminum metal foam heat sink: Experimental and numerical approach. Int. J. Therm. Sci. 2016, 109, 182–200. [Google Scholar] [CrossRef]
  8. Pozzobon, J.C.; Mantelli, M.B.H.; Silva, A.K.D. Experimental study of unstructured porous media inserts for water recovery in a reduced scale, crossflow cooling tower. Appl. Therm. Eng. 2015, 96, 632–639. [Google Scholar] [CrossRef]
  9. Gomez-Garcia, F.; González-Aguilar, J.; Olalde, G.; Romero, M. Thermal and hydrodynamic behavior of ceramic volumetric absorbers for central receiver solar power plants: A review. Renew. Sustain. Energy Rev. 2016, 57, 648–658. [Google Scholar] [CrossRef]
  10. Barreto, G.; Canhoto, P.; Collares-Pereira, M. Three-dimensional CFD modelling and thermal performance analysis of porous volumetric receivers coupled to solar concentration systems. Appl. Energy 2019, 252, 113433. [Google Scholar] [CrossRef]
  11. Zaversky, F.; Aldaz, L.; Sánchez, M.; Ávila-Marín, A.L.; IsabelRoldán, M. Numerical and experimental evaluation and optimization of ceramic foam as solar absorber—Single-layer vs multi-layer configurations. Appl. Energy 2018, 210, 351–375. [Google Scholar] [CrossRef]
  12. Frey, M.; Romero, T.; Roger, A.C.; Edouard, D. An intensification of the CO2 methanation reaction: Effect of carbon nanofiber network on the hydrodynamic, thermal and catalytic properties of reactors filled with open cell foams. Chem. Eng. Sci. 2019, 195, 271–280. [Google Scholar] [CrossRef]
  13. Chueh, W.C.; Falter, C.; Abbott, M.; Scipio, D.; Furler, P.; Haile, S.M.; Steinfeld, A. High-Flux Solar-Driven Thermochemical Dissociation of CO2 and H2O Using Nonstoichiometric Ceria. Science 2015, 330, 1797–1801. [Google Scholar] [CrossRef] [PubMed] [Green Version]
  14. Ranut, P.; Nobile, E.; Mancini, L. High resolution microtomography-based CFD simulation of flow and heat transfer in aluminum metal foams. Appl. Therm. Eng. 2014, 69, 230–240. [Google Scholar] [CrossRef]
  15. Xu, H.J.; Xing, Z.B.; Wang, F.Q.; Cheng, Z.M. Review on Heat Conduction, Heat Convection, Thermal Radiation and Phase Change Heat Transfer of Nanofluids in Porous Media: Fundamentals and Applications. Chem. Eng. Sci. 2018, 195, 462–483. [Google Scholar] [CrossRef]
  16. Dukhan, N.; Al-Rammahi, M.A.; Suleiman, A.S. Fluid temperature measurements inside metal foam and comparison to Brinkman–Darcy flow convection analysis. Int. J. Heat Mass Transf. 2013, 67, 877–884. [Google Scholar] [CrossRef]
  17. Dukhan, N.; Bağcı, Ö.; Özdemir, M. Thermal development in open-cell metal foam: An experiment with constant wall heat flux. Int. J. Heat Mass Transf. 2015, 85, 852–859. [Google Scholar] [CrossRef]
  18. Dietrich, B. Heat transfer coefficients for solid ceramic sponges—Experimental results and correlation. Int. J. Heat Mass Transf. 2013, 61, 627–637. [Google Scholar] [CrossRef]
  19. Xia, X.L.; Xue, C.; Sun, C.; Li, Z.H.; Bo, L. Experiment on the convective heat transfer from airflow to skeleton in open-cell porous foams. Int. J. Heat Mass Transf. 2017, 106, 83–90. [Google Scholar] [CrossRef]
  20. Vijay, D.; Goetze, P.; Wulf, R.; Gross, U. Forced convection through open cell foams based on homogenization approach: Transient analysis. Int. J. Therm. Sci. 2015, 98, 395–408. [Google Scholar] [CrossRef]
  21. Vijay, D.; Goetze, P.; Wulf, R.; Gross, U. Forced convection through open cell foams based on homogenization approach: Steady state analysis. Int. J. Therm. Sci. 2015, 98, 381–394. [Google Scholar] [CrossRef]
  22. Krishnakumar, K.; John, A.K.; Venkatarathnam, G. A review on transient test techniques for obtaining heat transfer design data of compact heat exchanger surfaces. Exp. Therm. Fluid Sci. 2011, 35, 738–743. [Google Scholar] [CrossRef]
  23. Ranganayakulu, C.; Luo, X.; Kabelac, S. The single-blow transient testing technique for offset and wavy fins of compact plate-fin heat exchangers. Appl. Therm. Eng. 2017, 111, 1588–1595. [Google Scholar] [CrossRef]
  24. Chiappini, D. Numerical simulation of natural convection in open-cells metal foams. Int. J. Heat Mass Transf. 2018, 117, 527–537. [Google Scholar] [CrossRef]
  25. Ambrosio, G.; Bianco, N.; Chiu, W.K.S.; Iasiello, M.; Oliviero, M. The effect of open-cell metal foams strut shape on convection heat transfer and pressure drop. Appl. Therm. Eng. 2016, 103, 333–343. [Google Scholar] [CrossRef] [Green Version]
  26. Zafari, M.; Panjepour, M.; Davazdah Emami, M.; Meratian, M. Microtomography-based numerical simulation of fluid flow and heat transfer in open cell metal foams. Appl. Therm. Eng. 2015, 80, 347–354. [Google Scholar] [CrossRef]
  27. Wu, Z.Y.; Caliot, C.; Flamant, G.; Wang, Z.F. Numerical simulation of convective heat transfer between air flow and ceramic foams to optimise volumetric solar air receiver performances. Int. J. Heat Mass Transf. 2011, 54, 1527–1537. [Google Scholar] [CrossRef]
  28. Du, S.; Tong, Z.X.; Zhang, H.H.; He, Y.L. Tomography-based determination of Nusselt number correlation for the porous volumetric solar receiver with different geometrical parameters. Renew. Energy 2018, 135, 711–718. [Google Scholar] [CrossRef]
  29. Das, S.; Sneijders, S.; Deen, N.G.; Kuipers, J.A.M. Drag and heat transfer closures for realistic numerically generated random open-cell solid foams using an immersed boundary method. Chem. Eng. Sci. 2018, 183, 260–274. [Google Scholar] [CrossRef]
  30. Liu, H.; Yu, Q.N.; Qu, Z.G.; Yang, R.Z. Simulation and analytical validation of forced convection inside open-cell metal foams. Int. J. Therm. Sci. 2017, 111, 234–245. [Google Scholar] [CrossRef]
  31. Iasiello, M.; Cunsolo, S.; Bianco, N.; Chiu, W.K.S.; Naso, V. Developing thermal flow in open-cell foams. Int. J. Therm. Sci. 2016, 111, 129–137. [Google Scholar] [CrossRef]
  32. Mancin, S.; Zilio, C.; Diani, A.; Rossetto, L. Air forced convection through metal foams: Experimental results and modeling. Int. J. Heat Mass Transf. 2013, 62, 112–123. [Google Scholar] [CrossRef]
Figure 1. Schematic diagram of the experimental setup.
Energies 13 00348 g001
Figure 2. Curve of outlet temperature change with time in foams: (a) Different thickness, (b) different velocity.
Energies 13 00348 g002
Figure 3. Curve of the experimental volumetric heat transfer coefficients change with velocity.
Energies 13 00348 g003
Figure 4. Geometric model used for simulation.
Energies 13 00348 g004
Figure 5. Computing domain of the simulation.
Energies 13 00348 g005
Figure 6. The velocity and pressure distribution along flow direction (a) velocity, (b) pressure.
Energies 13 00348 g006aEnergies 13 00348 g006b
Figure 7. Details of mesh: (a) Surface mesh, (b) body mesh.
Energies 13 00348 g007
Figure 8. The variation of velocity: (a) Overall velocity scalar field, (b) velocity streamline.
Energies 13 00348 g008
Figure 9. Velocity contours in three planes: (a) Schematic of planes, (b) oblique cross section, (c) center section, (d) x = −1 mm cross section.
Energies 13 00348 g009
Figure 10. The comparison of velocity in different porosities: (a) Porosity of 0.85, (b) porosity of 0.75.
Energies 13 00348 g010
Figure 11. The comparison of temperature scale with different porosities at different times in the oblique section: (a) Porosity of 0.85, (b) porosity of 0.75.
Energies 13 00348 g011
Figure 12. Temperature scale in three planes: (a) Oblique cross section, (b) center section, (c) x = −1 mm cross section.
Energies 13 00348 g012aEnergies 13 00348 g012b
Table 1. Detail parameter values of mesh.
ParameterCase1Case2Case3
Base size0.5 mm0.5 mm0.4 mm
Minimum face mesh size0.125 mm0.05 mm0.04 mm
Total number of grid cells1,072,5953,942,0865,466,177
Number of mesh nodes4,798,14519,797,04927,577,773
Pressure drop36.83 Pa35.18 Pa35.15 Pa