Abstract
Electric vehicles (EV) replacing the internal combustion engine vehicle may be the solution for the particulate matter (PM) 2.5 pollution issue. However, the uncontrolled charging of EVs would challenge the power system operation. Therefore, it is necessary to implement some level of control over the EV charging procedure, especially in the residential network. In this paper, an optimization of EVs charging scheduling considering energy arbitrage and the distribution network cost of an urban village environment is presented. The optimized strategy focuses on decreasing the loss of EV owners’ energy arbitrage benefit, introduced as the penalty cost. Also, peak demand, power loss, and transformer aging are included in the estimation of the cost function for the distribution network. The optimization problem is solved using the genetic algorithm. As a case study, data from the urban village in Udon Thani, Thailand, are utilized to demonstrate the applicability of the proposed method. Simulation results show a reduction in the loss of energy arbitrage benefit, transformer peak load, power loss and the transformer loss of life. Therefore, the application of the optimized EV charging can prolong transformer lifetime benefiting both the EV owner and the distribution system operator.
1. Introduction
Nowadays, climate change and global warming on account of greenhouse gas (GHG) emissions such as CO2, are negatively impacting the world environment. Moreover, CO2 emissions in the transportation sector are also the cause of particulate matter (PM) 2.5 pollution which is generated by internal combustion vehicles. Many countries are looking into changing their policies to increase electric vehicle (EV) usage and there has been a consequent increase of EVs to over 5 million cars worldwide in 2018 [1]. However, a large increase in EVs can significantly impact the power network, especially the low voltage (LV) network, such as the urban village power system with a higher potential of energy consumption [2]. EV charging can affect the distribution network in many ways, for example, power quality issue and reliability problems [3], power fluctuation due to the uncertainty of charging [4], voltage drop due to charging demand exceeding prior design specifications [5] and network overloading because of dump charging [6,7]. Moreover, its impacts on grid asset deterioration have been reported in references [8,9,10]. The research in reference [8] presented that the impact of EVs charging demand in the city with a high annual average temperature environment can significantly reduce the loss of life of the distribution transformer. In reference [9], the simulation result illustrated that the dump of peak load from uncontrolled EV charging can cause the power network bottleneck problem and overloading. In reference [10], it was shown that uncoordinated EV charging causes the distribution transformers and the grid components operate under high risk of failures. All of these create real-life challenges for EV congestion management in village networks for the distribution system operator (DSO) or the independent system operator (ISO).
Regarding the negative impacts of EV charging, many studies have been published on how to deal with the EV charging impacts. To reduce the EV impacts on grid assets, optimal charging has been a popular method in recent years. Research work in reference [11] proposed a smart schedule for EV in the residential low-voltage system to flatten the load profile of the substation transformer that can reduce the transformer aging. Reference [12] proposed the distributed scheduling algorithm to coordinate the EV charging in a residential area in Pattaya, Thailand. The goal of this work is to control the network load profile and prevent the transformer overloading. The optimization-based coordination strategies on the voltage stability and phase imbalance in the semi-urban low voltage grid was presented in reference [13] where one of the study optimization strategies was to minimize the variance of the aggregated load at the transformer. Reference [14], proposed optimal EV charging with considering the distribution network constraint set includes transformer and line limitations to prolong the transformer lifetime and to protect the line damage. However, the above references do not include the transformer aging due to temperature variation and the characteristic based on the winding thermal mechanism model was not illustrated in these studies as well. Optimization of EV charging to decelerate the distribution transformer loss of life using the exponential thermal models have been reported by some researchers. Reference [15] presents the technical and economical optimization of EV charging in a parking garage with photovoltaic (PV) and battery energy storage system (BESS) considering the impact on transformer aging. Reference [16] discusses optimized EV charging in the parking lot where the critical power limit of the distribution transformer is modeled with the ambient temperature and the aging acceleration factors. In reference [17], the optimal strategies of the home energy management system with EV charging for minimizing the distribution transformer aging were shown. However, both studies did not consider the benefit of the EV owners’ energy arbitrage when the electricity tariff is taken into account, such as the time of use (TOU) rate.
In the research work [18], the authors demonstrated the impact of the transformer aging in community distribution networks under different EV charging strategies such as dump charging, TOU charging and the proposed optimal charging considering minimization of energy costs and the transformer loss of life. In reference [19], researchers proposed the optimal centralized model for a residential grid to minimize the transformer aging considering the energy arbitrage benefits for EV owners. In research work [20], optimal EV charging considering the cost of the distribution transformer aging, network energy losses and charging cost in the residential area were proposed. However, they did not perform the optimal EV charging using power flow analysis to consider the network operating constraints such as the conductor current rating and bus-voltage boundary limitation. In addition, all reviewed literature did not consider the loss of EV owner’s energy arbitrage benefit when they change their charging profile to the optimal charging pattern that only supports the slowing down of the transformer aging.
In order to fill the gap in previous research works, this paper proposes a methodology to optimize EV charging allocation in an urban village network considering the EV owner’s benefit from EV battery price arbitrage and the DSO network operation cost including the transformer loss of life cost. The focus of this optimization work is to fulfill the objectives, namely, minimization of the loss cost of energy arbitrage, peak demand cost, network power loss cost, and the transformer aging cost. The model of transformer thermal characteristics is considered in the transformer loss of life cost. Also, the constraint function of a transformer operating limit is added to avoid the gassing of transformer insulation. Furthermore, the actual residential load of the urban village and the ambient temperature in Udon Thani, Thailand, are used to validate the outcomes of the proposed methodology. Numerical simulations with power flow analysis are done using MATLAB (version R2013b, Natick, MA, USA). In addition, the optimization problem is solved by using the genetic algorithm (GA) which is one of the metaheuristic optimization methods. The major contributions of this study are summarized as follows:
- The loss of the EV owner’s benefit from battery energy arbitrage is formulated and taken into account in the objective function, which has not been studied, in previous works.
- To optimize EVs charging allocation in the urban village environment, the network operating limitation is considered in the optimization constraints and evaluated based on the power flow analysis.
- The network peak demand, power loss and transformer loss of life are formulated to be the economic term which represents the network operating costs for including in the objective function.
- Finally, the transformer aging is calculated using the winding thermal characteristic model where the real baseload and the actual local ambient temperature, of an urban village, are utilized to demonstrate the effectiveness of the proposed optimization.
2. Problem Formulation
On one hand, the EV owner likes to charge their EV with the lowest electricity costs and benefits by using the energy arbitrage; however, this may negatively impact the network as previously mentioned. On the other hand, the DSO prefers to sell electricity using distribution assets for a longer time and with minimal operational cost. In addition, factors affecting the operation cost of distributing electricity in the village network include peak demand power, power loss in the distribution system, and grid asset degradation such transformer aging. All these factors are included in our formulation as described in the next section.
2.1. Energy Arbitrage
The electricity price in the village network varies during each period of a day, therefore the price will be on the TOU. In addition, the basic need of EV owners prefers to minimize their electricity charging cost which can be achieved by scheduling their EV charging following the TOU rate. This charging method can benefit EV owners by them selling the residual energy of an EV’s battery back to the distribution network by the vehicle to grid (V2G) mode at a high electricity price period during peak time. Then, the EV owner buys energy from the network by the grid to vehicle (G2V) mode with the lower electricity price in the off-peak period. This process is called energy arbitrage [21]. The profit from the energy arbitrage can be expressed as in Equation (1).
where is the daily energy arbitrage benefit of the i-th EV in $. and are discharged and charged powers of the i-th EV in kW at time t, respectively. Also, is the time interval at the time t and is the electricity price at time t in $/kWh. is the total number of time slots of a day.
2.2. Peak Demand
The power flow balance equations for the village network are expressed as follows:
where in Equations (2) and (3), and are total active power in kW and total reactive power in kVar at the time t, respectively. is charging power in kW of the i-th EV at time t. and are the village baseload of bus j in kW and kVar at the time t, respectively. In addition, and are the active power loss in kW and the reactive power loss in kVar of the distribution branch k at the time t, respectively. In Equation (4), is the total apparent power in kVA at the time t. in Equation (5) and in Equation (6) are the power flow to the receiving end of branch k at time t in kW and kVar, respectively. and are the power flow from the sending end of branch k at time t in kW and kVar, respectively. Also, is the total number of electric vehicles while and are the total number of network buses and branches, respectively.
Since only one distribution transformer supplies the village network, the transformer loading at any time t can be evaluated using Equation (4). Thus, the cost of village daily peak demand can be formulated by multiplying the daily peak load with the demand charge fee, as follows:
Equation (8) is provided to find the peak load power of 24 h of a day that is used to calculate the peak demand charge. Where is the peak demand cost in $, is the daily peak load power in kW and is a daily demand charge fee in $/kW which is obtained by dividing the monthly fee () by 30.
2.3. Power Loss
The second operation cost is the power loss in the distribution network that includes power loss in conductor lines and a distribution transformer. This cost can be formulated in an economic term as shown below:
where, is the daily power loss cost of the network in $.
2.4. Transformer Aging Model
According to the IEEE standard C57.91-2011 [22], the transformer aging is mostly estimated from the transformer insulation life. In fact, aging or deterioration of insulation is considered to be due to aging effects produced by the hottest-spot temperature. The winding hottest-spot temperature is the result of three heat components as shown in Equation (10).
where is the winding hottest-spot temperature at the end of time period t. is the average ambient temperature during the measurement time period t, is the top-oil temperature rise over the ambient temperature at the end of the measurement time period t and is the winding hottest-spot temperature rise over the top-oil temperature at the end of the same time period. All temperatures are in degrees Celsius (°C).
The top-oil temperature rise over the ambient temperature at the time t after a load change is given by the exponential expression function containing an oil time constant [19] as follows:
where is the ultimate top-oil temperature rise over the ambient temperature at time t and is the top-oil temperature rise over the ambient temperature at the previous period in °C. is the interval of evaluation in hour and is the oil time constant of transformer for any load and for any specific temperature differential between the ultimate top-oil rise and the initial top-oil rise [22]. The calculation of the ultimate top-oil temperature rise over the ambient temperature () is based on the top-oil temperature rise over the ambient temperature at the transformer rated loading () as shown in Equation (12).
where is the ratio of transformer ultimate loading and the rated loading. R is the ratio of transformer power loss at rated load and no-load and n is an empirically derived exponent of the cooling parameter, whose value depends on the type of transformer cooling method and approximately accounted for considering the effects of change in transformer resistance with a change in load.
Also, the winding hottest-spot temperature rise over the top-oil temperature at time t after load changes is given by the exponential expression function containing the winding time constant at hot spot location as in Equation (13) [19].
where is the ultimate winding hottest-spot temperature rise over the top-oil temperature at the end of time t in °C. is the winding hottest-spot temperature rise over the top-oil temperature previously in °C and is the transformer winding temperature time constant. The calculation of the ultimate winding hottest-spot rise temperature over top-oil temperature () is based on the winding hottest-spot rise over the top-oil temperature at rated loading () as shown in Equation (14).
where m is an empirically derived exponent of the cooling parameter of the transformer [22].
The relation between insulation deterioration with time and the winding hottest-spot temperature can be evaluated using an aging acceleration factor () [22]. The of a given hottest-spot temperature at time t, usually is based on the reference temperature of 110 °C and can be evaluated using Equation (15).
Thus, the is equal to 1, when the winding hottest-spot temperature is equal to the reference temperature. The is more than 1 when the winding hottest-spot temperature is higher than the reference temperature. This condition indicates that the transformer is experiencing accelerated aging and its lifetime is reduced. The equivalent of the aging acceleration factor and daily transformer percent loss of life over a time period of a day can be written, as in Equations (16) and (17), respectively.
where is the equivalent of the aging acceleration factor and is the daily transformer percent loss of life in hours while is the studied time duration of a day which normally is considered to be 24 h. Also, is the normal insulation life of the transformer, according to IEEE standard [22], the residual tensile strength (RTS) of the end point in sealed tube aging was considered at a level of 20% residual. The end of life criteria for the oil-immersed transformer is an RTS of 20% at the reference temperature of 110 °C and a normal life of 150,000 h (17.12 years).
Finally, the daily transformer aging cost can be calculated as in Equation (18).
where, is the transformer aging cost in $. and are the transformer power rating in kVA and the transformer installation cost per unit in $/kVA, respectively.
3. The Proposed Optimization Method
The goal of the proposed optimization is the minimization of the loss of EV owner’s energy arbitrage benefit through optimal charging and reduction of the distribution network operation cost. The objective and constraint functions are formulated as shown below:
3.1. Objective Function
To combine the EV owner and the DSO perspectives mentioned above, control of EV charging in the distribution network is one way to benefit both the owner and the DSO. Consequently, the objective function for minimizing the related cost can be written by the following:
where, is the penalty cost of the EV owners’ arbitrage benefit loss in $ while is the energy arbitrage of the i-th EV in $, which can be calculated using Equation (1). is the optimized charging power in kW for the i-th EV at time t when parking at home and is the electricity price rate in $/kWh at time t. The optimal charging power value can be either positive value when charging (G2V) or negative if discharging (V2G).
3.2. Constraints
3.2.1. Electric Vehicle (EV) Charging Constraints
The optimization of EVs charging in urban village networks is performed after EV is parked at home. The ratio of the EV stored energy level and its battery capacity is defined as the state of charge (), which the initial battery level of the i-th EV () at the beginning of charging which can be calculated using Equation (21). The high accuracy model of EV battery’s level estimation can be found in [23]. However, this model must be evaluated by using many parameters of the battery. Therefore, to reduce the complexity of this constraint, the of EV battery energy formula as shown in Equation (22) is used in this work. This equation can be compared with the equation in [23] and is successfully used in reference [15].
where, is the battery level of the i-th EV when it departs from home and is the electrical consumption rate of the i-th EV in kWh/km. is the daily traveling distance in km and is the EV battery capacity in kWh. and are the battery level of the i-th EV at time t and the previous time (t–1), respectively. Besides, is equal to when EV battery operates at charging mode and is equal to if it operates at discharging mode, where and are charging and discharging efficiencies, respectively.
The charging power rating of EVs in a household is limited by the nominal rated power of its on-board charger as described below:
where is the on-board charger power rating in kW for the i-th EV.
To prolong the EV battery’s lifetime, the state of charge () of each EV battery at time t, should be limited between the minimum () and the maximum () state of charge limits. Also, the final state of charge of each EV battery () before departing must not be below its minimum desired level () and not above its maximum level (). Both constraints are shown in Equations (24) and (25), respectively. The minimum required charging time of the i-th EV () can be calculated using Equation (26).
In this study, both and are set to be 95%. The state of charge of each EV battery at the time t should be between and . To prolong the EV battery’s lifetime, the is set to be 20% while the is set to be 95% in order to protect the overcharging (no more than 100%) of the battery. In addition, the of each EV is set to be when the parking period is longer than the . Otherwise, it must be continuously charged with a rated power and the final depends on its available charging time at home.
3.2.2. Transformer Constraints
The transformer loss of life is related to the winding hottest-spot temperature that correlates with the transformer loading and the ambient temperature. Therefore, to protect the transformer’s aging, one can control the transformer winding hottest-spot temperature to make sure that the temperature does not go over the limit. This condition can be achieved by optimizing the EV’s charging load. Thus, the constraints we have used are as follows.
where, is the maximum limit of the winding hottest-spot temperature to avoid gassing in the solid insulation and the oil. According to the recommendation in [22], is set to be 140 °C for this study. In addition, is the maximum limit of the transformer loading to safeguard its connector and protecting switch from damage due to higher temperatures. To defer the upgrade cost of the distribution transformer, transformer overloading can be allowed up to some appropriated limit. Following the guide in IEEE standard C57.91-2011, the in this study is set to be 1.4 times the transformer nameplate rating in kVA.
3.2.3. Network Constraints
The final constraint term is the network inequality limitation as listed below:
where, is the voltage of the bus j at time t while and are the lower and upper limits of the voltage level, respectively, which are set to be 0.9–1.1 p.u. of the nominal voltage. In addition, is the current of the branch k at time t and is the maximum current limit per specification of the conductor type at branch k.
3.3. Optimization Framework
The aim of the proposed charging algorithm is to find the optimal day-ahead planning of EVs charging schedule in the village network for increasing EV owner’s energy arbitrage benefit and decreasing the power distribution operating cost. This concept can be applied in the real world by using the EV aggregation system [24] which is provided by the DSO/ISO of a village. The EV aggregator can communicate with an EV owner for obtaining daily traveling data such as the expected arrival time at home and departure time from home while the driven distance can be forecast by using the historical data or user provides. Also, the EV charging scheduling can be controlled through the home energy management system (HEMS) [25].
According to the objective function in Equation (19) which may have multiple locally optimal points. Also, the constraints in Equations (27)–(30) are nonlinear function which its value are evaluated based on power flow analysis (nonlinear problem). That means this is a non-convex optimization problem and cannot be solved by using the linear optimization method. While the metaheuristic optimization methods are widely known for their ability to solve the complexity problem. A genetic algorithm (GA) is a search heuristic algorithm that is inspired by the natural revolution. It is one of the popular intelligent algorithms because of its exploitation and robustness. The examples of success using the GA to solve the optimization of EV charging were presented in references [9,11,26,27]. Therefore, the GA method is selected to solve the optimization problem in this work. However, because the GA method does not guarantee the global optimal solution. The process of the proposed optimization method is operated 10 times in order to obtain the best result. The parameters of GA, such as the population size is set to be 400 with the number of maximum generations is 100 to increase the convergence rate. While, crossover and mutation rates have been determined by a trial and error method to balance the quality of the solution and computation time, which are found to be 0.8 and 0.1, respectively. A diagram of the proposed optimization process based on the GA method is presented in Figure 1. The mechanism to determine the optimal EV charging scheduling is given as follows:
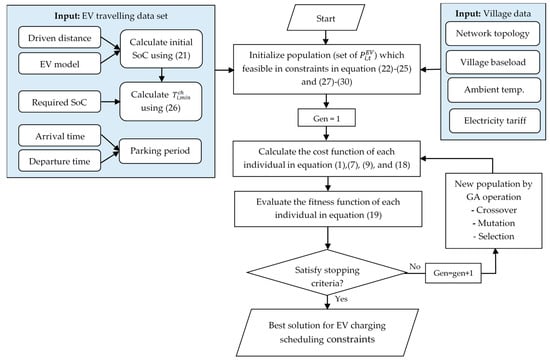
Figure 1.
The proposed optimization process based on the genetic algorithm (GA) method.
- (1)
- The process begins by creating a random initial population of each individual which feasible in the region considering constraints in Equations (22)–(25) based on the information of EV traveling data set such as driven distance, EV model, arrival time, departure time and minimum required energy.
- (2)
- Next, the information about network topology, village baseload and ambient temperature profile for 24 h (96 time slots) are considered in the process. The feasibility of each individual is used to calculate network power flow for evaluating the optimization constraints function in Equations (27)–(30).
- (3)
- In this step, the cost functions of the EV owners’ arbitrage benefit (1), peak demand (7), power loss (9) and the transformer loss of life (18) are calculated. Then these related costs are used to evaluate the fitness function in Equation (19).
- (4)
- The GA optimization process continually generates a new population using GA terminology operation as crossover, mutation and selection until one of the stopping criteria is met. In this study, two stopping criteria are used. First, when the convergence tolerance is within 10−6, the process will be stopped. Second, the generation process reaches the maximum number.
- (5)
- Finally, the best solution of the GA shows the optimal charging power of each EV charging at any time interval. Then the EV charging and discharging schedule considering the energy arbitrage and distribution network cost for the village is used for the day ahead planning optimization.
4. Simulation and Results
4.1. A Studied Urban Village Case
To test the proposed optimization approach, we have selected the distribution radial network in Udon Thani, Thailand, which represents an urban village network. A typical single-phase distribution transformer with a rating of 50 kVA connects the main grid with the 22 kV voltage system. This transformer serves 12 households with a low voltage level of 230 V and delivers power using the 50 THW conductor line, which spans 40 m for the main feeder and 10 m for the service drop line. The network topology for this study is shown in Figure 2. In order to evaluate the transformer aging, the village baseload and ambient temperature of a day in summer (hottest) and winter (coldest) in 2018 were used for simulations. The village baseload profile with the time step of 15 min was obtained from the automatic meter recording (AMR) of the Provincial Electricity Authority (PEA) [28] with a constant power factor of 0.9 (lagging). In addition, the hourly ambient temperature data were obtained from the Thai Meteorological Department (TMD) [29], Thailand. Both village demand power and the environment temperature profile used for this study are presented in Figure 3.
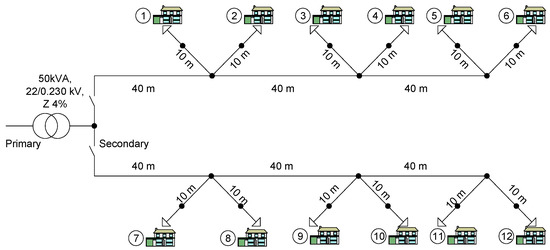
Figure 2.
A studied urban village network topology.
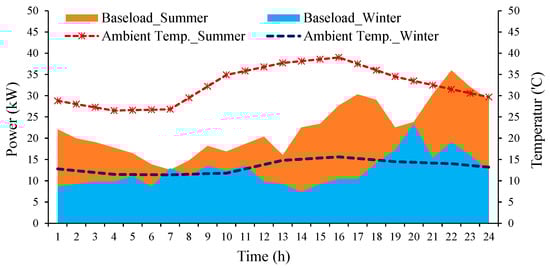
Figure 3.
Village baseload and ambient temperature profiles.
4.2. EV Model
A report of the top 10 EV sales by model in the U.S. [30], is used to select 3 EV models for this study, namely the Chevy Volt [31], Nissan Leaf [32] and Tesla Model 3 [33]. Because the area of this study is focused on the urban village, therefore, we have assumed one EV per house in this urban village study. The specifications of the three selected EV types are listed in Table 1. In this work, we expect all participating EVs in a village must have completed their charging when they park at home. Since the interval time (∆t) is set to be 15 min, the total number of time slots in a day is 96. The EV charger equipment at home is AC level type 2, which operates with a unity power factor. The charging and discharging rates follow the electricity tariffs based on the TOU rate. The electricity tariff and the monthly demand charge fee for a residential network in this study are shown in Table 2. The energy rates are converted from THB to USD using the exchange rate of 1 USD equals 32 THB.

Table 1.
EV model and specifications.
Table 2.
Electricity tariff data from [34].
The uncertainties associated with EVs travel such as departure time, arrival time, and daily traveling distance are applied in this study through random generation of data based on the statistical probability of the traveling pattern from the National Household Travel Survey (NHTS) data [35]. The normal distribution is used to create the random set of the departure time and the arrival time. The departure times from home are randomly generated with mean μ = 7.0 and standard deviation σ = 1.5 while the arrival times at home are randomly generated with the mean μ = 18.0 and the standard deviation σ = 3.0. Based on reference [36], the random values for the daily driven distance is generated using a lognormal distribution with mean μ = 3.2 and standard deviation σ = 0.88. The probability distribution function (PDF) of the departure time, the arrival time and the daily driven distance are generated using the MATLAB probability density function shown in Figure 4 and Figure 5, respectively.
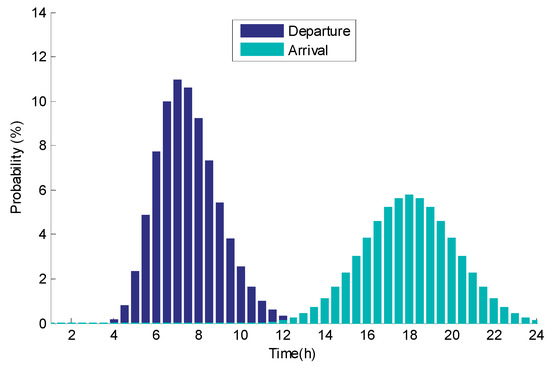
Figure 4.
Probability of departure time from home and arrival time at home.
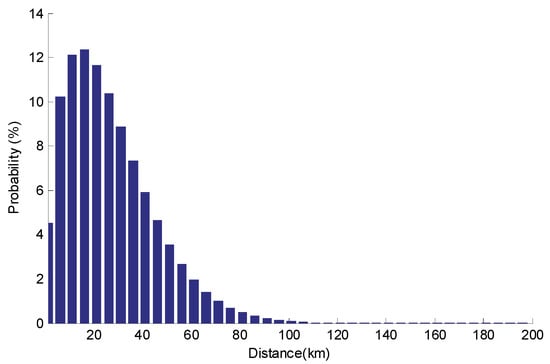
Figure 5.
Probability of the EV daily driven distance.
The village baseload at each house in summer and winter cases, EV model and its initial of each EV battery are shown in Table 3. The baseload power of each house is obtained from the monthly electricity bill while the daily load profile of an individual house is generated using the similar load pattern of the transformer. The peak load of each house is multiplied with a normalized curve of the transformer daily load profile to represent the daily load curve of each house.
Table 3.
Baseload point and EV dataset.
4.3. Simulation and Scenarios
Based on the village network topology, EV models and the studied data as mentioned before, the power flow analysis was computed using the Newton Raphson method. Next, MATLAB is used for simulation to demonstrate the ability of the proposed optimization. To evaluate the transformer loss of life, the transformer thermal parameters used in this study are listed in Table 4. For simulations, existing EV datasets for both summer and winter seasons are used. Finally, the numerical simulations were done for 3 scenarios as explained below:
Table 4.
Transformer parameters data from [37].
- Case I: Dump charging (uncontrolled charging), each EV starts charging immediately when it arrives at home with a rated charging power without V2G operation.
- Case II: TOU charging (EV owner’s perspective), every EV will be delayed for charging for low electricity TOU rates. In addition, the discharging mode will be used at the high TOU rate period.
- Case III: Optimal charging, all EVs are aggregated to charge and discharge with the proposed method.
4.4. Impact on Transformer Aging
Bar graphs in Figure 6 illustrate the EVs charging scheduling in 24 h for each scenario. The transformer power was calculated using Equation (4) which is shown its load profiles in Figure 7. In addition, the transformer aging acceleration factor () profile versus the EV’s charging load is presented in Figure 8, and the correlation of the transformer loss of life () and the winding hottest-spot temperature () is shown in Figure 9.
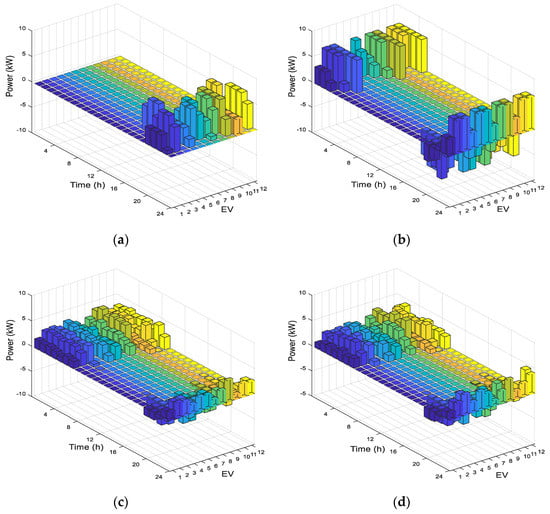
Figure 6.
EVs charging scheduling; dump charging (a). time of use (TOU) charging (b). optimal charging in summer (c) and in winter (d).
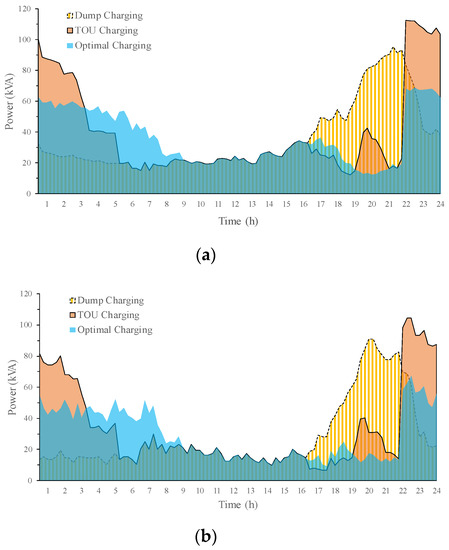
Figure 7.
Transformer load profiles in summer (a) and in winter (b).
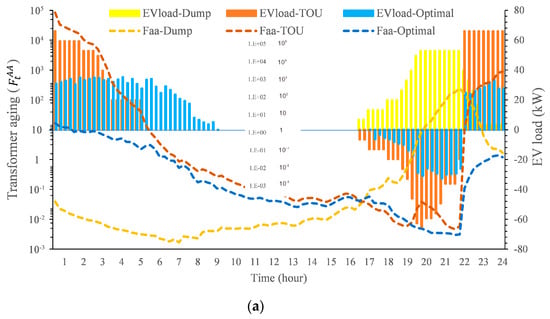
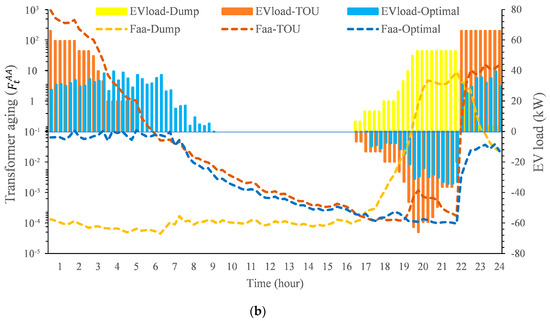
Figure 8.
Transformer aging acceleration factor () versus EVs charging load in summer (a) and winter (b).
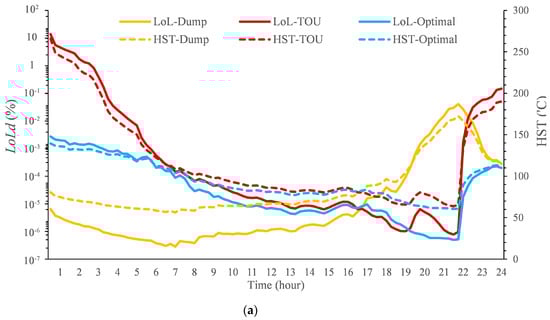
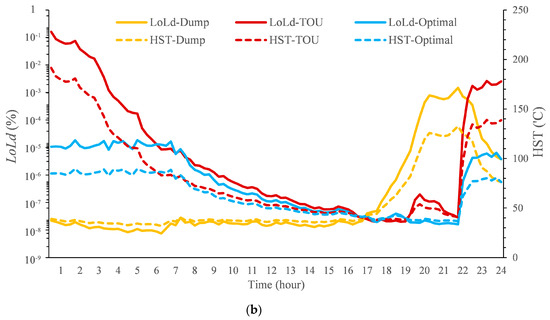
Figure 9.
Correlation of the transformer loss of life () and the transformer winding hottest-spot temperature (HST) in summer (a) and winter (b).
In EV charging with the dump charging method, results show that when the EVs are connected to the village network with uncontrolled charging, the transformer peak load is increased to 95.56 kVA (1.91 p.u.) due to dumping of the EVs charging load during a day in summer and 90.87 kVA (1.82 p.u.) in winter. Thus, the winding hottest-spot temperature exceeds 110 °C, as a result, is more than 1 for both the summer and winter days. Under this condition, the transformer experiences accelerated aging and its lifetime is reduced. In Case 2, when EVs are charged following TOU charging, this reflects the basic preference of EV owners who want to make profit by the energy arbitrage. Without any optimization, the EV that has the capability to discharge its stored energy is operated in V2G mode during the high rate period (e.g., 9 a.m. to 10 p.m.). Consequently, the large amount of EV discharging (V2G) can cause reverse power flow between 7 p.m.–10 p.m., which in turn, may create overvoltage related issues in the village network. Moreover, all EVs status will change to dump charge when the tariff rate is low, which occurs at 10 p.m. This leads to the transformer peak load at 112.78 kVA (2.26 p.u.) during a summer day and 104.62 kVA (2.09 p.u.) during a winter day. This condition rapidly increases the winding hottest-spot temperature over 250 °C during a summer day and over 190 °C during a winter day. Consequently, it leads to the extreme raising of the accelerated aging factor, which ultimately reduces the transformer lifetime. As a result, the insulation is gassed, which can lead to an explosion.
In the case of optimal charging, results show that the proposed EV charging method using optimal scheduling of both charging and discharging can minimize the transformer peak load to 68.81 kVA (1.38 p.u.) in summer and 65.22 kVA (1.30 p.u.) in winter. In addition, the transformer winding hottest-spot temperature is lower than 140 °C during the day of summer and lower than 110 °C during the day of winter. Accordingly, declines indicating that the proposed optimization can prolong the transformer aging. Results of transformer loading and its winding hottest spot temperature were evaluated and the summary of the transformer aging including the equivalent of the aging acceleration factor and the percent of daily transformer loss of life for each scenario in summer and winter season are presented in Table 5.
Table 5.
Transformer aging evaluation.
The TOU charging method results in the highest of the equivalent of the aging acceleration factor and the percent transformer loss of life, followed by the dump charging method. Compared to TOU and dump charging, the proposed optimal charging method can reduce the aging acceleration factor with the lowest percent transformer loss of life.
4.5. Cost Evaluation
This subsection presents the simulation results estimating the penalty cost of the EV owners’ arbitrage benefit loss, peak demand cost, power loss cost and the transformer loss of life cost under all three scenarios. All these costs are evaluated based on per day and the daily energy arbitrage () values that are obtained from the TOU charging method case. In addition, the transformer capital cost () is set to be 166.1 $/kVA [19]. A summary of the economic cost evaluation is presented in Table 6. Also, the efficiency improvement of the proposed optimization method based on the cost evaluation compared with the dump charging method and TOU charging method is demonstrated in Figure 10.
Table 6.
Economic cost evaluation.
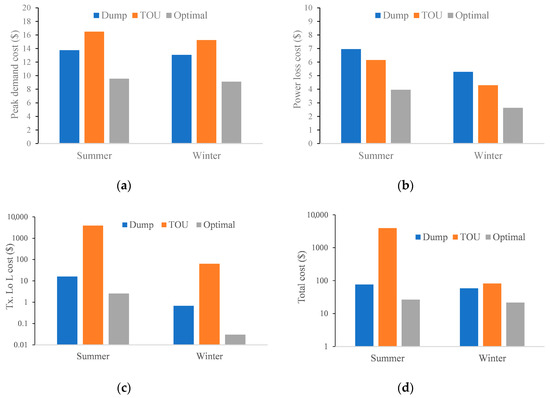
Figure 10.
Efficiency improvement of the proposed method based on the cost reduction; peak demand cost (a), power loss cost (b), transformer loss of life cost (c) and the total cost (d).
In the case of dump charging, the penalty cost and the power loss cost are the highest when compared to the other charging methods because the energy arbitrage opportunity by V2G operation is not considered. The TOU charging case shows none of the penalty costs, which means EV owners can profit from the energy arbitrage using the V2G mode, but the peak demand cost, the transformer loss of life cost and the total cost are the highest. For the EV optimal charging case, results show that it induces a penalty cost; however, this value is lower than the dump charging case. This is because, in the proposed optimization method, we have included objective and constraint functions to minimize peak load, power loss and slow down the transformer aging. Hence, the transformer loss of life by the optimized case is the lowest among the EV charging cases. It can be observed that in both summer and winter the costs of peak demand, power loss and the transformer loss of life of the proposed optimized EV charging are the lowest compared to other charging methods. Also, the overall cost of the optimal charging method in both season cases is the lowest. However, due to the addition of penalty cost being presented, the EV owners’ arbitrage benefit loss. Thus, the DSO or ISO could manage this cost with the suitable electricity tariff program to motivate the EV owner to participate in this optimal charging strategy.
5. Conclusions
This paper presents the optimization of the EV charging method in an urban village network considering energy arbitrage and network operating cost. The focus of this optimization work is to minimize the loss of the EV owner’s benefit, peak demand cost, power loss cost, and the transformer aging cost. The loss of the EV owner’s benefit from battery energy arbitrage is introduced as the penalty cost function. The proposed optimization process includes distribution transformer aging affected by EV charging load. Also, the transformer loss of life model is formulated based on the winding hottest-spot temperature rising mechanism. Besides, the network operation limitations such as bus voltage, branch current and the transformer loading are set as constraints and are obtained from the power flow analysis result. To validate the outcomes of the proposed optimal EV charging method, a typical distribution radial network in Udon Thani, Thailand with real village baseload and the local ambient temperature was selected for simulations.
The numerical simulations were undertaken using MATLAB. Results show that the negative impacts due to the EVs dump charging and the TOU charging method on distribution network that consists of the network overloading, increased power loss, and the transformer aging, can be mitigated by the proposed optimization charging strategy. Also, the proposed optimization of the EVs charging method presents the lowest of the peak demand cost, power loss cost and the transformer loss of life cost when compared with other charging methods. In addition, the result shows that the loss of the EV owner’s energy arbitrage benefit can be reduced and the overall network operation cost is minimized. The simulation results prove that the proposed optimization method based on the genetic algorithm works efficiently for a variety of EV models, different initial EV battery energies, arrival times and departure times. Moreover, the robustness of the algorithm is presented when it performs with the different seasons of the study village case. Where the proposed optimization EVs charging shows high performance in both season cases. In summary, the application of the proposed optimal EV charging strategy can benefit both the EV owner and the distribution system operator (DSO) or independent system operator (ISO).
Author Contributions
Conceptualization, C.S. and R.C.; methodology, C.S. and R.C.; software, C.S.; validation, C.S. and R.C..; formal analysis, C.S., P.G. and R.C.; investigation, P.G. and R.C; resources, C.S. and R.C.; data curation, C.S.; writing—original draft preparation, C.S.; writing—review and editing, P.G. and R.C; visualization, C.S., P.G., A.S. and R.C.; supervision, A.S. and R.C.; project administration, R.C.; funding acquisition, R.C. All authors have read and agreed to the published version of the manuscript.
Funding
This research was funded by the Young Researcher Development project of Khon Kaen University and the Faculty of Engineering, Khon Kaen University under grant number: Ph.D.Ee -1/2562.
Acknowledgments
Authors would like to acknowledge the Provincial Electricity Authority (PEA) to support all data used in this work.
Conflicts of Interest
The authors declare no conflict of interest.
References
- International Energy Agency (IEA). Global EV Outlook 2019-Scaling-Up the Transition to Electric Mobility. Available online: https://www.iea.org/reports/global-ev-outlook-2019 (accessed on 15 May 2019).
- Singh, B.N.; Sun, S.; Okoye, F.; Roy, P. Urban sustainability through emerging technologies. In Proceedings of the 2017 IEEE Canada International Humanitarian Technology Conference (IHTC), Toronto, ON, Canada, 21–22 July 2017; pp. 161–166. [Google Scholar] [CrossRef]
- Sanchari, D.; Kari, T.; Karuna, K.; Pinakeshwar, M. Impact of Electric Vehicle Charging Station Load on Distribution Network. Energies 2018, 11, 178. [Google Scholar] [CrossRef]
- Haiyang, L.; Yiling, L.; Qie, S.; Rui, X.; Hailong, L.; Ronald, W. The impact of electric vehicle penetration and charging patterns on the management of energy hub—A multi-agent system simulation. Appl. Energy 2018, 230, 189–206. [Google Scholar] [CrossRef]
- Jairo, Q.; Luis, O.; Sahban, A.; Tim, B. Control of EV Charging Points for Thermal and Voltage Management of LV Networks. IEEE Trans. Power Syst. 2015, 4, 1–11. [Google Scholar] [CrossRef]
- Awadallah, M.A.; Singh, B.N.; Venkatesh, B. Impact of EV Charger Load on Distribution Network Capacity: A Case Study in Toronto. Can. J. Electr. Comput. Eng. 2016, 39, 268–273. [Google Scholar] [CrossRef]
- Satarworn, S.; Hoonchareon, N. Impact of EV home charger on distribution transformer overloading in an urban area. In Proceedings of the 2017 14th International Conference on Electrical Engineering/Electronics, Computer, Telecommunications and Information Technology (ECTI-CON), Phuket, Thailand, 27–30 June 2017; pp. 469–472. [Google Scholar] [CrossRef]
- El-Battawy, A.; Basta, B.; Morsi, W.G. Impact of Integrating Electric Vehicles and Rooftop Solar Photovoltaic on Transformer’s Aging Considering the Effect of Ambient Temperature. In Proceedings of the 2018 IEEE Electrical Power and Energy Conference (EPEC), Toronto, ON, Canada, 10–11 October 2018. [Google Scholar] [CrossRef]
- Blasius, E.; Wang, Z. Effects of charging battery electric vehicles on local grid regarding standardized load profile in administration sector. Appl. Energy 2018, 224, 330–339. [Google Scholar] [CrossRef]
- Ramos Muñoz, E.; Razeghi, G.; Zhang, L.; Jabbari, F. Electric vehicle charging algorithms for coordination of the grid and distribution transformer levels. Energy 2016, 113, 930–942. [Google Scholar] [CrossRef]
- Alonso, M.; Amaris, H.; Germain, J.G.; Galan, J.M. Optimal charging scheduling of electric vehicles in smart grids by heuristic algorithms. Energies 2014, 7, 2449–2475. [Google Scholar] [CrossRef]
- Nguvauva, T.; Kittipiyakul, S. Distributed Scheduling of Electric Vehicles in a Residential Area in Thailand. In Proceedings of the 2018 10th International Conference on Knowledge and Smart Technology (KST), Chiang Mai, Thailand, 31 January–3 February 2018; pp. 287–292. [Google Scholar] [CrossRef]
- Martin, S.; Jonas, S.; Elpiniki, A.; Marco, P. Optimized Integration of Electric Vehicles in Low Voltage Distribution Grids. Energies 2019, 12, 4059. [Google Scholar] [CrossRef]
- Hoog, J.; Alpcan, T.; Brazil, M.; Thomas, D.A.; Mareels, I. Optimal Charging of Electric Vehicles Taking Distribution Network Constraints into Account. IEEE Trans. Power Syst. 2015, 30, 365–375. [Google Scholar] [CrossRef]
- Affonso, C.M.; Kezunovic, M. Technical and economic impact of PV-BESS charging station on transformer life: A case study. IEEE Trans. Smart Grid 2019, 10, 4683–4692. [Google Scholar] [CrossRef]
- El-Bayeh, C.Z.; Mougharbel, I.; Asber, D.; Saad, M.; Chandra, A.; Lefebvre, S. Novel approach for optimizing the transformer’s critical power limit. IEEE Access 2018, 6, 55870–55882. [Google Scholar] [CrossRef]
- Olsen, J.; Sarker, R.; Ortega-Vazquez, A. Optimal Penetration of Home Energy Management Systems in Distribution Networks Considering Transformer Aging. IEEE Trans. Smart Grid 2018, 9, 3330–3340. [Google Scholar] [CrossRef]
- Sanchez, A.; Romero, A.; Rattá, G.; Rivera, S. Smart charging of PEVs to reduce the power transformer loss of life. In Proceedings of the 2017 IEEE PES Innovative Smart Grid Technologies Conference-Latin America (ISGT Latin America), Quito, Ecuador, 20–22 September 2017; pp. 1–6. [Google Scholar] [CrossRef]
- Sarker, M.R.; Olsen, D.J.; Ortega-Vazquez, M.A. Co-Optimization of Distribution Transformer Aging and Energy Arbitrage Using Electric Vehicles. IEEE Trans. Smart Grid 2017, 8, 2712–2722. [Google Scholar] [CrossRef]
- Beaude, O.; Lasaulce, S.; Hennebel, M.; Mohand-kaci, I. Reducing the Impact of EV Charging Operations on the Distribution Network. IEEE Trans. Smart Grid 2016, 7, 2666–2679. [Google Scholar] [CrossRef]
- Sardi, J.; Mithulananthan, N.; Gallagher, M.; Quoc, D. Multiple Community Energy Storage Planning in Distribution Networks Using a Cost-Benefit Analysis. Appl. Energy 2017, 190, 453–463. [Google Scholar] [CrossRef]
- IEEE Power & Energy Society. Guide for Loading Mineral-Oil-Immersed Transformers and Step-Voltage Regulators; IEEE Standard C57.91-2011 (Revision of IEEE Standard C57.91-1995); IEEE Standards Association: New York, NY, USA, 2012. [Google Scholar] [CrossRef]
- Hussain, S.; Ali, M.U.; Park, G.; Nengroo, S.H.; Khan, M.A.; Kim, H. A Real-Time Bi-Adaptive Controller-Based Energy Management System for Battery–Supercapacitor Hybrid Electric Vehicles. Energies 2019, 12, 4662. [Google Scholar] [CrossRef]
- Zhou, S.; Yuntao, W.; Qichao, X.; Minrui, F.; Yu-Chu, T.; Ning, Z. A Secure Charging Scheme for Electric Vehicles with Smart Communities in Energy Blockchain. IEEE Internet Things J. 2019, 6, 4601–4613. [Google Scholar] [CrossRef]
- Aoun, A.; Ibrahim, H.; Ghandour, M.; Ilinca, A. Supply Side Management vs. Demand Side Management of a Residential Microgrid Equipped with an Electric Vehicle in a Dual Tari Scheme. Energies 2019, 12, 4351. [Google Scholar] [CrossRef]
- Urooj, A.; Muhammad, B.R.; Ameena, S.A.; Atiq, U.R.; Ihsan, A.; Amer, A.; Abdullah, A. Smart Energy Optimization Using Heuristic Algorithm in Smart Grid with Integration of Solar Energy Sources. Energies 2018, 11, 3494. [Google Scholar] [CrossRef]
- Mehboob, N.; Restrepo, M.; Cañizares, A.; Rosenberg, C.; Kazerani, M. Smart operation of electric vehicles with four-quadrant chargers considering uncertainties. IEEE Trans. Smart Grid 2019, 10, 2999–3009. [Google Scholar] [CrossRef]
- Provincial Electricity Authority (PEA), Thailand. Available online: https://www.pea.co.th/en (accessed on 1 September 2019).
- Thai Meteorological Department (TMD), Thailand. Available online: https://www.tmd.go.th/en (accessed on 1 September 2019).
- Electric Vehicle Sales: Facts & Figures; Edison Electric Institute (EEI): Washington, DC, USA, 2019; Available online: https://www.eei.org/issuesandpolicy/electrictransportation/Documents/FINAL_EV_Sales_Update_April2019.pdf (accessed on 1 September 2019).
- Chevy Volt Plug in Hybrid. Available online: https://www.chevrolet.com/electric/volt-plug-in-hybrid (accessed on 1 September 2019).
- 2019 Nissan Leaf. Available online: https://www.nissanusa.com/vehicles/electric-cars/leaf.html (accessed on 1 September 2019).
- Tesla Model 3. Available online: https://www.tesla.com/model3 (accessed on 1 September 2019).
- Electricity-Tariff 2018. Provincial Electricity Authority (PEA), Thailand. Available online: https://www.pea.co.th/en/electricity-tariffs (accessed on 1 September 2019).
- 2009 National Household Travel Survey (NHTS); USA Department Transportation: Washington, DC, USA, 2019. Available online: www.nhts.ornl.gov (accessed on 1 September 2019).
- Li, Y.; Xie, K.; Wang, L.; Xiang, Y. The impact of PHEVs charging and network topology optimization on bulk power system reliability. Electr. Power Syst. Res. 2018, 163, 85–97. [Google Scholar] [CrossRef]
- Provincial Electricity Authority (PEA). Single Phase-Transformer Specification for 22 kV 50 Hz Distribution System; Provincial Electricity Authority (PEA): Bangkok, Thailand, 2018. [Google Scholar]


© 2020 by the authors. Licensee MDPI, Basel, Switzerland. This article is an open access article distributed under the terms and conditions of the Creative Commons Attribution (CC BY) license (http://creativecommons.org/licenses/by/4.0/).