Article

Development of Shale Gas Prediction Models for Long-Term Production and Economics Based on Early Production Data in Barnett Reservoir

1
Department of Energy Resources Engineering, Inha University, Incheon 22212, Korea
2
Geological Survey of Canada, Calgary, Alberta, AB T2L 2A7, Canada
*
Author to whom correspondence should be addressed.
Energies 2020, 13(2), 424; https://doi.org/10.3390/en13020424
Submission received: 17 December 2019 / Revised: 11 January 2020 / Accepted: 13 January 2020 / Published: 15 January 2020

Abstract

:
This study examined the relationship between the early production data and the long-term performance of shale gas wells, including the estimated ultimate recovery (EUR) and economics. The investigated early production data are peak gas production rate, 3-, 6-, 12-, 18-, and 24-month cumulative gas production (CGP). Based on production data analysis of 485 reservoir simulation datasets, CGP at 12 months (CGP_12m) was selected as a key input parameter to predict a long-term shale gas well’s performance in terms of the EUR and net present value (NPV) for a given well. The developed prediction models were then validated using the field production data from 164 wells which have more than 10 years of production history in Barnett Shale, USA. The validation results showed strong correlations between the predicted data and field data. This suggests that the proposed models can predict the shale gas production and economics reliably in Barnett shale area. Only a short history of production (one year) can be used to estimate the EUR and NPV of various production periods for a gas well. Moreover, the proposed prediction models are consistently applied for young wells with short production histories and lack of reservoir and hydraulic fracturing data.

Graphical Abstract

1. Introduction

Shale gas has attracted considerable attention worldwide in recent years because of its high potential for current and future clean energy supply. Horizontal well drilling and hydraulic fracturing technologies have been applied to increase productivity from extremely low permeability shale reservoirs. An evaluation of the shale gas potential production and economics is essential because the performance is quite different for various reservoir quality and completion designs. A range of techniques can be used to evaluate and predict the performance of oil or gas wells. Geng et al. [1] proposed a model for shale gas production forecasting based on the continuum medium theory (organic/inorganic matric) and discrete fracture model (fracture system). Wang et al. [2] developed a deep neural network to predict cumulative gas production of shale gas wells in six and eighteen months based on geological and well-hydraulic fracturing design parameters. Various approaches to production data analysis have been proposed to evaluate and predict the performance of shale gas wells and reservoirs. Xu et al. [3] used the linear dual porosity type curve analysis technique to estimate the reservoir properties and predict gas production from the Eagle Ford shale reservoir, USA. Ikewun and Ahmadi [4] used simulation models and decline curve analysis (DCA) to predict the production of the Eagle Ford reservoir, USA and other young producing shale reservoirs with short production histories from 9 to 57 months. Ilk et al. [5] derived a function for data diagnostics and constructed a base well/reservoir model using static data. The extended base model and rate-time decline relations were then used to predict the well performance. Sun et al. [6] predicted the drainage area and EUR of Haynesville shale, USA using an integrated production analysis approach which is a combination of techniques, including the flowing material balance, pressure transient analysis, rate transient analysis, decline curve analysis, and analytical/numerical reservoir simulations. Stewart [7] proposed a workflow of production data analysis and an analytical model for shale gas EUR prediction based on specified scenarios for the flowing bottom-hole pressure (or the wellhead pressure). In general, the techniques used in the literature studies are effective for predicting the performance of wells in a short-term of production (shorter than five years). Those techniques may yield erroneous results with a wide range of uncertainty in forecasting the long-term performance of shale gas well such as EUR and NPV at 10 years, 15 years, and 20 years. On the other hands, some studies proposed production prediction models based on geological and hydraulic fracturing parameters which cannot predict production when those data are not available [1,2]. In fact, the decline curve analysis is an effective technique for predicting oil and gas production using only production data. The DCA technique has been being applied successfully for production prediction of many shale gas reservoirs [8,9,10,11,12]. However, it is not efficiently applied for the case of limited production data. Gupta et al. [13] proposed linear equations for predicting cumulative gas production at 4, 5, 6, and 7 years production based on 1-, 6-, 12-, and 24-month production data. However, the linear equations may not yield predictive results for forecasting long-term production longer than 10 years. A new method using only early production data, therefore, is necessary for long-term performance prediction of a shale gas reservoir.
The performance of a well is related strongly to the production rate, particularly for a shale gas well whose production rate is featured by a high initial decline rate after peak production [14,15]. Therefore, early production data can be used as a key parameter for predicting the performance of a shale gas well at the end of life. In this study, production data were analyzed to define the relationship between the early production data and the shale gas well performance at various production times (at 10, 15, and 20 years) using simulation results. Prediction models based on the peak production rate or EUR during the early production periods were developed to predict the EUR and NPV of long-term production periods of a shale gas well applying univariate polynomial model. The prediction models were then validated using field production data to check for the applicability of the proposed models under field conditions.

2. Methodology

The production of the early period from a shale gas well occupies a large portion of the whole life cumulative production. In addition, the NPV of an oil/gas project depends mainly on the early production period. This study examined the relationship between the early production data and whole life shale gas well performance, including EUR and NPV, through that prediction models were then developed for predicting the shale gas well performance. The early production data investigated in this study include the peak production rate and cumulative gas production at various production times (3, 6, 12, 18, and 24 months of production). The performance of a shale gas well to be predicted includes the EUR and NPV at 10, 15, and 20 years of production.
The development of shale performance prediction models consists of (1) building the prediction models from simulation production data, and (2) validating the defined prediction models using field production data (Figure 1). First, a reservoir model of a shale gas reservoir was built. Various simulation scenarios were modeled and simulated to generate production data which were then analyzed to determine the relationship between the early production data and EUR and NPV at a specified time.
The early production data point showing good agreement with the EUR and NPV at a specified time can be used as a key parameter to predict the EUR and NPV at that time. Prediction models based univariate polynomial model was developed to express the relationship between the EUR (in standard cubic meter-scm) or NPV (in US dollar-USD) at 10, 15, and 20 years production and the early production data as follows:
E U R = a 0 + i = 1 m a i x i   ( scm )
N P V = b 0 + j = 1 n b j x j   ( USD )
in which, x is one of the early production data including peak production rate (PR), CGP at 3 months (CGP3m), CGP at 6 months (CGP6m), CGP at 12 months (CGP12m), CGP at 18 months (CGP18m), and CGP at 24 months (CGP24m); m and n are the highest order of the polynomial model for EUR and NPV, respectively. Values of the parameters a0, a1, a2, …, am and b0, b1, b2, …, bn are found by minimizing the error between the predicted and measured value of EUR and NPV:
S S E = i = 1 k ( p r e d i c t e d v a l u e i m e a s u r e d v a l u e i ) 2
in which, SSE is sum of squared errors and k is the number of datasets used to develop the prediction models. Finally, the developed prediction models were validated using field production data to assess their applicability under field conditions.

3. Development of the Performance Prediction Models

3.1. Barnett Shale

The Barnett shale is located in the Fort Worth basin, Texas which is one of the largest shale gas play in the USA [16,17,18,19,20]. It was first discovered in 1981 with a high estimated reserve of over 5.6 trillion cubic meters of gas [16,18]. An approximation of 1.25 trillion cubic meters of gas can be technically recovered from the Barnett reservoir [19,20,21]. Compared to the other major shale gas plays in the USA, the Barnett shale has the lowest initial gas production rate and the lowest decline rate after 5 years of production [14,15]. The typical reservoir depth is 1980–2590 m, and the reservoir thickness is 30–180 m [22]. There are Upper and Lower Barnett separated by the Forestburg limestone, in which the Lower Barnett is thicker and contribute about 70–80% of the whole Barnett’s production [16,22]. In lithology aspect, the Barnett is rich in silica and poor in clay minerals making the formation brittle and easy to be hydraulically fractured [22].
In the latter subsections, prediction models are developed using simulation data and the model’s applicability is then examined using field production data. The objective function of the prediction model are long-term cumulative production and economics. A base reservoir model is first generated with input parameters of average reservoir values. Then various simulation cases are design based on the input parameters which are available data in the field condition using Latin Hypercube experimental design method. Each simulation case is simulated using Computer Modeling Group’s (CMG) GEM simulator to generate data for developing the prediction models. Influential parameters including peak production rate, cumulative gas production at 3, 6, 9, and 12 months which highly affect the objective function are determined as key input parameters of the prediction models. Prediction models are developed in terms of the influential parameters. Application of the developed prediction models in the field condition are then validated using field production data.

3.2. Numerical Simulation Model

In this study, a base homogeneous and isotropic shale gas reservoir was modeled by a three-dimensional reservoir model employing a Cartesian grid system of 96 × 20 × 15 (i, j, k) grid blocks (Figure 2a). The reservoir dimension was 1463 m (length) × 305 m (width) × 91 m (thickness). The input data for the base reservoir model simulation were average values of available data from the Barnett shale reservoir [23,24,25]. The CMG’s GEM simulator [26] was employed to simulate the base reservoir simulation case (reservoir depth = 2057.40 m, reservoir pressure = 22,063 kpa, reservoir temperature = 96.11 °C, matrix porosity = 0.05, matrix permeability = 0.00023 md, and initial gas saturation = 0.7). The amount of (monolayer) gas adsorbed in organic-rich shales was defined by the Langmuir equation [27], and has recently been applied in other shale gas researches [28,29,30]. Langmuir isotherm data for the Barnett shale are Langmuir volume of 3.54 scm/ton, Langmuir pressure of 8618 kpa, and rock density of 2.50 g/cm3 [23,24,25].
Figure 2b shows the base hydraulic fracture model. A horizontal well with a lateral length of 1219.20 m was drilled at the center of the reservoir and operated at 3447 kpa bottom hole pressure. Input data for hydraulic fracture model were fracture half-length of 106.68 m, fracture spacing of 121.92 m, and fracture conductivity of 1.52 md-m. The fracture conductivity was defined as the product of the fracture width and fracture permeability [31].
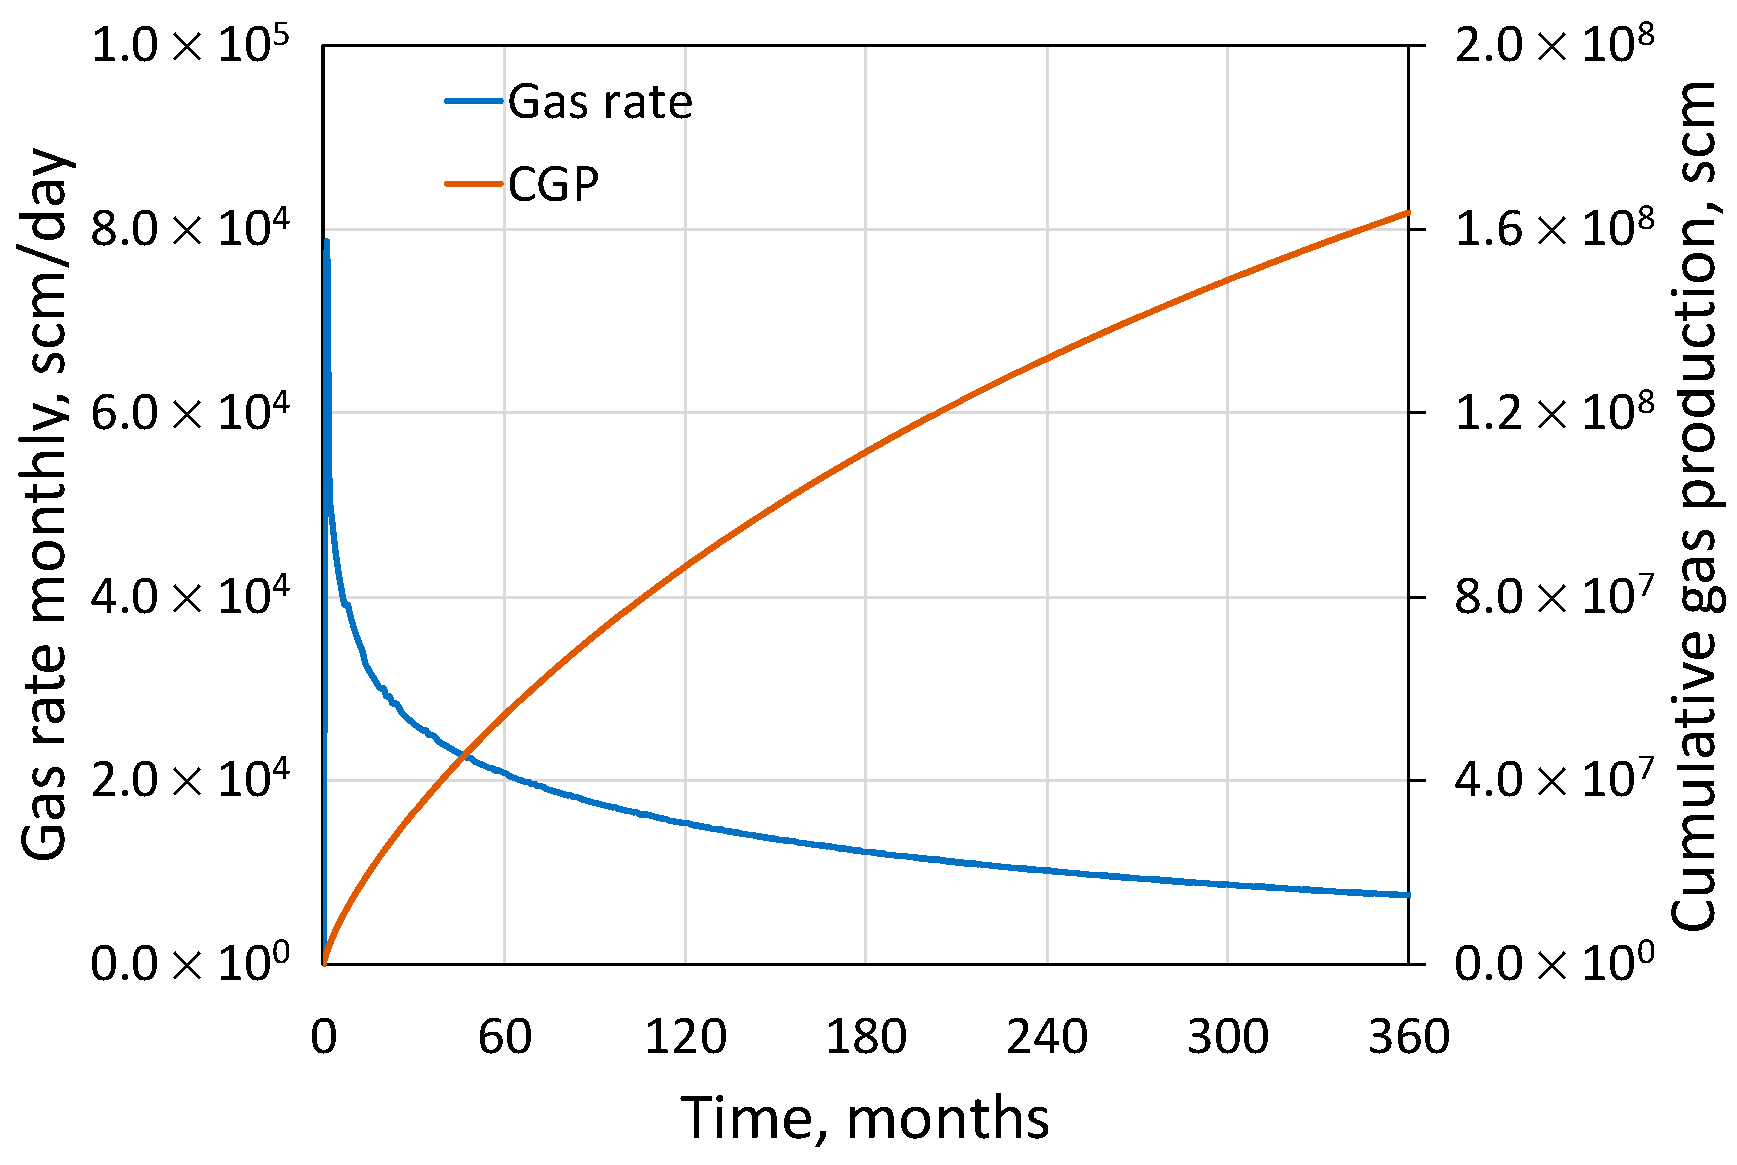
The shale gas reservoir model was simulated for production in 20 years with a high peak rate at the first month of production followed by a sharp decline after peak production (Figure 3).

3.3. Input Parameters for Reservoir Simulation

The key input parameters for shale gas reservoir simulation, including the reservoir parameters and completion parameters, were selected based on the available Barnett shale reservoir characteristics (Table 1) A total 485 simulation runs were generated using Latin Hypercube experimental design method under the support of CMG’s CMOST software [32]. Output of the simulation are monthly gas production rate and estimated ultimate recovery in 20 years.

3.4. Economic Evaluation Model

In this study, NPV was estimated using Equation (4) [25]:
N P V = ( 1 R o y a l t y ) j 1 n R e v e n u e j ( 1 + i ) j j 1 n O P E X j ( 1 + i ) j C A P E X ( USD )
where i is the interest rate; revenue is the production revenue which is calculated by product of gas production and gas price; OPEX is operating expense; and CAPEX is capital expense including the drilling and completion cost. The data used for calculating the NPV are from the studies by Schweitzer and Bilgesu [33] and Yu and Sepehrnoori [34] (Table 2).

3.5. Development of the Prediction Models

The performance prediction models are useful for predicting the EUR of a shale gas well, hence production potential of a specific area can be estimated. The EUR and production potential information are useful in field development planning stage; how many wells are drilled and when and where the wells need to be drilled [35,36,37,38,39].
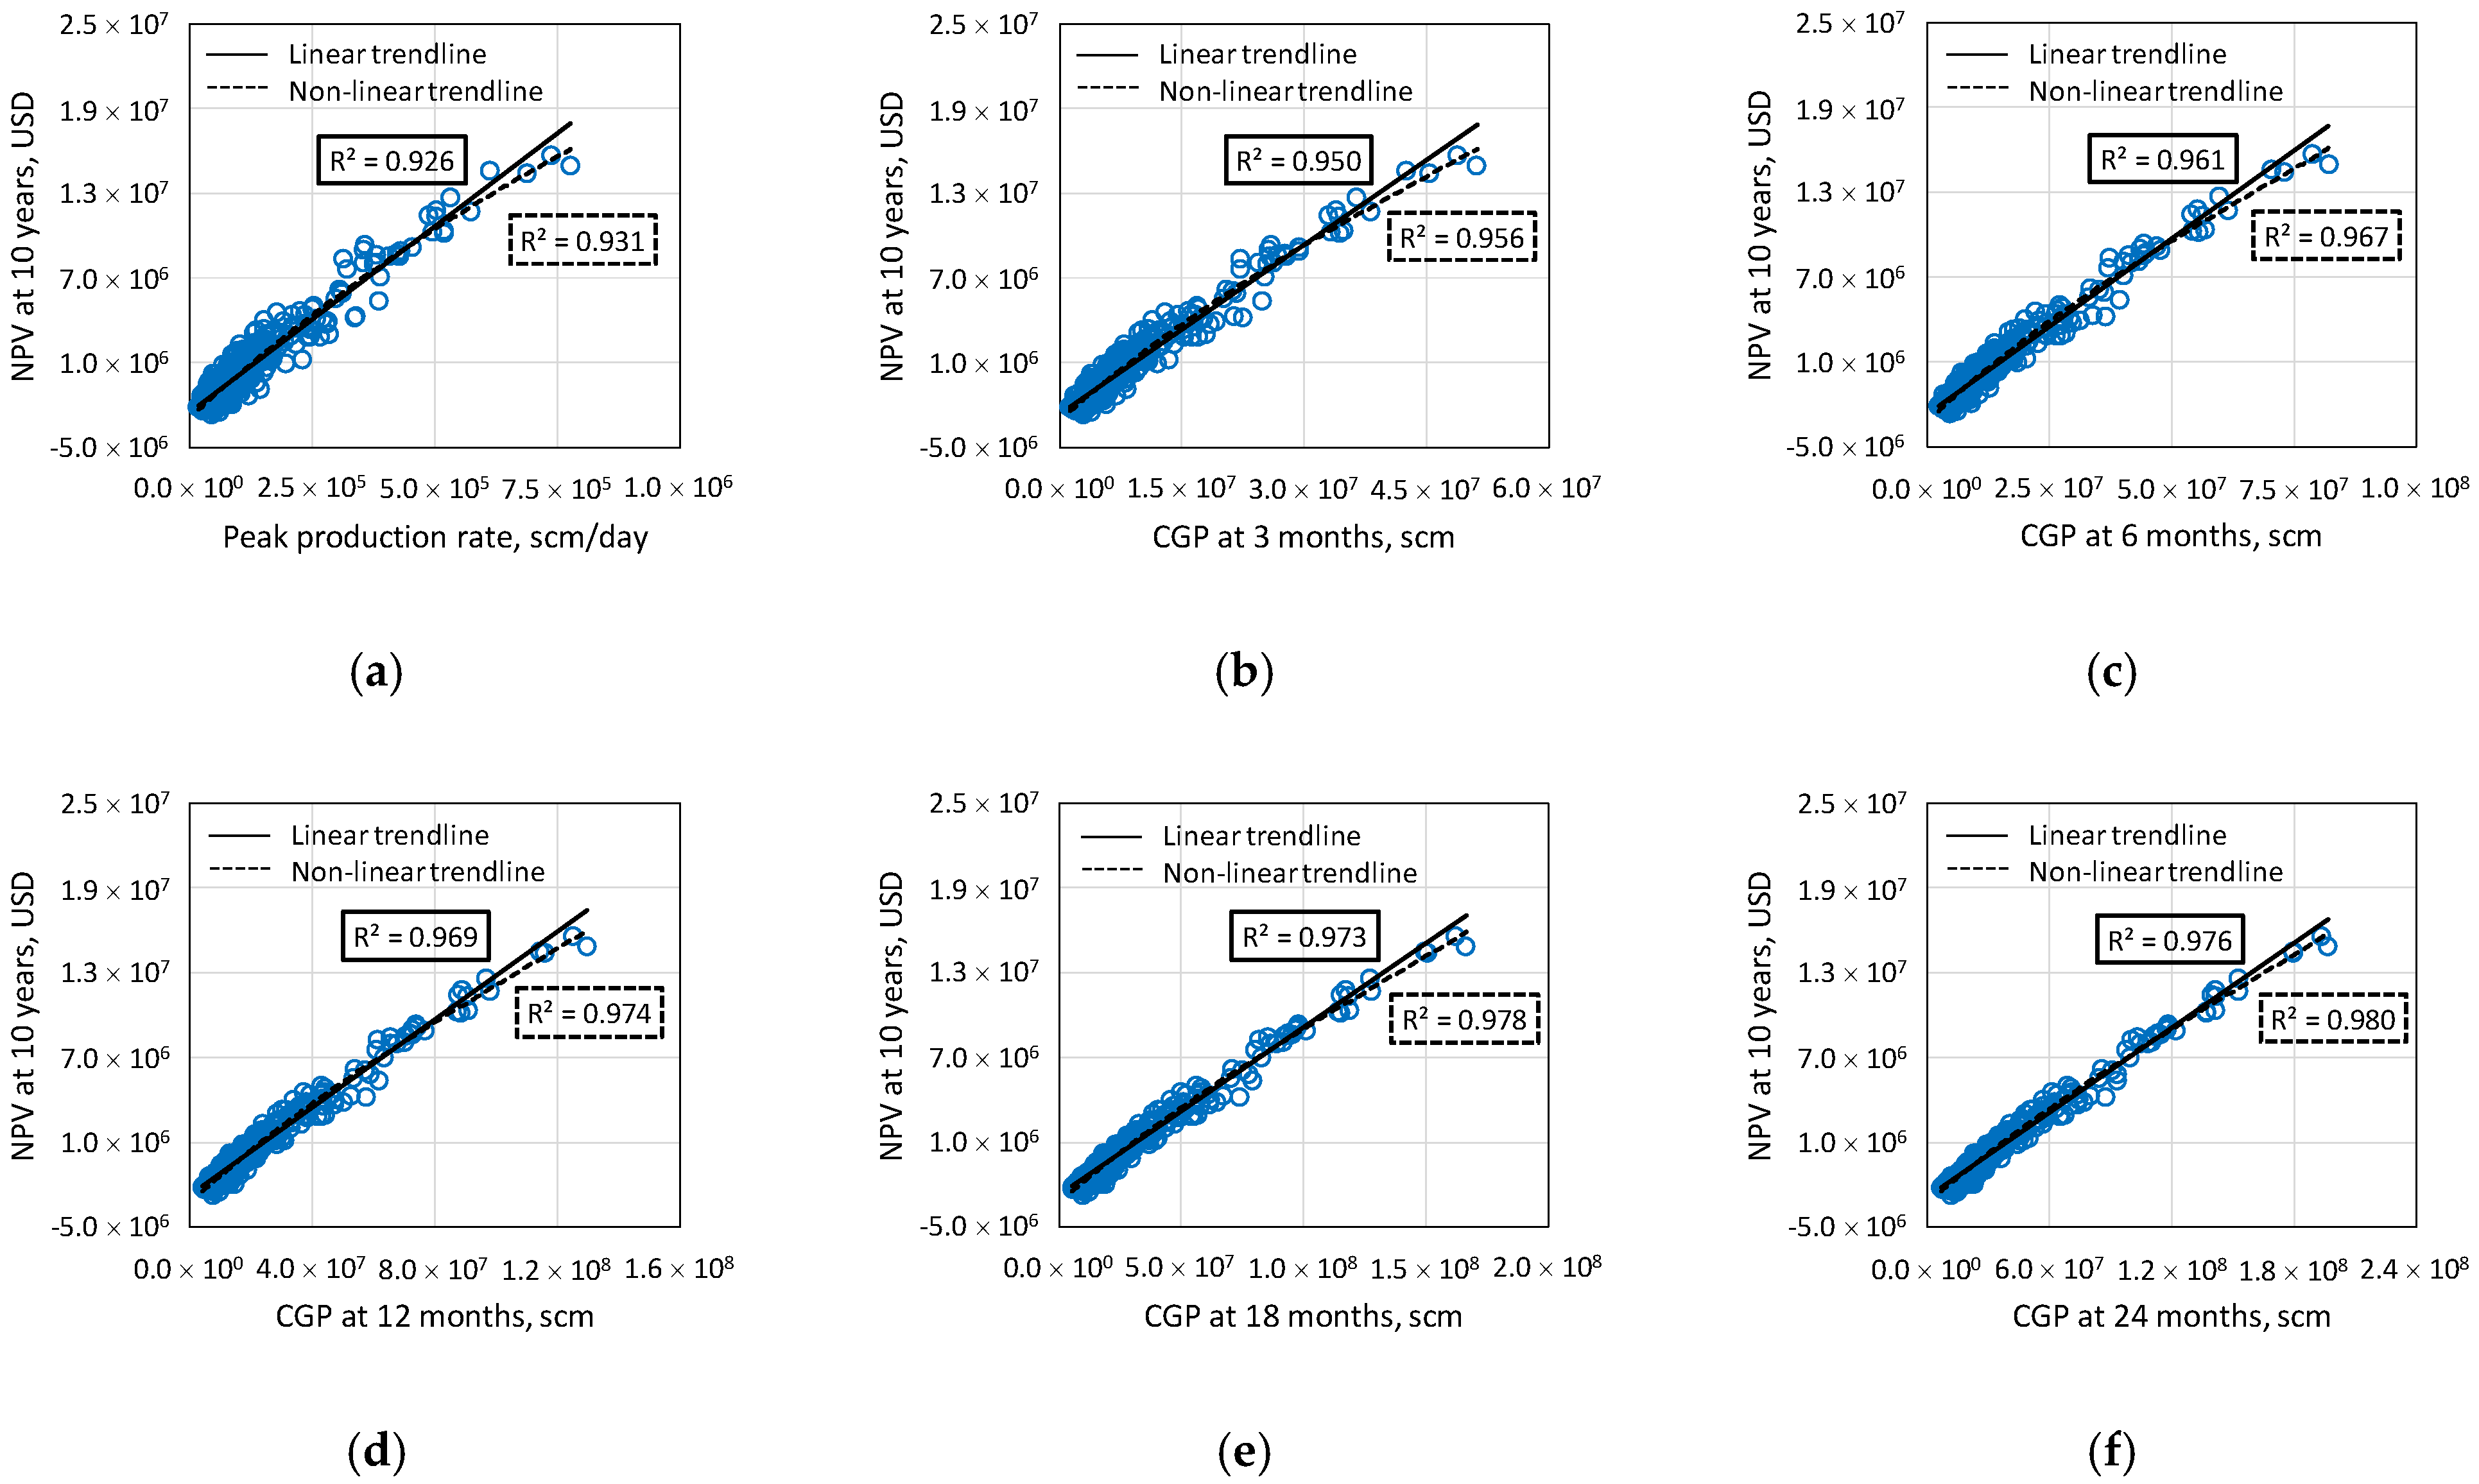
In this study, the relationships between the early production data (peak production rate, CGP at 3, 6, 12, 18, and 24 months production) and the shale gas well’s EUR and NPV at a specified time (10, 15, and 20 years production) were investigated. The simulation results show that the relationship between the early production data and the EUR and NPV at various production periods was not exactly a linear correlation as reported by Gupta et al. [13] (Figure 4 and Figure 5 show the relationship between 10-year shale gas performance and early production data). Similar results were also obtained for performance at longer production time (15 and 20 years).
A univariate third-order polynomial model is employed to express a correlation which is not simple but also not too complex as the relationship between the shale gas well’s performance and the early production data. The Equations (1) and (2) are re-written as follows:
E U R = a 0 + i = 1 3 a i x i   ( scm )
N P V = b 0 + j = 1 3 b j x j   ( USD )
Parameters among the early production data which have significant impact on the performance of a shale gas well were then determined for the development of prediction models. Based on the ANOVA results, a parameter whose corresponding P-value less than the significant level of 0.05 is the influential one [40,41] (Table 3) The results show that the performance of a shale gas well is correlated with peak production rate and CGP at 3 months in linear and quadratic relationship, respectively, while they are correlated with CGP at 6, 12, 18, and 24 months in cubic relationship.
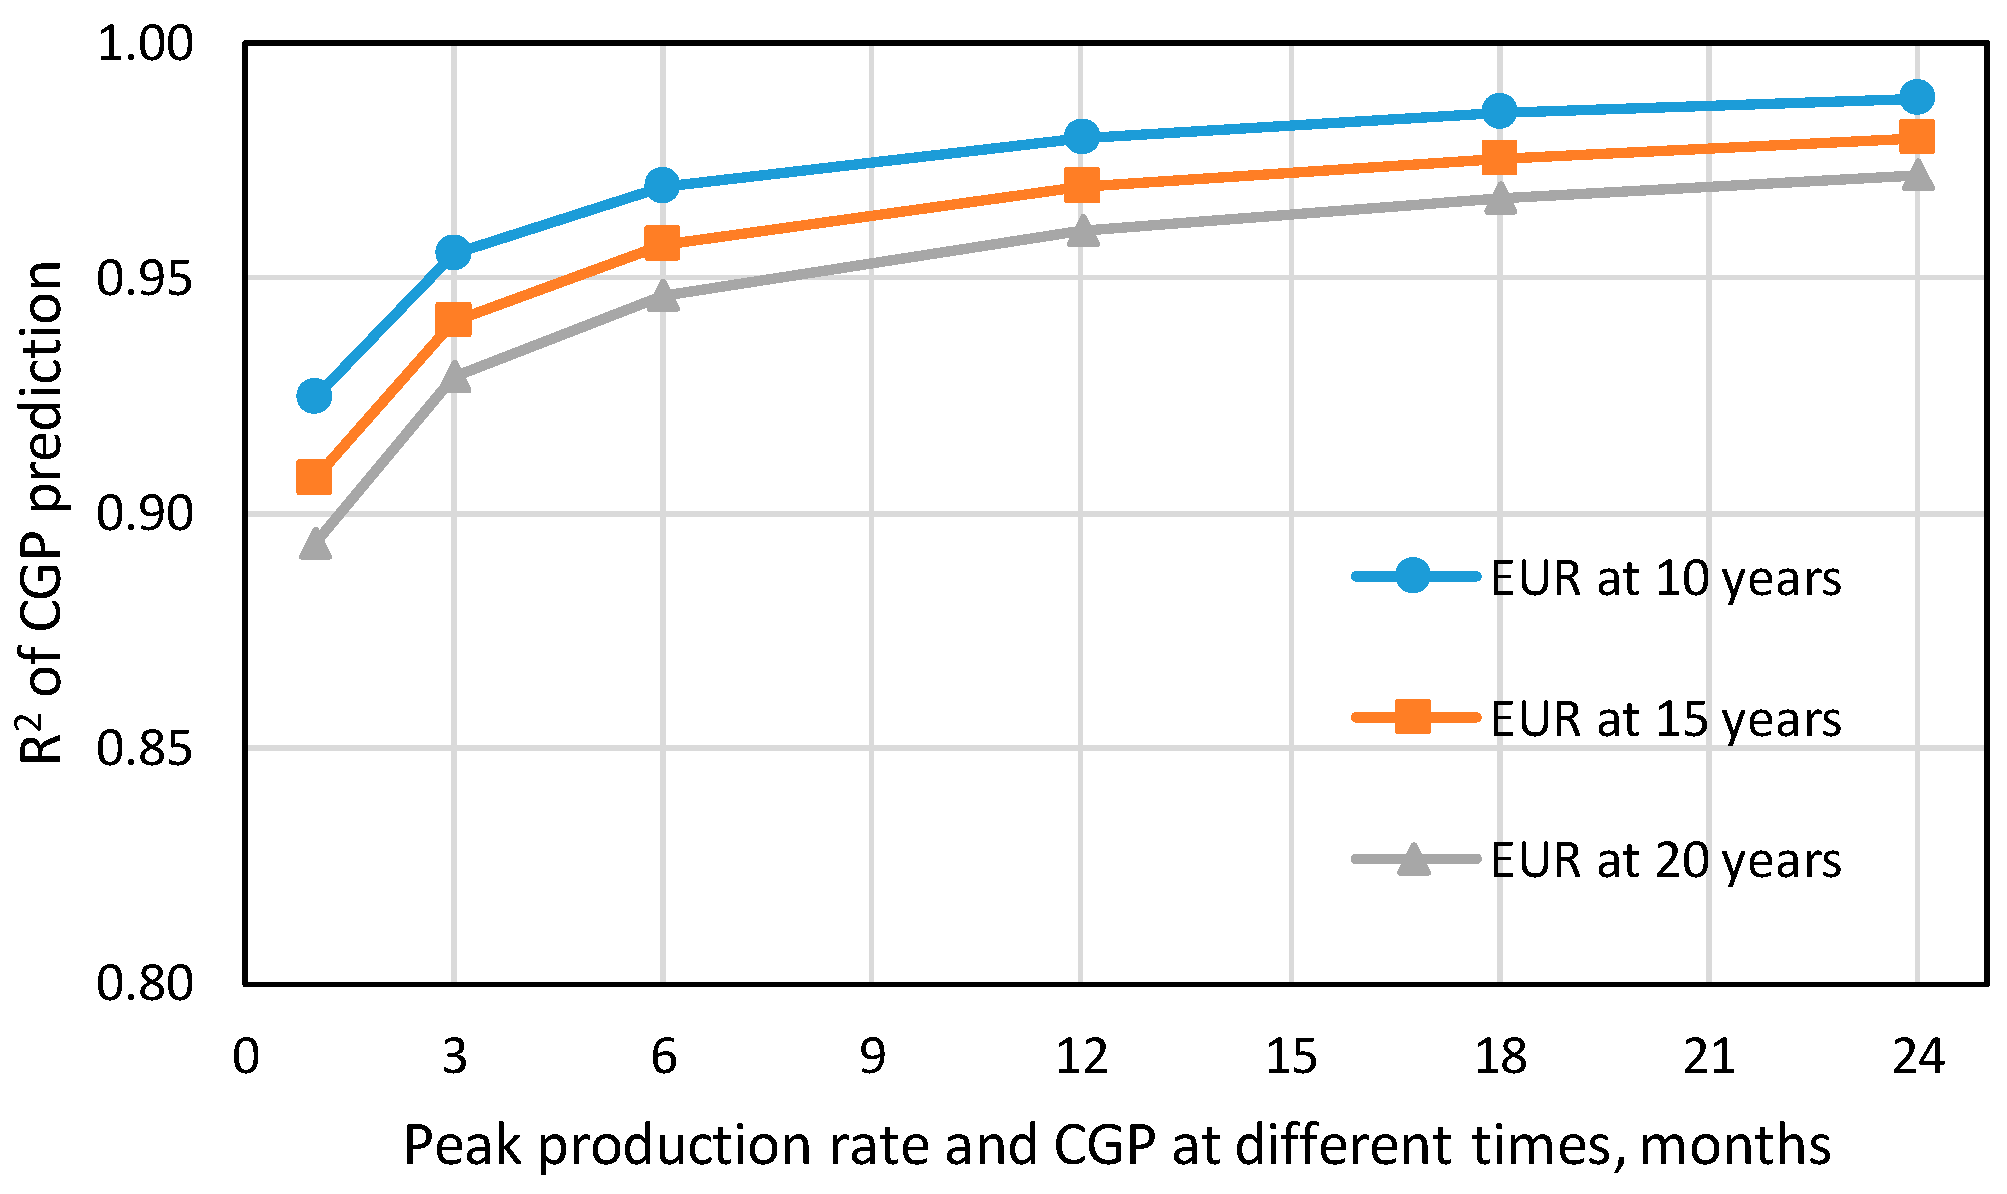
A third-order polynomial model was employed to develop shale gas prediction models in terms of influential parameters determined in Table 3. The coefficient of determination (R-squared) varied in the range of [0.924; 0.988] and [0.931; 0.980] for the prediction of EUR and NPV at 10 years production, respectively, and slightly decreased for the prediction of performance at longer production time (Figure 6 and Figure 7). The peak production rate had the lowest correlation with the shale gas performance, whereas the CGP at 24 months production had the strongest correlation with shale gas performance (Figure 6 and Figure 7).
Obtaining greater amounts of well data over longer time periods will, of course, provide better prediction results. However, the shorter production data used for performance prediction will give earlier updates required for field development plans. As such, the prediction models based on short-production data are useful for predicting performance of a new well with a short production history which then avoids waiting for longer production history to advance plans. In this study, using the CGP at 12 months to predict the EUR and NPV at a specified time yielded significantly higher coefficients of determination (R-squared) than that using the peak rate or CGP at 3 or 6 months. In contrast, the use of CGP at 18 months or 24 months for predicting the EUR and NPV did not improve R-squared values remarkably despite more production data being used. Therefore, it is reasonable to use the cumulative gas production at 12 months (CGP12m) as the key parameter for predicting the performance of shale gas wells in terms of the EUR and NPV at various production times.
The regression of prediction models based on CGP12m showed R-squared value above 0.95, which was higher compared to that in the similar researches [2,13]. This indicates strong correlations between 1-year cumulative production data and long-term performance of a shale gas well.
The Equations (5) and (6) are re-written to express the performance prediction models in term of CGP12m as follows:
E U R = a 0 + i = 1 3 a i × ( C G P 12 m ) i ( scm )
N P V = b 0 + j = 1 3 b j × ( C G P 12 m ) j ( USD )
Values of the parameters a0, a1, a2, a3 and b0, b1, b2, b3 are shown in Table 4.

3.6. Validation of the Prediction Models

The proposed prediction models were validated to check for its practical applicability using the field production rate data obtained from the database of the drillinginfo.com website [42]. A total 164 sets of production data were collected from many horizontal gas wells in Barnett shale with a minimum of 10 years production history (Table 5)
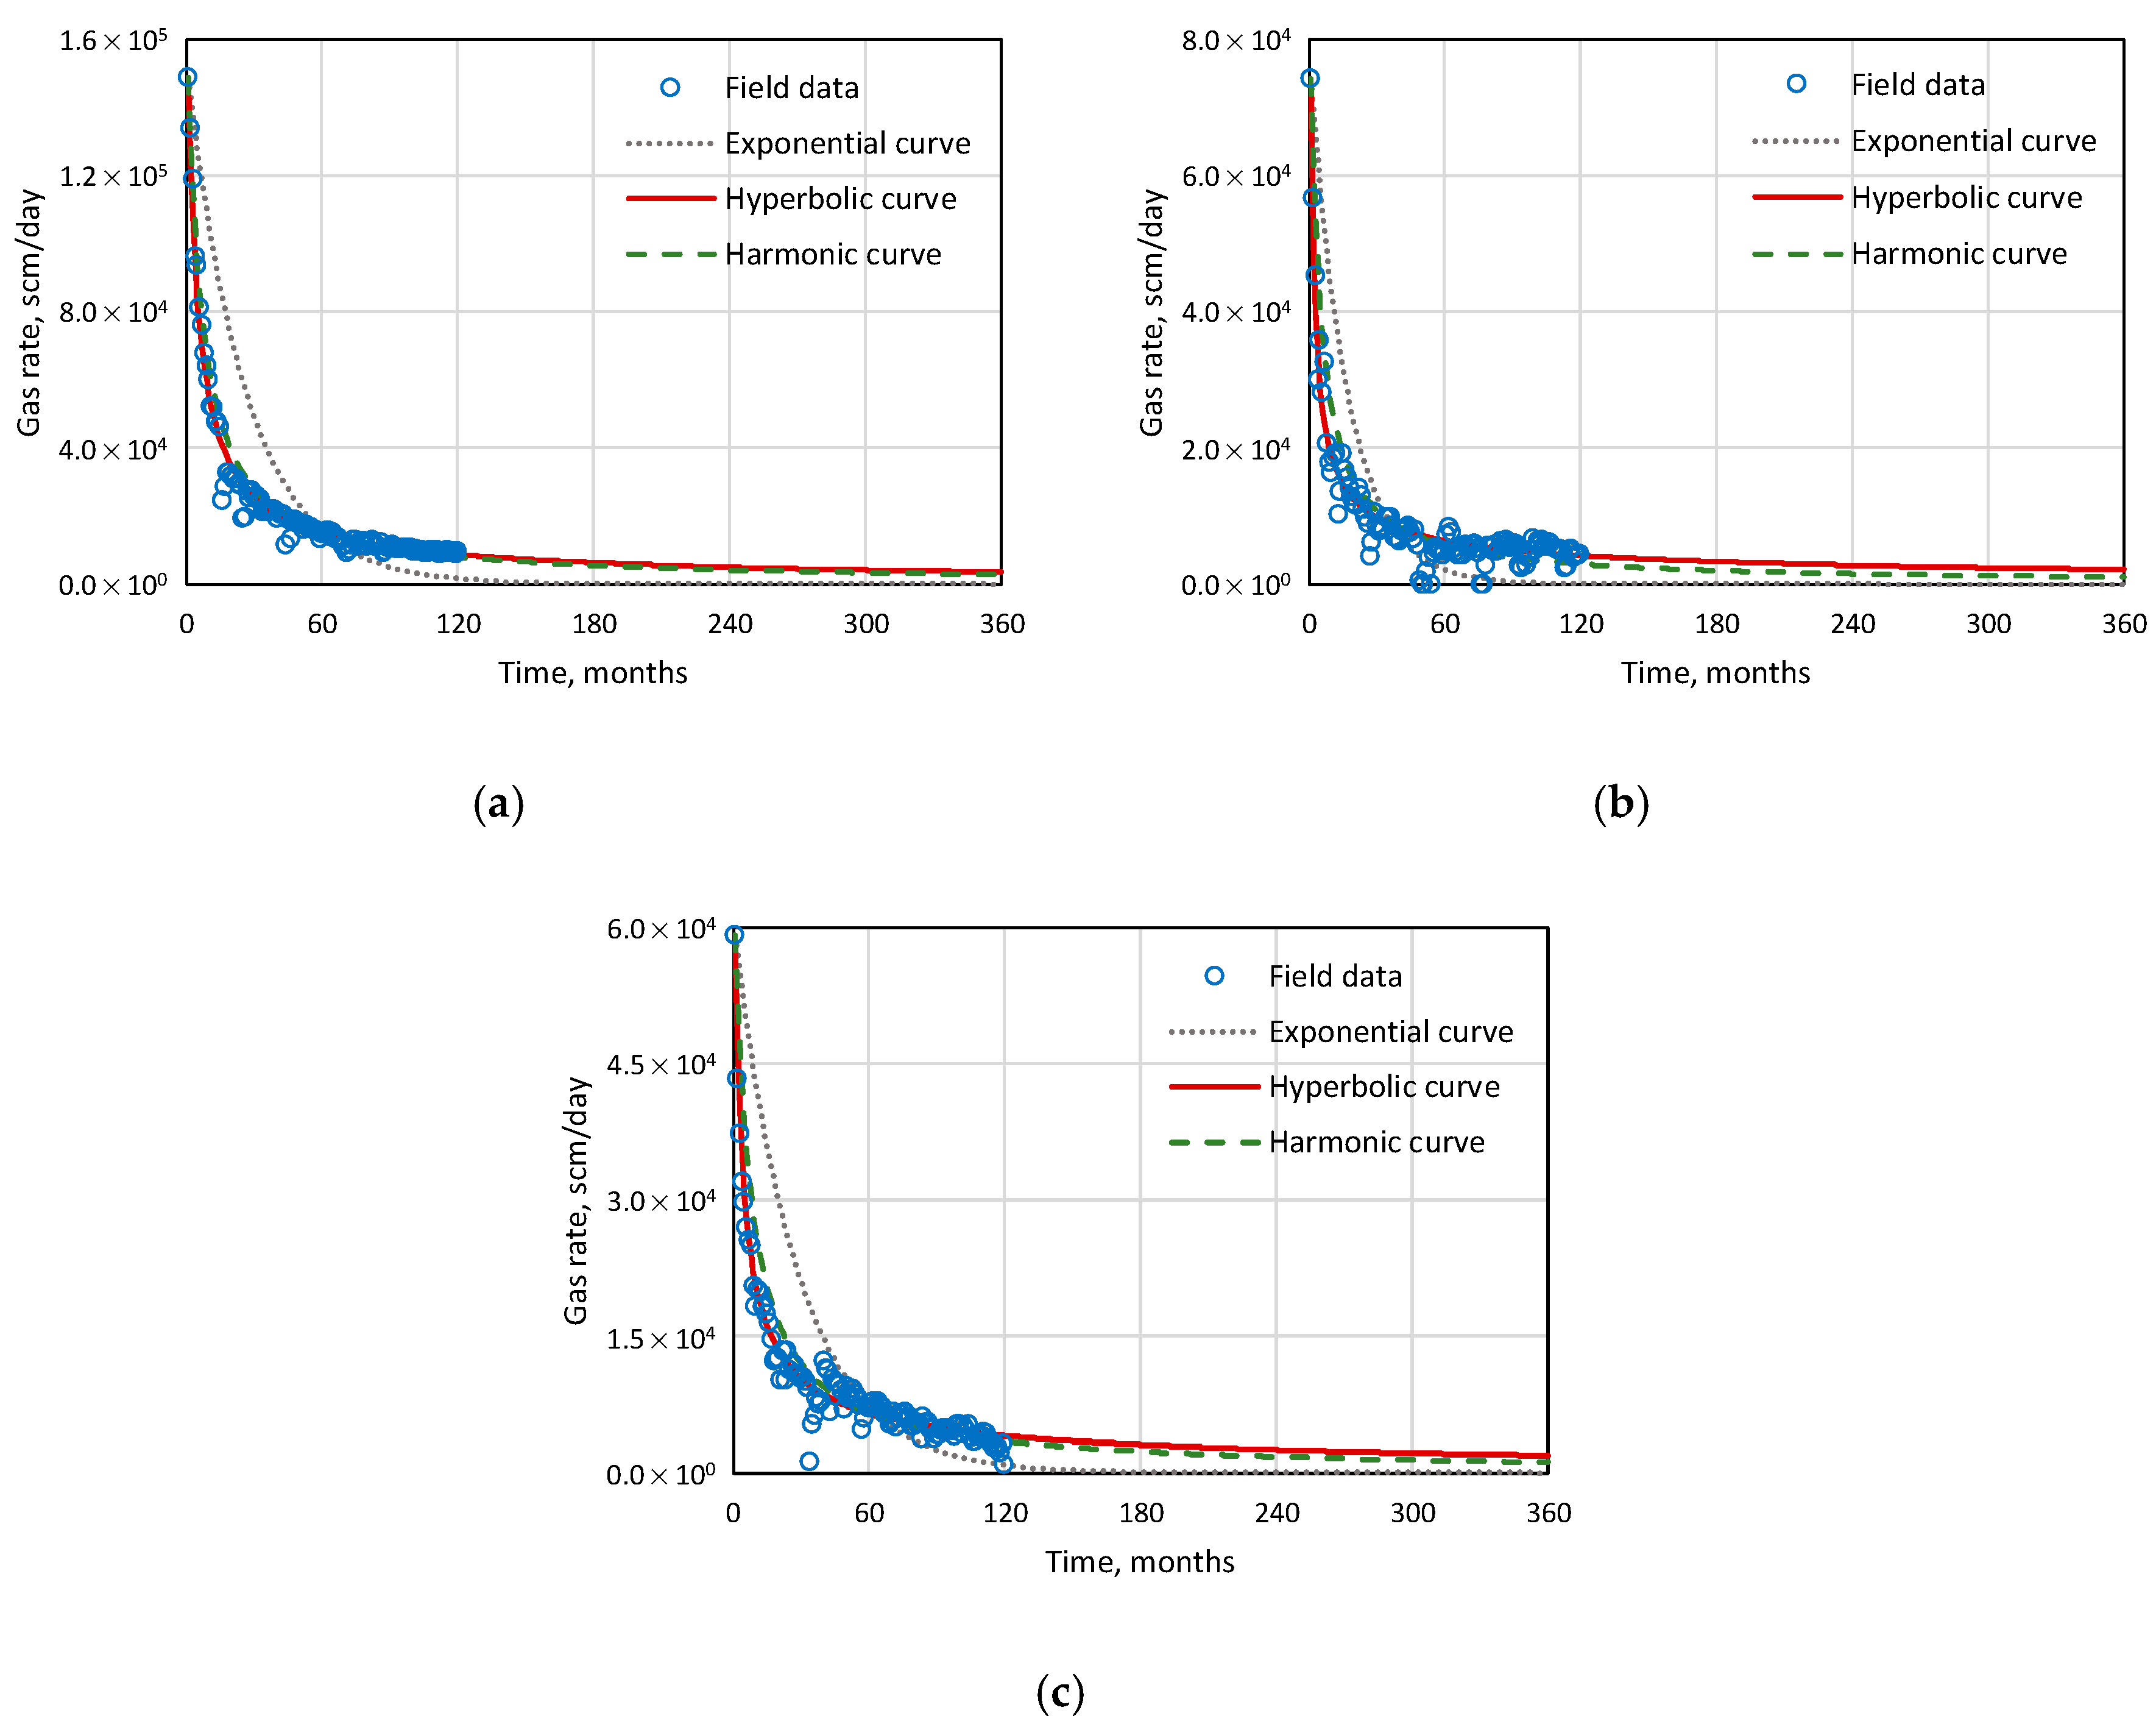
To validate the developed prediction models, the field production data were then predicted to 20 years using the decline curve analysis (DCA) technique (Figure 8). Three decline curves were used to extend the field production curves, these include: (1) exponential; (2) hyperbolic, and; (3) harmonic. The hyperbolic decline curve yields the best fit to the field product curves (Table 6).
The extended production curves were then analyzed to calculate the NPV for various production periods of the shale gas wells. Owing to lack of well dimension and completion data, the CAPEX of the wells was estimated by assuming the horizontal section of all the wells to be 1219.2 m long, and the wells were completed by a 121.9 m hydraulic fracture spacing and 106.7 m fracture half-length [20,23,24]. The NPV of the wells were then calculated using the data listed in Table 2.
The developed prediction models were then validated using the extended field production data. There existed high correlations between the predicted value from the proposed prediction models and the measured value from the field production data (Figure 9 and Figure 10). The model for EUR and NPV at 10 years yielded better validation results than the models for EUR and NPV at 15, and 20 years. Validation of the NPV prediction models showed higher R2 than that of the EUR prediction models. This demonstrates that the estimated ultimate recovery depended strongly on the production rate over the entire life of production, whereas the net present value depended strongly on the production rate at the early period of production. In particular, for a shale gas well, the production rate was very high in the first year of production followed by a rapid decline. However, the EUR were overestimated using the EUR prediction models compared to that of the field production data (Figure 9) while the NPV were slightly overestimated (Figure 10). This is because there still existed a gap between the simulation and field production data. This gap is due to the high uncertainty and heterogeneity in the field data, including the reservoir parameters, operating conditions, and the hydraulic fracturing treatment performance.
The developed prediction models based on simulation results should be modified to yield more predictive results for field shale gas wells in the Barnett reservoir by reflecting a reservoir heterogeneity effect. The average absolute error between the predicted EUR and field EUR at 10, 15, and 20 years are 2.28 × 10⁷, 3.37 × 10⁷, and 4.25 × 10⁷ standard cubic meter, respectively. The average absolute error between the predicted NPV and field NPV at 10, 15, and 20 years are 6.67 × 10⁵, 8.58 × 10⁵, and 9.57 × 10⁵ US dollars, respectively. The EUR and NPV prediction models were modified by subtracting the average absolute error from the shift the parameter (a0 and b0) of the EUR and NPV prediction models, respectively (Table 7).
A strong correlation between the CGP12m and the long-term shale gas EUR and NPV was observed in the validation of the proposed EUR and NPV prediction models, in which most of the scatters are grouped along the 45-degree line (Figure 11 and Figure 12). The validation results show R-squared value above 0.75 which is higher compared to that in the previous study (R2 < 0.75) [2]. This indicates that the CGP12m can be used to predict the NPV of various production periods of a shale gas well.

4. Discussion

In this study, shale gas performance prediction models were developed for predicting long-term shale gas production and economics from one-year production history data. The proposed prediction models are useful as a practical tool because only a short period of production (1 year) needs to be used to simply estimate the EUR and NPV at the various production periods of a shale gas well. Moreover, the models are useful for predicting the performance of young production wells, which have short production histories and limited availability of reservoir and/or hydraulic fracturing treatment data. The developed model shows high R-squared values (regression R-squared R2 > 0.95) indicating that early-production-data based prediction models can be used to predict reliably, the shale gas well’s future performance. The regression R-squared values in this study are higher compared to that of Gupta et al. [13] where EUR at production time of 4–7 years were predicted from 12-month production data using linear equations with R-squared values lower than 0.85. Furthermore, results in this study indicated that relationship between the shale gas well performance and early production data is not a linear, but a cubic relationship. This is because the investigated production time in this study was longer than that in the study of Gupta et al. [13] (10–20 years compared to 4–7 years).
The proposed prediction models can predict the shale gas well’s EUR and NPV in longer production period (from 10 to 20 years of production) compared to the previous models which effectively predict production in periods shorter than five years [1,2,4,6,7]. In addition, the economic feasibility of the gas wells was not investigated in the previous studies. Moreover, the proposed models in this study were developed based only on production data which can predict shale gas well’s EUR and NPV in cases for which reservoir and hydraulic fracturing data are not available or are limited. This is an advantage compared to some models predicting shale gas production based on reservoir and hydraulic fracturing data [1,2] or using DCA, type curve which require production data longer than one year for predictive results [3,4].
The applicability of the developed prediction models was tested through a validation method using field production data. The validation test shows R-squared values greater than 0.75. The R-squared values are higher than that from the model testing of Wang et al. [2] where 6-, and 18-month cumulative production were predicted from reservoir and hydraulic fracturing data with R-squared values lower than 0.75. This confirmed the strong correlation between the CGP12m and the shale gas well’s EUR and NPV regardless of when the production time was considered. This also suggests that the shale gas well’s EUR and NPV can be predicted reliably based on the CGP12m. However, there still existed a gap between the simulation results and the field production data. This is because there is high uncertainty in the field production data, including the reservoir parameters (permeability, porosity, natural fractures, gas saturation, and adsorbed gas content) and the well completion design parameters (horizontal well length, fracture spacing, fracture half-length, and fracture conductivity). In contrast, the shale gas reservoir model in this study was assumed to be homogeneous and isotropic. The further studies may need to investigate the impact of uncertain parameters on the shale gas production.

5. Conclusions

This study examined the relationship between the early production data and the shale gas well performance at various future production times. The prediction models based on 12-month cumulative gas production were developed for predicting 10-, 15-, and 20-year shale gas production and economics in Barnett reservoir using the reservoir simulation results. High R-squared values obtained from the model development using simulation data (R2 > 0.95) and the model validation using field data (R2 > 0.75) confirm strong correlation between one-year production data and long-term shale gas performance. However, there still existed a gap between the simulation results and the field production data. This reflects the heterogeneity and uncertainty of field production data. Overall, the proposed prediction models can be consistently applied to new shale gas wells with short production histories and lack of reservoir parameters and hydraulic fracturing treatment data.

Author Contributions

Conceptualization, H.S.; Data curation, V.N.-L.; Formal analysis, V.N.-L.; Methodology, V.N.-L. and H.S.; Project administration, H.S. and E.L.; Software, V.N.-L.; Supervision, H.S.; Validation, V.N.-L.; Visualization, E.L.; Writing—original draft, V.N.-L.; Writing—review & editing, H.S. and E.L. All authors have read and agreed to the published version of the manuscript.

Funding

This research was funded by the project Development of State-of-the-Art Characterization and Assessment Methods for Shale Gas Plays in Western Canada [20178510030880] by the Ministry of Trade, Industry and Energy (MOTIE).

Conflicts of Interest

The authors declare no conflict of interest.

Nomenclature

EUREstimated ultimate recovery
NPVNet present value
CGPCumulative gas production
OPEXOperating expense, USD/Mscm
CAPEXCapital expense, USD
DCADecline curve analysis
SSESum of squared errors
MAPEMean absolute percentage error
PRPeak production rate, scm/day
CGP3mCumulative gas production at 3 months, scm
CGP6mCumulative gas production at 6 months, scm
CGP12mCumulative gas production at 12 months, scm
CGP18mCumulative gas production at 18 months, scm
CGP24mCumulative gas production at 24 months, scm

References

  1. Geng, L.; Li, G.; Wang, M.; Li, Y.; Tian, S.; Pang, W.; Lyu, Z. A fractal production prediction model for shale gas reservoirs. J. Nat. Gas Sci. Eng. 2018, 55, 354–367. [Google Scholar] [CrossRef]
  2. Wang, S.; Chen, Z.; Chen, S. Applicability of deep neural networks on production forecasting in Bakken shale reservoirs. J. Pet. Sci. Eng. 2019, 179, 112–125. [Google Scholar] [CrossRef]
  3. Xu, B.; Haghighi, M.; Cooke, D.A.; Li, X. Production Data Analysis in Eagle Ford Shale Gas Reservoir. In Proceedings of the SPE/EAGE European Unconventional Resources Conference and Exhibition, Vienna, Austria, 20–22 March 2012; pp. 20–22. [Google Scholar]
  4. Ikewun, P.O.; Ahmadi, M. Production Optimization and Forecasting of Shale Gas Wells Using Simulation Models and Decline Curve Analysis. In Proceedings of the SPE Western Regional Meeting, Bakersfield, CA, USA, 21–23 March 2012; pp. 1–27. [Google Scholar]
  5. Ilk, D.; Currie, S.M.; Blasingame, T.A. Production Analysis and Well Performance Forecasting of Tight Gas and Shale Gas Wells. In Proceedings of the SPE Eastern Regional Meeting, Morgantown, WV, USA, 13–15 October 2010. [Google Scholar]
  6. Sun, H.; Chawathe, A.; Zhou, D.; MacIvor, K.; Hoteit, H. Integrated Haynesville Production Analysis. In Proceedings of the the 3rd Unconventional Resources Technology Conference, San Antonio, TX, USA, 20–22 July 2015; American Association of Petroleum Geologists: Tulsa, OK, USA, 2015; pp. 20–22. [Google Scholar]
  7. Stewart, G. Integrated Analysis of Shale Gas Well Production Data. In Proceedings of the SPE Asia Pacific Oil & Gas Conference and Exhibition, Adelaide, Australia, 14–16 October 2014; pp. 14–16. [Google Scholar]
  8. Mishra, S. A New Approach to Reserves Estimation in Shale Gas Reservoirs Using Multiple Decline Curve Analysis Models. In Proceedings of the SPE Eastern Regional Meeting, Lexington, KY, USA, 3–5 October 2012; pp. 106–119. [Google Scholar]
  9. Zhang, H.; Cocco, M.; Rietz, D.; Cagle, A.; Lee, J. An Empirical Extended Exponential Decline Curve for Shale Reservoirs. In Proceedings of the SPE Annual Technical Conference and Exhibition, Houston, TX, USA, 28–30 September 2015; pp. 4118–4140. [Google Scholar]
  10. Bashir, M.O. Decline Curve Analysis on the Woodford Shale and Other Major Shale Plays. In Proceedings of the SPE Western Regional Meeting, Anchorage, AK, USA, 23–26 May 2016. [Google Scholar]
  11. Doughty, C.; Moridis, G.J. The Use of the Bimodal Production Decline Curve for the Analysis of Hydraulically Fractured Shale/Tight Gas Reservoirs. In Proceedings of the 6th Unconventional Resources Technology Conference, Houston, TX, USA, 23–25 July 2018; American Association of Petroleum Geologists: Tulsa, OK, USA, 2018; pp. 1–20. [Google Scholar]
  12. Odi, U.; Bacho, S.; Daal, J. Decline Curve Analysis in Unconventional Reservoirs Using a Variable Power Law Model: A Barnett Shale Example. In Proceedings of the 7th Unconventional Resources Technology Conference, Denver, CO, USA, 22–24 July 2019; American Association of Petroleum Geologists: Tulsa, OK, USA, 2019. [Google Scholar]
  13. Gupta, I.; Rai, C.; Devegowda, D.; Sondergeld, C. Haynesville Shale: Predicting Long-Term Production and Residual Analysis To Identify Well Interference and Fracture Hits. SPE Reserv. Eval. Eng. 2019. [Google Scholar] [CrossRef]
  14. Baihly, J.; Malpani, R.; Altman, R.M.; Lindsay, G.; Clayton, R. Shale Gas Production Decline Trend Comparison Over Time and Basins-Revisited. In Proceedings of the 3rd Unconventional Resources Technology Conference, San Antonio, TX, USA, 20–22 July 2015; American Association of Petroleum Geologists: Tulsa, OK, USA, 2015. [Google Scholar]
  15. Kenomore, M.; Hassan, M.; Malakooti, R.; Dhakal, H.; Shah, A. Shale gas production decline trend over time in the Barnett Shale. J. Pet. Sci. Eng. 2018, 165, 691–710. [Google Scholar] [CrossRef] [Green Version]
  16. Montgomery, S.L.; Jarvie, D.M.; Bowker, K.A.; Pollastro, R.M. Mississippian Barnett Shale, Fort Worth basin, north-central Texas: Gas-shale play with multi–trillion cubic foot potential. Am. Assoc. Pet. Geol. Bull. 2005, 89, 155–175. [Google Scholar] [CrossRef]
  17. Jeff, H.; Dave, P. The Barnett Shale. Visitor’s Guide to the Hottest Gas Play in the US; Pickering Energy Partners: Houston, TX, USA, 2005. [Google Scholar]
  18. Martineau, D.F. History of the Newark East field and the Barnett Shale as a gas reservoir. Am. Assoc. Pet. Geol. Bull. 2007, 91, 399–403. [Google Scholar] [CrossRef]
  19. U.S. Energy Information Administration. Review of Emerging Resources: U.S. Shale Gas and Shale Oil Plays; Government Printing Office: Washington, DC, USA, 2011.
  20. Browning, J.; Tinker, S.W.; Ikonnikova, S.; Gülen, G.; Potter, E.; Fu, Q.; Horvath, S. Barnett Shale Model–1: Study develops decline analysis, geologic parameters for reserves, production forecast. Oil Gas J. 2013, 111, 63–71. [Google Scholar]
  21. Browning, J.; Ikonnikova, S.; Gülen, G.; Tinker, S. Barnett Shale Production Outlook. SPE Econ. Manag. 2013, 5, 89–104. [Google Scholar] [CrossRef]
  22. Ahmed, U.; Meehan, D.N. Unconventional Oil and Gas Resources; CRC Press: Boca Raton, FL, USA, 2016; ISBN 9781498759410. [Google Scholar]
  23. Dong, Z.; Holditch, S.; McVay, D.; Ayers, W.B.; Lee, W.J.; Morales, E. Probabilistic Assessment of World Recoverable Shale-Gas Resources. SPE Econ. Manag. 2015, 7, 72–82. [Google Scholar] [CrossRef]
  24. Zhang, H.; Wang, J.; Zhang, H. Investigation of the Main Factors During Shale-gas Production Using Grey Relational Analysis. Open Pet. Eng. J. 2016, 9, 207–215. [Google Scholar] [CrossRef] [Green Version]
  25. Nguyen-Le, V.; Shin, H. Development of reservoir economic indicator for Barnett Shale gas potential evaluation based on the reservoir and hydraulic fracturing parameters. J. Nat. Gas Sci. Eng. 2019, 66, 159–167. [Google Scholar] [CrossRef]
  26. CMG. GEM User Manual; Computer Modeling Group: Calgary, Italy, 2018. [Google Scholar]
  27. Langmuir, I. The Adsorption of Gases on Plane Surfaces of Glass, Mica and Platinum. J. Am. Chem. Soc. 1918, 40, 1361–1403. [Google Scholar] [CrossRef] [Green Version]
  28. Chen, Z.; Lavoie, D.; Malo, M.; Jiang, C.; Sanei, H.; Ardakani, O.H. A dual-porosity model for evaluating petroleum resource potential in unconventional tight-shale plays with application to Utica Shale, Quebec (Canada). Mar. Pet. Geol. 2017, 80, 333–348. [Google Scholar] [CrossRef] [Green Version]
  29. Zhang, T.; Ellis, G.S.; Ruppel, S.C.; Milliken, K.; Yang, R. Effect of organic-matter type and thermal maturity on methane adsorption in shale-gas systems. Org. Geochem. 2012, 47, 120–131. [Google Scholar] [CrossRef]
  30. Yu, W.; Sepehrnoori, K.; Patzek, T.W. Modeling Gas Adsorption in Marcellus Shale With Langmuir and BET Isotherms. SPE J. 2016, 21, 589–600. [Google Scholar] [CrossRef] [Green Version]
  31. Belyadi, H.; Fathi, E.; Belyadi, F. Hydraulic Fracturing in Unconventional Reservoirs; Elsevier: Amsterdam, The Netherlands, 2017; ISBN 9780128498712. [Google Scholar]
  32. CMG. CMOST User Manual; Computer Modeling Group: Calgary, Italy, 2018. [Google Scholar]
  33. Schweitzer, R.; Bilgesu, H.I. The Role of Economics on Well and Fracture Design Completions of Marcellus Shale Wells. In Proceedings of the SPE Eastern Regional Meeting, Charleston, WV, USA, 23–25 September 2009. [Google Scholar]
  34. Yu, W.; Sepehrnoori, K. An Efficient Reservoir-Simulation Approach To Design and Optimize Unconventional Gas Production. J. Can. Pet. Technol. 2014, 53, 109–121. [Google Scholar] [CrossRef]
  35. Vilela, M.; Marin, P.; Rodrigo, M.; Medina, A.; Limeres, A.; Mata Petit, F. Building the Field Development Plan for a New Gas Field Located in Algeria, Reggane Trend. In Proceedings of the Asia Pacific Oil and Gas Conference and Exhibition, Jakarta, Indonesia, 30 October–1 November 2007. [Google Scholar]
  36. Bhattacharya, S.; Nikolaou, M. Using Data From Existing Wells To Plan New Wells in Unconventional Gas Field Development. In Proceedings of the Canadian Unconventional Resources Conference, Calgary, AB, Canada, 15–17 November 2011. [Google Scholar]
  37. Goedeke, S.; Hossain, M.M. Simulation of Shale Gas Field Development: An Example from Western Australia. In Proceedings of the SPE Middle East Unconventional Gas Conference and Exhibition, Abu Dhabi, UAE, 23–25 January 2012. [Google Scholar]
  38. Jackson, G.T.; Sahai, V.; Lalehrokh, F.; Rai, R. Impact of Staggered Fracture Placement on Field Development Planning of Unconventional Reservoirs: A Critical Evaluation of Overlapping SRVs. In Proceedings of the SPE Western Regional & AAPG Pacific Section Meeting 2013 Joint Technical Conference, Monterey, CA, USA, 19–25 April 2013. [Google Scholar]
  39. Brouwer, B.; Scheffers, B.C.; Harings, M.; Godderij, R.; Brolsma, M.-J.; Bouw, S. A Conceptual Shale Gas Field Development Plan for the Lower Jurassic Posidonia Shale in The Netherlands. In Proceedings of the SPE/EAGE European Unconventional Resources Conference and Exhibition, Vienna, Austria, 25–27 February 2014. [Google Scholar]
  40. Montgomery, D.C.; Runger, G.C. Applied Statistics and Probability for Engineers, 7th ed.; Wiley: Hoboken, NJ, USA, 2018; ISBN 978-1-119-40036-3. [Google Scholar]
  41. Walpole, R.E.; Myers, R.H.; Myers, S.L.; Keying, Y. Probability and Statistics for Engineers and Scientists, 9th ed.; Pearson Education Inc.: London, UK, 2012; ISBN 978-0-321-62911-1. [Google Scholar]
  42. Drillinginfo Shale Gas Field Production Data in Barnett, USA. Available online: http://drillinginfo.com/ (accessed on 23 April 2019).
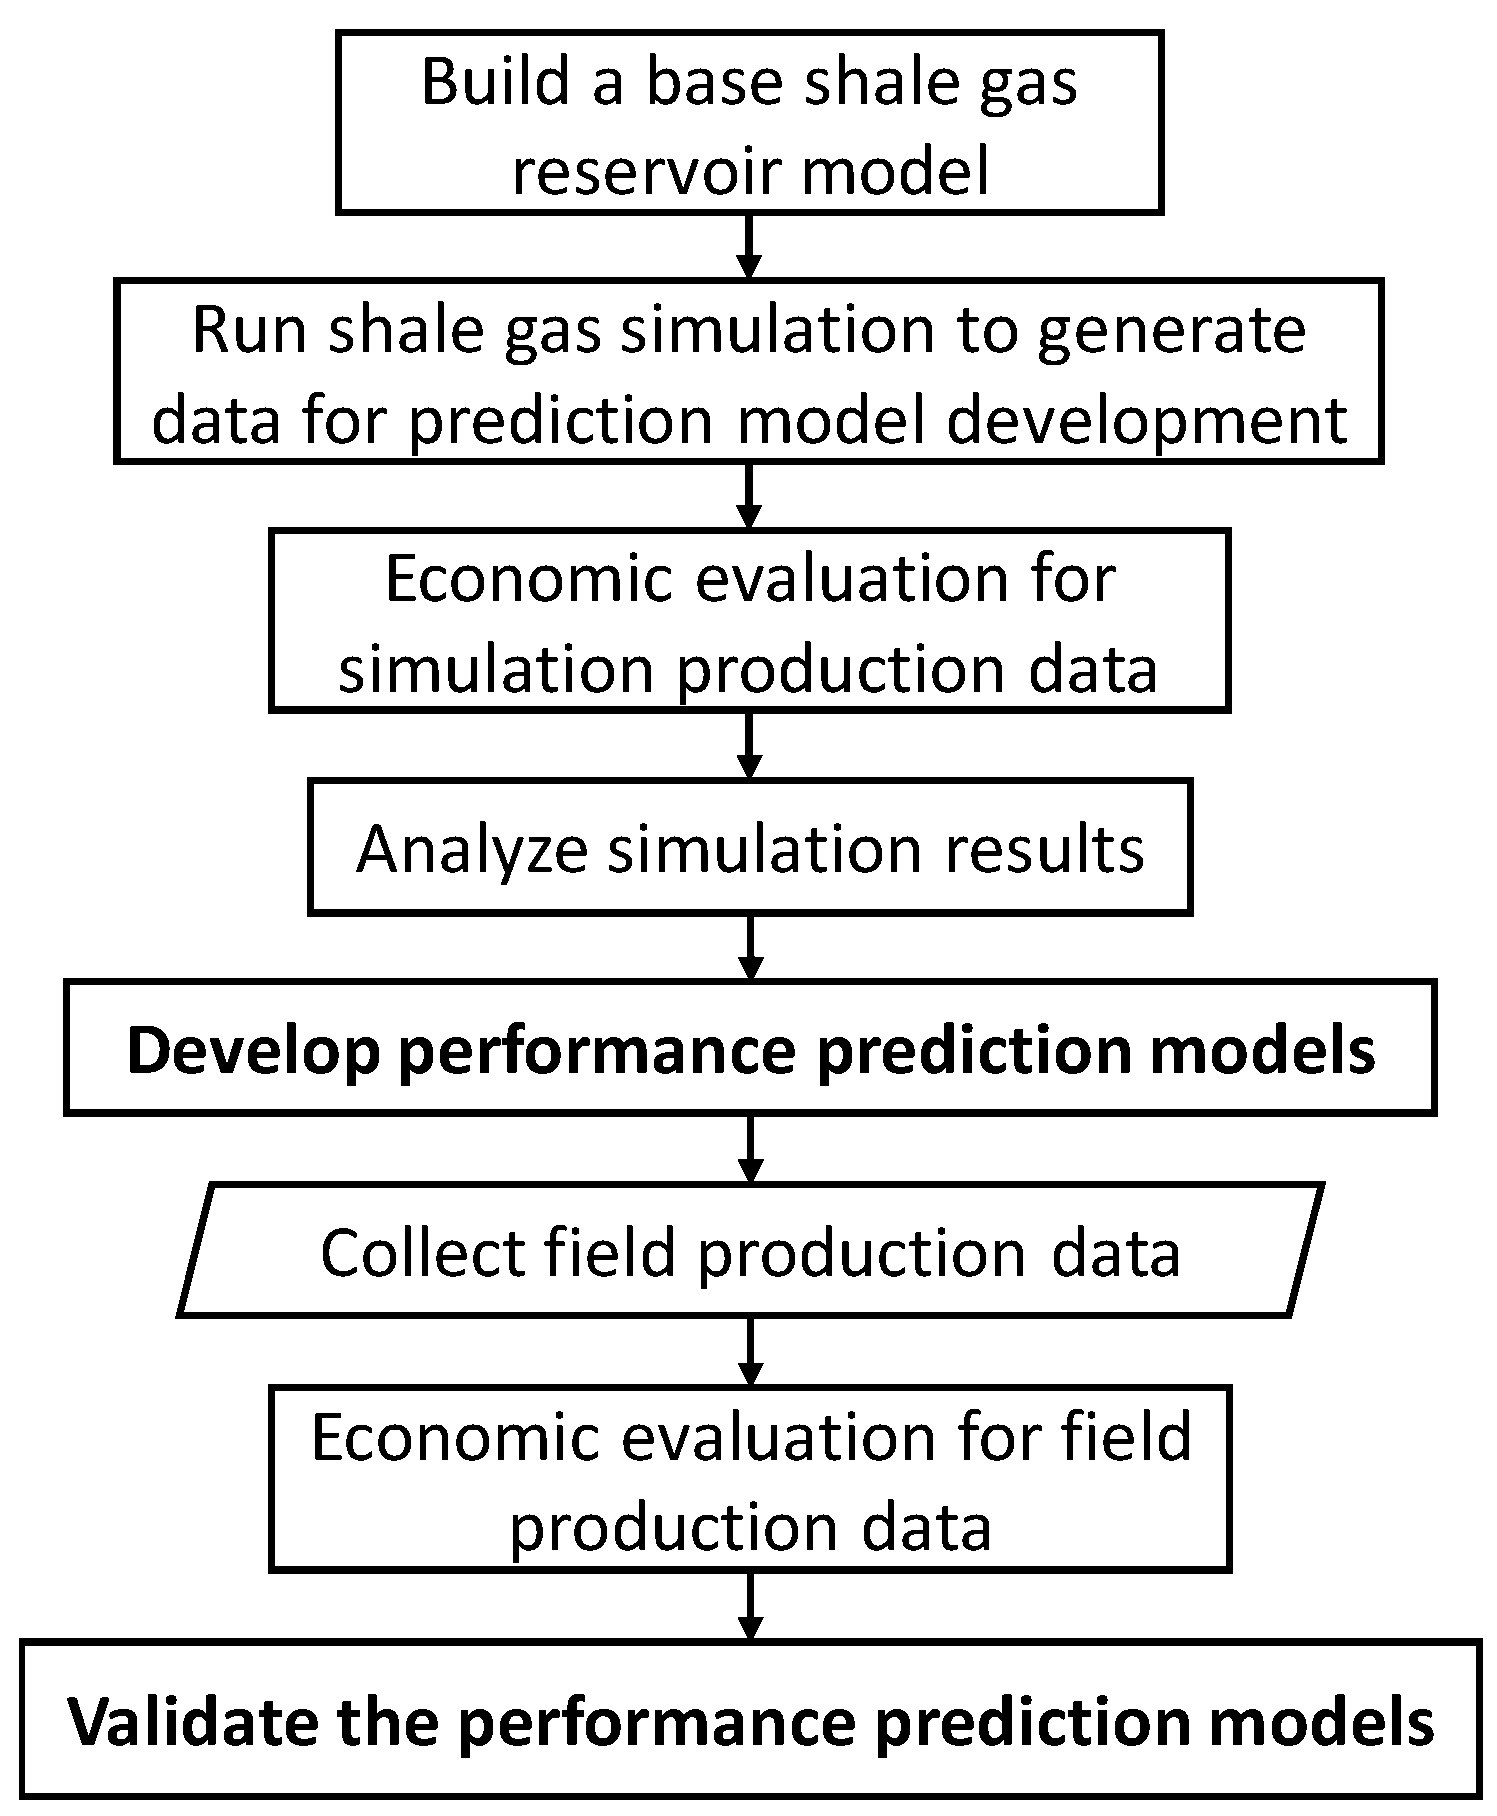
Figure 1. Workflow for developing the performance prediction models.
Energies 13 00424 g001
Figure 2. Base reservoir simulation models: (a) reservoir model; (b) hydraulic fracturing model.
Energies 13 00424 g002
Figure 3. Production profile of the base shale gas reservoir model.
Energies 13 00424 g003
Figure 4. Cross plots of peak production rate (a) and cumulative gas production at different times (bf) against estimated ultimate recovery at 10 years.
Energies 13 00424 g004
Figure 5. Cross plots of peak production rate (a) and cumulative gas production at different times (bf) against net present value at 10 years.
Energies 13 00424 g005
Figure 6. Coefficient of determination (R2) from predicting estimated ultimate recovery at a specified time based on the peak production rate (the first month) or cumulative gas production at 3, 6, 12, 18, and 24 months.
Energies 13 00424 g006
Figure 7. Coefficient of determination (R2) from predicting the net present value at a specified time based on the peak production rate (the first month) or cumulative gas production at 3, 6, 12, 18, and 24 months.
Energies 13 00424 g007
Figure 8. Application of decline curve analysis for forecasting the field production data. (a) High production case. (b) Medium production case. (c) Low production case.
Energies 13 00424 g008
Figure 9. Cross-validation results of the prediction models for predicting the estimated ultimate recovery (EUR) of shale gas wells at different times: (a) EUR at 10 years, (b) EUR at 15 years; (c) EUR at 20 years.
Energies 13 00424 g009
Figure 10. Cross-validation results of the prediction models for predicting the net present value (NPV) of shale gas wells at different times: (a) NPV at 10 years, (b) NPV at 15 years; (c) NPV at 20 years.
Energies 13 00424 g010
Figure 11. Cross-validation results of the modified EUR prediction models: (a) EUR at 10 years, (b) EUR at 15 years; (c) EUR at 20 years.
Energies 13 00424 g011
Figure 12. Cross-validation results of the modified NPV prediction models: (a) NPV at 10 years, (b) NPV at 15 years; (c) NPV at 20 years.
Energies 13 00424 g012
Table 1. Input parameters for Barnett shale reservoir modeling [23,24,25].
ParameterUnitLower LimitUpper Limit
Thicknessm60.96121.92
Reservoir pressurekpa20,68434,474
Matrix porosityfraction0.030.08
Matrix permeabilitymd0.00010.001
Initial gas saturationfraction0.550.75
Langmuir volumescm/ton2.554.25
Langmuir pressurekpa6,89510,342
Fracture half-lengthm60.96152.40
Fracture spacingm60.96152.40
Fracture conductivitymd.m0.1513.72
Table 2. Data for economic analysis of shale gas projects [33,34].
Lateral Horizontal Well Length, MCost, USDFracture Half-Length Per Stage, MCost, USDParameterValue
3052,000,00076100,000Interest rate, %10
6102,100,000152125,000Royalty tax, %12.5
9152,200,000229150,000Gas price, USD/Mscm106
12202,300,000305175,000OPEX, USD/Mscm26.5
Gas price and operating expenses in US dollar per thousand standard cubic meters (USD/Mscm).
Table 3. Determination of influential parameters for developing the prediction model based on p-value.
Model Based onTerm of ModelPredicted Objectives
EUR 10 yrsEUR 15 yrsEUR 20 yrsNPV 10 yrsNPV 15 yrsNPV 20 yrs
PR C 1 0.0000.0000.0000.0000.0000.000
( PR ) 1 0.0000.0000.0000.0000.0000.000
( PR ) 2 0.3270.1750.1280.1200.0880.079
( PR ) 3 0.7370.9251.0000.7420.7010.693
CGP3m C 2 0.0000.0000.0000.0000.0000.000
( CGP 3 m ) 1 0.0000.0000.0000.0000.0000.000
( CGP 3 m ) 2 0.0040.0010.0010.0030.0010.001
( CGP 3 m ) 3 0.3480.2310.2030.1820.1490.142
CGP6m C 3 0.0000.0000.0000.0000.0000.000
( CGP 6 m ) 1 0.0000.0000.0000.0000.0000.000
( CGP 6 m ) 2 0.0000.0000.0000.0000.0000.000
( CGP 6 m ) 3 0.0690.0410.0380.0600.0410.038
CGP12m C 4 0.0040.0000.0000.0000.0000.000
( CGP 12 m ) 1 0.0000.0000.0000.0000.0000.000
( CGP 12 m ) 2 0.0000.0000.0000.0000.0000.000
( CGP 12 m ) 3 0.0080.0050.0060.0260.0140.013
CGP18m C 5 0.0180.0010.0000.0000.0000.000
( CGP 18 m ) 1 0.0000.0000.0000.0000.0000.000
( CGP 18 m ) 2 0.0000.0000.0000.0000.0000.000
( CGP 18 m ) 3 0.0020.0020.0030.0260.0130.011
CGP24m C 6 0.0300.0030.0000.0000.0000.000
( CGP 24 m ) 1 0.0000.0000.0000.0000.0000.000
( CGP 24 m ) 2 0.0000.0000.0000.0000.0000.000
( CGP 24 m ) 3 0.0010.0010.0020.0380.0180.015
Highlighted terms indicate influential parameters.
Table 4. Parameters of the prediction models for shale gas wells at different times.
TimeEUR Prediction ModelsNPV Prediction Models
a0a1a2a3b0b1b2b3
10 years4.11 × 1064.61 × 100−1.67 × 10−84.88 × 10−17−3.23 × 1061.98 × 10−1−6.50 × 10−102.04 × 10⁻¹⁸
15 years7.48 × 1065.70 × 100−2.47 × 10−87.37 × 10−17−3.17 × 1062.20 × 10−1−8.12 × 10−102.55 × 10⁻¹⁸
20 years1.11 × 1076.50 × 100−3.08 × 10−89.13 × 10−17−3.12 × 1062.30 × 10−1−8.88 × 10−102.77 × 10⁻¹⁸
Table 5. Summary of collected Barnett field gas production data.
ParameterValue
Number of datasets, wells164
Well producing time, years≥10
Minimum peak production rate, Mscm/day38.71
Average peak production rate, Mscm/day97.18
Maximum peak production rate, Mscm/day340.27
Table 6. Mean absolute percentage error (MAPE) of decline curve analysis for 164 Barnett shale field production data.
ParameterExponential CurveHyperbolic CurveHarmonic Curve
Minimum MAPE, %11.93.64.1
Average MAPE, %44.210.313.6
Maximum MAPE, %85.832.554.4
Table 7. Parameters of the modified prediction models for field shale gas wells at different times.
TimeModified EUR Prediction ModelsModified NPV Prediction Models
a0a1a2a3b0b1b2b3
10 years−1.87 × 1074.61 × 100−1.67 × 10−84.88 × 10−17−3.90 × 1061.98 × 10−1−6.50 × 10−102.04 × 10⁻¹⁸
15 years−2.62 × 1075.70 × 100−2.47 × 10−87.37 × 10−17−4.03 × 1062.20 × 10−1−8.12 × 10−102.55 × 10⁻¹⁸
20 years−3.15 × 1076.50 × 100−3.08 × 10−89.13 × 10−17−4.08 × 1062.30 × 10−1−8.88 × 10−102.77 × 10⁻¹⁸