1. Introduction
The energy infrastructure, the refinery capacity and the electricity line transmission system in the United States have not adequately kept up with peak demand, and electricity supply shortfalls have resulted [
1]. With growing interest in renewable energy technologies to meet the ever-increasing energy needs across the world, it is pivotal to analyze the techno-economic viability of emerging cleaner technologies under present market conditions for utilities and other off-takers. To transition to a safer and cleaner electricity system and meet California’s ambitious climate goals of generating 60% of the total electricity from renewable sources by 2030 and 100% by 2045, the state must extinguish fossil fuel generation and instead rely only on cleaner sources of energy that do not emit air pollutants and greenhouse gases [
2]. In the electricity sector, this means using less electricity produced by natural gas–fired power plants and more from renewable sources such as solar, wind, hydro, geothermal and biogas.
In addition, California now depends on natural gas to heat most homes and buildings; affordable renewable electricity will also provide a cleaner fuel source for these needs.
Figure 1 shows the electricity consumption in California in the residential and non-residential sectors. In the past decade, California has made significant investments in renewable electricity generation. In 2017, renewables comprised 29% while natural gas accounted for 33% of the state’s electricity mix [
3]. Most utilities in the state are on track to meet—and even exceed—the current requirement to serve 60% of electricity demand from renewables by 2030 [
2]. But California still relies on substantial natural gas–fired generation to meet a substantial portion of its electricity needs specially to meet the peak demand periods during the summer months.
The rapid reduction in cost of PV modules and battery packs as well balance of system (BOS) components such as inverters have led to a sharp reduction in Levelized Cost of Electricity (LCOE) for PV plus storage (PVS) systems for residential as well as utility-scale systems over the last decade. LCOE is a standard metric for comparisons between electricity generation technologies, such as natural gas and solar powered plants. LCOE measures the lifetime costs of a technology or project divided by its output. But LCOEs for PVS are harder to compare as it depends highly on the amount of storage added to the PV plant. The more storage, the higher the flexibility and also (generally) the higher the LCOE which causes a disadvantage for these hybrid systems.
Energy storage systems and especially battery-based storage has the flexibility to create value by performing arbitrage in the energy market and by providing spinning/non-spinning reserves in ancillary services markets. It can also be integrated with existing solar PV infrastructure. As an example of a grid application, APS (Arizona Public Service) has signed a 15-year power-purchase agreement with First Solar to build and operate a 50 MW battery paired with a 65-MW solar field to charge the 3 h battery. By pairing clean solar energy with advanced battery technology, APS will be able to store power when solar power is available during morning and mid-day and deliver it to customers between 3 and 8 p.m. especially after 6 p.m. when the sun is setting but energy demand is peaking [
4]. To make this grid application economically attractive in future projects, there is a need to assess the various configurations of PV plus battery storage systems and their techno-economic applications to understand the underlying revenue streams and policy implications.
There are various configurations in which PVS power plants can be constructed and operated based on sizing and operation of system components. The following summary provided in
Table 1 of system configurations are adapted from a National Renewable Energy Laboratory (NREL) study on the technical performance of utility-scale PVS plants [
5].
As more variable renewable energy (VRE) resources such as wind and solar are increasingly being integrated into electric power systems, technical challenges arise from the need to maintain the balance between load and generation (or demand and supply) at different time scales [
6]. California has already achieved 20–25% electricity generation using renewable energy sources such as solar, wind and biomass with an updated target of achieving 60% generation by 2030 and Hawaii has already achieved a 19% renewable generation with future potential for 55% generation using renewable sources. Recently, states like California and Hawaii have faced the increasing problem of “duck curve” due to over-generation from solar energy systems during midday when there is a mismatch between electricity demand and supply which needs to be remedied with curtailment (decreasing the output from solar resources).
This ‘mismatch’ in demand and supply has led to negative pricing of electricity during these periods of low load and high solar production and high prices during evenings when solar production reduces and natural gas and other fossil-fuel based plants have to be fired up to meet the electricity demand. Peaking capacity has traditionally been supplied by a combination of simple-cycle gas turbines, gas- and oil-fired steam plants and reciprocating engines using fossil fuels, resources which are leading to massive air pollution problems and worsening the problem of climate change. California currently has about 20.8 GW of peaking generation capacity [
7], consisting of 272 internal-combustion, simple-cycle and steam-turbine generators fired by liquid or gaseous fossil fuels. Retirements of other generation capacity and any capacity outside the state used to meet peak demand would further increase the substantial opportunity for energy storage. In particular, battery storage can be utilized with existing or new solar installations to provide peak capacity in California over the next couple of decades.
While simple-cycle gas plants (or combustion turbine plants) can rapidly “ramp” or increase and decrease their output as needed (especially during peak demand), battery storage has the ability to do this even more quickly—as the response by a Tesla battery to a generator going offline in Australia showed recently [
8]. This ramping capability is of critical importance as more and more wind and solar are added to the grid, as integrating high penetrations of wind and solar requires a greater degree of flexibility from the rest of the fleet.
Across the United States, the ratio of annual peak-hour electricity demand to average hourly demand has increased dramatically over the past decade. This higher ratio translates into decreasing average utilization levels for generators in California and other regions across the U.S. Electric systems maintain sufficient capacity to meet expected peak loads plus a reserve margin. As the peak-to-average ratio rises, generators called on to meet peak-hour demand are running fewer hours and/or at lower output levels the rest of the year [
9]. Since energy payments (revenue from energy arbitrage) are a generator’s primary source of revenue in regional transmission organization (RTO) systems such as California’s Independent Systems Operator (CAISO), the rising ratio of peak-to-average hourly demand (see
Figure 2) is reducing baseload generator revenues and increasing the importance of capacity or resource adequacy market payments to peaking generators.
In California regulators are repeatedly choosing renewable energy plus storage over not only new gas plants but even continued operation of gas- and oil-fired power plants, including combined cycle and simple-cycle “peaker” plants (“Where Batteries are Replacing Power Plants” US News -
https://www.usnews.com/news/national-news/articles/2019-05-21/why-california-nixed-a-natural-gas-power-plant-in-favor-of-batteries). Additionally, the bids for renewable energy are often coming in at lower prices than other options (“Los Angeles solicits record solar + storage deal at 1.997/1.3-cents kWh” Utility Dive, 2019
https://www.utilitydive.com/news/los-angeles-solicits-record-solar-storage-deal-at-199713-cents-kwh/558018/). In this study, an alternative metric called “Lifetime Cost of Operation” or LCOO has been chosen to compare the installation and operational costs between PVS and conventional natural gas based power plants to understand the cost to install and operate the respective power plants specifically portraying the value of storage application during the target period duration. It is understood that both these technologies may be utilized during other times of the year for other grid applications such as frequency regulation, voltage support and so forth. LCOO is the summation of the total cost to install and operate a power plant over its lifetime specifically during the target period window considering installed costs, fixed and variable operation & maintenance costs (O&M) as well as fuel costs if any. Environmental value for using PVS has been excluded initially but integrated later as an added value over operating conventional combustion turbine power plants.
In this paper we try to understand the costs and values of PVS as compared to its natural gas-based alternatives. The objectives of this paper are as follows:
To understand the current trends in the capacity market by analyzing the methodology for ‘firm capacity’ provision based on a ‘Target Period Capacity Factor’ (TPCF) framework to facilitate streamlined bidding for capacity firming projects as an alternative to gas peakers.
To evaluate if a PVS system can provide high capacity factors in peak summer demand periods from 7–10 p.m. (or HE20–HE22) in California using First Solar’s PlantPredict solar modeling tool. The pertinent question here is to evaluate whether PVS compete with natural-gas fired peaker plants to provide firm capacity during evening peak hours for summer months in California.
To compare the lifetime cost of operation (LCOO) of PVS with conventional natural gas combustion turbine power plant (gas peaker) over the plant lifetime considering installed costs, fixed and variable O&M costs, fuel costs and other financial parameters with appropriate escalation rates.
The research finds that utility-scale PV plus battery energy storage (PVS) can provide high capacity factors (above 98%) during summer peak demand periods in California. The target period capacity factor (TPCF) framework can be a pivotal framework to highlight the firm capacity application of PVS as an alternative to natural gas peakers. The installed and operational costs over the project lifetime are analyzed in relation to energy production during the target period to obtain LCOO. Based on this metric, the PVS technology is economically feasible compared to natural-gas fired peaker plants (simple cycle or conventional combustion turbine) considering federal tax incentives. The target period window is the time period during which it is valuable for power plants to provide firm capacity, usually during early or late evening peak demand periods in the summer months (from April to September). A 50 MWac PV system with 60 MW/240 MWh battery storage modeled in California can provide >98% capacity factor over a 7–10 p.m. target period with lower LCOO (by almost 8–10%) than a conventional combustion turbine natural gas power plant. This particular configuration of PVS can displace a 70 MW combustion turbine power plant.
Before presenting the detailed methods for achieving the stated research objectives, the following section describes an innovative framework that relates to the LCOO metric and that can make it more streamlined for utilities to procure PV plus battery storage (PVS) installations as an alternative to ‘peaker plants’ for providing firm, peaking capacity during summer months in California.
2. Materials and Methods
In order to provide peaking capacity, energy storage systems must provide a high “capacity credit,” or capacity factor, a metric which portrays the ability of a generator to supply energy consistently during periods of peak demand. To achieve consistently high capacity factors, a storage device must have sufficient duration (hours of discharge at full capacity) to sustain the period of peak electricity demand driven by the shape of the load curve. Other analyses have demonstrated that PV can change the shape of the net load curve and potentially increase storage’s capacity credit or reduce the storage duration needed for full capacity credit [
10,
11].
For a PV plus battery storage system (PVS), the presence of battery storage increases the system’s net capacity credit by supplementing the PV output during periods of high net demand. This period of high demand usually occurs during the summer months in the western U.S. The term “capacity credit” [
12] represents physical capacity or availability and “capacity value” represents the monetary value of this capacity. The capacity credit as mentioned previously is similar to capacity factor of a PVS system but in a specific target period window. In recent years, solar project developers have spent considerable resources discussing the values of PVS with their customer utilities in markets like California and Arizona where power purchase agreements (PPAs) are used to procure capacity resources. An important factor affecting the growth of this generation technology has been an absence of a specific method/framework for utilities to “ask” for PVS. For this purpose, a framework was developed for PVS projects in a peaker application setting, which revolves around a firmness (or: “availability”) metric called the Target Period Capacity Factor (TPCF). The framework is based on a series of steps mentioned below.
Step 1—A utility publishes an RFP (Request for Proposal) for PVS by defining a ‘Target Period Window’ in a 12 × 24 matrix as shown in
Figure 3. This energy value matrix was provided to First Solar for a previous project and is used here for illustrative purposes only. The Target Period is drawn around the hours during which the utility sees the highest peak loads on the grid. The values in each cell represent the relative value of energy to the utility. In addition to defining the Target Period, the utilities usually set a minimum threshold for availability (ex. “the annual Target Period Capacity Factor must be at least X% throughout the PPA term”). Typically, the RFP stipulates the target period capacity factor requirements depending on peak load criteria of the region and can range between 25–100X%. For replacing gas peakers (firm capacity provision application), the capacity factor required during peak demand period is usually greater than 95%.
Step 2—The developers bidding for the project would conduct sizing optimization, iterating through different PV power capacity and energy storage power and energy capacity sizes to find the configuration with the lowest price of energy or lowest levelized costs that meets the TPCF requirements in the RFP. This has been shown in
Figure 4 below.
Step 3—The utility compares all the optimum bids from the developers and compares them on pricing. These include competing technologies such as SCGT (CT) which are based on producing energy from natural gas. Now, the utilities can compare the bids apples-to-apples, because the system is sized optimally for providing the necessary firmness during the target period window based on the previously conducted analysis (shown in
Figure 5). Liquidated Damages (LDs) should be defined in the RFPs that cover any shortfalls of energy during the target period window and the project developers should own that risk. Instead of a single PPA price for every MWh delivered by either the PV or the storage system, a contract can also be structured with a capacity payment (
$/kW/month) or a combination of both.
As suggested by the above methodology, similarly sized projects with the lowest cost typically gets awarded the project. The significant issue here is the reliance on LCOE as the metric to decide the overall viability of the system instead of the overall lifetime costs of operations. For the case of peaking capacity provision, currently, gas peakers have a short start-up time (usually few minutes) but result in higher emissions due to thermal inefficiencies (20–40% efficiency level) in the process. BESS on the other hand can respond to electrical signals in the matter of seconds to ramp-up or ramp-down their discharge. In this paper, we analyze the capability of the BESS paired with PV to provide clean, flexible power during the peak demand period in California.
The primary objective of this study is to evaluate whether an appropriately sized PVS can be a technologically viable and cost-competitive alternative to proportionally sized gas peakers for providing firm, peaking capacity for a particular number of hours in the day. The power capacity of the conventional combustion turbine based gas peaker has been assumed to be 70 MW which would provide a similar power output profile during the target period.
The methodology can be divided into two sections; the first covers simulating the energy generation and system dispatch of the PVS system which would be used in calculating the net energy delivered from the PVS power plant and the TPCF during the time duration. The size of the PV and BESS has been decided based on discussions with the industry stakeholders with the aim of providing maximum capacity factor during the target period that is, 7–10 p.m. (Hour Ending 20-Hour Ending 22). The technical specifications and simulation settings are detailed in
Appendix A—
Table A1,
Table A2 and
Table A3.
The second section contains the methodology for conducting a lifetime cost comparison between the selected PVS system and competing natural-gas based technologies such as Simple Cycle Gas Turbines (Conventional Combustion Turbine or CT) to understand their lifetime cost of operation (LCOO). In order to simulate the solar energy generation, battery charge-discharge cycle and other technical inputs to the model, a spreadsheet model was developed to input typical meteorological year (TMY-3) weather data from National Solar Radiation Database (NSDRB) maintained by NREL to calculate the hourly solar energy generation from the thin-film solar array being considered in this case study. This modeling was done as a validation step before proceeding with subsequent PV and battery storage dispatch analysis using the PlantPredict solar energy modeling tool described below.
In this paper, we assume that the PVS operation is under a bilateral contract between a developer and utility (RFPs and PPAs) but recently PVS bids are also increasingly prominent in organized wholesale markets (see
Table 2).
2.1. Methodology for Target Period Capacity Factor (TPCF) Analysis
As mentioned previously, for this case study we would be studying the TPCF for a PVS as an alternative to a gas peaker for a three-hour duration during the late evening period in California. It is understood that the peak demand period for a jurisdiction is dependent upon the load profile and other grid factors that are location-dependent. For the purpose of the study, the target period has been defined to be from April to September from (7–10 p.m.) which is typically a high-demand period in the CAISO when the solar resources start diminishing and demand starts rising in the late evening as seen from the duck curve shown in
Figure 6a.
The PlantPredict solar energy modeling tool (First Solar Modeling Tool—Plant Predict. Accessed at:
https://plantpredict.com/algorithm/introduction/) consists of two distinct algorithms for conducting AC-Coupled PV-BESS (Battery Energy Storage Systems) dispatch (see
Figure 7) which are of particular interest for this use-case. The first, “Interconnect Excess” algorithm charges the battery storage system only if the loss included PV output capability exceeds the ‘Power Output Limit’ (specified as the maximum allowed power input into the grid). It will discharge energy at its maximum capability during the specified target period window. The dispatch algorithm for PVS in Plant Predict considers three data points from the technical specification of the plant, namely, the power produced by the PV plant, the State of Charge of the BESS and the interconnect capacity of the plant. In addition to this, the value of the energy output to the grid is also considered in the dispatch logic. A detailed formulation for the model is available in the Plant Predict Resource Center (Plant Predict Models & Algorithms for PVS -
https://plantpredict.com/algorithm/energy-storage-pvs/).
In the “Energy Available” algorithm, the storage system will be charged as and when PV energy becomes available with the sole objective of charging it to full capacity. Once the storage system is fully charged, the energy from the PV system will then be re-directed to the grid. The storage system will discharge energy at maximum capability during the target period window which is more appropriate for providing firm capacity. If the PV output exceeds the export limit while the battery is fully charged, the energy would be clipped or lost leading to revenue losses. A potential mitigation strategy for this would be to negotiate the export limit with CAISO by entering into the interconnection queue although it is time-consuming. For the purpose of firm capacity provision during specific hours, it is reasonable to assume that the latter, Energy Available Algorithm, would be better suited for this grid application.
The dispatch algorithm used in Plant Predict simulations have been shown as mathematical formulations for each node in
Figure 7. The detailed description of the input and abbreviations used have been shown in
Appendix A—
Table A4 and can be found on PVS—Models & Algorithms on First Solar’s website. These have been summarized below:
- (a)
Determination of the amount of power from the PV systems which will determine the power transferred to charge the battery.
- (b)
The next step is to determine the power at Node 4 accounting for all the thermal and electrical losses including high voltage and medium voltage losses.
- (c)
Next, we determine the power at Node 4 that the battery storage system can charge in addition to the power from the PV system.
- (d)
To limit the PVS system output to the interconnection limit, discharge limits and inverter limits are considered in addition to the LGIA (Large Generator Interconnection Agreement) limit.
- (e)
The target period hours (7–10 p.m.) can be selected as shown in
Figure 6b. To evaluate whether the time step is a Target Period for discharge.
If TP = True, Discharge = 1
Identify hours in which power can charge based on the selected model type.
If Model = LGIAExcess (Interconnection Excess Algorithm) and Pavailable > ic (Power Output Limit),
Then,
Charge = 1 and AvailableCapacitytoCharge = AvailableExcesstoCharge at Node 4 (Not selected in this model)
If Model = EnergyAvailable (Energy Available Algorithm)
and
AvailableCapacitytoChargea at Node 4 > 0 and if TP = False that is, Discharge = 0,
Then,
Charge = 1 and AvailableCapacitytoCharge = AvailableCapacitytoChargefromNonExcess at Node 4.
- (f)
After considering calendar and cyclical degradation, the State of Charge (SoC) of the battery at each timestep is determined by its SoC in the previous timestep, Available Capacity to Charge and the DC Roundtrip Efficiency (DCRTE):
If Charge = 1 (Battery is charged from PV generated energy),
BatterySOC = min (BatteryMaxCapacity, (prevBatterySOC + AvailableCapacitytoCharge) * BatteryDCRTE)
If Discharge = 1 (Battery is discharging to the grid),
BatterySOC = max (0, prevBatterySOC + AvailableCapacitytoDischarge at Node 4)
Else,
BatterySOC = prevBatterySOC.
- (g)
Finally, the power throughput from the battery (including Battery DC RTE) can be formulated as:
BatteryACCharge at Node 3 = BatteryDCPower at Node 4/eff
sinv
The locations used for simulation were chosen to be representative of places which are conducive to future PVS installations, as decided based on studying solar installations across the state. San Luis Obispo in Western California, San Bernardino in Southern California and Sonoma in North-western California were selected. The target period was assumed to be from (7 p.m. to 10 p.m.) for the months of April to September. Recent RFPs usually stipulate for a four to five-month period typically during the summer. The delivery hour requirement is between 2–4 h typically during late afternoon and evening hours when solar resources are diminishing or non-existent.
The output of this model is the 8760 PVS profile consisting of annual hourly energy delivered from PV to grid, PV to battery and battery to the grid. These parameters are then used for calculation of the target period capacity factor (TPCF) for the duration selected. It has to be noted that the simulation considers that battery is charged only from PV-generated energy and not charged from the grid to ensure that 30% Federal Investment Tax Credit (ITC) could be utilized fully. The target period capacity factor (TPCF) is defined as the ratio of plant availability during the target period and the maximum plant availability of the PVS plant assuming continuous operation during the target period at nameplate capacity. The ‘TPCF’ term can also be mentioned as ‘Availability Factor’ (AF) or ‘Equivalent Availability Factor’ (EAF) in power purchase agreements.
Thus, the capacity factor during the target period is calculated as:
For this case study, since the energy delivered from the PV to the grid and PV to BESS is assumed to be negligible during the target period, the ‘Plant Power Capacity’ term can be understood to be the power capacity of the plant during the target period delivery that is, the power capacity of the BESS which is delivering previously stored energy from PV to the grid. In some capacity contracts, where PVS is leveraging the high energy value during particular time periods, “Target Periods” (which may coincide with PV production) are artificially created to deliver electricity during those hours using both PV and BESS leading to much lower TPCF values (
Figure 3) since the entire power capacity of PV and BESS is considered in the denominator (see Equation (1)) which reduces the effective TPCF. The TPCF forms a crucial component of the PPAs between the developer and the off-taker and thus analyzing this metric provides the developers a clear understanding of whether a generation or storage system can meet the requirements of the PPA. If the system does not comply with the TPCF requirements for two consecutive years, Liquidated Damages (LD) or contract termination may lead to troubled economics of the plant investment.
Table 3 shows the TPCF values for the selected locations in California.
2.2. Methodology for Lifetime Cost of Operation Analysis (LCOO)
As mentioned in the Step 3 of the capacity addition bidding process, the utility selects the generation system with the least cost using metrics like LCOE among others. LCOE tends to be myopic in terms of the overall system benefits and costs since it treats all generation technologies as the same regardless of the value it can provide during on and off-peak demand. For this study, we have utilized a slightly different approach of comparing the ‘lifetime cost of operation’ of the generation technologies for firm capacity provision. LCOO includes the summation of installed costs, fixed and variable O&M (operation & maintenance), fuel costs as well as other policy factors such as tax credits/incentives to ascertain the ‘
$/W’ value of power plants assuming that the electricity generation from each power plant is over the same time period that is, the electricity delivered during the target period window. Factors such as Weighted Average Cost of Capital (WACC) and inflation were intentionally avoided to reduce complexity and compare the cost of operating both power plant alternatives on a raw dollar value scale for screening purposes. It is understood that, for a more detailed financial analysis, parameters such as WACC
nominal, WACC
real, inflation rates and debt to equity ratios need to be added into the calculations [
13].
The cost analysis includes both AC and DC coupled configurations since recent research endeavors have proven that DC-coupled configurations will be cost-effective generation systems in the future with improvements in DC-DC converter technology and component cost reductions. The cost components of PVS system include installed cost of PV, Li-ion battery storage system as well as non-hardware components such as land fee, interconnection fee and so forth. A detailed breakdown has been provided in
Table 4. Before proceeding with the LCOO analysis, it is important to define the data sources for the technical specifications of PVS as well as CT systems. The primary reason for comparing the PVS to a 70 MW CT power plant has been explained in detail in
Appendix C.
The period of analysis is assumed to be 20 years to reflect the economic life of an average utility-scale PVS system for easier comparison to competing technologies like CT, although the plant life for conventional peakers may exceed 20 years. A standard rate of 0.5% for calendar degradation has been considered in the study. There is a noticeable lack of literature comparing the lifetime costs of PVS and natural-gas based generation systems and this paper attempts to shed light on the various aspects of lifetime costs and benefits including the avoided cost of emissions by using PVS for peaker applications.
The table below shows the installed and O&M cost breakdowns for co-located AC and DC coupled PVS systems used in the cost analysis. The difference between co-located AC and DC system costs occur in the Engineering, Procurement & Construction (EPC) cost in the BOS (Balance of System) category, since DC coupled systems do not require a solar inverter although they may require additional DC-DC bidirectional converters. The detailed cost assumptions for PVS and Conventional Gas Turbine (CT) are specified in
Appendix B. The general technological and financial assumptions are mentioned below:
Weighted Average Cost of Capital metrics has intentionally avoided to reduce complexity and compare the raw installed and operational costs for both technologies. Price escalation rates have been utilized for O&M costs for PV and BESS.
For the purposes of comparison of power plants with similar output capabilities, a 70 MW Conventional CT power plant with natural gas as the primary fuel has been considered.
Energy delivered during the target period is essentially delivered from the BESS and is assumed to be ‘must-take’ meaning curtailment is not possible. This is usually stipulated in PPAs.
Batteries are charged by 100% solar energy to utilize the ITC under which batteries can be given a 30% tax credit only if it is charged 100% of battery capacity by the PV array.
The locations chosen for ex. San Luis Obispo, CA represents a typical location which is suitable for utility-scale PV plus battery storage system installation due to previous installations in PG&E’s resource portfolio. Another reason to choose this location was the need for reliable generation systems due to high peak demand and power outage issues in the region.
Only AC-Coupled PVS system were considered for simulation. This is due to well-researched performance and business models available.
3. Results
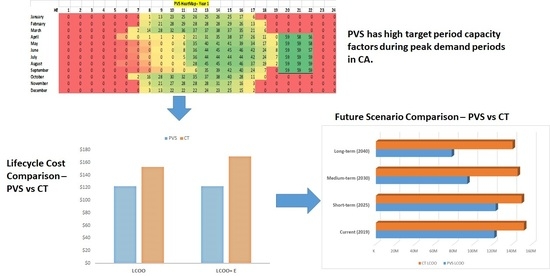
The 8760 system (PV + Storage) electricity dispatch profile results portray that PV paired with appropriately sized 4-h discharge duration batteries can provide sufficiently high capacity factors for at least 3 h during the specified target period window (7–10 p.m.). A typical daily profile shown in
Figure 8 highlights that the PV Net Energy is being stored in the battery for dispatch during the target period.
The results for the modeling and subsequent analysis have been shown in
Table 3 and the dispatch map is shown in
Figure 9.
Figure 9 shows that a 4 h battery paired with an appropriately sized PV system can provide 3 h firm capacity during the evening peak period. This can be attributed to the round-trip efficiency (RTE) and usable energy available for discharge from the BESS. To test the limits of the TPCF, the target period was extended to include 6 p.m. The simulations are run for Sonoma, CA and the results show that the TPCF drops to 88% on extension of the target period window by a single hour since the battery does not have enough capacity to dispatch during the entire window (see
Figure 10). A larger BESS capacity would be required to sufficiently increase the TPCF for this case.
The detailed cost components represent a typical utility-scale PVS system with recent market data for PV modules, battery systems and other BoS components. The data has been adapted and modified from Fu et al. (2018) which is the most recent literature containing US market data for PVS installed costs.
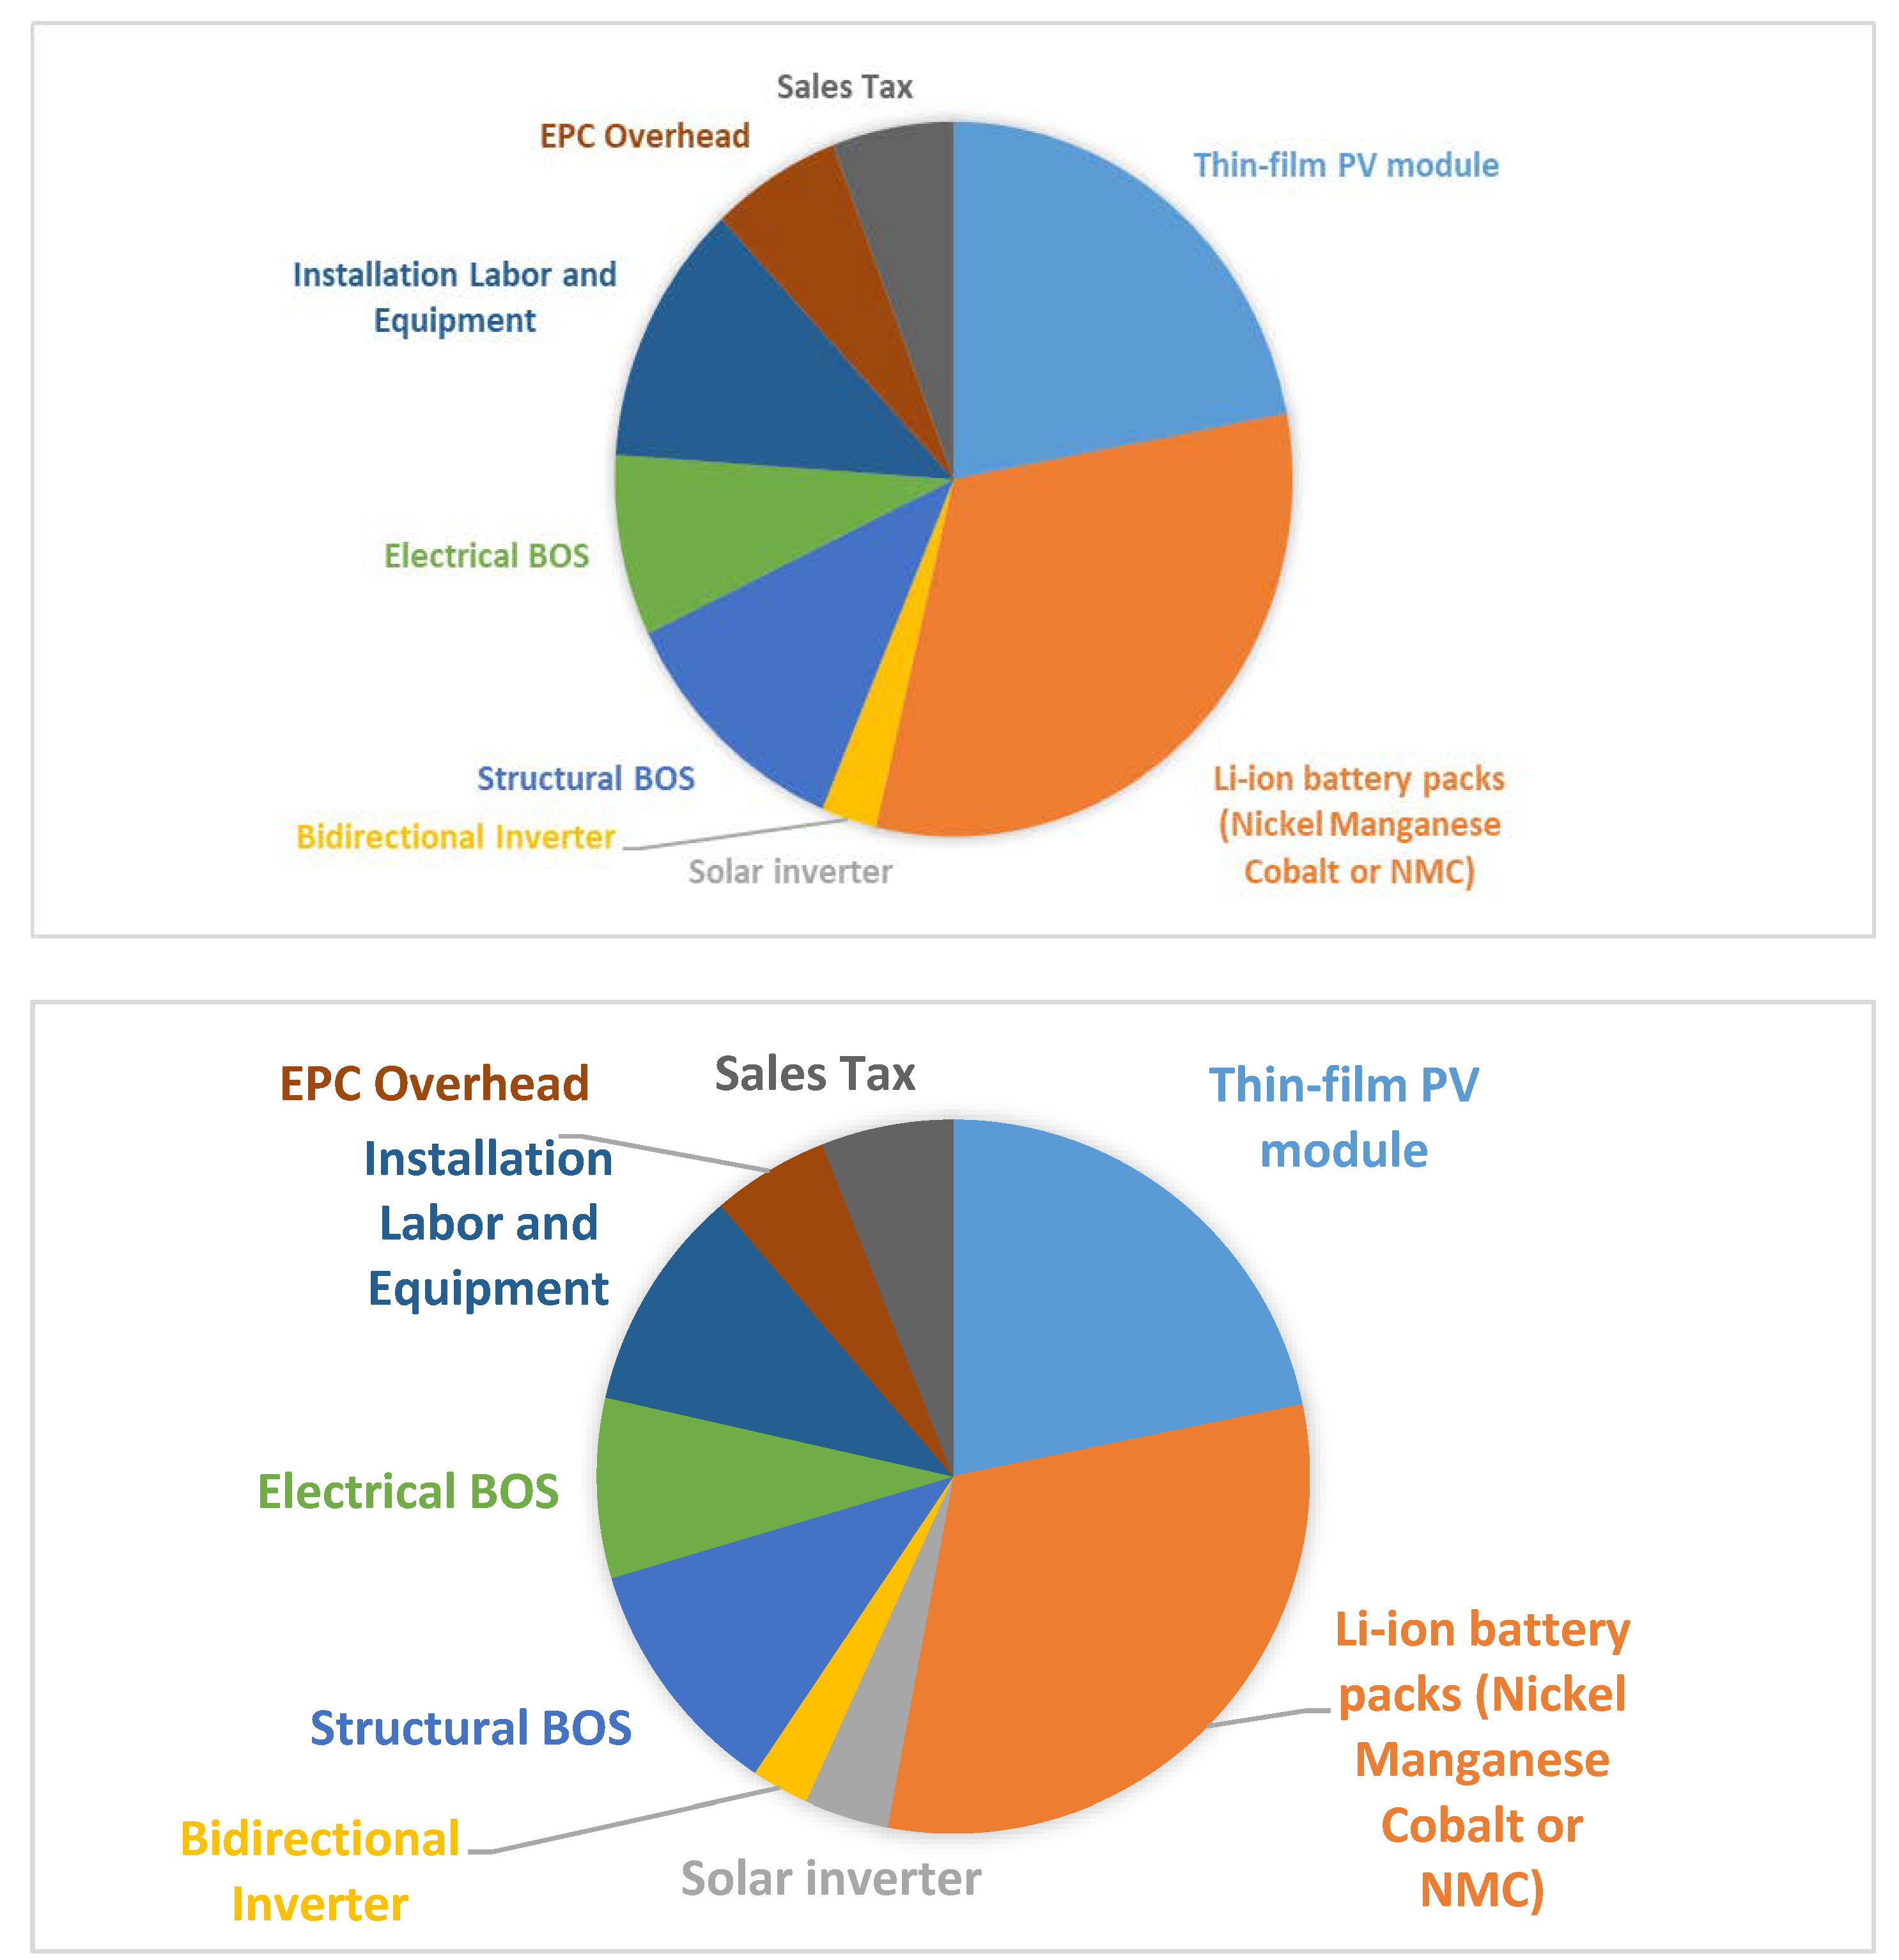
As seen from
Figure 11, DC-coupling configuration rather than AC-coupling systems results in a 1–2% lower total capital cost, which is the net result of cost differences in the categories of solar inverter, structural BOS, electrical BOS, labor, EPC and developer overhead, sales tax, contingency and profit. For an actual deployment of PVS, cost savings may not be the only factor in choosing DC or AC coupling because factors such as retrofit considerations, system performance (including energy loss due to clipping), design flexibility and O&M should be considered. AC-coupled systems are prevalent currently due to market maturity and other technical considerations which will be discussed later.
The LCOO comparison detailed below in
Table 5 consists of the installed costs, fixed and variable operation & maintenance (O&M) as well as fuel costs for each generation technology that is, PVS and CT. The annual fixed O&M includes general plant maintenance, labor, asset management, property taxes and other cost categories. The annual target period output required is assumed to be constant for this study although it depends on the system degradation and resource availability.
The heat rate of a generator measured as the amount of British thermal units (Btu) required to generate a kWh of electricity. It is the metric most commonly used to represent the efficiency of commercial generators (Energy Information Administration (EIA), 2019). The heat rate for CT plant was obtained from EIA’s Annual Electric Generator Report 2018. The calculations for fuel costs for target period generation are straightforward since it takes the product of the heat rate of individual technology, fuel cost per MMBtu and the target period generation (in MWh). Considering the high fixed and variable O&M costs (mainly start-up costs) as well as fuel costs of natural gas over the 20-year period, the numbers clearly put PVS as much more cost-effective compared to natural gas-fired technologies such as combustion turbine (CT) though PVS is still dependent on the 30% tax credit for this competitive advantage.
As mentioned previously, for a similar capacity factor of greater than 98% during an extended target period window, larger battery capacity would be required which would lead to higher costs. Based on a thorough techno-economic comparison to natural gas power plants, PVS offers a cleaner and cost-effective source of generation for firm capacity provision in California. The analysis considering comparison between PVS and CT with the eventual ramp-down of the Investment Tax Credits (ITC) has been covered in the subsequent sections.
Environmental “Costs” of Natural Gas-fired Power Plant Operation
Utilizing PVS systems for providing peaking capacity can also provide an environmental value in the form of avoided emissions. Although, environmental costs are not extensively accounted for in PPAs and other financial metrics, there is an increasing consensus that these ‘avoided costs’ need to be included in the initial screening and assessments of generation technologies’ operations for future capacity additions in the US. Also, with technologies such as carbon capture and storage (CCS) becoming more prevalent in new conventional capacity additions, it is important to understand that these technologies increase the cost of operating these plants significantly. For the purpose of this study, we consider environmental costs as ‘external costs of emission’ from the operation of conventional power plants such as simple peakers and combined cycle plants.
The US government estimated the social cost of carbon to be approximately
$46 in 2017 dollars for a ton of emissions in 2017 [
15]. For example, burning one gallon of petroleum gasoline produces roughly 9 kg of CO
2, so a social cost of carbon value of
$46/metric ton CO
2 corresponds to
$0.41 per gallon. In this study, we use a
$53/metric after accounting for inflation and other factors. Also, since carbon dioxide is only one of many greenhouse gases; other gases including methane, nitrous oxide, sulfur dioxide and hydrofluorocarbons also need to be included in external cost calculations [
15]. The external cost methodology is straightforward in terms of calculation since it estimates region-specific emissions from conventional peaker plants from the amount of fuel usage annually. The annual fuel input to these plants can be back-calculated from the energy required from the plants during the summer peak period in California.
The data for output emission rates has been obtained from EPA’s eGRID 2016 database which contains region-specific emission data from conventional technologies in the US. In this study we consider the three major categories of emissions—carbon dioxide, sulfur dioxide and nitrogen oxides. Carbon dioxide (CO
2) is one of the major greenhouse gases contributing to global warming while sulfur dioxide (SO
2) and nitrogen oxides (NO
x) are air pollutants emitted from fossil fuel power plants. The marginal costs of these emissions (in
$/metric ton) have been obtained from Wiser et al. (2016) [
16] and Sinha et al. (2013) [
17] which provide detailed tables for obtaining the unitized marginal cost values. The marginal cost values were converted from 2016 into 2018 value using inflation and CPI data in the US. The emissions from material and component manufacturing for CC/CT, PV and BESS production have not been included in the study and can form part of future research studies [
18]. The analysis only considers CO
2, SO
2 and NO
x emissions excluding other pollutants such as mercury, cadmium, lead, PM
2.5 and so forth, since they are minor in comparison to the above pollutants [
17].
Table 6 shows the evaluation of external costs of using conventional combustion turbine to provide peak demand during specific hours annually compared to PVS power plants which are operational emission-free.
Currently, the energy contracts or PPAs for PVS systems do not include detailed environmental attributes as to how much exactly be the operation of PVS linked to the emissions avoided and the value associated with that. In future efforts, a detailed cradle to grave comparison between PVS and other competing technologies will shed more light on this subject. It is clearly seen from above that utilizing peaker plants (CT) result in significant emissions and environmental costs which can be avoided with PVS.
4. Discussion
Utility-scale PV plus battery storage systems or PVS, are emerging to be a cost-effective and zero-emissions generation source for providing non-baseload electricity to California and other states in the US. With a massive decrease in capex for CdTe PV and Li-ion batteries, the number of standalone and hybrid systems is rising across the US. As the number of utility-scale solar installations grow in the United States, it is increasingly important for utilities/developers to consider battery storage systems as a complementary asset to reduce the intermittency of variable renewable energy.
In this study, we have looked at Li-ion battery operation in conjunction with PV for providing high capacity factors which are comparable to gas peaker plants while also providing a much cleaner form of energy source. The findings from the modeling and simulation effort utilizing the First Solar’s PlantPredict modeling tool show that when a 60 MW/240 MWh Li-ion battery energy storage system is combined with a 50 MW PV system; the system can provide high capacity factors (>98%) during the target period window (April to September 7–10 p.m.). The PV energy for the rest of the duration could be sold in the real-time market depending upon the market prices thereby adding another revenue stream which is unavailable to gas peakers since it is typically much more expensive to start and stop the power plant.
It is understood that different states across the US may have different target period windows which can be studied using the methodology provided in the report. Another factor that needs further discussion the effect of decline in ‘performance ratio’ calculated in PlantPredict during the target period window (50 MWAC PV-60 MW/240 MWh BESS PVS) in California. Performance ratio is the ratio of the measured output of a solar system to the expected output. This decrease may be attributed to decrease in PV module performance due to extremely high temperatures which lead to loss in output. Further technological advancements into increasing this performance ratio may result in higher energy production from PV and higher capacity factors during the target period which usually occurs during the summer months.
The lifetime cost of operation (LCOO) comparison was conducted between PVS and simple cycle gas turbines since these are competing technologies bidding for firm capacity provision services. The cost analysis takes 2018 costs and tax incentives for renewable energy systems although it does not incorporate inflation, price forecasts or discount rates and thus represents a heuristic for evaluating relative costs rather than a robust cost forecast. The PVS installed cost benchmark was obtained from recent literature published by NREL [
13]. The installed and O&M costs for simple cycle natural gas plants were obtained from EIA’s Annual Technology Baseline 2019 which is a decent representation of the larger US market. Since PVS offers a zero emissions energy generation source, an environmental cost analysis was done to analyze the theoretical costs of emissions from simple and combined cycle gas power plants using EPA data for emissions from non-baseload power plants. Overall, the study demonstrates the following observations:
Suitably sized AC-coupled PVS can typically meet firm capacity requirements of over 95% (usually specified in RFPs) and even higher levels of capacity factors during the target period window. In this particular case the TP window was April to September from HE20–HE22 with TPCF of 98.5%.
The PVS system was simulated using First Solar’s PlantPredict solar-storage modeling tool for three locations in California; San Luis Obispo, San Bernardino and Sonoma. The system simulated here; 50 MW PV paired with 60 MW/240 MWh Li-Ion BESS (4 h duration) had a target period capacity factor (TPCF) of 98.5%.
Without tax incentives currently, the installed costs for a 50 MW
AC PV with 60 MW/240 MWh BESS costs around
$132M compared to
$75M for a 70 MW simple cycle gas plant (CT). But considering the lifetime costs of operation including fuel costs as well as the tax credits (ITC), PVS is considerably a better option (
$122M compared to
$147M) since the aggregate lifetime costs are much lesser compared to simple cycle gas power plants, even if environmental costs are not included (shown in
Figure 12). This can be attributed to the high variable O&M costs and the fuel costs for natural gas power plants. The performance ratio (PR) of the PVS system decreases in the summer due to higher temperatures causing thermal losses in the PV modules (shown in
Figure 13) although due to higher irradiance in the summer, the generation outputs are consistently higher.
The environmental costs associated with CO2, SO2 and NOX emissions are calculated to be around $833 K annually considering the cost of emissions from non-baseload power plants which cause significant environmental damage and contribute to global warming. These costs are currently not accounted for in lifetime costs but with growth of carbon accounting in the future, these costs may be added to a project’s economic considerations.
The environmental costs of PVS system operation were negligible due to the batteries being charged from PV-generated energy. The environmental costs of PV and BESS material mining and manufacturing were out of scope for this study. CT plants result in approximately $833K annually in increased environmental costs due to emissions from their operation for the cases evaluated (50 MWAC PV with 60 MW/240 MWh BESS and Conventional CT 70 MW power plant). Since these environmental costs are not attributed into PPA prices currently, they were kept separate from the cost comparisons. The motive for conducting the environmental cost analysis was to portray the environmental benefits of PVS systems compared to fossil-fuel based power plants. In the future, if emission costs are accounted for in financial calculations, PVS power plants would prove to have an even better competitive advantage than it has currently.
Based on the learning rate of PVS as well as drastic cost reductions especially in the Li-Ion battery market with prices projected to fall to at least
$156/kWh based on a recent NREL report [
19]. It is not hard to project that PVS would be a cost-effective competitor to natural gas plants in the solar-rich areas of western and south-western U.S. for years to come. The NREL report projects that in 2050 battery prices would drop to
$150/kWh from the current
$380/kWh which is a moderate assumption. US natural gas prices are also projected to drop to as little as
$2/MMBtu as domestic production reaches new highs after the shale gas boom in the past few years. The details of this analysis are shown in
Table 7. A quick analysis of the LCOO for PVS and CT with projections for cost reductions in battery packs, natural gas price reductions and ITC ramp-down has been shown in
Figure 14. The bar chart clearly shows that even if ITC is reduced to the 10% level, PVS remains a more economically viable option than gas peakers in the long-term.
5. Conclusions
PVS can be utilized in multiple configurations, depending on the degree of coupling and the sizing of components. Initially we discussed a novel target period capacity factor framework which is being utilized in the industry currently to assess the value that PVS can provide in the capacity market. Then a specific case study was conducted to understand the underlying techno-economic and environmental attributes of PVS compared to conventional gas peakers in California. In this paper, it has been established that PVS can be a technologically, economically and environmentally sustainable option for capacity addition to meet the peak demand with high capacity factors during California’s summer months. The 4-h BESS paired with a 50 MW PV system studied here had the ability to discharge at near its full capacity for 3 h providing high capacity factor in the target period. Due to variability of renewable energy generation that is, its reduction of solar resources during the peak demand period, battery storage can act as a complement to the PV system by storing energy during the day. This results in higher capacity factors during the peak demand period.
Evaluating a specific configuration, from the system owner’s perspective, requires calculating the net costs and values of the system via a detailed accounting of costs and benefits. In this paper, we understood the installed and operating costs of a typical PVS system compared to other competing technologies for provision of firm capacity in California. Environmental costs of utilizing gas peaker plants were also evaluated. The zero emissions and sustainable nature of PVS operation is one of the strengths of the system. In summation, PVS can provide a cost-effective and sustainable alternative to natural gas peaker plants over their lifecycle even if the tax incentives and rebates are faded-out in the future due to the falling cost of batteries and environmental advantages compared to gas peakers.
Future research areas may include simulating other PV and battery chemistries for providing peaking capacity which depends on technological advancements and market maturity. Another future research endeavor would be to look at locations outside California specifically in the East Coast states such as New York, Massachusetts and Pennsylvania. Recently, flow batteries have been tested in the laboratory to be suitable for longer-duration storage (albeit with lesser round-trip efficiency) which may tilt the scale away from Li-ion batteries for time-shifting and capacity applications. Another important avenue for research would be to conduct sensitivity analysis using Monte Carlo simulations to study the effect of variability in PV output on the TPCF of the PVS system. As mentioned before, the performance ratio decreases during the target period months due to temperature coefficient related reduction in cell efficiency which affects the net plant output from PV and the BESS, making it a possible area for further scientific research.
Author Contributions
Conceptualization, S.R. and P.S.; Methodology, S.R.; software, S.R.; validation, S.R., P.S. and S.I.S.; formal analysis, S.R.; investigation, S.I.S.; resources, P.S.; data curation, X.X.; writing—original draft preparation, S.R.; writing—review and editing, P.S. and S.I.S.; supervision, P.S.; project administration, P.S.; funding acquisition, S.I.S. All authors have read and agreed to the published version of the manuscript.
Funding
Funded under Quantum Energy & Sustainable Solar Technologies (QESST), an Engineering Research Center under Department of Energy (DOE) and National Science Foundation (NSF).
Acknowledgments
The authors would like to acknowledge the guidance provided by First Solar especially the PVS Development Team including Rob Van Haaren, Beth Bremer and Azhir Barodawala.
Conflicts of Interest
The authors declare no conflict of interest.
Appendix A
Table A1.
Preliminary configuration of the PV array used for simulation.
Table A1.
Preliminary configuration of the PV array used for simulation.
| Mounting Type | Horizontal Tracking |
|---|
| Tilt Angle | N.A. |
| Rotational Limits | −45/+45 |
| Tracking Method | True-Tracking by First Solar |
| Average Azimuth | 180 |
| Average Row Spacing | 7.62 m |
| Average Ground Coverage Ratio (GCR) | 45.99% |
Table A2.
Parameters for the PVS system analyzed in California for providing peaking capacity.
Table A2.
Parameters for the PVS system analyzed in California for providing peaking capacity.
| Parameter | Value |
|---|
| PV System Size (thin-film) | 50 MW AC (60 MW DC) |
| PV Orientation | Horizontal Tracking (−45 to +45) |
| Inverter Loading Ratio (ILR) (DC-AC Ratio) | 1.2 |
| Battery Storage Power | 60 MW |
| Battery Storage Energy Capacity | 4 h (240 MWh) |
| Battery Storage Efficiency | 85% AC-AC |
Table A3.
Simulation settings for the PVS system dispatch model in Plant Predict.
Table A3.
Simulation settings for the PVS system dispatch model in Plant Predict.
| Parameter | Value |
|---|
| Time frame | 1 January 2010–31 December 2010 |
| Transposition Model | Perez |
| Degradation Rate | 0.5% per year |
| Weather Database | National Solar Radiation Database (NSRDB) |
| Time Step | 60 min |
Table A4.
Mathematical variables in dispatch logic in Plant Predict 1.
Table A4.
Mathematical variables in dispatch logic in Plant Predict 1.
| Variable | Name | Unit |
|---|
| sdcnp | Nameplate Energy Capacity | [Wh] |
| sussoc | Energy Capacity Factor | unitless |
| sdcus | Initial Usable Energy Capacity | [Wh] |
| dcrte | Initial Roundtrip DC Efficiency | [%] |
| sac | Inverter Real Power | [W] |
| effsinv | Inverter Efficiency | [%] |
| PLoss,MV | Storage MV Transformer Losses | [W] |
| PLoss,HV | Plant HV Transformer Losses | [W] |
| PLoss,T | Transmission Line Losses | [W] |
| sauxconst | HVAC Constant Loss | [W/MWh] |
| sauxop | HVAC Operating Loss | [W/MW] |
| ic | Power Output Limit | [W] |
| Pavail | Plant Power with Availability Loss Applied | [W] |
| PAC,out,PV | PV MV Transformer Output | [W] |
| TP | Target Period Hour | {User True/False selection} |
| DM | Dispatch Model | {User selection} |
| Δt | Time step | [s] |
Appendix B
Table A5.
Unitized cost assumptions for co-located DC and AC coupled PVS systems.
Table A5.
Unitized cost assumptions for co-located DC and AC coupled PVS systems.
| | Unit | Co-Located DC-Coupled PVS | Co-Located AC-Coupled PVS | Data Source |
|---|
| Thin-film PV System Installed Cost including solar & bidirectional inverters. | 2018 $/W DC | $1.08 | $1.11 | First Solar PVS Analytics |
| Li-ion Battery Installed Cost (includes only battery packs) | 2018 $/kWh | $209 | $209 | NREL PVS Cost Benchmark (Fu et al., 2018) |
| PV Fixed Operation & Maintenance (O&M) including inverter replacement | 2018 $/kW/year | $8 | $8 | NREL PV Cost Benchmark Q1 2018 (Fu et al., 2018) |
| Li-ion BESS O&M Costs per power unit (2% escalation) | 2018 $/kW/year | $2 | $2 | First Solar PVS Analytics |
| Li-ion BESS O&M per energy unit (2% escalation) | 2018 $/kWh/year | $3 | $3 | First Solar PVS Analytics |
| Li-ion BESS Extended Warranty Costs 1 | 2018 $/kWh/year | $2.5 | $2.5 | First Solar PVS Analytics |
Table A6.
Unitized cost assumptions for simple cycle (Conventional Turbine) power plant.
Table A6.
Unitized cost assumptions for simple cycle (Conventional Turbine) power plant.
| | Unit | Simple Cycle Conventional Combustion Turbine (CT) 1 |
|---|
| Overnight Capital Cost | $/kW | 1126 |
| Levelized Fixed O&M | 2018 $/kW-year | 18.03 |
| Variable O&M | 2018 $/MWh | 3.61 |
| Carbon Emissions | mm Tons/year | 2.50 |
| Heat Rate | Btu/kWh | 9600 |
| Fuel Price (Natural Gas) | $/MMBtu | 2.75 |
Appendix C
According to Denholm et al. [
5], the overall capacity credit the annualized cost of new capacity establishes a value per kilowatt of firm capacity provided by a PV plus storage system. If we assume the 50-MW PV plant has a 40% capacity credit and we add a 30-MW storage plant with 100% capacity credit, the resulting system can avoid the construction of a 50 MW peaking power plant.
Capacity Credit for Solar PV = 20% (Low-Estimate Value of Capacity Factor for Solar Installations in CA)
Capacity Credit for Battery Energy Storage System (assuming full SoC) = 100%
Technical Specification of Conventional Gas Peaker Replacement
=0.20 × 50 MW + 1.0 × 60 MW
=70 MW
References
- Miller, L.N.; Hayhoe, K.; Jin, J.; Auffhammer, M. Climate, Extreme Heat, and Electricity Demand in California. J. Appl. Meteorol. Climatol. 2008, 47, 1834–1844. [Google Scholar] [CrossRef]
- California Renewables Portfolio Standard Program: Emissions of Greenhouse Gases. Available online: https://leginfo.legislature.ca.gov/faces/billNavClient.xhtml?bill_id=201720180SB100 (accessed on 30 October 2019).
- CEC. Once-Through Cooling Phase-Out; CEC: Sacramento, CA, USA, 2017. Available online: https://ww2.energy.ca.gov/renewables/tracking_progress/documents/once_through_cooling.pdf (accessed on 25 May 2019).
- Bade, G. APS to Install 50 MW, 135 MWh Solar-Shifting Battery. Available online: https://www.utilitydive.com/news/aps-to-install-50-mw-135-mwh-solar-shifting-battery/516850/ (accessed on 13 July 2019).
- Denholm, L.P.; Margolis, R.M.; Eichman, J.D. Evaluating the Technical and Economic Performance of PV Plus Storage Power Plants; Technical Report; National Renewable Energy Lab.: Golden, CO, USA, 2017. [Google Scholar] [CrossRef]
- Kroposki, B. Integrating High Levels of Variable Renewable Energy into Electric Power Systems. J. Mod. Power Syst. Clean Energy 2017, 5, 831–837. [Google Scholar] [CrossRef] [Green Version]
- Deign, J. Did Tesla’s Big Australian Battery Kill the Business Case for More?|Greentech Media. Available online: https://www.greentechmedia.com/articles/read/has-teslas-big-australian-battery-killed-the-business-case-for-more (accessed on 28 March 2019).
- Energy Information Administration. Peak-to-Average Electricity Demand Ratio Rising in New England and Many Other U.S. Regions. Available online: https://www.eia.gov/todayinenergy/detail.php?id=15051 (accessed on 4 October 2019).
- Perez, R.; Taylor, M.; Hoff, T.; Ross, J.P. Reaching Consensus in the Definition of Photovoltaics Capacity Credit in the USA: A Practical Application of Satellite-Derived Solar Resource Data. IEEE J. Sel. Top. Appl. Earth Obs. Remote Sens. 2008, 1, 28–33. [Google Scholar] [CrossRef]
- Jorgenson, J.; Denholm, P.; Mehos, M. Estimating the Value of Utility-Scale Solar Technologies in California Under a 40% Renewable Portfolio Standard; Technical Report; National Renewable Energy Lab.: Golden, CO, USA, 2014. [Google Scholar] [CrossRef] [Green Version]
- Andrew, M.; Wiser, R. An Evaluation of Solar Valuation Methods Used in Utility Planning and Procurement Processes; Ernest Orlando Lawrence Berkeley National Laboratory: Berkeley, CA, USA, 2012. Available online: https://emp.lbl.gov/sites/all/files/lbnl-5933e.pdf (accessed on 5 October 2019).
- California Independent System Operator (CAISO). 2016 Annual Report on Market Issues and Performance; CAISO: Folsom, CA, USA, 2017. [Google Scholar]
- Vartiainen, E.; Masson, G.; Breyer, C.; Moser, D.; Román Medina, E. Impact of weighted average cost of capital, capital expenditure, and other parameters on future utility-scale PV levelised cost of electricity. Prog. Photovolt. Res. Appl. 2019, 1–15. [Google Scholar] [CrossRef] [Green Version]
- Fu, R.; Remo, T.; Margolis, R. 2018 U.S. Utility-Scale Photovoltaics-Plus-Energy Storage System Costs Benchmark; Technical Report; National Renewable Energy Lab.: Golden, CO, USA, 2018. [Google Scholar]
- Gillingham, K.; Stock, J.H. The Cost of Reducing Greenhouse Gas Emissions. J. Econ. Perspect. 2018, 32, 53–72. [Google Scholar] [CrossRef] [Green Version]
- Sinha, P.; de Wild-Scholten, M.; Wade, A.; Breyer, C. Total Cost Electricity Pricing of Photovoltaics. In Proceedings of the 28th European Photovoltaic Solar Energy Conference, Paris, France, 30 September–4 October 2013. [Google Scholar]
- Wiser, R.; Millstein, D.; Mai, T.; Macknick, J.; Carpenter, A.; Cohen, S.; Cole, W.; Frew, B.; Heath, G. The Environmental and Public Health Benefits of Achieving High Penetrations of Solar Energy in the United States. Energy 2016, 113, 472–486. [Google Scholar] [CrossRef] [Green Version]
- Balakrishnan, A.; Brutsch, E.; Jamis, A.; Reyes, W.; Strutner, M.; Sinha, P.; Geyer, R. Environmental Impacts of Utility-Scale Battery Storage in California. In Proceedings of the IEEE PVSC, Chicago, IL, USA, 16–19 June 2019. [Google Scholar]
- Cole, W.J.; Allister, F. Cost Projections for Utility-Scale Battery Storage; Technical Report; National Renewable Energy Lab.: Golden, CO, USA, 2019. [Google Scholar] [CrossRef] [Green Version]
Figure 1.
Electricity consumption in California for 2017 (residential and non-residential sectors) by county. Source: California Energy Commission (CEC, 2018) staff.
http://ecdms.energy.ca.gov/.
Figure 1.
Electricity consumption in California for 2017 (residential and non-residential sectors) by county. Source: California Energy Commission (CEC, 2018) staff.
http://ecdms.energy.ca.gov/.
Figure 2.
California’s peak to average electricity demand ratio has been generally rising in the past decade, particularly in Southern California, although it is highly dependent on yearly climate, housing stock and other economic conditions. Source: Energy Information Administration (EIA. 2016).
Figure 2.
California’s peak to average electricity demand ratio has been generally rising in the past decade, particularly in Southern California, although it is highly dependent on yearly climate, housing stock and other economic conditions. Source: Energy Information Administration (EIA. 2016).
Figure 3.
An illustration of a typical 12 × 24 matrix provided by the utility representing the normalized value of energy during different times over the year with the highlighted green representing the target period window. Source: First Solar PVS Analytics.
Figure 3.
An illustration of a typical 12 × 24 matrix provided by the utility representing the normalized value of energy during different times over the year with the highlighted green representing the target period window. Source: First Solar PVS Analytics.
Figure 4.
An illustration of Levelized Cost of Electricity (LCOE) vs. target period capacity factor (TPCF) showing the different system sizes (represented by dots) which can meet the TPCF requirement. Source: First Solar PVS Analytics.
Figure 4.
An illustration of Levelized Cost of Electricity (LCOE) vs. target period capacity factor (TPCF) showing the different system sizes (represented by dots) which can meet the TPCF requirement. Source: First Solar PVS Analytics.
Figure 5.
An example of LCOE vs TPCF portraying different technologies, system sizes and configurations which meet the TPCF requirement of 90% which is specified in the request for proposals (RFP). Source: First Solar PVS Analytics.
Figure 5.
An example of LCOE vs TPCF portraying different technologies, system sizes and configurations which meet the TPCF requirement of 90% which is specified in the request for proposals (RFP). Source: First Solar PVS Analytics.
Figure 6.
(a) “Duck Curve” in CAISO and (b) Target Period window selected for analyzing the ability of PVS to provide high capacity factors during this duration. Source: CAISO, 2015.
Figure 6.
(a) “Duck Curve” in CAISO and (b) Target Period window selected for analyzing the ability of PVS to provide high capacity factors during this duration. Source: CAISO, 2015.
Figure 7.
Single Line Diagram for AC-Coupled PVS showing the different nodes for power calculation purposes. Source: First Solar Plant Predict Resource Center.
Figure 7.
Single Line Diagram for AC-Coupled PVS showing the different nodes for power calculation purposes. Source: First Solar Plant Predict Resource Center.
Figure 8.
A typical profile for PV and Battery Energy Storage System (BESS) net energy for a typical summer day (27 June) in San Bernardino, California.
Figure 8.
A typical profile for PV and Battery Energy Storage System (BESS) net energy for a typical summer day (27 June) in San Bernardino, California.
Figure 9.
PVS Net Energy Delivered in Year-1 (in MWDC) Heat Map for the 50 MWAC PV-60 MW/240 MWh BESS system for target period 7–10 p.m. in (a) San Bernardino, CA (b) San Luis Obispo, CA and (c) Sonoma, CA.
Figure 9.
PVS Net Energy Delivered in Year-1 (in MWDC) Heat Map for the 50 MWAC PV-60 MW/240 MWh BESS system for target period 7–10 p.m. in (a) San Bernardino, CA (b) San Luis Obispo, CA and (c) Sonoma, CA.
Figure 10.
PVS Net Energy Delivered (MWDC) Heat Map for the 50 MWac PV-60 MW/240 MWh BESS system in Sonoma, CA for target period 6–10 p.m.
Figure 10.
PVS Net Energy Delivered (MWDC) Heat Map for the 50 MWac PV-60 MW/240 MWh BESS system in Sonoma, CA for target period 6–10 p.m.
Figure 11.
Breakdown of Engineering Procurement & Construction (EPC) Costs for DC (top) and AC Coupled (bottom) PVS Systems.
Figure 11.
Breakdown of Engineering Procurement & Construction (EPC) Costs for DC (top) and AC Coupled (bottom) PVS Systems.
Figure 12.
Lifetime cost of operation (LCOO) comparison between PVS (a 50 MWAC PV with 60 MW/240 MWh BESS) and Conventional CT (70 MW) power plants in M$ over twenty year system life without and with considering yearly environmental cost of operation due to emissions.
Figure 12.
Lifetime cost of operation (LCOO) comparison between PVS (a 50 MWAC PV with 60 MW/240 MWh BESS) and Conventional CT (70 MW) power plants in M$ over twenty year system life without and with considering yearly environmental cost of operation due to emissions.
Figure 13.
Performance Ratio of the PV plant declines during the target period window leading to a proportional loss of PV production capability during the summer months (April–September).
Figure 13.
Performance Ratio of the PV plant declines during the target period window leading to a proportional loss of PV production capability during the summer months (April–September).
Figure 14.
Future LCOO comparison between PVS and Combustion Turbine (CT) based on Li-Ion BESS cost reductions, natural gas price reduction and ITC ramp down.
Figure 14.
Future LCOO comparison between PVS and Combustion Turbine (CT) based on Li-Ion BESS cost reductions, natural gas price reduction and ITC ramp down.
Table 1.
Different types of system configurations for Photovoltaic (PV) plus battery storage systems.
Table 1.
Different types of system configurations for Photovoltaic (PV) plus battery storage systems.
| Type of Coupling | Co-Located? | Point of Common Coupling | Source of Energy Stored |
|---|
| Independent | No | None | Grid |
| AC Coupled | Yes | Medium voltage substation | Grid/PV |
| DC Coupled | Yes | DC Side of Inverter | Grid/PV |
Table 2.
General framework for inputs and analyses of utility-scale PV plus battery storage systems (PVS) based on market type and characteristics in the US.
Table 2.
General framework for inputs and analyses of utility-scale PV plus battery storage systems (PVS) based on market type and characteristics in the US.
| Market | Inputs | Analysis |
|---|
| Bilateral Contract through RFPs and Power Purchase Agreements (PPA). | When does the grid need firm energy (hours of day and months of year)?
Given by RFP or utility modeling | Determine the capacity value of PVS during the capacity delivery period. Based on above needs for total power capacity, perform a dispatch analysis to determine needed duration (typically 2 h to 4 h).
|
| Merchant Bidding through Wholesale Market operation | How do we optimize the IRR of the project in merchant operation? | Using a forecast on future power prices, experiment with different storage sizes such that marginal revenue = marginal cost. Determine energy (MWh): Based on pricing forecasts above, perform a State of Charge (SOC) analysis to determine needed duration to capture majority of high price events (typically 2 h to 5 h).
|
Table 3.
Simulation results for PVS in 3 different locations across California.
Table 3.
Simulation results for PVS in 3 different locations across California.
| Location | Horizontal-Axis Tracker PV AC Capacity | Li-Ion Battery AC Power Capacity | Li-Ion Battery Energy Capacity | Target Period Net Energy (HE20–HE22) | Plant Net Energy | Capacity Factor (or Availability Factor) during TP |
|---|
| San Luis Obispo, CA | 50 MW | 60 MW | 240 MWh | 36,373 MWh | 122,620 MWh | 98.52% |
| San Bernardino, CA | 50 MW | 60 MW | 240 MWh | 36,333 MWh | 122,050 MWh | 98.50% |
| Sonoma, CA | 50 MW | 60 MW | 240 MWh | 36,311 MWh | 122,970 MWh | 98.40% |
Table 4.
System installed cost breakdown for AC vs. DC Coupled PVS.
Table 4.
System installed cost breakdown for AC vs. DC Coupled PVS.
| Component | Cost/Watt (for AC Coupled PVS) | 50 MW PV with 60 MW/240 MWh DC-Coupled PVS [14] | 50 MW PV with 60 MW/240 MWh AC-Coupled PVS [14] |
|---|
| PV module | $0.35/W | $17.5M | $17.5M |
| Li-ion battery packs (Nickel Manganese Cobalt or NMC) | $0.84/W | $50.1M | $50.1M |
| Solar inverter | $0.06/W | n/a | $4.2M |
| Bidirectional Inverter | $0.04/W | $2.8M | $2.8M |
| Structural BOS | $0.18/W | $12.6M | $12.6M |
| Electrical BOS | $0.13/W | $9.1M | $9.1M |
| Installation Labor and Equipment | $0.16/W | $11.2M | $11.2M |
| EPC Overhead | $0.09/W | $6.3M | $6.3M |
| Sales Tax | $0.1/W | $7M | $7M |
| Sum of EPC Cost | | $123.6M | $127.8M |
| Land Acquisition | - | $2M | $2M |
| Interconnection & Permitting Fee | - | $2.4M | $2.4M |
| Total System Cost | | $128M | $132M |
Table 5.
Lifecycle Cost of Operation Comparison of the various non-baseload generation technologies for firm capacity provision in California.
Table 5.
Lifecycle Cost of Operation Comparison of the various non-baseload generation technologies for firm capacity provision in California.
| S No. | Cost Parameter | 50 MWAC PV-60 MW/240 MWh BESS AC-Coupled PVS | 70 MW Conventional Combustion Turbine (CT) 1 |
|---|
| 1 | Plant Lifetime | 20 | 20 |
| 2 | Target Period Capacity Factor (HE18–HE20) | 98.5% | 95% |
| 3 | Total System Installed Costs (2018 $) | $132M | $79M |
| 4 | Lifetime Fixed O&M Costs 2 | $19.6M | $43.8M |
| 5 | BESS Extended Warranty Payment at $2/kWh/year 3 | $10.8M | - |
| 6 | Lifetime Variable O&M Costs | - | $3.1M |
| 7 | Lifetime Cost of Fuel with 1% price escalation 4 | - | $21M |
| 8 | Total Lifecycle Cost of Operation with 30% ITC + Fuel Costs 5 [3*] 6 + [4] + [5] + [6] + [7] | $122.8M | $146.9M |
Table 6.
External environmental costs of non-baseload generation plant operation based on marginal damage methodology.
Table 6.
External environmental costs of non-baseload generation plant operation based on marginal damage methodology.
| Emission | Marginal Cost (2018 $/metric ton) | Emission Rates for Peaker CT in WECC California 1 (lb/MWh) | Annual External Costs for CT ($) Based on Target Period Generation (33 GWh/year) |
|---|
| CO2 | 53 | 942.9 | $824,566 |
| SO2 | 1498.34 | 0.1 | $2472 |
| NOX | 463.39 | 0.8 | $6116 |
| Annual External Environmental Costs from TP Generation | | | $833,154/year |
Table 7.
Scenarios based on future BESS capital costs and natural gas cost projections.
Table 7.
Scenarios based on future BESS capital costs and natural gas cost projections.
| Scenario | Battery Cost Projections ($/kWh) 1 | Battery Cost Decrease% | Natural Gas Fuel Costs 2 ($/MMBtu) |
|---|
| Current (2019) | 380 | - | 2.75 |
| Short-term (2025) | 300 | 21.05% | 2.5 |
| Medium (2030) | 207 | 31.00% | 2.25 |
| Long (2040) | 156 | 24.64% | 2 |
© 2020 by the authors. Licensee MDPI, Basel, Switzerland. This article is an open access article distributed under the terms and conditions of the Creative Commons Attribution (CC BY) license (http://creativecommons.org/licenses/by/4.0/).


