Abstract
The eutrophication of surface waters is a natural process; however, anthropogenic activities significantly accelerate degradation processes. Most lakes in Poland and in the world belong to the poor and unsatisfactory water quality class. It is therefore necessary to limit negative anthropogenic impacts and introduce restoration methods, in particular those that are safe for the aquatic ecosystem. One of these is a pulverizing aeration Podsiadłowski method that uses only wind energy. The method allows for the moderate oxygenation of hypolimnion water, which maintains the oxygen conditions in the overlying water zone in the range of 0–1 mg O2·dm-1. The purpose of the work was to develop a new method of determining the efficiency of the aerator pulverization unit in the windy conditions of the lake. The method consists in determining the volumetric flow rates of water in the aerator pulverization unit, based on maximum hourly wind speeds. The pulverization efficiency in the conditions of Góreckie Lake was determined based on 6600 maximum hourly wind speeds in 2018. Based on the determined model, the theoretical performance of the machine was calculated, which in the conditions of Góreckie Lake in 2018 amounted to less than 79,000 m3 per year (nine months of the effective aerator operation).
1. Introduction
The progressive process of eutrophication of surface water leads to the deterioration of water quality. This phenomenon is not only observed in Poland [1,2], but it is also a global problem [3,4]. In many regions of the world there is also a problem of dried-up lakes [5], which results in the need to implement methods for their reconstruction [6]. Eutrophication causes a reduction in the amount of submerged vegetation [7]. Degradation processes are compounded by the uncontrolled flow of nutrients [8]. Generally, in aquatic ecosystems, it is assumed that rivers play a biogenic transport role while lakes have accumulative properties [9]. In order to improve water quality, it is therefore necessary to eliminate the inflow of pollutants by limiting their inflow [10]. Additionally, methods for supporting water reservoir management decisions are being developed [11]. It is also important to introduce appropriate restoration measures of a sustainable nature. Therefore, in 1995, in the Institute of Agricultural Engineering at the Agricultural University of Poznan (currently the Institute of Biosystems Engineering at the University of Life Sciences in Poznan), research began on the implementation of noninvasive methods of lake restoration, creating integrated technology for lake reconstruction. Pulverizing aeration was one of the methods introduced. The developed and patented technology enabled the use of wind energy in the process of releasing harmful anaerobic-transformation gases into the atmosphere in the bottom zone, while introducing atmospheric air in their place (including oxygen). A number of studies on the effectiveness of wind-driven pulverizing aerators have proven [12] that the constructed device is very effective in improving oxygen conditions in the bottom zone. Nevertheless, pulverizing aeration alone will not reverse eutrophication processes. The method can be used as a supplement to other methods, including limiting the supply of external nutrients and the chemical inactivation of phosphorus in water and bottom sediments. Over the years, the device has been equipped with a biogen-inactivation system that allows phosphorus to be blocked in the bottom sediments. The first inactivation system of this kind was installed on Góreckie Lake. Chemical inactivation of phosphorus compounds using iron in the near-bottom zone is only possible with the participation of oxygen. Therefore, pulverizing aeration of hypolimnion water is important. Oxygenation of near-bottom water not only supports the development of aerobic organisms, but also aims to block phosphorus in bottom sediments.
1.1. Characteristics of Góreckie Lake
Góreckie Lake is located in the National Park of Wielkopolska, in the area of the Poznan Lake District in Wielkopolska Voivodeship. The area of water surface is 104.1 ha, with an average depth of about 9 m. The maximum depth of the lake is 17.2 m [13]. There are two islands located in the lake area. The larger one, Castle Island, and the smaller one, Kopczysko. On Castle Island there are ruins of the nineteenth-century castle of Klaudyna Potocka of Działyński. It is a typical ribbon lake, without any surface tributaries. Its basin is divided naturally into two basins—a northwest one and southern one. The southern basin is characterized by steeply sloping banks and great depth. The northwest basin is much shallower and the banks are more gentle. The coastal zone of the reservoir is mostly covered with deciduous forests, which is why the shoreline is not developed [14]. The forest area in the immediate vicinity of the lake limits the impact of the agricultural sector, the surrounding forest provides an excellent filtration of fertilizers flowing from the fields. The location of the reservoir basin and the developmental structure of its drainage basin classify the lake as category II in terms of susceptibility to degradation. The first available information on the physicochemical conditions of the reservoir comes from the 1930s. At that time, research was carried out to determine water transparency at the time of the most intensive phytoplankton development (typical lake bloom). The obtained transparency results were very good, while the oxygen conditions were assessed as good in the water column of the whole lake. In 1941, a large palace was built along with a complex of other utility buildings on the eastern shore of the lake. One of them was a sewage-treatment plant. Water from the treatment plant flowed directly into Góreckie Lake [15]. After World War II ended, a preventorium for children suffering from tuberculosis was located in the complex. Wastewater from the preventorium is considered one of the reasons for the accelerated eutrophication of Góreckie Lake. At the end of the 1980s, the sewage supply from the preventorium was cut off. Despite cutting off the sewage inflow, in the next decade an increase in the trophy of Góreckie Lake was noted. The reason for the increase in the trophy of the lake was the presence of ever-larger flocks of wild geese living on the lake and in the surrounding area [16]. Research conducted in 2008 showed that in the early spring, very good oxygen conditions prevailed in the entire vertical section. Oxygen saturation was close to 100%. Unfortunately, the tests carried out in June showed there was already a very large oxygen deficit below the depth of three meters. Oxygen conditions did not improve until late autumn [15]. Table 1 presents selected parameters of Góreckie Lake from 1937–2008.

Table 1.
Changes in water transparency and pH in Góreckie Lake from 1937–2008 [13].
On the decision of the Scientific Council of the Wielkopolska National Park in December 2009, the restoration of Góreckie Lake was started. At that time, the wind-driven pulverizing aerator was mounted on the lake [17].
1.2. Pulverizing Aeration Method
One of the methods of mechanical lake restoration is the method of moderate oxygenation of hypolimnion water using wind-driven pulverizing aerators. In addition to improving oxygen conditions in the hypolimnion water, water circulation is forced and specific biological effects are obtained [10]. The technology of pulverizing aeration was developed by Professor Stanisław Podsiadłowski from the Institute of Agricultural Engineering at the Agricultural University of Poznan. The aerator uses only wind energy to drive the pulverization unit. The efficiency of the device depends primarily on wind speed. A properly designed pulverization unit in the machine enables the release into the atmosphere of harmful gases from the anaerobic transformation of organic matter (hydrogen sulfide, methane, and ammonia) and introduce in their place—in particular, oxygen [18]. The device maintains oxygen conditions in the bottom zone in the range of 0–1 mg O2·dm-1. According to Kowalczewska-Madura et al. [2], the advantage of moderate over intensive oxygenation is the maintaining of a positive redox potential at the sediment–water interface, which allows for phosphorus retention, limiting the mineralization of organic matter deposited in bottom sediments and allowing the anammox process to occur. As a result, ammonium nitrogen is oxidized to N2 forms and enables nitrification and denitrification processes, which result in nitrogen removal to the atmosphere [19]. The aerator wind turbine can drive the pulverization unit at a wind speed of 2 m∙s–1 [20]. Wind-driven pulverizing aerators (Figure 1) are fully mechanically resistant to impurities deposited in the bottom zone of the water where they work.
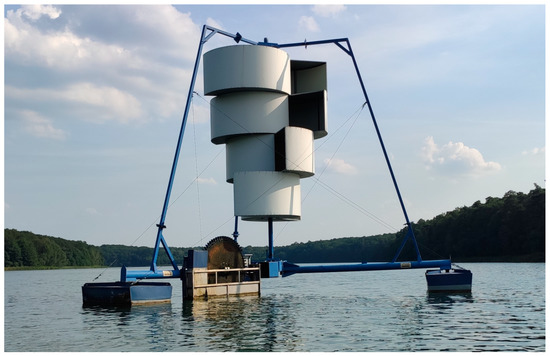
Figure 1.
Wind-driven pulverizing aerator located on Góreckie Lake.
There are two working chambers in the pulverization unit chamber, which work together as communicating vessels. Each chamber has three spigots to which suction and pressure ducts are connected. The pulverization wheel (paddle one) responsible for pumping water is driven by the main bevel gear of the aerator and the belt transmission system with a rotator motor [21]. Figure 1 shows the wind-driven pulverizing aerator, and Figure 2 shows a schematic diagram of the pulverization unit of the aerator.
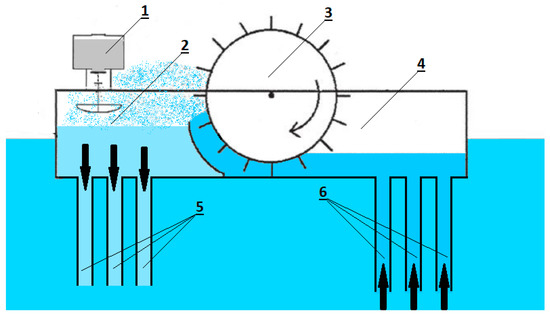
Figure 2.
Scheme of the pulverization unit in the aerator. Note: 1, coagulant applicator; 2, pressuring chamber; 3, pulverizing circle; 4, suction chamber; 5, pressuring hoses; 6, suction hoses.
The pulverizing aerator can be additionally equipped with a phosphorus-inactivation system. Depending on the coagulant used, the system can be controlled using the properties of the liquid [10] or using fuzzy interference [17]. Such a system ensures that a dose of 25 kilograms of coagulant is delivered to the basin per month [1]. Usually, iron sulfate is used for these purposes, and its dose supplements iron deficiency in the ecosystem. Phosphorus inactivation is effective when coagulation is carried out in the conditions of oxygenated water [22]. There is no literature dealing in a comprehensive manner with the subject of determining the volumetric model of water flow rate through the pulverizing unit of the Podsiadłowski aerator in conditions suitable for a given water reservoir. The methodology presented in this manuscript is innovative and it has not been published anywhere until now.
2. Materials and Methods
The aim of the paper was to determine the theoretical efficiency model of the aerator pulverization unit on the basis of maximum wind speeds (gusts) and its technical parameters. Then, based on the developed model, determination of theoretical volumetric flow rate throughout the entire 2018 season was done. The theoretical water flow efficiency was determined in this paper in relation to March, April, May, June, July, August, September, October, and November, i.e., all months when pulverizing aeration was performed. The tests were carried out in the windy conditions of Góreckie Lake.
Based on our own measurements and according to Equation (1), the theoretical efficiency of the pulverization unit during one rotation of the paddle wheel was determined.
where Pv—area of the pulverization wheel blade, Oc—pulverization wheel circumference, and Qr—theoretical efficiency of one pulverization wheel rotation.
Using Equation (2), the ratio of the wind turbine bevel gear to the aerator pulverization unit was determined.
where t—unit of time, rc—number of pulverization wheel revolutions per unit time, rwt—wind turbine speed per unit time, and ig—pulverizing aerator bevel gear ratio.
In the next stage, in accordance with Equation (3), a rotational speed model of the aerator pulverization wheel model was determined. The model was determined, based on wind speed. Data on wind speed were obtained based on our own research conducted from spring to late autumn of 2018 using the Davis Instruments Vantage Vue DAV 6250EU weather station. Using the weather station, maximum wind speeds were determined in 1 minute periods, while counting the number of revolutions of the aerator wind turbine. Tests were performed in dozens of repetitions for different maximum wind speeds. Based on collected results, the linear regression equation was in the form of a 2nd degree polynomial.
where y—determined linear regression equation and vm—the rotational speed of the pulverization wheel (r·min–1).
Using data from the meteorological station located in the area of Góreckie Lake, maximum wind speeds were determined for each hour of every day of the month, starting from March and ending in November. This was the period when intensive pulverizing aeration was performed (without taking into account the winter period, when the biological and chemical processes practically disappear). The station saves wind speed data with the exact date and time of the measurement. Several dozen of such measurements were performed during each hour, therefore to determine the maximum wind speeds for each hour, Equation (4) was used.
where vi,j…—successive wind speed values per hour and vmax—maximum wind speed for each hour.
After substituting the pulverization wheel rotational speed (vm) and maximum wind speeds for each hour (vmax) into the linear regression equation and multiplying the value by 60 (1 hour = 60 minutes), the rotational speed of the pulverization wheel for each hour of the analyzed period was obtained (Equation (5)).
where vh—rotational speed of the pulverization wheel (r·h–1).
Then, using Equation (6), the volumetric flow rate of the aerator pulverization unit was determined for each hour of the period of ongoing pulverization.
where q—volumetric flow rate in the pulverization unit (m3·h–1).
In the next stage of work, the theoretical volumetric flow rates for the pulverization mechanism were determined for each day of operation of the pulverizing aerator in the given year (Equation (7)). The results were presented in monthly record sheets.
where . Qtj—theoretical volumetric flow rate per one day (m3·d–1), q—theoretical volumetric flow rate per hour of the day, i—hour {1, 2, 3, …., 24}, and j—day of the month.
In the further part of the work, according to Equation (8), comparisons of theoretical volumetric water flow rates in the aerator pulverization unit for individual months of the year were presented.
where Qt—theoretical volumetric flow rate for one month (m3·m–1).
The final stage of the analysis was to calculate theoretical volumetric flow rates for the entire pulverization season (for a total of 9 months of aerator operation). Calculations were made in accordance with Equation (9).
where Q—theoretical volumetric flow rate for the entire year (m3·y–1).
3. Results
Determination of the theoretical efficiency of the pulverization unit during one rotation of the paddle wheel was possible thanks to the pulverization wheel measurements. The measurements, according to the methodology of work, were made on an aerator located on Góreckie Lake, where accordingly:
- Pulverization wheel diameter was 1.8 m;
- Blade height was 0.082 m;
- Blade width was 0.061 m.
After substituting the measured values to Equation (1), the theoretical efficiency value of one rotation of the pulverization wheel (paddle one) (Qr) in the pulverization unit was obtained. It amounted to 0.028 m3.
In the further part of this work, using Equation (2), the ratio of the wind turbine bevel gear to the aerator pulverization unit was calculated. Studies have shown that the number of pulverization wheel revolutions per time unit is equal to the wind turbine revolutions. That means that both the wind turbine and the pulverization wheel rotate at the same rotational speed.
The next very important stage of work was determining the rotational speed model of the aerator pulverization wheel with respect to maximum wind speeds. The research carried out on the lake, based on Equation (3), allowed for the development of a linear regression equation. The equation and the obtained results are shown in Figure 3.
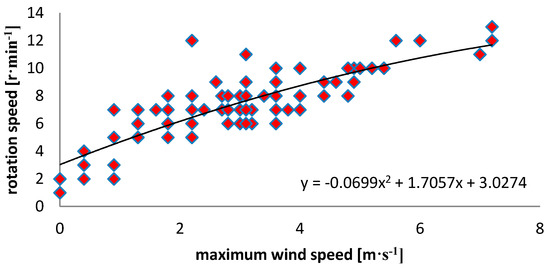
Figure 3.
Rotational speed model of the aerator pulverization wheel in relation to wind speed.
After substituting a large number of partial weather data points from the meteorological station of the Industrial Institute of Agricultural Machines (tens of thousands wind speed measurements) into Equation (4), the maximum wind speeds for each hour of the analyzed period were determined. A total of 6600 maximum hourly wind speeds, respectively:
- April—720 maximum hourly speeds;
- May—744 maximum hourly speeds;
- June—720 maximum hourly speeds;
- July—744 maximum hourly speeds;
- August—744 maximum hourly speeds;
- September—720 maximum hourly speeds;
- October—744 maximum hourly speeds;
- November—720 maximum hourly speeds.
The obtained values of maximum hourly wind speeds were substituted into the linear regression equation for the determined model of rotational speed of the paddle wheel. Using the equation, the theoretical volumetric flow rate of the pulverization unit was determined for each day of aerator operation in 2018. The results are presented as monthly record sheets in Figure 4, Figure 5, Figure 6, Figure 7, Figure 8, Figure 9, Figure 10, Figure 11 and Figure 12.
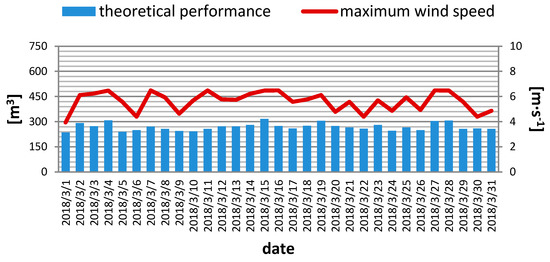
Figure 4.
Efficiency of the pulverization unit of the aerator in March.
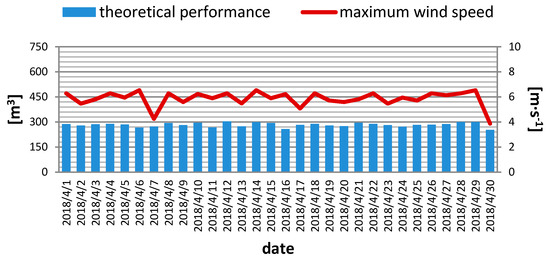
Figure 5.
Efficiency of the pulverization unit of the aerator in April.
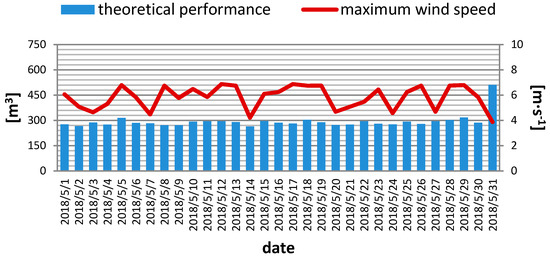
Figure 6.
Efficiency of the pulverization unit of the aerator in May.
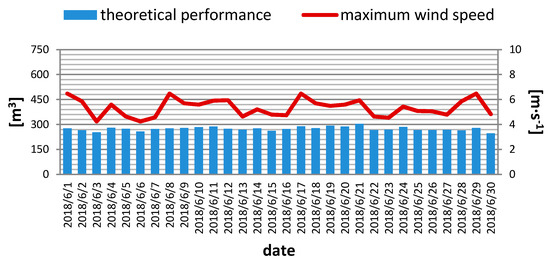
Figure 7.
Efficiency of the pulverization unit of the aerator in June.
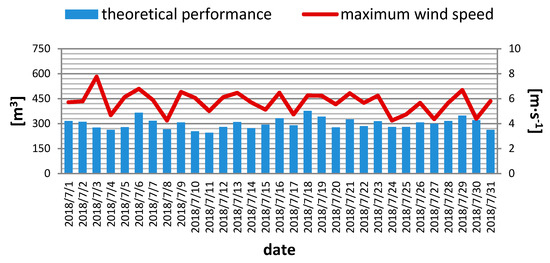
Figure 8.
Efficiency of the pulverization unit of the aerator in July.
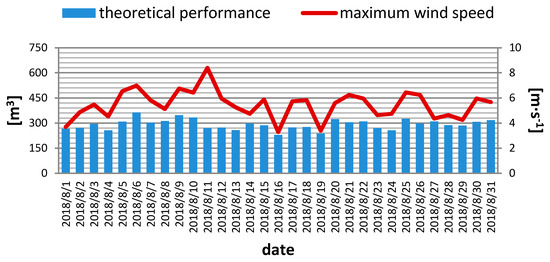
Figure 9.
Efficiency of the pulverization unit of the aerator in August.
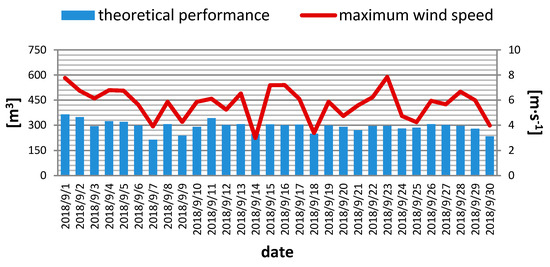
Figure 10.
Efficiency of the pulverization unit of the aerator in September.
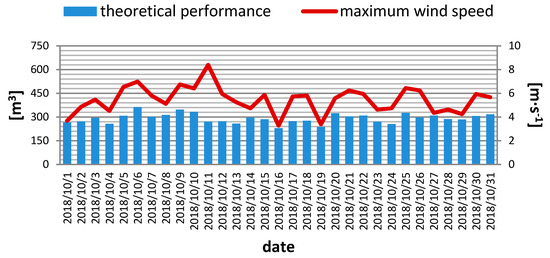
Figure 11.
Efficiency of the pulverization unit of the aerator in October.
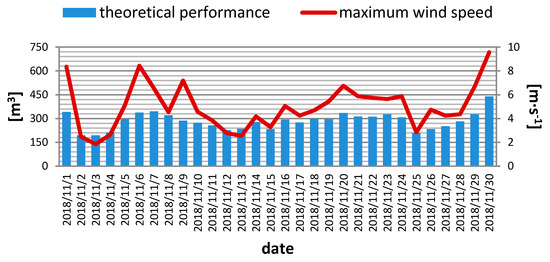
Figure 12.
Efficiency of the pulverization unit of the aerator in November.
In March (Figure 4), there were five days in which the output of the pulverizing unit exceeded 300 m3 per day.
In April (Figure 5), the efficiency of the pulverization unit was comparable to March (Figure 4), with six days being recorded on which the capacity was close to 300 m3 per day.
The wind conditions recorded on the last day of May in 2018 (Figure 6) allowed for the capacity to exceed 450 m3 per day.
In June (Figure 7), wind conditions were definitely worse, which affected the efficiency of the aerator pulverization unit. During any day of the month, there was no yield of more than 300 m3 per day. Productivity per month was the lowest among the entire analyzed pulverization period.
The highest volumetric flow rate among the analyzed pulverization period was achieved in July (Figure 8). Within 16 days, the aerator efficiency exceeded 300 m3 per day.
A slightly lower yield was obtained in August (Figure 9). The number of days with an efficiency exceeding 300 m3 was just 13.
On 9 July 2018, the efficiency of the pulverizing unit was about 175 m3 (Figure 10). On that day, wind conditions were definitely worse than in the earlier period.
Very good volumetric flow rates were also achieved in October (Figure 11). The result obtained was not much worse than in July (Figure 8).
In November (Figure 12), over 11 days, an efficiency exceeding 300 m3 per day was achieved. However, on four days of the month, the efficiency was similar to or less than 175 m3 per day. The changing wind conditions in November were characteristic of the late-autumn temperate zone climate.
The presented results of the theoretical daily volumetric flow rates of the pulverization unit in a monthly record were substituted into Equation (6) and then compared with each other. As presented in Figure 13, the largest theoretical efficiency per month, exceeding 9300 m3, was recorded in April, and the lowest one, about 8200 m3, was recorded in June.
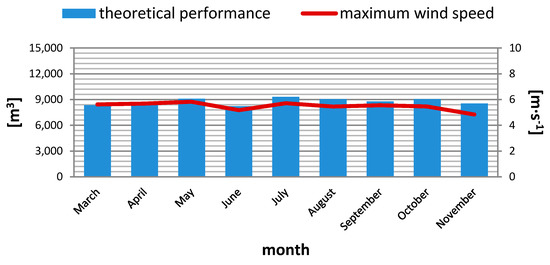
Figure 13.
Efficiency of the pulverization unit of the aerator in 2018.
The final aim of the work was to determine the theoretical volumetric flow rate for the entire season of pulverizing aeration. The value was calculated in accordance with Equation (7). The theoretical efficiency of water flow through the pulverization unit in the conditions of Góreckie Lake in 2018, based on the maximum wind speed method, was less than 79,000 m3.
4. Discussion
Podsiadłowski et al. [10] analyzed the efficiency of the wind-driven pulverizing aerator on Góreckie Lake. The authors showed that the efficiency of the aerator depends on the wind speed, where the largest increase in pulverization efficiency was obtained at speeds from 4.2 to 5.2 m∙s–1. The above dependence may result from the self-sealing effect of the pulverization unit, which is associated with higher water volumetric flow rates [23]. Wind speed exceeding 5.2 m∙s–1 leads to an inhibition of aeration efficiency. This is associated with restrictions in the volumetric flow of water through the suction and pressure hoses.
Konieczny [24] carried out an analysis of the operating parameters of pulverizing aeration systems. His aim was to determine the nomograms for monitoring wind-driven pulverizing aerator operation parameters. The author of the work determined a monthly operational efficiency of the pulverizing aerator mechanism. The author showed that an increase in wind speed of one unit (m∙s–1) corresponded to an average increase in the rotational speed of the pulverization wheel by an average of 3 rev∙min–1. Konieczny [25] highlights the differences in efficiency of the aerator pulverization unit, which depends on the wind conditions of the reservoir, which can be in the range of 5977.8 to 13,418.4 m3∙month–1. All volumetric flow rate values determined in this paper, according to the method of maximum wind speeds, were within the range set by Konieczny, which confirms the effectiveness of the proposed method of determining aerator efficiency in real conditions.
Numerous authors indicate the improvement in oxygen conditions in the overlying area of water in reservoirs subjected to pulverizing aeration using wind-driven pulverizing aerators [19,25].
None of the abovementioned studies of the efficiency of wind-driven pulverizing aerators were based on maximum wind speeds, which is why the method presented in this paper seems to be suitable for determining the efficiency of the aerator pulverization unit in its operating conditions.
5. Conclusions
Wind-driven pulverizing aerators can be used for the moderate oxygenation of the bottom area of surface water in windy conditions of the moderate climate zone. The average monthly efficiency at a level less than 8800 m3 of pumped water allows for the inclusion of the pulverizing aeration method in noninvasive methods, which are part of sustainable methods of water reservoir restoration. The sucked water, which is devoid of harmful gases from the anaerobic decomposition of organic matter, is oxygenated with atmospheric air and goes back to the overlying water area, which supports the intended biological goals. The conducted research allows for the formulation of the following conclusions:
- The author’s method of assessing the volumetric flow rate in the aerator pulverization unit based on maximum wind speeds is suitable for determining the machine’s efficiency in windy conditions of a given lake, which can significantly facilitate the planning of the course of restoration of water reservoirs.
- As the wind speed increases, the volumetric flow rate of the aerator pulverization unit also increases, along with the oxygenation efficiency of the bottom water of the reservoir.
- The generated wind turbine power depends on the wind speed. In windless conditions, pulverization efficiency is very limited, which may lead to a temporary deterioration of oxygen conditions in the bottom water zone.
- The method presented in the manuscript for determining the volumetric flow rate of water through the aerator pulverization unit allows for an assessment of its performance in windy conditions of a given water reservoir, which can contribute to effective planning of the restoration process.
Author Contributions
Conceptualization: E.O, A.O.; methodology: A.O, E.O.; software: A.O, A.P.; validation: E.O, A.O.; formal analysis: E.O., A.O.; investigation: E.O., A,.O.; resources: A.O., A.O.; data curation: A.P., A.O.; writing—original draft preparation: E.O., A.O., P.R., A.P.; writing—review and editing: A.O., P.R.; visualization: A.O., A.P.; supervision: E.O., P.R.; project administration: E.O., P.R.; All authors have read and agreed to the published version of the manuscript.
Funding
This research received no external funding.
Acknowledgments
The authors acknowledge the use of SCAPS program developed by Burgelman’s group of the University of Ghent, Belgium. In addition, the authors would like to thank National Supercomputing Center in Shenzhen for providing simulation calculation support.
Conflicts of Interest
The authors declare no conflict of interest.
References
- Dondajewska, R.; Kowalczewska-Madura, K.; Gołdyn, R.; Kozak, A.; Messyasz, B.; Cerbin, S. Long-Term Water Quality Changes as a Result of a Sustainable Restoration—A Case Study of Dimictic Lake Durowskie. Water 2019, 11, 616. [Google Scholar] [CrossRef]
- Kowalczewska-Madura, K.; Dondajewska, R.; Gołdyn, R.; Messyasz, B. Internal phosphorus loading from the bottom sediments of a dimictic lake during its sustainable restoration. Water Air Soil Pollut. 2018, 229, 280. [Google Scholar] [CrossRef] [PubMed]
- Moe, S.J.; Couture, R.-M.; Haande, S.; Lyche Solheim, A.; Jackson-Blake, L. Predicting Lake Quality for the Next Generation: Impacts of Catchment Management and Climatic Factors in a Probabilistic Model Framework. Water 2019, 11, 1767. [Google Scholar] [CrossRef]
- Wang, Y.; Hu, W.; Peng, Z.; Zeng, Y.; Rinke, K. Predicting Lake Eutrophication Responses to Multiple Scenarios of Lake Restoration: A Three-Dimensional Modeling Approach. Water 2018, 10, 994. [Google Scholar] [CrossRef]
- Wang, H.; Ma, M. Impacts of Climate Change and Anthropogenic Activities on the Ecological Restoration of Wetlands in the Arid Regions of China. Energies 2016, 9, 166. [Google Scholar] [CrossRef]
- Hu, X.; Lu, L.; Li, X.; Wang, J.; Lu, X. Ejin Oasis Land Use and Vegetation Change between 2000 and 2011: The Role of the Ecological Water Diversion Project. Energies 2015, 8, 7040–7057. [Google Scholar] [CrossRef]
- Wu, Y.; Huang, L.; Wang, Y.; Li, L.; Li, G.; Xiao, B.; Song, L. Reducing the Phytoplankton Biomass to Promote the Growth of Submerged Macrophytes by Introducing Artificial Aquatic Plants in Shallow Eutrophic Waters. Water 2019, 11, 1370. [Google Scholar] [CrossRef]
- Belinskij, A.; Iho, A.; Paloniitty, T.; Soininen, N. From Top–Down Regulation to Bottom–Up Solutions: Reconfiguring Governance of Agricultural Nutrient Loading to Waters. Sustainability 2019, 11, 5364. [Google Scholar] [CrossRef]
- Kuriata-Potasznik, A. The Functioning of a Water Body Within a Fluvio-Lacustrine System as an Effect of Excessive Nitrogen Loading—The Case of Lake Symsar and its Drainage Area (Northeastern Poland). Water 2018, 10, 1163. [Google Scholar] [CrossRef]
- Podsiadłowski, S.; Osuch, E.; Przybył, J.; Osuch, A.; Buchwald, T. Pulverizing aerator in the process of lake restotation. Ecol. Eng. 2018, 121, 99–103. [Google Scholar] [CrossRef]
- Bai, Y.-T.; Zhang, B.-H.; Wang, X.-Y.; Jin, X.-B.; Xu, J.-P.; Wang, Z.-Y. Expert Decision Support Technique for Algal Bloom Governance in Urban Lakes Based on Text Analysis. Water 2017, 9, 308. [Google Scholar] [CrossRef]
- Doerffer, P.; Doerffer, K.; Ochrymiuk, T.; Telega, J. Variable Size Twin-Rotor Wind Turbine. Energies 2019, 12, 2543. [Google Scholar] [CrossRef]
- Siepak, J.; Burchardt, L.; Pełechaty, M.; Osowski, A. Hydrochemical Research in the Wielkopolski National Park; UAM Poznań: Poznań, Poland, 1999; ISBN 83-908178-4-5. (In Polish) [Google Scholar]
- Kolendowicz, L.; Hanke, J.; Kaczmarek, L.; Lorenc, M. Changes in the Water Level of the Góreckie Lake (Wielkopolski National Park) in the Years 2002–2007 against the Background of Fluctuations in the Water Level of the Wielkopolska Fossil Valley and Atmospheric Conditions; Instytut Geografii i Gospodarki Przestrzennej: Kraków, Poland, 2008. (In Polish) [Google Scholar]
- Sobczyński, J.; Joniak, T. Differences in composition and proportion of phosphorus fractions in bottom sediments of lake Góreckie (Wielkopolska National Park). Environ. Prot. Eng. 2009, 35, 89–95. [Google Scholar]
- Sobczyński, J.; Joniak, T. What threatens the ecosystem of góreckie lake in wielkopolski national park. In Wielkopolski National Park in Natural Studies; Walna, B., Kaczmarek, L., Lorenc, M., Dondajewska, R., Eds.; AMU Poznań: Poznań, Poland, 2009; pp. 51–62. [Google Scholar]
- Osuch, E.; Osuch, A.; Podsiadłowski, S.; Piechnik, L.; Chwirot, D. Project of coagulant dispenser in pulverization aerator with wind drive. J. Ecol. Eng. 2017, 18, 192–198. [Google Scholar] [CrossRef]
- Osuch, E.; Osuch, A.; Podsiadłowski, S.; Rybacki, P.; Adamski, M.; Ratajczak, J. Assessment of the condition of the Samołęskie Lake waters. J. Ecol. Eng. 2016, 17, 108–112. [Google Scholar] [CrossRef]
- Rosińska, J.; Kozak, A.; Dondajewska, R.; Gołdyn, R. Cyanobacteria blooms before and during the restoration process of a shallow urban lake. J. Environ. Manag. 2017, 198, 340–347. [Google Scholar] [CrossRef] [PubMed]
- Osuch, E.; Osuch, A.; Podsiadłowski, S.; Rybacki, P.; Mioduszewska, N. Use of Wind Energy in the Process of Lake Restoration. In Renewable Energy Sources: Engineering, Technology, Innovation; Wróbel, M., Jewiarz, M., Szlęk, A., Eds.; Springer Proceedings in Energy. Springer: Cham, Switzerland, 2020; pp. 551–559. [Google Scholar] [CrossRef]
- Podsiadłowski, S. Method of precise phosphorus in activation in lake waters. Limnol. Rev. 2008, 8, 51–56. [Google Scholar]
- Perkins, R.G.; Underwood, G.J.C. The potential for phosphorus release across the sediment–water interface in an eutrophic reservoir dosed with ferric sulphate. Water Res. 2001, 35, 1399–1406. [Google Scholar] [CrossRef]
- Konieczny, R. Pulverizing aeration in the conditions of Barlinieckie Lake. In Woda-Środowisko-Obszary Wiejskie; ITP: Falenty, Poland, 2004; Volume 4, pp. 291–301. ISSN 1642-8145. (In Polish) [Google Scholar]
- Konieczny, R. Monitoring of Operating Parameters of the Pulverizing Water Aerator System. Ph.D. Thesis, Institute of Technology and Life Sciences, Raszyn, Poland, 2013. [Google Scholar]
- Konieczny, R. Determination of the ecological effect of the pulverized water wind aerator in the conditions of the Great Rudnickie Lake. In Research Papers of Wrocław University of Economics; Wrocław University of Economics: Wrocław, Poland, 2017; Volume 470, pp. 52–61. ISSN 1899-3192. (In Polish) [Google Scholar]


© 2020 by the authors. Licensee MDPI, Basel, Switzerland. This article is an open access article distributed under the terms and conditions of the Creative Commons Attribution (CC BY) license (http://creativecommons.org/licenses/by/4.0/).