Abstract
Recently, a lot of research has been carried out on partial discharge (PD) using machine learning techniques. However, most of these studies have focused on the identification of multiple PD sources, PD classification, or denoising PD measurements, with few studies on real-time PD occurrence detection. In this paper, we propose a method to detect PD occurrence based on anomaly pattern detection. The proposed method consists of three steps. First, in the data preprocessing step, the pulse sequence data are converted into a feature vector stream by applying a sliding window technique. In the next step, normal data modeling is performed using feature vectors transformed from pulse sequence data collected in a normal state where no PD occurs. Finally, for the monitored pulse sequence, an online process for PD detection is carried out through conversion to a feature vector data stream and an anomaly pattern detection method. Experimental results using simulated PD data demonstrate the capabilities of the proposed method.
1. Introduction
According to IEC-60270, a partial discharge (PD) is defined as a localized electrical discharge that only partially bridges the insulation between conductors and can or cannot occur adjacent to a conductor [1]. Manufacturing processes, mechanical stress and defects in insulation due to aging processes can cause vacancies, impurities or cracks, and lead to discharges in a high-voltage apparatus. PDs can exacerbate existing damage and progressively deteriorate insulating materials, ultimately leading to electrical breakdown and expensive equipment failures [2]. Hence, it is important to monitor the quality of insulation and detect the occurrence of PD in a timely manner.
Many studies have recently been conducted on PD using machine learning techniques. However, most of those studies have focused on identification of multiple PD sources, PD classification, and denoising PD measurements. In power systems, more than one PD source may exist at the same time. In order to assess the impact of individual PD sources, they need to be discriminated from one another [3,4]. In this paper [3], individual PD pulses were decomposed into multi levels through wavelet transformation and the distribution of signal energy level was calculated in each decomposition. By applying principal component analysis (PCA), the calculated energy levels were projected into a three-dimensional space where the individual clusters formed by the density-based spatial clustering of applications with noise (DBSCAN) clustering algorithm were analyzed. In [4], Wavelet analysis was applied to process the measurement data collected by the wide bandwidth PD sensor. It was then processed using correlation analysis to divide the discharges into several groups. Support vector machine (SVM) was applied to identify the PD sources.
Various deep learning methods have been applied for PD classification [5]. In [6], a deep convolutional neural network (CNN) was modeled for PD pattern recognition under a big data background, in which parameters were initialized by the deep auto-encoder network. In [7], a CNN- long short-term memory (LSTM) model was constructed for PD pattern recognition, combining CNN for analyzing local spatial information of the PD spectrum and long short-term memory (LSTM) for mining the PD spectrum time series feature information. Recognition rates for four types of PD insulation defects by CNN-LSTM model were presented.
PD measurement can be difficult due to background noise interference [8,9,10]. The paper [11] presented a method to discriminate the sources of PD and noise using the fast Fourier transform (FFT) and the power ratio of selected frequency bands. The pulse source identification of three types of corona, surface and internal discharges was shown. In [2], to overcome the limitations of the discrete wavelet transform (DWT) in taking PD pulses from serious noise, second generation wavelet transform (SCWT) was applied.
While machine learning has been applied in various studies related to PD, there has been little research on a real-time PD detection. This article proposes a PD detection method that applies an anomaly pattern detection method [12], where a normal data pattern model including environmental noise is built by using the data obtained from a normal state where no PD occurs. The model is used to detect the occurrence of PD that deviates from the normal state, by monitoring streaming data that are produced on a real-time basis. The anomaly pattern detection method is intended to detect the time point when an anomaly pattern deviating from the normal data pattern is generated. The anomaly pattern detection method suggested in [12] has been applied to the electric power consumption data stream collected from smart meters and found effective in the detection of energy theft [13].
Figure 1 shows a flowchart of the proposed PD detection method. The first block represents the data preprocessing. A sliding window technique is applied to the pulse sequence data of the pulse magnitude and phase which are obtained by signal detection with sensors. The data preprocessing step calculates a feature vector from the pulse data within the window and converts the pulse sequence data into a feature vector stream. In the second block, the feature vectors converted from the pulse sequence data collected in the normal state without PD are used to perform normal data modeling. An ensemble of clusters which represent normal data region is constructed for normal data modeling. The ensemble clustering model is used to predict outliers that significantly deviate from normal data region. In the third block, the online process for PD detection is shown. From the pulse sequence being monitored, a data stream of feature vectors is generated. By applying the ensemble clustering model, each feature vector is predicted as normal or an outlier, and the feature vector data stream is converted to a binary valued data stream. On a binary valued data stream, PD occurrence is detected by anomaly pattern detection method [12].
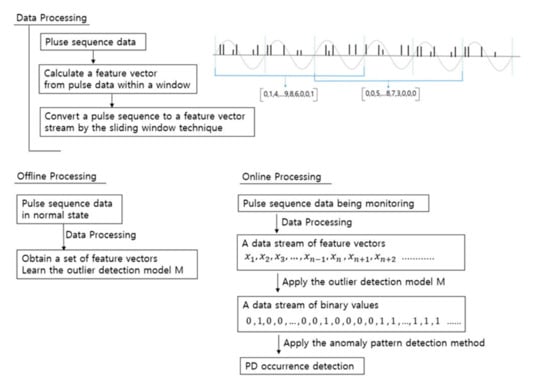
Figure 1.
A flowchart of the proposed partial discharge (PD) detection method.
Data collection is usually easier in a normal state where no PD occurs, compared to obtaining various types of PD data. The fact that data modeling is performed using normal data makes the practical application of the proposed method easy. Another characteristic of the proposed method is that it is possible to perform data modeling by constructing normal data including noise continuously generated in the surrounding environment and using it. A normal data model may be built on the data collected in the presence of noise signals, and it reduces the reliance on the noise removal technique.
The contribution of the proposed method can be summarized as follows.
- The proposed method performs on-line monitoring for PD detection by comparing the current data pattern with the normal data pattern, while the existing approach for PD pattern recognition is to compare the current data pattern with the known PD patterns.
- Since the noise which might exist in the normal state can be included in modeling process of the normal data pattern, the proposed method is less affected by the performance of the denoising technique.
2. A PD Detection Method Using Anomaly Pattern Detection on Streaming Data
2.1. Conversion of Pulse Sequence to Feature Vector Data Stream
Figure 2 shows how the pulse sequence data, including the pulse magnitude and phase, are converted into a feature vector data stream. As in the phase resolved partial discharge (PRPD) analysis, the pulse phase and pulse magnitude information within the q phase windows is accumulated in a phase window of a single cycle. By setting the precision of the x-axis and the y-axis to be m and n, respectively, the frequency in the grids is represented with a one-dimensional vector having a length of m*n. Over time, we add r new phase windows and remove r old phase windows to update the stackup in a phase window of a single cycle. The window moves forward to repeat the same procedure, converting the pulse sequence into a stream of feature vectors.
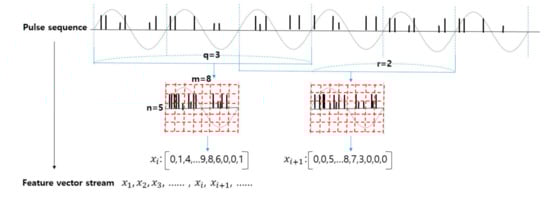
Figure 2.
An illustration of the process to convert pulse sequence to a feature vector stream.
In the experiment described in Section 2, m and n are set up as 8 and 4, respectively, and thus the dimension of the feature vector is determined to be 32. The experimental results in Section 3 show that the PD detection performance was high even when the feature vectors had a relatively low dimension.
2.2. Normal Data Pattern Modeling
For normal data pattern modeling, the pulse sequence data are collected in a normal state where no PD occurs and converted to feature vectors by the preprocessing described in Section 2.1. The converted feature vectors are used as normal training data for modeling the outlier detection model. The clustering-based outlier detection model is built using the following procedures [12]:
- The normal training data are divided into t chunks, and the k-means clustering algorithm is applied to each of the chunks.
- k clusters generated by k-means clustering for each chunk are represented by k hyperspheres whose union is considered to enclose the normal data region. When a test data sample resides outside of the nearest hypersphere among k hyperspheres, the data sample is predicted to be an outlier candidate.
- If a data sample is predicted as an outlier candidate from all the t chunk models, the data sample is finally predicted to be an outlier.
2.3. Partial Discharge Detection Using the Anomaly Pattern Detection Method
The pulse sequence that is collected on a real-time basis for online monitoring is converted into a feature vector data stream. The clustering-based outlier detection method, constructed using the normal training data, is applied to convert the feature vector data stream into a binary-valued data stream, which shows 0 (zero) when a feature vector is predicted to be normal data, and 1 when it is predicted to be an outlier. The anomaly pattern detection [12], based on Hypothesis testing for the difference between two proportions, is applied to the binary data stream.
In the converted binary data stream, the detection window is shifted against the reference window to detect the change in binomial distribution, based on the difference in population proportion between the two windows. The reference window is fixed to an initial part of the test stream, which is believed to include no PD, and only the detection window is shifted in the stream data along the time flow. The occurrence of PD can be detected by finding the time point at which the binomial distribution in the detection window starts to differ from the binomial distribution in the reference window.
3. Performance Test for the Proposed Method
In order to test the performance of the proposed PD detection method, we used simulated data and experimental data from LEMKE database [14]. The simulated data includes pulse sequence data of normal data without PD and four types of PD. Under the assumption that signals collected in the normal state without PD would contain strong noise signals originating from locations close to the sensor and weak noise signals propagating from locations far away, strong noise signals were generated from normal distributions and weak noise signals were constructed from the uniform distribution. The parameters of distributions are explained in Section 3. However, using other distributions for noise signals might work well for the PD detection test, since PD signals and noise signals are expected to have different PRPD patterns. LEMKE data was obtained from PD measurements on artificial voids created in polymeric cable insulation by the EPSRC (Engineering and Physical Sciences Research Council) center for Doctoral Training in Future Power Networks and Smart Grids. A detailed description can be found in [14].
3.1. Simulating Normal Pulse Sequence Data without Partial Discharge
A pulse data sequence measured at a normal state without PD was simulated using the method described below. The generated data consist of the sequence of the three values of period, phase and charge that were collected for a certain time at a preset sampling frequency.
- Set the number of strong peak noise signals and weak white noise signals present in a single cycle and determine the values of the phase and magnitude parameters of each strong peak noise signal and the magnitude parameter of weak white noise signals. In our test, the parameters were set as follows:
- The number of strong peak noise signals and weak noise signals was generated as a random number from the normal distribution N (15, 2) and N (10, 2), respectively.
- The phase of each strong peak noise signal was generated from uniform distribution U (0, 360).
- The strong noise signal magnitude, p, was set to 10 and 20.
- Generate the phase and charge values of the peak noise signals in each phase period, such that the individual peak noise signals have a normal distribution.
- Generate the phase and charge values of the weak white noise signals in each phase under the uniform distribution U (0, 360) and normal distribution N (3, 2), respectively.
Figure 3 shows an example of the phase resolved partial discharge analysis (PRPDA) of pulse sequence data simulating the noise signals based on 60 Hz. The number of strong peak noise signals and the number of weak white noise signals within a single cycle were generated as random values with a normal distribution of N (10, 2). The strong noise signal magnitude parameter was set to 20, and the weak white noise signal magnitude had a normal distribution of N (3, 2).
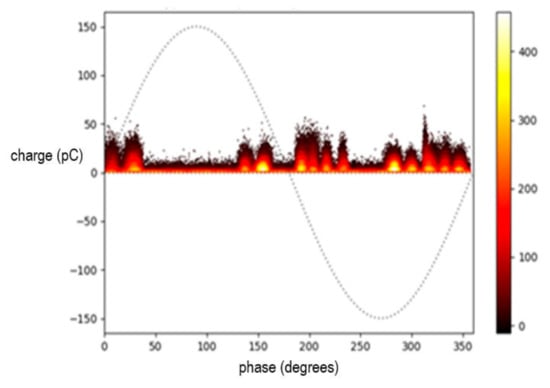
Figure 3.
A phase resolved partial discharge analysis (PRPDA) example of simulated noise signals.
3.2. Generating Pulse Sequence Data with Partial Discharge
Simulation data were generated for four types of PD, surface, void, and two corona discharges of low-voltage needle positive corona (denoted as corona_pos) and high-voltage needle negative corona (denoted as corona_neg) in underground power cables. The generation of positive and negative needle corona PD was explained in [15], where the test set-up for the production of artificial PD sources was designed. In [15], for the generation of positive and negative corona type pulses, a rod–needle was connected to a high-voltage electrode or the ground electrode, respectively. Figure 4 shows the PRPDA of four types of PD. PRPD patterns for various PD types can be found in the articles [3,11,15,16,17]. Assuming noise signals were continuously measured even in the presence of PD, the signals generated by the noise signal generation procedures described in Section 3.1 were also included. The left of Figure 5 shows the PRPDA of a void type PD that does not include the noise signals, and the right shows the PRPDA including the noise signals.
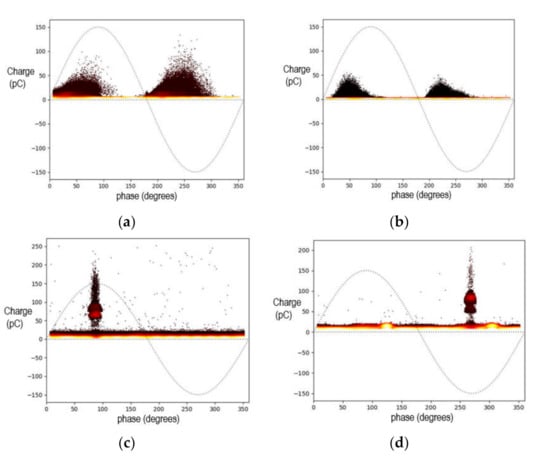
Figure 4.
PRPDA of four PD types: (a) void, (b) surface, (c) low-voltage needle positive corona, (d) high-voltage needle negative corona.
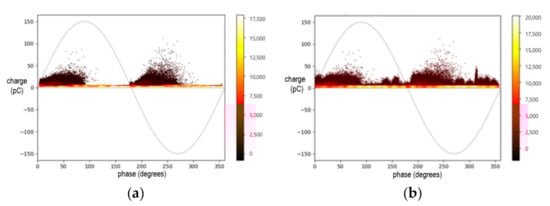
Figure 5.
(a) PRPDA of a void type without noise signals. (b) PRPDA of a void type including noise signals.
The pulse sequence data generated in a normal state without PD for 4 h were transformed to feature vectors and they were used as the normal training data to build an outlier detection model. The test data stream was configured to include PD by connecting a 1-h PD data stream after 1-h normal data streaming. The sampling frequency was set to 60 Hz.
3.3. Performance Evaluation Measures for PD Detection
If PD detection is considered to be a positive prediction, the PD detection performance can be evaluated in terms of true positive (TP), false positive (FP), false negative (FN), and delay (DL). TP, FP, and FN are the measures commonly used for unbalanced classification problems in machine learning and data mining [18]. Delay (DL) was introduced in [12] to measure the time delay from actual occurrence time to detection time. TP means that PD was detected after the actual PD occurred. FP refers to PD detection before the actual PD occurrence. FN means no PD detection even after actual PD occurrence. Delay measures the difference from the actual PD occurrence time to the predicted PD occurrence time.
Figure 6 illustrates the performance evaluation measures for PD detection in a feature vector stream converted from pulse sequence data. If the frequency in the pulse sequence data was set to be f, then a feature vector is generated every r/f seconds from the pulse sequence data. As illustrated in Figure 2, whenever r new phase windows are added to the cumulative phase window, one feature vector is constructed. In Figure 6, delay is measured as the number of feature vectors between the actual PD occurrence and prediction, where the length of seconds corresponding to the number of feature vectors can be calculated by multiplying the number of feature vectors by r/f.
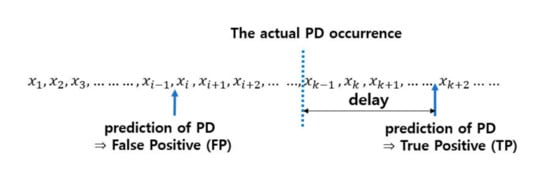
Figure 6.
The illustration of performance evaluation measures [12].
3.4. Results of the Partial Discharge Detection Performance Test
To convert the pulse sequence into a feature vector data stream, as described in Section 2.1, the parameters (q, r), representing the number of phase windows accumulated in the phase window of a single cycle and the number of forward-moving phase windows, were set differently as (360, 60), (600, 60), (1800, 300) and (3600, 600). Since the frequency was 60 Hz, 360 accumulated phase windows mean the length of 6 s, and 60 forward-moving phase windows mean a movement of 1 s. The precision of the x-axis and the y-axis dividing the accumulated phase window of a single cycle was set up as m = 8 and n = 4. When generating the noise data, the parameter, p, for the strong peak noise signal amplitude was varied as 10 and 20 to compare the effect of noise. Table 1 shows the pulse magnitude statistics, including the mean, maximum and variance, for normal data at the strong peak noise signal amplitude parameter value of 10 and 20 and the PD data of four PD types.

Table 1.
Pulse magnitude statistics for normal data at the strong peak noise signal amplitude parameter value of 10 and 20 and the PD data of four PD types.
In the clustering-based outlier detection model described in Section 2.2, the number of ensemble members, t, was set to be 1, and the number of clusters, k, was set to be 10. In the anomaly pattern detection method, the size of the reference window and the detection window, w, was varied to 50, 100, 150 and 200. The training and test data generation was randomly repeated five times for each experimental setup, and the TP, FP, FN and the averaged delay (DL) were calculated over five times of repetition.
Table 2 shows the detection performance for a void type PD. When (q, r) = (360, 60) and the size of both the reference window and the detection widow, w, were 50, the mean delay was 5. Since the frequency f was 60 Hz, r/f is 1 and the delay of 5 means a detection delay of 5 s. On the other hand, when (q, r) = (3600, 600) and w is 50, the delay was 5.4, which means 54 s. When the pulse sequence is converted to a feature vector data stream, better performance was found when the number of phase windows accumulated in a single cycle, q, and the number of forward-moving windows, r, were given smaller values.
Table 2.
PD detection performance for void type (q: the number of phase windows accumulated in a single cycle, r: the number of forward-moving phase windows).
Table 3 shows PD detection performance for surface and corona PD types. It summarizes the test results when (q, r) = (360, 60). In the case of negative corona PD type, it showed one false positive detection among five times repeated tests when w was set to 150 or 200. In all other cases, the proposed method provided good performance. The mean delay of about 2 to 3 s was less than in the void PD type. While the test in this section was performed for the simulated data, in the next section the test is performed using LEMKE data which was measured for the void type PD in polymeric cable insulation.
Table 3.
PD detection performance for surface and corona types. The number of phase windows accumulated in a single cycle, q, and the number of forward-moving phase windows, r, were fixed as 360 and 60.
3.5. Partial Discharge Detection Performance Using LEMKE Data
The following experiment used LEMKE partial discharge measurements data (https://pureportal.strath.ac.uk/en/datasets/lemke-partial-discharge-measurements) published on the internet. The dataset contains the outputs of the ASCII file format from PD test of low-density polyethylene (LDPE) and polypropylene film samples by a LEMKE LDS-6 measurement system. Files contain PD magnitude, phase, and period number. LDPE void-type partial discharge experiment data were measured with a frequency of 50 Hz for one hour. While the PD data of Section 3.2 were simulated in unipolar mode, LEMKE PD data are bipolar signals. Figure 7a shows the maximum and minimum values of the pulse magnitude of LDPE void-type PD data measured at 1-min intervals. Figure 7b–d shows the PRPDA of a void type at 1, 31, 59 min, respectively. It can be seen that the pulse magnitude increases over time. Under the same experimental setting as in Section 3.4 that strong peak noise and weak white noise exist in a normal state where PD does not occur, we set the peak amplitude parameter P of the strong peak noise signal to 20.
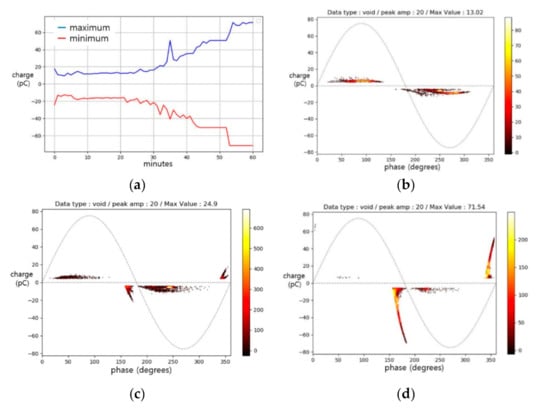
Figure 7.
Analysis of the LEMKE void-type PD (a) the maximum and minimum values of the pule magnitudes at 1-min intervals. (b) PRPDA at 1 min. (c) PRPDA at 31 min. (d) PRPDA at 59 min.
The precision of the x-axis and the y-axis, which segments the accumulated phase window of a single cycle, was set up as m = 8 and n = 7. Table 4 summarizes PD detection performance using LEMKE data. As in Section 3.4, the performance was a little better when the number of phase windows accumulated in a single cycle and the number of forward-moving windows were given small values. Since the frequency was 50 Hz in LEMKE data, 300 accumulated phase windows mean the length of 6 s, and 50 forward-moving phase windows mean a movement of 1 s. The detection delay was longer than in Table 2. When (q, r) = (300, 50) and w = 50, the mean delay was 7.4, which means the detection delay of 7.4 s. However, when (q, r) = (3000, 500) and w = 50, the mean delay was 9.4, which means 94 s. It is presumed that this is because the pulse magnitude at the initial stage of PD occurrence was small and increased over time.
Table 4.
PD detection performance for LEMKE PD data (q: the number of phase windows accumulated in a single cycle, r: the number of forward-moving phase windows).
4. Conclusions
Real-time monitoring of PD occurrence is an essential technology for the efficient management of high-voltage electric apparatuses. This article proposes a method where pulse sequence data collected in a normal state without PD were used to build a normal data pattern model and the model can then be used to detect PD on a real-time basis. The proposed method consists of offline outlier detection model learning and online PD detection. The offline model learning refers to the preliminary modeling where pulse sequence data are converted into a feature vector of a low dimension through the sliding window technique and PRPD analysis. The converted feature vectors are used to build a normal data-based outlier detection model. The online PD detection comprises three steps: converting real-time pulse sequence data to a feature vector data stream; transforming the feature vector data stream to a binary data stream by applying the constructed outlier detection model; the occurrence of PD is monitored by applying an anomaly pattern detection method to the binary stream.
Tests using the simulation and measurement data showed the effectiveness of the proposed PD detection method. In most test cases using simulated data, five true positive detections were obtained out of five iterations. The average time delay ranged from 2 to 5 s when the number of phase windows accumulated in a single cycle and the number of forward-moving phase windows were set as 360 and 60. The detection time delay of less than 5 s obtained in the noisy environment test setup demonstrates the applicability of the proposed method in real-world situations. In the test using the measurement data LEMKE, the detection time delay was longer than that obtained in the simulated data. LEMKE data showed the gradual growth of PD signals over time, which might be realistic in various situations. Nonetheless, the time delay was less than 9 s when (q, r) = (300, 50) and w = 50.
As discussed in the Introduction section, many studies related to PD have focused on PD source identification, PD type classification, and PD measurement denoising. There has been little study on detecting PD occurrence in the pulse sequence data in real-time basis. The proposed method focuses on online monitoring to detect when PD occurs. However, when a PD is detected by the proposed method, a PD pattern classification algorithm may be applied to connect the PD detection and the PD pattern classification. In the present study, the pulse sequence data without PD were generated by simulation to test the performance of the proposed method. PD data were also artificially simulated or measured in the laboratory environment. Further studies need to be conducted to verify the on-site applicability of the proposed method by performing a PD detection performance test using real data.
Author Contributions
Conceptualization, C.H.P.; methodology, C.H.P.; software, J.K.; data curation, J.K.; writing—original draft preparation, J.K.; writing—review and editing, C.H.P.; funding acquisition, C.H.P. All authors have read and agreed to the published version of the manuscript.
Funding
This research was supported by Korea Electric Power Corporation (grant number: R18XA05).
Conflicts of Interest
The authors declare no conflict of interest. The funders had no role in the design of the study; in the collection, analyses, or interpretation of data; in the writing of the manuscript, or in the decision to publish the results.
References
- IEC International Standard 60270: High Voltage Test Techniques—Partial Discharge Measurements; International Electrotechnical Commission: Geneva, Switzerland, 2015.
- Song, X.; Zhou, C.; Hepburn, D.M.; Zhang, G.; Michel, M. Second generation wavelet transform for data denoising in PD measurement. IEEE Trans. Dielectr. Electr. Insul. 2007, 14, 1531–1537. [Google Scholar] [CrossRef]
- Hao, L.; Lewin, P.L.; Hunter, J.A.; Swaffield, D.J.; Contin, A.; Walton, C.; Michel, M. Discrimination of multiple PD sources using wavelet decomposition and principal component analysis. IEEE Trans. Dielectr. Electr. Insul. 2011, 18, 1702–1711. [Google Scholar] [CrossRef]
- Hao, L.; Lewin, P.L. Partial discharge source discrimination using a support vector machine. IEEE Trans. Dielectr. Electr. Insul. 2010, 17, 189–197. [Google Scholar] [CrossRef]
- Barrios, S.; Buldain, D.; Comech, M.P.; Gilbert, I.; Orue, I. Partial Discharge Classification Using Deep Learning Methods—Survey of Recent Progress. Energies 2019, 12, 2485. [Google Scholar] [CrossRef]
- Song, H.; Dai, J.; Zhang, W.; Bi, K. Partial Discharge Pattern Recognition Based on Deep Convolutional Neural Network Under Complex Data Sources. High Volt. Eng. 2018, 44, 3625–3633. [Google Scholar]
- Zhou, X.; Wu, X.; Ding, P.; Li, X.; He, N.; Zhang, G.; Zhang, X. Research on Transformer Partial Discharge UHF Pattern Recognition Based on Cnn-lstm. Energies 2019, 13, 61. [Google Scholar] [CrossRef]
- Alvarez, F.; Ortego, J.; Garnacho, F.; Sanchez-Uran, M. A clustering technique for partial discharge and noise sources identification in power cables by means of waveform parameters. IEEE Trans. Dielectr. Electr. Insul. 2016, 23, 469–481. [Google Scholar] [CrossRef]
- Liu, Y.; Zhou, W.; Li, P.; Yang, S.; Tian, Y. An Ultrahigh Frequency Partial Discharge Signal De-Noising Method Based on a Generalized S-Transform and Module Time-Frequency Matrix. Sensors 2016, 16, 941. [Google Scholar] [CrossRef] [PubMed]
- Raymond, W.J.K.; Illias, H.A.; Abu Bakar, A.H. Classification of Partial Discharge Measured under Different Levels of Noise Contamination. PLoS ONE 2017, 12, e0170111. [Google Scholar] [CrossRef]
- Ardila-Rey, J.A.; Martínez-Tarifa, J.M.; Robles, G.; Rojas-Moreno, M.V. Partial discharge and noise separation by means of spectral-power clustering techniques. IEEE Trans. Dielectr. Electr. Insul. 2013, 20, 1436–1443. [Google Scholar] [CrossRef]
- Kim, T.; Park, C.H. Anomaly pattern detection for streaming data. Expert Syst. Appl. 2020, 149, 113252. [Google Scholar] [CrossRef]
- Park, C.H.; Kim, T. Energy Theft Detection in Advanced Metering Infrastructure Based on Anomaly Pattern Detection. Energies 2020, 13, 3832. [Google Scholar] [CrossRef]
- Morris, E.A.; Siew, W.H. A comparison of AC and DC partial discharge activity in polymeric cable insulation. In Proceedings of the 2017 IEEE 21st International Conference on Pulsed Power (PPC), Brighton, UK, 18–22 June 2017. [Google Scholar]
- Mor, A.R.R.; Heredia, L.C.; Harmsen, D.; Muñoz, F.M. A new design of a test platform for testing multiple partial discharge sources. Int. J. Electr. Power Energy Syst. 2018, 94, 374–384. [Google Scholar] [CrossRef]
- Albarracin, R.; Alvarez, F.; Vera-Romero, C.A.; Rodríguez-Serna, J.M. Separation of Partial Discharge Sources Measured in the High-Frequency Range with HFCT Sensors Using PRPD-teff Patterns. Sensors 2020, 20, 382. [Google Scholar] [CrossRef]
- Stadlbauer, T.; Chmielinska, A.; Ducimetiere, L.; Kontelis, D.; Kramer, T.; Senaj, V. DC testing and phase resolved partial discharge measurements of the new trigger transformers for the LHC beam sump kickers. In Proceedings of the 10th International Particle Accelerator Conference (IPAC2019), Melbourne, Australia, 19–24 May 2019. [Google Scholar]
- Tan, P.; Steinbach, M.; Kumar, V. Introduction to Data Mining; Pearson Addison Wesley: San Francisco, CA, USA, 2006. [Google Scholar]


Publisher’s Note: MDPI stays neutral with regard to jurisdictional claims in published maps and institutional affiliations. |
© 2020 by the authors. Licensee MDPI, Basel, Switzerland. This article is an open access article distributed under the terms and conditions of the Creative Commons Attribution (CC BY) license (http://creativecommons.org/licenses/by/4.0/).