Abstract
The primary energy consumption and greenhouse gas emissions from nickel smelting products have been assessed through case studies using a process model based on mass and energy balance. The required primary energy for producing nickel metal, nickel oxide, ferronickel, and nickel pig iron is 174 GJ/t alloy (174 GJ/t contained Ni), 369 GJ/t alloy (485 GJ/t contained Ni), 110 GJ/t alloy (309 GJ/t contained Ni), and 60 GJ/t alloy (598 GJ/t contained Ni), respectively. Furthermore, the associated GHG emissions are 14 tCO2-eq/t alloy (14 tCO2-eq/t contained Ni), 30 t CO2-eq/t alloy (40 t CO2-eq/t contained Ni), 6 t CO2-eq/t alloy (18 t CO2-eq/t contained Ni), and 7 t CO2-eq/t alloy (69 t CO2-eq/t contained Ni). A possible carbon emission reduction can be observed by comparing ore type, ore grade, and electricity source, as well as allocation strategy. The suggested process model overcomes the limitation of a conventional life cycle assessment study which considers the process as a ‘black box’ and allows for an identification of further possibilities to implement sustainable nickel production.
Keywords:
nickel; LCA; energy consumption; greenhouse gas emission; material balance; energy balance 1. Introduction
Nickel is an important alloying element, which is used in the iron and steel industries. More than half of the produced nickel is consumed in the production of stainless steel [1]. As an alloy element, the addition of nickel has positive effects on the steel’s strength, toughness, and corrosion resistance. In 2019, the world’s leading nickel producing countries were, among others, Indonesia, Philippines, Russia, New Caledonia, Australia, Canada, and China [2]. With the increasing attention on sustainable processes, nickel manufactures are nowadays facing the pressures to improve the environmental profile of their products [1]. On one hand, it means to improve both the mineral and energy efficiencies during processing and to eliminate waste and emissions into the nature. On the other hand, these concerns, in turn, also impose potential demands on the supply chain in which raw materials and energy sources with fewer environmental burdens should be used.
To investigate energy utilization and greenhouse gas emission (GHG) of nickel products, a typical approach is to use life cycle assessment (LCA) for the analysis. Table 1 summarizes several reported LCA studies of nickel production. From Table 1, it can be concluded that the results from conventional LCA studies have limitations when comparing the influence of various nickel products, ores, process routes, system boundaries etc. on the energy consumption and greenhouse gas emissions. Firstly, the common utilization of average inventory data neglects the operation variance between plants [3,4], such as the ore type, ore/product grade and operating conditions. Site-specific inventory datasets are seldom used because the required work is both time and resource consuming. Secondly, the concept of treating each production stage as a ‘black box’ limits the transparency and thus the possibility to identify and realize product and process optimisations [5].
One way to overcome the aforementioned shortcomings of the conventional LCA studies is to use process modelling based on the law of conservation of mass and energy. This approach has been widely applied in performance analysis of different pyrometallurgical processes, such as lime production in a kiln [6], ferronickel smelting in a rotary kiln-electric furnace [7], steelmaking in an electric arc furnace [8,9], and silicon alloy production in an electric furnace [10]. The current study was initially inspired by the work in the “Sourcing Edge” project [11]. A process model based on mass and energy conservation was established for the cases studied with the aim of assessing the primary energy consumption and GHG emission of nickel smelting products, as well as identifying the possibility to improve nickel production with lower environmental impact.

Table 1.
Published LCA studies of nickel production.
Table 1.
Published LCA studies of nickel production.
| Ref. a | Loc. b | Ore c | Route d | Inv. e | System Boundary f | Alloy Product g | Result h | ||||
|---|---|---|---|---|---|---|---|---|---|---|---|
| Ore | Ni% | Alloy | Ni% | Unit | E | G | |||||
| [12] | W | L | - | RKEF | Ave. | M + T + EP | FeNi | 15–45 | 1t alloy | 137 | - |
| L | FS/RKEF | M + T + EP | NiO | 75–78 | 369 | ||||||
| L | BF/EAF | M + T + EP | NPI | 1.5–17 | 63 | ||||||
| L/S | Mix | M + T + EP + CO | Matte | 40–80 | 114 | ||||||
| L/S | Mix | M + T + EP + CO | Ni | >99 | 266 | ||||||
| [13] | AU | L | 1.3 | RKEF | S | M + EP + MP | FeNi | 30 | 1t alloy | 325 | 13.9 |
| [14] | - | L | 1.3 | RKEF | S | M + EP + MP + CO | FeNi | - | 1t Ni | 236 | 22.4 |
| [15] | - | S | 2.3 | FS + SG | S | M + EP + MP + CO | Ni | 100 | 1t Ni | 114 | 11.4 |
| [16] | - | L | 2.4 | RKEF | S | M + MP + EP | FeNi | 23 | 1t alloy | 110 | 9.3 |
| [17] | W | L | 1.8 | RKEF | P&S | MP + EP | FeNi | 15–45 | 1t alloy | 128 | 14 |
| [18] | W | L/S | - | Mix | Ave. | M + T + EP + MP + CO | Ni | 100 | 1t Ni | 236 | 13 |
| L | - | Pyro | M + T + EP + MP | FeNi | 27 | 592 | 45 | ||||
| [19] | CN | L | 1.05 | RKEF | P | M + T + EP + MP | FeNi | 16 | 1t alloy | - | 12.2 |
| [20] | CN | S | 1 | FS | S | M + T + EP + MP | Ni | 100 | 1t Ni | - | 26.9 |
| [21] | GR | L | 1.1 | RKEF | L | M + T + EP + MP + CO | FeNi | 20 | 1t alloy | 154 | 12.6 |
a Ref.: reference; b Loc.: Location; W: world’s average; AU: Australia; CN: China; GR: Greece; c L: laterite; S: sulfide; d FS: Flash smelting; SG: Sherritt-Gordon process; RKEF: rotary-kiln electric furnace; BF: blast furnace; EAF: electric arc furnace; Mix: Pyrometallurgy + Hydrometallurgy; e Inv.: Inventory; Ave: Average based on plant survey; S: secondary data; P: Primary data; f M: mining; T: transport; EP: energy production; MP: (auxiliary) material production; CO: co-product; g NPI: nickel pig iron; h E: energy (GJ/t unit); G: greenhouse gas emission (tCO2-eq/t unit).
2. Pyrometallurgical Production of Nickel
Nickel is extracted from two types of deposits, namely laterite and sulfide ores. The identified world’s nickel resources consist of 60% laterite ores and 40% sulfide ores [2]. However, the majority of nickel production is currently sulfide ore based [1].
2.1. Laterite Ore
Laterite ore is mostly open pit mined. It has a nickel content of 1–2.7% and a high moisture ratio of 17–34% [22,23]. Due to the complexity of laterite mineralogy, floatation is not feasible for the beneficiation of laterite ore. The laterite ores enriched in magnesia and silica, also called saprolitic ores, are predominantly recovered in the rotary kiln-electric furnace (RKEF) process [22]. The partially dried ore from dryer is completely dried and partially reduced in a rotary kiln furnace (Equations (1)–(8) in Table 2). The discharged hot calcine is then heated and smelted in a submerged electrical arc furnace at a temperature of 1450 °C (Equations (11)–(15) in Table 2). The recovery of nickel in smelting is about 90–98%. The high operating temperature and large amount slag formation makes nickel smelting an energy intensive process. The average electricity consumed to process one ton of calcine is about 380–620 kWh [23] and it can be reduced if the temperature of the incoming calcine is increased. The tapped smelting matte has a typical chemistry of 20–40% Ni, 60–75% Fe, 0.06% P and 0.4% S [22], aims to be refined into ferronickel (Equations (29)–(31)). Another intermediate product is Fe-Ni-S matte (26% Ni, 63% Fe, 0.8% Co, and 10% S) [22], can be processed into a melting grade nickel (95–97%) or a nickel oxide (75%) [22] (Equations (9), (10) and (25)–(28)).
Nickel pig iron (NPI) is a low-grade (4–15%) laterite smelting product initially developed from China [24]. Low-grade saprolitic ore is sintered and charged together with coke and slag formers into the blast furnace. The chemical reactions of blast furnace smelting are listed in Equations (11)–(15) in Table 2. Lately, Indonesia has set up NPI plants in order to meet the demand of NPI in the Chinese market [25].
Table 2.
Chemical reactions in nickel production process.
Table 2.
Chemical reactions in nickel production process.
| Process | Chemical Reaction | Reaction Enthalpy a | Equation |
|---|---|---|---|
| Drying | (1) | ||
| Calcination/ Reduction | (2) | ||
| (3) | |||
| (4) | |||
| (5) | |||
| (6) | |||
| (7) | |||
| (8) | |||
| Sulfidation | (9) | ||
| (10) | |||
| EF/BF b Smelting | (11) | ||
| (12) | |||
| (13) | |||
| (14) | |||
| (15) | |||
| Flash smelting | (16) | ||
| (17) | |||
| (18) | |||
| (19) | |||
| Converting | (20) | ||
| (21) | |||
| (22) | |||
| (23) | |||
| (24) | |||
| Roasting | (25) | ||
| (26) | |||
| (27) | |||
| (28) | |||
| Refining | (29) | ||
| (30) | |||
| (31) |
a The reaction enthalpy at the specified temperature were extracted from software HSC Chemistry [26]. b EF: electric furnace; BF: blast furnace.
2.2. Sulfide Ore
Sulfidic ore contains of 1–3% Ni, can be extracted through both open-pit and underground methods [22]. It processes either in a submerged electric arc furnace or a flash furnace [22] (Equations (16)–(19)). In flash smelting, the produced matte contains approximately 15–40% Ni, and 20–40% Fe and 20–25% S [22]. The matte has been lowered iron and sulphur in the converter (Equations (20)–(24)). It is then refined into pure nickel with cobalt being a co-product, mainly through hydrometallurgical processes, such as leaching (chlorine/ammonia/sulfuric acid), solvent extraction, electro-winning, hydrogen reduction, and carbonyl refining [22].
3. Methodology
3.1. System Boundary
To assess energy consumption and greenhouse gas emission, the developed process models consist of the following four parts:
- Mining
- Pre-processing (beneficiation/drying/calcination/sulfidation/sintering)
- Smelting
- Post-processing (settling/converting/refining/roasting)
The steps in pre-processing and post-processing may vary, based on the ore feedstock and smelting technology employed. This will be schematically described in the case study in the result section. The functional unit is one ton of nickel alloy product. The inventory dataset was collected through the calculations using the process model, which is based on a mass and heat balance. Also, the transport between processes (>100 km) and energy production is included in the system boundary. It was also assumed that the auxiliary materials (oxygen, silica, lime, coal, aluminium, etc.) are manufactured near the plant. Thus, the impact of transport can be neglected. In addition, the effect of explosives, cooling water and compressed air are not included in the current model.
3.2. Description of Mathematical Process Model Based on Mass and Energy Balance
A process model based on the law of conservation of mass and energy has been developed in this work. It states that the total mass/energy entering into a defined system is equal to the total mass/energy leaving the system. The typical input mass in a process may comprise of nickel-containing materials (ore/concentrate/calcine/matte), oxidation gas (oxygen/air), reductants (coal/coke), slag formers (lime/silica), fossil fuels and recycled dust. The mass output from the process consists of a nickel product (concentrate/dried ore/matte/final nickel product), slag, flue gas and dust. In the energy balance, the ingoing energies include electricity, fuel, thermal heat of raw material and exothermic reaction heat. Furthermore, the outgoing energies present as thermal heat stored in the processed product, slag, flue gas, and furnace heat loss, as well as endothermic reaction heat. Detailed mass and energy balance equations of each pyro-metallurgical process are described in Table A1 in Appendix A.
The process modelling follows the steps described below:
- Using the chemistry of nickel ore and auxiliary materials as the initial input data.
- Setting the default value of some modelling parameters, for instance, the metal recovery rate, slag basicity, heat loss ratio, chemistry specification of the output source, operation, and discharge temperature). These values can be collected from published sources such as articles, reports, company websites etc.
- Calculating the input (auxiliary material, fuel, and electricity) and output (processed product, slag, flue gas, dust) through iterations and fulfilling the conditions of both the mass and energy balances.
- Calculating the inventory data of this process.
- Using the output product as the input feedstock in the subsequent process.
- Repeating step 2–5 till the final nickel alloy product is produced.
The following assumptions are made to simplify the mathematical model:
- The modelling system is in a steady state, which means that the balance is independents of time.
- The reference temperature is 25 °C.
- The entered gases are ideal and are calculated based on stoichiometry rather than based on the excess amount in the real condition.
- The slag formation heats of complex oxides are not considered.
- The energy content of fuel combustion is referring to the reference value from literature (see Table 3). The Default energy content of fuel combustion (see Table 3) is used in the energy balance module. In the mass balance module, a complete fuel combustion condition was assumed to calculate the amount of oxidation gas and flue gas.
- Thermal energy of the ingoing and outgoing source in the process is calculated by Equations (32) and (33):
3.3. Total Energy Consumption and Greenhouse Gas Emission of Nickel Production
Total greenhouse gas emission from the nickel production process can be calculated by Equation (34).
where Ei stands for the GHG emission from the contribution source i (i = fuel, coal, lime etc.); Q is the amount of contribution source, such as energy, fuel, and input raw materials. Also, EFi is the emission factor (EF) of contribution source i (i = fuel, coal, lime, etc.). The considered GHG emission sources in this model are from CO2, CH4 and N2O. Therefore, the emission factor is the sum of the three gas emissions. The Global Warming Potential (GWP) was calculated to allow the comparisons of greenhouse effects of different gases by providing a common measurement unit- carbon dioxide equivalent (CO2-eq). For example, GWP100 (CH4) = 28 and GWP100 (N2O) = 265 [27] indicate that greenhouse effects from CH4 gas and N2O gas are 28 and 265 times of the effect from CO2 gas over 100 years.
Ei = EFiQi
Electricity is termed as a secondary energy source. The generation of electricity depends on converting of other forms of energies, such as thermal energy from fuel combustion (natural gas, coal, oil, biomass etc.), kinetic energy of water and wind, solar energy, and geothermal power etc. The actual amount of energy generated by electricity should be converted into primary energy. Here, the primary energy factor (PEF) is typically used for such conversion [28]. Primary energy factor is the ratio of energy consumed in power plant (Eplant) and the consumed electricity by users (Eelectricity), see Equation (35).
PEF = Eplant/Eelectricity
The PEF values of electricity can be found in Table 3. In addition to the primary energy factor, the local grid mix of fuel sources for electricity is considered to generate the primary energy consumption and GHG emission per unit of electricity being consumed.
Table 3 presents a summary of the conversion factors of inventories, which are considered in the modelling work. The table consists of three parts: (1) energy value and associated carbon emission factor for the energy carrier; (2) primary energy consumption and associated carbon emission factor for the transport between sub-processes; (3) primary energy consumption and associated carbon emission factor for the auxiliary materials such as lime, silica, and oxygen. In this work, energy is referring to the primary energy if something else is not specified.
Table 3.
Conversion factor of inventory.
Table 3.
Conversion factor of inventory.
| Primary Energy | Emission Factor | |
|---|---|---|
| Energy a | ||
| Electricity (coal) | PEF: 0.34 [29] | 1000 kgCO2-eq/kWh [30] |
| Electricity (natural gas) | PEF: 0.4 [29] | 500 kgCO2-eq/kWh [30] |
| Electricity (oil) | PEF: 0.37 [29] | 650 kgCO2-eq/kWh [30] |
| Electricity (hydro) | PEF: 0.95 [31] | 20 kgCO2-eq/kWh [30] |
| Electricity (wind) | PEF: 0.5 [32] | 4.6 kgCO2-eq/kWh [30] |
| Electricity (solar) | PEF: 0.34 [33] | 58 kgCO2-eq/kWh [30] |
| Electricity (biomass) | PEF: 0.23 [34] | 93 kgCO2-eq/kWh [30] |
| Diesel (road Transport) | 43.3 MJ/kg [35] | 0.0752 kgCO2-eq/MJ [36] |
| Diesel (sea Transport) | 43.3 MJ/kg [35] | 0.0748 kgCO2-eq/MJ [36] |
| Diesel (stationary combustion) | 43.3 MJ/kg [35] | 0.0743 kgCO2-eq/MJ [36] |
| Natural Gas | 50 MJ/kg [35] | 0.0562 kgCO2-eq/MJ [36] |
| Coal | 27.5 MJ/kg [35] | 0.0953 kgCO2-eq/MJ [36] |
| Anthracite | 29 MJ/kg [35] | 0.099 kgCO2-eq/MJ [36] |
| Coke | 28.5 MJ/kg [35] | 0.1077 kgCO2-eq/MJ [36] |
| Transport b | ||
| Truck freight | 1.1 MJ/tkm [37] | 0.08 kgCO2-eq/tkm |
| Ship freight | 0.12 MJ/tkm [37] | 0.009 kgCO2-eq/tkm |
| Auxiliary Material | ||
| Electrode c | 20 MJ/kg | 3.663 kgCO2-eq/kg [38] |
| Ammonia d | 37.5 MJ/kg [36] | 2.104 kgCO2-eq/kg [36] |
| Hydrogen e | 118 MJ/kg [39] | 9.71 kgCO2-eq/kg [39] |
| Oxygen f | 18.2 MJ/kg | 5 kgCO2-eq/kg |
| Silica g | 0.68 MJ/kg | 0.09 kgCO2-eq/kg |
| Lime | 4.5 MJ/kg [38] | 0.95 kgCO2-eq/kg [38] |
| Sulfur h | 22 MJ/kg | 1.6 kgCO2-eq/kg |
| FeSi i | 90 MJ/kg [13] | 3.44 kgCO2-eq/kg [13] |
| Aluminium j | 140 MJ/kg [40] | 6.7 kgCO2-eq/kg [40] |
a Energy: PEF is not site specific. b Transport: emission factor is estimated by assuming 100% diesel-powered vehicles and vessels. The measuring unit is per tonne per kilometer transport distance (tkm). c Electrode: energy was estimated from literature data [41], including carbonization and graphitization data. d Ammonia: European average energy value for both modern and older natural gas based plants. e Hydrogen: steam reforming of natural gas. f Oxygen: energy and emission factor were estimated based on energy value from literature [42], using coal-powered electricity. g Silica: Energy and emission factor were estimated by energy value from literature [43,44], including mining, beneficiation. h Sulfur: energy and emission factor were estimated according to literature [45] with diesel fuel. i FeSi: carbothermic process. j Aluminium: electrolysis process.
4. Results and Discussion
The energy consumption and GHG emissions of nickel production is affected by several factors, such as the accuracy of inventory data, electricity sources, and ore grades. To investigate the impact of these factors, four nickel smelting products were selected as base for the case studies. Specifically, these are: nickel metal, nickel oxide, ferronickel, and nickel pig iron. The four cases are denoted as Case 1-Ni, Case 2-NiO, Case 3-FeNi, and Case 4-NPI. Some basic information and process flow of the four cases are given in Table 4 and in Figure 1.
Table 4.
Basic information of the studied cases [23,46,47,48,49,50].
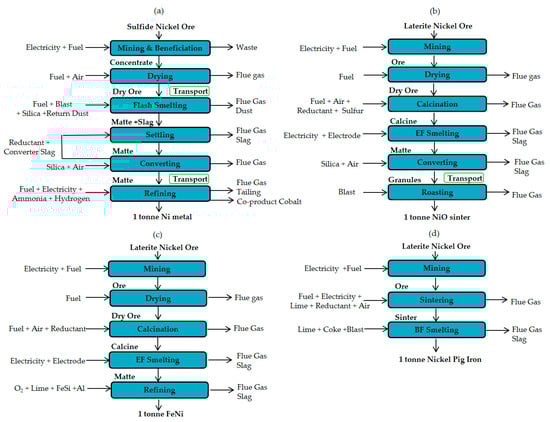
Figure 1.
Process flows and system boundaries of four smelting products: (a) Case 1- Ni metal, (b) Case 2-NiO, (c) Case 3-FeNi and (d) Case 4-NPI.
4.1. Inventory Data of Nickel Product
As mentioned in previous sections, the modelling follows some defined steps to calculate the inventory data. The prerequisite is the chemistry of the feedstock and some default parameter values such as the operation temperature and metal recovery rate. These data were collected from various sources such as: surveys, published articles and books etc. [22,23,47,51,52,53,54,55,56,57]. The authors of this work have cross-compared and scrutinized data between sources and then selected the input data used in the modelling. These input data are tabulated in Table 5, Table 6 and Table 7. The corresponding assumptions and simplifications used when extracting these data can be found in the annotations under each table.
Table 5.
Chemistry of raw materials and fuels (unit: H2O-mass %; CH4, O2, N2-vol%; rest-dry mass%) [23,47,51,52,53,55,58].
Table 6.
Charge/discharge temperature in nickel processing (Unit: °C) a [22,23,47,53,57].
Table 7.
Metal recovery rate a during process stage.
The process model is based on a mass and energy balance. An example of fulfilling the balance condition is given in Table A2 in the Appendix B, showing the calculated values from Case 2-NiO. Once the balance condition has been reached, the resource consumption will be confirmed for each process. Table 8 summarizes the overall inventory for producing one ton of nickel metal, nickel oxide, ferronickel, and nickel pig iron from nickel ore.
Table 8.
Inventory of one tonne of nickel alloy production a.
The generated site-specific inventory modelling data was then compared with the reported plant values, as shown in Table 9. The modelling results including resource consumption and chemistry of the product are in a good agreement with the reported data.
Table 9.
Comparison of modelling result with plant value for Case 2-NiO.
4.2. Energy Consumption and GHG Emission of Nickel Production
Total energy consumption and GHG emission from the modelling of four nickel smelting products i.e., cases 1–4 are shown in Figure 2. The required energy for producing one ton of nickel metal (100% Ni), nickel oxide (76% Ni), ferronickel (35% Ni) and nickel pig iron (10% Ni) from nickel ore are 174 GJ, 370 GJ, 110 GJ, and 60 GJ, respectively. Furthermore, the associated environment impacts are 14 tCO2-eq, 30 tCO2-eq, 6 tCO2-eq, and 7 tCO2-eq, respectively. The most energy-consuming sub-processes are the refining, smelting, calcination and smelting processes for the production of Ni, NiO, FeNi, and NPI, respectively. Specifically, they account for 44%, 45%, 44%, and 67% of the total energy requirement. Meanwhile, the corresponding emission in the energy-intensive sub-processes account for 38%, 45%, 55%, and 73%, respectively. Furthermore, the main contribution source causing a high energy consumption and a high GHG emissions are coming from the use of fossil fuel/reductant in Case 2-NiO, Case 3-FeNi, and Case 4-NPI while electricity is the major contributor in the manufacturing of Case 1-nickel metal.
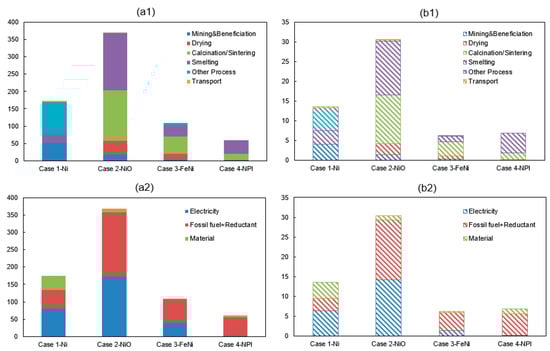
Figure 2.
(a1) Energy consumption (GJ/t alloy) and (b1) GHG emissions (tCO2-eq/t alloy) of nickel production along with sub-process (a2) Energy consumption (GJ/t alloy) and (b2) GHG emissions (tCO2-eq/t alloy) of nickel production along with the contribution source.
4.2.1. Effect of Electricity Source
The energy consumption and GHG emissions from the case studies are compared to previous research work and the results are summarized in Table 10. In terms of ferronickel, Table 10 indicates that the application of a high-ratio (70%) hydroelectricity in the process could possibly yield the lowest energy consumption (110 GJ) and GHG emissions (6 tCO2-eq). As suggested from Table 10, most studies of FeNi have used a coal-powered electricity. To examine the impact of the electricity source on the results, the following three electricity scenarios were considered for each nickel alloy to study the emission reduction potential:
Table 10.
Comparisons of energy consumption (GJ/t alloy) and GHG emission (tCO2-eq/t alloy) of nickel alloy production a.
- A 100% coal-powered electricity (conversion efficiency: 34%)
- A power grid mix- current operation (conversion efficiency: between 34–95%)
- A 100% hydro-powered electricity (conversion efficiency: 95%)
The differences between the studied operation strategies are compared in Figure 3. The total energy consumption and carbon emissions of Case 3-FeNi when using a 100% coal-powered electricity is estimated as 161 GJ/t and 13 tCO2-eq/t, respectively. However, use of a 100% hydro-powered electricity drops the specific amount of energy and emission by 37% and 64%, respectively. Similarly, by changing from coal to hydropower, the possible GHG emission reduction for Case 1-Ni, Case 2-NiO and Case 4-NPI are 54% (8.8 tCO2-eq), 53% (19 tCO2-eq), 64% (8.5 tCO2-eq), and 4% (0.2 tCO2-eq), respectively.
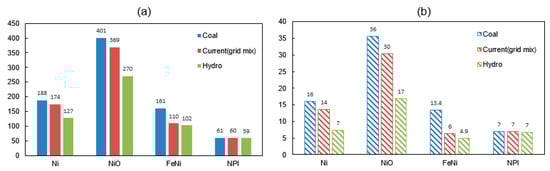
Figure 3.
(a) Energy consumption (GJ/t alloy) and (b) GHG emissions (tCO2-eq/t alloy) of nickel alloy production with different scenarios of electricity (Blue: 100% coal-electricity; Red: grid-mix; Green: 100% hydro-electricity).
In Nawshad’s work [13], the energy value (325 GJ/t) is about two times higher than the other values (110–160 GJ/t) reported in Table 10. On the other hand, the emission value (13.9 tCO2-eq/t) seems to be in line with results from other studies (9.3–14 tCO2-eq/t). Based on the inventory given in Nawshad’s work [13], the estimated results by the authors of this work is a 230 GJ/t energy value (using a 100% coal-electricity) and a 12 tCO2-eq/t emission value.
4.2.2. Effect of the Ore Grade
As suggested from Table 10, the results of nickel metal in the study of Eckelman [12] and the Nickel Institute [18] are relatively high with respect to the energy requirement (Eckelman: 266 GJ/t; Nickel Institute: 236 GJ/t). This is due to the fact that the results are the average value of both pyrometallurgical and hydrometallurgical processes of both sulfide and laterite ores, while in the current study only the pyrometallurgical process was considered. According to previous studies [15], the hydrometallurgical process of pure nickel production requires a higher energy consumption (194 GJ/t) than the pyrometallurgical process (114 GJ/t).
The Ni metal studied in Norgate’s work [15] exhibits a relatively low value with respect to both the energy requirement (114 GJ/t) and GHG emissions (11.4 tCO2-eq/t). One of the possible reasons can be due to the difference of the ore grade. The sulfide ore in Norgate’s work has a nickel content of 2.3% Ni, while this work uses an ore containing 2.05% Ni. Previous studies [1,63] have concluded that the energy consumption and GHG emissions of nickel production is ore-grade dependent. The degrading of nickel ore will lead to an increase of the energy demand and carbon emissions. To further examine the effect of ore grade on energy and GHG emissions, Case 1-Ni and Case 3-FeNi were assessed with respect to different ore grades (Figure 4).
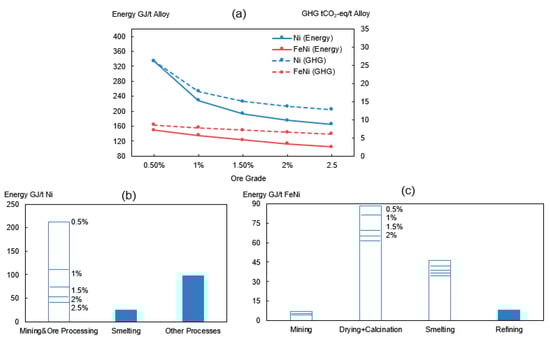
Figure 4.
(a) Effect of ore grade on total energy consumption and GHG emissions of Ni (Blue) and FeNi (Red). Effect of ore grade on energy consumption of sub-process for production of (b) nickel metal and (c) FeNi.
It can be concluded from Figure 4a that a declining ore grade yields a higher energy intensity and higher carbon emissions during nickel alloy production. The environmental impact of ferronickel will be raised from 6 tCO2-eq to 8.6 tCO2-eq when substituting the ore (2.5% Ni) with a lower grade (0.5% Ni). In relation to pure nickel, the emissions will increase from 13 tCO2-eq to 26 tCO2-eq for the same ore grade change. The production of nickel metal is more sensitive than ferronickel, especially when the ore grade is below 1%. These findings agree well with Norgate’s work [63]. This can be explained based on mass balance calculations and the fact that the low-grade ore requires a higher amount of raw ores as the nickel content in the alloy product stays constant. In other words, the increase of the embodied energy occurs because an additional energy and auxiliary materials will be consumed for the nickel recovery and for the removal of unwanted components. The higher impact of ore grade on nickel metal compared to ferronickel is due to its high nickel content (100%) in the final product.
For the production of nickel metal, the major energy differences occur in the mining and beneficiation stages (Figure 4b). This is because the sulfide concentrates at the end of the ore processing stage is independent on the initial ore grade. The relatively constant grade (11% Ni) has only a small influence on the subsequent process steps such as the calcination and smelting. In terms of a ferronickel production, the upgrading and beneficiation is seldom done due to the high content of oxides in the laterite ore which makes it less economic to use. The decrease of the nickel content in the laterite ore concentrate may be due to a high content of oxides such as magnesia and silica which then produces more slag in the smelting. This therefore results in a higher unit intensity of energy requirement for ferronickel. The major energy increase occurs in drying, calcination, and smelting processes before the resulting slag is decanted (Figure 4c).
4.2.3. Effect of Nickel Grade in Alloy
The nickel content in the alloy contains 10–100% in the studied cases, which makes it difficult for a downstream user, for instance, a stainless steelmaker, to directly evaluate the environmental impact of using different alloys. Figure 5 presents a comparison of different alloy on the same contained nickel basis, i.e., a 100% Ni basis. For one ton of nickel alloy, the best choice is the use of nickel pig iron since it has a low energy requirement and low carbon emissions. According to USGS’s statistics in 2019 [2], the market is also indicating an increasing demand of NPI instead of refined nickel in the stainless steel industry, due to its low cost. However, when comparing the alloy products based on the same contained nickel basis (one ton contained nickel), the embodied high energy requirement and associated GHG emissions of NPI will be critical from a sustainability perspective. Furthermore, the introduction of carbon tax or emission rights trading will make it potentially less cost-effective in the future.
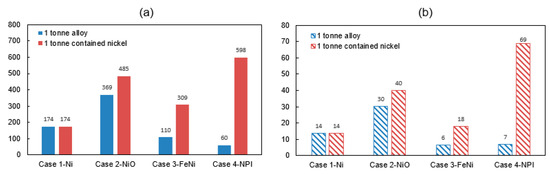
Figure 5.
(a) Energy consumption (GJ/t alloy) and (b) GHG emissions (tCO2-eq/t alloy) on the basis of one tonne contained nickel.
The three nickel products NiO (485 GJ), FeNi (309 GJ) and NPI (598 GJ) processed from laterite ores have evidently higher energy consumption and carbon emissions compared to nickel metal (174 GJ) on the same nickel content basis (1 ton contained nickel). In comparison to sulfide processing, laterite ores are seldom upgraded and concentrated due to the high content of MgO. Additionally, sulfur in the sulfide ore can play a role as a fuel source in smelting process, which makes it less dependent on other sources of energy than the laterite processing. This is one reason why most nickel projects in the world historically were sulfide projects though 60% of the world’s nickel resource consists of laterite [1].
4.2.4. Effect of Co-Product Allocation
Co-products have effects on the overall environmental impact of nickel production. In the current work, three co-products allocations are examined and discussed, namely cobalt, sulfuric acid and thermal energy from flue gas/slag. Cobalt is a typical co-product in a nickel metal refining process. Sulfuric acid is converted by utilizing concentrated SO2 gas from the flue gas from the flash smelting and converting processes where oxygen is injected to lower the sulfur content in the melt through oxidation. In the process, the discharged temperature of the waste gas and slag takes place at a high temperature. The slag/metal ratio of saprolite ore in RKEF process remains a rather high mass ratio of 7–23 [23], which means high amounts of thermal heat will be distributed to the waste. The recovery of the waste heat as a fuel source can reduce fuel consumption in the production. A proposed allocation strategy for four nickel products is described in Table 11.
Table 11.
Considered co-product allocation in the study.
Environmental impact can be allocated based on the economic value, mass, or energy content. Due to the complexity of a nickel production process, it is not easy to precisely divide the resource and energy use. Therefore, the system expansion method [64] is used for co-products allocation. System expansion awards an emission credit to a co-product in the evaluated system boundary, due to the displacement of co-product production. The waste thermal heat from flue gas and slag can be a fuel substitute in drying or calcination process. By assuming that the heat recovery is 100% and the fuel substitute is natural gas. The production of sulfuric acid was considered having a primary energy credit of 2.6 MJ per kilogram acid [12]. Its carbon credit was estimated by assuming that the acid production was consuming coal-powered electricity. The co-product cobalt will result in a reduction potential of energy and GHG emissions for 63.8 MJ/kg Co and 11.73 kg CO2-eq/kg Co based on inventory data from an earlier study [65]. Figure 6 shows the energy consumption and GHG emissions with co-product allocations in accordance with Table 11. The corresponding reduction potential of environment impact for producing one ton of nickel metal, NiO, FeNi, and NPI is 8 tCO2-eq, 12 tCO2-eq, 3 tCO2-eq, and 1 tCO2-eq, respectively, accounting for a reduction ratio of 57%, 40%, 43%, and 17%.
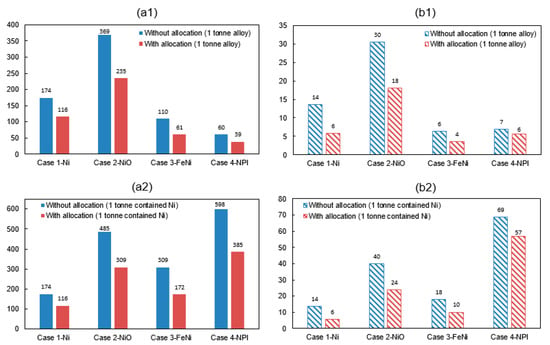
Figure 6.
Effect of co-product allocation on (a1) Energy consumption (GJ/t alloy), (b1) GHG emissions (tCO2-eq/t alloy) (a2) energy consumption (GJ/t contained Ni) and (b2) GHG emissions of nickel product (tCO2-eq/t contained Ni) (allocation based on proposal in Table 11).
5. Conclusions
In the current work, the energy consumption and GHG emissions when producing nickel products from nickel ore have been evaluated through case studies comprising of four distinct and typical cases. The focus are the four smelting products: nickel metal, nickel oxide, ferronickel, and nickel pig iron. As shown from the results, the required energy for producing nickel metal, nickel oxide, ferronickel and nickel pig iron are 174 GJ/t alloy (174 GJ/t contained Ni), 369 GJ/t alloy (485 GJ/t contained Ni), 110 GJ/t alloy (309 GJ/t contained Ni) and 60 GJ/t alloy (598 GJ/t contained Ni), respectively. Furthermore, the associated GHG emissions are 14 tCO2-eq/t alloy (14 tCO2-eq/t contained Ni), 30 tCO2-eq/t alloy (40 tCO2-eq/t contained Ni), 6 tCO2-eq/t alloy (18 tCO2-eq/t contained Ni), and 7 tCO2-eq/t alloy (69 tCO2-eq/t contained Ni).
Based on the case studies, some potential reductions of environmental impacts have been identified and studied with the aid of the developed process model. To produce one ton contained nickel, extracting sulfide ore through the flash smelting process (Case 1), has been shown an optimum energy requirement and greenhouse gas emissions. In comparison to sulfide ore processing, nickel ore processed in an electric furnace (Case 2 and Case 3) is much more energy intensive and less environment friendly due to the complexity of the ore. However, by using a sustainable electricity source such as hydro-powered electricity, or applying thermal heat recovery, it is possible to make electric furnace smelting of laterite a promising process in the future. Nickel pig iron produced in blast furnace (Case 4) results in the highest energy intensity and carbon emissions. However, its use in stainless steelmaking is increasing due to its lower cost. The economic benefit of using nickel pig iron in stainless steelmaking will be impacted when taking carbon tax into account.
The process model based on a mass and energy balance provides supplementary site-specific inventory data when evaluating a nickel product’s energy consumption and GHG emissions. By doing so, the modelling overcomes the limitation of conventional LCA study regarding the process as a ‘black box’ and therefore enables the identification of more possibilities to improve the sustainability of nickel production.
Author Contributions
Conceptualization, W.W. and P.B.S.; methodology, W.W., P.B.S., and R.G.; Investigation, W.W., P.B.S., and A.T.; Writing-original draft, W.W.; Writing-review and editing, W.W., P.B.S., A.T., P.G.J., and R.G.; Supervision, P.B.S., A.T., P.G.J., and R.G.; Funding Acquisition: A.T. and R.G. All authors have read and agreed to the published version of the manuscript.
Funding
The research was financial supported by Jernkontoret scholarship “Stiftelsen Prytziska fonden 2 (2020)” and the Swedish company Kobolde & Partners AB.
Conflicts of Interest
The authors declare no conflict of interest.
Abbreviations
| BF | Blast Furnace |
| EF | Electric Furnace |
| EFi | Emission Factor of contribution source i |
| GHG | Greenhouse Gas |
| GWP | Global Warming Potential |
| LCA | Life Cycle Assessment |
| NPI | Nickel Pig Iron |
| PEF | Primary Energy Factor |
| RKEF | Rotary Kiln Electric Furnace |
Appendix A
Table A1.
Mass and energy conservation in the sub-process.
Table A1.
Mass and energy conservation in the sub-process.
| Drying | |
| Calcination | |
(calcination/reduction) (calcination/reduction/sulfidation) (sintering) | |
| Smelting | |
(EAF) (BF) (FF) (EAF and BF) (FF) (EAF) (FF and BF) (EAF and BF) (FF) | |
| Converting | |
(after flash smelting) (after settling) | |
| Settling | |
| Refining | |
| Roasting | |
| Mi, in/Mi, out/Ei, in/Ei, out | i stands for the sub-process of nickel production. The symbol of D, C, S, CO, SE, R or RO is referring to the sub-process of drying, calcination, smelting, converting, settling, refining and roasting, respectively. Mi, in and Mi, out stand for the total mass input and output in the sub-process i. Ei, in/Ei, out represents for the total energy input and output in the sub-process i. |
| MD, j | j = CO, A, F, DO, FG; MD, j represents the input mass of raw concentrated ore (CO), air (A), fuel (F) and the output mass of dried ore (DO) and flue gas (FG) in drying. |
| ED, j | j = FC, DO, FG, EN; ED, j represents the chemical energy released from fuel combustion (FC), the energy required to heat the outgoing dried ore (DO) and flue gas (FG) to the discharge temperature, as well as the energy required for endothermic reactions (EN) in drying. |
| MC, j | j = DO, A, F, R, S, L, C, FG; MC, j represents the input mass of dried ore (DO), air (A), fuel (F), reductant (R), sulfur (S), lime (L) and the output mass from calcine(C) and flue gas (FG) in calcination (or sulfurization/sintering). |
| EC, j | j = FC, EX, C, FG, EN; EC, j represents the chemical energy released from exothermic reactions (EX), fuel combustion (FC) and the energy required to heat the outgoing calcine (C) and the flue gas (FG) to the discharge temperature, as well as the energy required for endothermic reactions (EN) in calcination (or sulfurization/sintering). |
| MS, j | j = C, A, R, F, BL, L, SI, RD, M, SL, FG, D; MS, j represents the input mass of calcine (C), air(A), reductant (R), fuel (F), blast(BL), lime(L), silica (SI), return dust (RD) and the output mass of matte (M), slag (SL), flue gas(FG), dust (D) in smelting. |
| ES, j | j = C, BL, FC, EX, EL, M,SL,FG, D, EN,LO; ES, j represents the physical energy associated in the calcine(C), blast (BL), the chemical energy released from fuel combustion (FC), other exothermic reactions (EX), the electricity requirement (EL),the energy required to heat the outgoing matte (M), slag (SL), flue gas (FG), dust (D) to the discharge temperature and the energy required for endothermic reactions(EN), as well as the heat loss of furnace through conduction and radiation (LO) in smelting. |
| MCO, j | j = M, A, SI, CM, SL, FG; MCO, j represents the input mass of matte (M), air (A), silica (SI) and the output mass of converter matte (CM), slag (SL) and flue gas (FG) in converting. |
| ECO, j | j = M, EX, CM, SL,FG; ECO, j represents the physical energy associated in the matte (M), the chemical energy from exothermic reactions (EX) and the energy required to heat the outgoing converter matte (CM), slag (SL) and flue gas (FG) to the discharge temperature in converting, as well as the heat loss of converter through conduction and radiation (LO) in converting. |
| MSE, j | j = R, SM, SL, FG; MSE, j represents the input mass of reductant (R), the output mass of the settling matte (SM), slag (SL) and flue gas (FG) in settling process. |
| ESE, j | j = EL, EX, MM, SL, FG, EN, LO; ESE, j represents the energy from electricity (EL), the exothermic reactions (EX), the output mass of mixed matte (MM), slag (SL), flue gas (FG), the energy required for endothermic reactions and the furnace heat loss during settling. |
| MR, j | j = L, O, RM, SL, FG; MR, j represents the input mass of lime, oxygen, the output mass of refined matte, slag and flue gas in refining. |
| ER, j | j = EX, RM, SL, FG, EN; ER, j represents the energy released from exothermic reactions (EX), the energy required to heat the refined matte (RM), slag (SL), flue gas (FG) and the energy required for endothermic reactions in refining process. |
| MRO, j | j = BL, RO, FG; MRO, j represents the input mass of blast (O), the output mass of roast (RO) and flue gas (FG) to the discharge temperature in refining. |
| ERO, j | j = EX, RO, FG, EN; ERO, j represents the energy released from exothermic reactions (EX), the energy required to heat the roast (RO), flue gas (FG) and the heat loss of reactor through conduction and radiation (LO) in roasting |
Appendix B
Table A2.
(Mass unit: kg/t alloy; Energy unit: MJ/t alloy).
Table A2.
(Mass unit: kg/t alloy; Energy unit: MJ/t alloy).
| Drying | |||||||
| MD,in | MD,out | ED,in | ED,out | ||||
| MD,CO | 64,550 | MD,DO | 54,868 | ED,FC | 38,102 | ED,DO | 9099 |
| MD,A | 12,860 | MD,FG | 23,422 | ED,FG | 2903 | ||
| MD,F | 879 | ||||||
| Total | 78,289 | Total | 78,289 | Total | 38,102 | Total | 38,102 |
| Calcination | |||||||
| MC,in | MC,out | EC,in | EC,out | ||||
| MD,do | 54,868 | MC,C | 39,160 | EC,FC | 73,129 | EC,C | 24,150 |
| MC,A | 31,132 | MC,FG | 50,556 | EC,EX | 24,011 | EC,FG | 64,074 |
| MC,F | 1688 | EC,EN | 8916 | ||||
| MC,R | 1638 | ||||||
| MC,S | 392 | ||||||
| Total | 89,716 | Total | 89,716 | Total | 97,140 | Total | 97,140 |
| Smelting | |||||||
| MS,in | MS,out | ES,in | ES,out | ||||
| MC,C | 39,160 | MS,M | 2853 | ES,C | 13,080 | ES,M | 3752 |
| MS,A | 2219 | MS,SL | 35,176 | ES,EL | 65,473 | ES,SL | 64,836 |
| MS,FG | 3350 | ES,EX | 6080 | ES,FG | 1653 | ||
| ES,LO | 10,496 | ||||||
| ES,EN | 3897 | ||||||
| Total | 41,380 | Total | 41,380 | Total | 84,633 | Total | 84,633 |
| Converting | |||||||
| MCO,in | MCO,out | ECO,in | ECO,out | ||||
| MS,M | 2853 | MCO,CM | 981 | ECO,M | 3752 | ECO,CM | 1252 |
| MCO,A | 2490 | MCO,SL | 3134 | ECO,EX | 8846 | ECO,SL | 4522 |
| MCO,SI | 805 | MCO,FG | 2033 | ECO,FG | 3021 | ||
| ECO,LO | 3803 | ||||||
| Total | 6149 | Total | 6149 | Total | 12,599 | Total | 12,599 |
| Roasting | |||||||
| MRO,in | MRO,out | ERO,in | ERO,out | ||||
| MCO,CM* | 981 | MRO,RO | 1004 | ECO,CM | 0 | ERO,RO | 679 |
| MRO,BL | 543 | MRO,FG | 520 | ERO,EX | 4598 | ERO,FG | 458 |
| ERO,LO | 3462 | ||||||
| Total | 1524 | Total | 1524 | Total | 4598 | Total | 4598 |
| Re-rosting | |||||||
| MRO,in | MRO, out | ERO, in | ERO, out | ||||
| MRO,RO | 1004 | MRO,RO’ | 1000 | ERO,RO | 679 | ERO,RO’ | 640 |
| MRO,BL’ | 13 | MRO,FG’ | 17 | ERO,EX’ | 39 | ERO,FG’ | 16 |
| ERO,LO’ | 62 | ||||||
| Total | 1017 | Total | 1017 | Total | 718 | Total | 718 |
References
- Mudd, G.M. Global trends and environmental issues in nickel mining: Sulfides versus laterites. Ore Geol. Rev. 2010, 38, 9–26. [Google Scholar] [CrossRef]
- Nickel Data Sheet-Mineral Commodity Summaries 2019. Available online: https://pubs.usgs.gov/periodicals/mcs2020/mcs2020-nickel.pdf (accessed on 13 September 2020).
- Finnveden, G.; Hauschild, M.Z.; Ekvall, T.; Guinée, J.; Heijungs, R.; Hellweg, S.; Koehler, A.; Pennington, D.; Suh, S. Recent developments in Life Cycle Assessment. J. Environ. Manag. 2009, 91, 1–21. [Google Scholar] [CrossRef] [PubMed]
- Jacquemin, L.; Pontalier, P.-Y.; Sablayrolles, C. Life cycle assessment (LCA) applied to the process industry: A review. Int. J. Life Cycle Assess. 2012, 17, 1028–1041. [Google Scholar] [CrossRef]
- Azapagic, A. Life cycle assessment and its application to process selection, design and optimisation. Chem. Eng. J. 1999, 73, 1–21. [Google Scholar] [CrossRef]
- Lundqvist, P. Mass and Energy Balances over the Lime Kiln in a Kraft Pulp Mill. Master’s Thesis, Uppsala University, Uppsala, Sweden, 2009. [Google Scholar]
- Liu, P.; Wang, Q.; Cheung, S.; Wu, W. Material and energy flows in rotary kiln-electric furnace smelting of ferronickel alloy with energy saving. Appl. Therm. Eng. 2016, 109, 542–559. [Google Scholar] [CrossRef]
- Kirschen, M.; Risonarta, V.; Pfeifer, H. Energy efficiency and the influence of gas burners to the energy related carbon dioxide emissions of electric arc furnaces in steel industry. Energy 2009, 34, 1065–1072. [Google Scholar] [CrossRef]
- Pfeifer, H.; Kirschen, M. Thermodynamic analysis of EAF electrical energy demand. In Proceedings of the 7th European Electric Steelmaking Conference, Venice, Italy, 26–29 May 2002. [Google Scholar]
- Kamfjord, N.E. Mass and Energy Balances of the Silicon Process: Improved Emission Standards. Ph.D. Thesis, Norwegian University of Science and Technology, Trondheim, Norway, 2012. [Google Scholar]
- Gyllenram, R. (Ed.) Sourcing Edge-Final Report; Report for Vinnova: Stockholm, Sweden, 2015. [Google Scholar] [CrossRef]
- Eckelman, M.J. Facility-level energy and greenhouse gas life-cycle assessment of the global nickel industry. Resour. Conserv. Recycl. 2010, 54, 256–266. [Google Scholar] [CrossRef]
- Haque, N.; Norgate, T. Estimation of greenhouse gas emissions from ferroalloy production using life cycle assessment with particular reference to Australia. J. Clean. Prod. 2013, 39, 220–230. [Google Scholar] [CrossRef]
- Norgate, T.; Jahanshahi, S. Assessing the energy and greenhouse gas footprints of nickel laterite processing. Miner. Eng. 2011, 24, 698–707. [Google Scholar] [CrossRef]
- Norgate, T.; Rankin, W. Life cycle assessment of copper and nickel production. In Proceedings of the International Congress on Mineral Processing and Extractive Metallurgy, Melbourne, Australia, 11–13 September 2000. [Google Scholar]
- Norgate, T.; Jahanshahi, S.; Rankin, W. Alternative routes to stainless steel-a life cycle approach. In Proceedings of the 10th International Ferroalloys Congress, Cape Town, South Africa, 1–4 February 2004. [Google Scholar]
- Fukuzawa, R. Climate change policy to foster pollution prevention and sustainable industrial practices—A case study of the global nickel industry. Miner. Eng. 2012, 39, 196–205. [Google Scholar] [CrossRef]
- Nickel Institute. Life Cycle Assessment of Nickel Products; Report for Nickel Institue: Toronto, ON, Canada, 2020. [Google Scholar]
- Ma, X.; Yang, D.; Zhai, Y.; Shen, X.; Zhang, R.; Hong, J. Cost-combined life cycle assessment of ferronickel production. Int. J. Life Cycle Assess. 2019, 24, 1840–1850. [Google Scholar] [CrossRef]
- Deng, S.Y.; Gong, X.Z. Life Cycle Assessment of Nickel Production in China. Mater. Sci. Forum 2018, 913, 1004–1010. [Google Scholar] [CrossRef]
- Bartzas, G.; Komnitsas, K. Life cycle assessment of ferronickel production in Greece. Resour. Conserv. Recycl. 2015, 105, 113–122. [Google Scholar] [CrossRef]
- Crundwell, F.K.; Moats, M.S.; Ramachandran, V.; Robinson, T.G.; Davenport, W.G. Extractive Metallurgy of Nickel, Cobalt and Platinum Group Metals; Elsevier: Amsterdam, The Netherlands, 2011; ISBN 9780080968094. [Google Scholar]
- Warner, A.E.M.; Díaz, C.M.; Dalvi, A.D.; Mackey, P.J.; Tarasov, A.V. JOM world nonferrous smelter survey, part III: Nickel: Laterite. JOM 2006, 58, 11–20. [Google Scholar] [CrossRef]
- Rao, M.; Li, G.; Jiang, T.; Luo, J.; Zhang, Y.; Fan, X. Carbothermic Reduction of Nickeliferous Laterite Ores for Nickel Pig Iron Production in China: A Review. JOM 2013, 65, 1573–1583. [Google Scholar] [CrossRef]
- Metalbulletin. 2016 REVIEW: China-Backed Indonesian Nickel Projects Step up Production to Satisfy Growing Chinese NPI Demand. 2016. Available online: https://www.metalbulletin.com/Article/3649788/2016-REVIEW-China-backed-Indonesian-nickel-projects-step-up-production-to-satisfy-growing-Chinese-NPI.html (accessed on 13 September 2020).
- Roine, A. HSC Chemistry® (Version 8)(Software); Outotec Research Oy Center: Pori, Finland, 2014. [Google Scholar]
- IPCC. Climate Change 2013: The Physical Science Basis. Contribution of Working Group I to the Fifth Assessment Report of the Intergovernmental Panel on Climate Change. Available online: https://www.ipcc.ch/report/ar5/wg1/ (accessed on 18 September 2020).
- Dixit, M.; Culp, C.; Fernandez-Solis, J. Calculating Primary Energy and Carbon Emission Factors for the United States’ Energy Sectors. R. Soc. Chem. 2014, 4, 54200–54216. [Google Scholar] [CrossRef]
- IEA. Energy Efficiency Indicators for Public electricity Production from Fossil Fuels; Report for IEA: Paris, France, 2008. [Google Scholar]
- UK Parliament. Carbon Footprint of Electricity Generation (Postnote). 2006. Available online: https://www.parliament.uk/documents/post/postpn268.pdf (accessed on 13 September 2020).
- Lewis, B.; Cimbala, J.; Wouden, A. Major historical developments in the design of water wheels and Francis hydroturbines. IOP Conf. Ser. Earth Environ. Sci. 2014, 22, 012020. [Google Scholar] [CrossRef]
- U.S. DOE. Wind Vision: A New Era for Wind Power in the United States. 2015. Available online: https://www.energy.gov/sites/prod/files/WindVision_Report_final.pdf (accessed on 18 September 2020).
- U.S. DOE. Renewable Electricity Generation. 2015. Available online: https://www.energy.gov/sites/prod/files/2013/11/f4/55296.pdf (accessed on 13 September 2020).
- Biomass Energy Resource Center. Biomass Energy: Efficiency, Scale, and Sustainability. 2009. Available online: https://www.biomasscenter.org/policy-statements/FSE-Policy.pdf (accessed on 13 September 2020).
- IPCC. Good Practice Guidance and Uncertainty Management in National Greenhouse Gas Inventories. Available online: https://www.ipcc-nggip.iges.or.jp/public/gp/english/ (accessed on 17 September 2020).
- IPCC. 2006 IPCC Guidelines for National Greenhouse Gas Inventories. 2006. Available online: https://www.ipcc-nggip.iges.or.jp/public/2006gl/ (accessed on 13 September 2020).
- Otten, M.; Hoen, M.; Boer, E.D. STREAM Freight Transport 2016-Emissions of Freight Transport Modes (Version 2). Available online: https://www.cedelft.eu/publicatie/stream_freight_transport_2016/1855 (accessed on 18 September 2020).
- World Steel Association. CO2 Emissions Data Collection-User Guide (Version 7). Available online: https://www.worldsteel.org/steel-by-topic/environment-climate-change/climate-change/data-collection.html (accessed on 13 September 2020).
- Marquevich, M.; Sonnemann, G.; Castells, F. Life cycle inventory analysis of hydrogen production by the steam-reforming process: Comparison between vegetable oils and fossil fuels as feedstock. Green Chem. 2002, 4, 414–423. [Google Scholar] [CrossRef]
- European Aluminium. Environmental Profile Report 2018-The European Aluminium Industry Continues to Decrease its Environmental Footprint across the Value Chain. Available online: https://european-aluminium.eu/resource-hub/environmental-profile-report-2018/ (accessed on 18 September 2020).
- Argonne National Laboratory. Material and Energy Flows in the Production of Cathode and Anode Materials for Lithium Ion Batteries (Report); Argonne National Lab. (ANL): Argonne, IL, USA, 2015. [Google Scholar]
- Allam, R.J. Improved oxygen production technologies. Energy Procedia 2009, 1, 461–470. [Google Scholar] [CrossRef]
- Mitterpach, J.; Hroncová, E.; Ladomersky, J.; Balco, K. Identification of Significant Impact of Silicon Foundry Sands Mining on LCIA. Sustainability 2015, 7, 16408–16421. [Google Scholar] [CrossRef]
- Grbeš, A. A Life Cycle Assessment of Silica Sand: Comparing the Beneficiation Processes. Sustainability 2015, 8, 11. [Google Scholar] [CrossRef]
- Nehb, W.; Vydra, K. Sulfur. In Ullmann’s Encyclopedia of Industrial Chemistry; Wiley-VCH: Weinheim, Germany, 2006. [Google Scholar] [CrossRef]
- Mindat. Perseverance Ni Mine(Agnew; Leinster). Available online: https://www.mindat.org/loc-122759.html (accessed on 13 September 2020).
- Zhou, D. Production practice of flash furnace in Kalgoorlie. Non-Ferr. Metall. 1984, 10, 4–12. (In Chinese) [Google Scholar]
- Australian Government. Australian Electricity Generation-Fuel Mix. Available online: https://www.energy.gov.au/australian-electricity-generation-fuel-mix (accessed on 13 September 2020).
- PricewaterhouseCoopers. Power In Indonesia-Investment and Taxation Guide. Available online: https://www.pwc.com/id/en/publications/assets/eumpublications/utilities/power-guide-2018.pdf (accessed on 13 September 2020).
- Energía Renovable. Colombia Quiere Emprender la Revolución Eólica. Available online: https://www.energias-renovables.com/eolica/colombia-quiere-desatar-la-revolucion-eolica-20160211 (accessed on 13 September 2020). (In Spanish).
- Warner, A.; Díaz, C.; Dalvi, A.; Mackey, P.; Tarasov, A.; Jones, R. JOM world nonferrous smelter survey Part IV: Nickel: Sulfide. JOM J. Miner. Met. Mater. Soc. 2007, 59, 58–72. [Google Scholar] [CrossRef]
- Huang, J. Practice of Nickel-Iron Smelting by Blasting Furnace. Ferro-Alloys 2017, 4, 1–6. (In Chinese) [Google Scholar] [CrossRef]
- Davenport, W.G.; Partelpoeg, E.H. Flash Smelting: Analysis, Control and Optimization; Pergamon: Oxford, UK, 1987. [Google Scholar] [CrossRef]
- Guo, X.J. Chinese Nickel Industry-Projects, Production and Technology. In Proceedings of the Pyrometallurgy of Nickel and Cobalt 2009, Sudbury, ON, Canada, 23–26 August 2009. [Google Scholar]
- Zhang, W. Investigation Report on Kalgoorlie Nickel Smelter. Noferr. Met. 1991, 6, 42–45. (In Chinese) [Google Scholar]
- Guiry, J.D.; Dalvi, A.D. PT INCO’s Indonesian nickel project: An updating. Int. J. Miner. Process. 1987, 19, 199–214. [Google Scholar] [CrossRef]
- Pan, L. Laterite Nickel Ore Sinering Production Practive Research. Ferro-Alloys 2013, 44, 7–10. (In Chinese) [Google Scholar] [CrossRef]
- Kurtz, E.; Kuhel, D.; Anderson, J.E.; Mueller, S.A.; U.S. Department of Energy. A Comparison of Combustion and Emissions of Diesel Fuels and Oxygenated Fuels in a Modern DI Diesel Engine. 2012. Available online: https://www.energy.gov/sites/prod/files/2014/03/f8/deer12_kurtz.pdf (accessed on 13 September 2020).
- Voermann, N.; Gerritsen, T.; Candy, I.; Stober, F.; Matyas, A. Furnace technology for ferro-nickel production—An update. In Proceedings of the International Laterite Nickel Symposium 2004, Charlotte, NC, USA, 14–18 March 2004. [Google Scholar]
- Ammann, P.R.; Kim, J.J.; Loose, T.A. The Kennecott Process for Nickel-Slag Cleaning. JOM 1979, 31, 20–25. [Google Scholar] [CrossRef]
- Kennedy, M. Electric Slag Furnace Dimensioning. In Proceedings of the International Smelting Technology Symposium: Incorporating the 6th Advances in Sulfide Smelting Symposium, Orlando, FL, USA, 11–15 March 2012. [Google Scholar]
- Vale. Japanese Nickel Oxide Sinter 75. Available online: http://www.vale.com/PT/business/mining/nickel/product-safety-information/SafetyDataSheets/Japanese_Nickel_Oxide_Sinter_75_GHS.pdf (accessed on 18 September 2020).
- Norgate, T.; Jahanshahi, S. Energy and greenhouse gas implications of deteriorating quality ore reserves. In Proceedings of the 5th Australian Conference on Life Cycle Assessment, Melbourne, Australia, 22–24 November 2006. [Google Scholar]
- Weidema, B.P.; Schmidt, J.H. Avoiding Allocation in Life Cycle Assessment Revisited. J. Ind. Ecol. 2010, 14, 192–195. [Google Scholar] [CrossRef]
- Farjana, S.H.; Huda, N.; Mahmud, M.A.P. Life cycle assessment of cobalt extraction process. J. Sustain. Min. 2019, 18, 150–161. [Google Scholar] [CrossRef]


Publisher’s Note: MDPI stays neutral with regard to jurisdictional claims in published maps and institutional affiliations. |
© 2020 by the authors. Licensee MDPI, Basel, Switzerland. This article is an open access article distributed under the terms and conditions of the Creative Commons Attribution (CC BY) license (http://creativecommons.org/licenses/by/4.0/).