Article

Thermofluid Characterization of Nanofluid Spray Cooling Combining Phase Doppler Interferometry with High-Speed Visualization and Time-Resolved IR Thermography

by
Miguel Figueiredo
1,
Guido Marseglia
2,3,4,*,
Ana S. Moita
1,5,*,
Miguel R. O. Panão
6,
Ana P. C. Ribeiro
7,
Carlo M. Medaglia
2 and
António L. N. Moreira
1
1
IN+, Mechanical Engineering Department, Instituto Superior Técnico, Universidade de Lisboa, Avenida Rovisco Pais, 1049-001 Lisbon, Portugal
2
Research Department, Università degli Studi Link Campus University of Rome, Via del Casale di San Pio V, 44 0016 Rome, Italy
3
Escuela Técnica Superior de Arquitectura de Sevilla, Av. de la Reina Mercedes, 2, 41012 Seville, Spain
4
Instituto de Matemáticas de la Universidad de Sevilla, (IMUS), Universidad de Sevilla, Avenida Reina Mercedes, 41012 Seville, Spain
5
CINAMIL, Department of Exact Sciences and Engineering of the Portuguese Military Academy, Rua Gomes Freire, 203, 1169-203 Lisbon, Portugal
6
ADAI, LAETA, Mechanical Engineering Department, University of Coimbra, Rua Luis Reis Santos, 3030-788 Coimbra, Portugal
7
Centro de Química Estrutural, Instituto Superior Técnico, Universidade de Lisboa, Avenida Rovisco Pais, 1049-001 Lisbon, Portugal
*
Authors to whom correspondence should be addressed.
Energies 2020, 13(22), 5864; https://doi.org/10.3390/en13225864
Submission received: 22 October 2020 / Revised: 8 November 2020 / Accepted: 9 November 2020 / Published: 10 November 2020

Abstract

:
Spray impingement on smooth and heated surfaces is a highly complex thermofluid phenomenon present in several engineering applications. The combination of phase Doppler interferometry, high-speed visualization, and time-resolved infrared thermography allows characterizing the heat transfer and fluid dynamics involved. Particular emphasis is given to the use of nanofluids in sprays due to their potential to enhance the heat transfer mechanisms. The results for low nanoparticle concentrations (up to 1 wt.%) show that the surfactant added to water, required to stabilize the nanofluids and minimize particle clustering, affects the spray’s main characteristics. Namely, the surfactant decreases the liquid surface tension leading to a larger wetted area and wettability, promoting heat transfer between the surface and the liquid film. However, since lower surface tension also tends to enhance splash near the edges of the wetted area, the gold nanospheres act to lessen such disturbances due to an increase of the solutions’ viscosity, thus increasing the heat flux removed from the spray slightly. The experimental results obtained from this work demonstrate that the maximum heat convection coefficients evaluated for the nanofluids can be 9.8% to 21.9% higher than those obtained with the base fluid and 11.5% to 38.8% higher when compared with those obtained with DI water.

1. Introduction

The dissipation of high heat loads is still a challenging task that fosters alternative cooling strategies. Spray cooling, either considering or not liquid phase change, is effective and provides high heat transfer coefficients of the order of O(105) W/(m2K) [1,2,3,4]. The heat transfer coefficient depends on the liquid and the surface properties, as well as the spray characteristics and dynamics before and after its impact [5,6].
In the last decade, an extensive body of research explored the use of nanofluids made from suspensions of nanometer-sized particles (<100 nm) for heat transfer enhancement within a broad range of technological fields. These particles include carbides, oxides, metals, and nitrides immersed in a base fluid [7] under the premise that nanoparticles improve the thermal properties of the base fluid, particularly the thermal conductivity, thus contributing to the heat transfer enhancement [8]. However, Bansal and Pyrtle [9] investigated the behavior of nanofluids for spray cooling applications, focusing on the effect of adding alumina nanoparticle to water. Additionally, their results showed that the cooling performance depended primarily on the initial temperature of the surface, meaning that enhancing heat transfer is not only caused by the effect of nanoparticles but also on the thermofluid interaction between the impinging spray and the surface.
Several recently conducted research works focused on various fields of relevant engineering applications for nanofluids [10,11,12]. Bahmani et al. [13] investigated nanoparticles’ effect on the Nusselt number and convection heat convection coefficient in a double pipe heat exchanger. Their results underlined that a rise of the nanoparticles volume fraction causes an enhancement of the outlet fluid temperature and the wall temperature. Goodarzi et al. [14] highlighted that nanofluid as a working fluid improves a heat exchanger’s thermal performance.
Reza Safaei et al. [15] analyzed the effects of nanoparticles in the antifreeze base fluid. They showed the comparison of the thermal conductivity trend of this new nanofluid with respect to that of the previously reported nanofluids. Li et al. [16] considered the thermal performance of different micro heat exchanger cooling nanoparticles with spherical carbon-acetone nanofluid.
The addition of surfactants to nanofluids exerts a stabilizing effect by mitigating the clustering of nanoparticles. However, it can also enhance heat transfer. For example, in Tiara et al. [17], the addition of the surfactant Tween 20 to an alumina nanofluid increased its thermal conductivity by 21%, leading to an enhanced cooling rate.
Concerning the best nanoparticle for enhancing heat transfer, Amini et al. [18] analyzed the behavior of a nanofluid composed of distilled water as base fluid and aluminum oxide (Al2O3) and copper oxide (CuO) as nanoparticles, and the thermal effectiveness enhancement was similar for the same concentration. However, there were better results using CuO, which is likely caused by 41% higher thermal conductivity since its thermal diffusivity is lower than Al2O3. It is an insight that provides guidelines in choosing the kind of nanoparticles for producing the nanofluid, corroborated by the work of Chakraborty et al. [19], which deepened the thermo-physical features of nanofluids for spray cooling on hot steel surfaces. Their results underlined that nanofluids enhance heat transfer during steel quenching due to the improved coolant thermal conductivity.
Overall, most of the experimental studies reviewed report a heat transfer enhancement due to the addition of nanoparticles [7,20,21,22] and numerical investigations on the topic, such as the work of Abu-Nada and Oztop [23]. However, despite this apparent overall agreement, a closer comparative analysis reveals several inconsistencies. For instance, it is not always clear whether one should quantify the nanoparticles’ concentration in volume or mass. The results mostly focus on overall heat flux values, leaving the analysis of the fluid flow and heat transfer mechanisms into a secondary plane. In fact, besides increasing the thermal properties, the addition of nanoparticles is known to increase the bulk fluid’s viscosity, which may alter the fluid flow and compromise the potential benefits for heat transfer. Therefore, using surfactants to stabilize the solution may strongly affect the bulk surface tension, and nanoparticles’ presence may influence the atomization process. Hence, the spray characteristics must be known before its impact to predict better the outcome of impingement, which will affect the heat transfer processes. The nanoparticles may also affect the local wettability during spray impingement, affecting heat transfer [24,25]. Despite the improvements in base fluids’ thermal properties, the effect on spray production is still under research.
Different optical diagnostic techniques are used and combined to characterize fluid flow and heat transfer characteristics when using these complex fluids. For instance, Kay et al. [26] combined phase Doppler interferometry with high-speed visualization since the first technique is limited when measuring close to the wall. However, a detailed analysis of the hydrodynamics vs. thermal mechanisms and their intricate relation with the nanoparticles’ concentration is still open for further research.
The present paper focuses on the role of nanoparticle concentration on atomization processes before and during impact on a heated solid surface, relating them with the various influencing parameters, including the liquid properties of the nanofluids and the wetting properties. The simultaneous use of high-speed imaging of the spray and the phase Doppler interferometer provides insights into the spray morphology and information on the atomization features, namely, drop size and velocity distributions. The characteristic size and velocity of the spray droplets allow predicting the outcome of spray impact through empirical correlations reported in the literature, which is essential to estimate the liquid mass used in the cooling process. Then, synchronized images of high-speed video and time-resolved thermography allow deepening the intricate relation between spray impact dynamics and the heat transfer processes.

2. Experimental Procedure

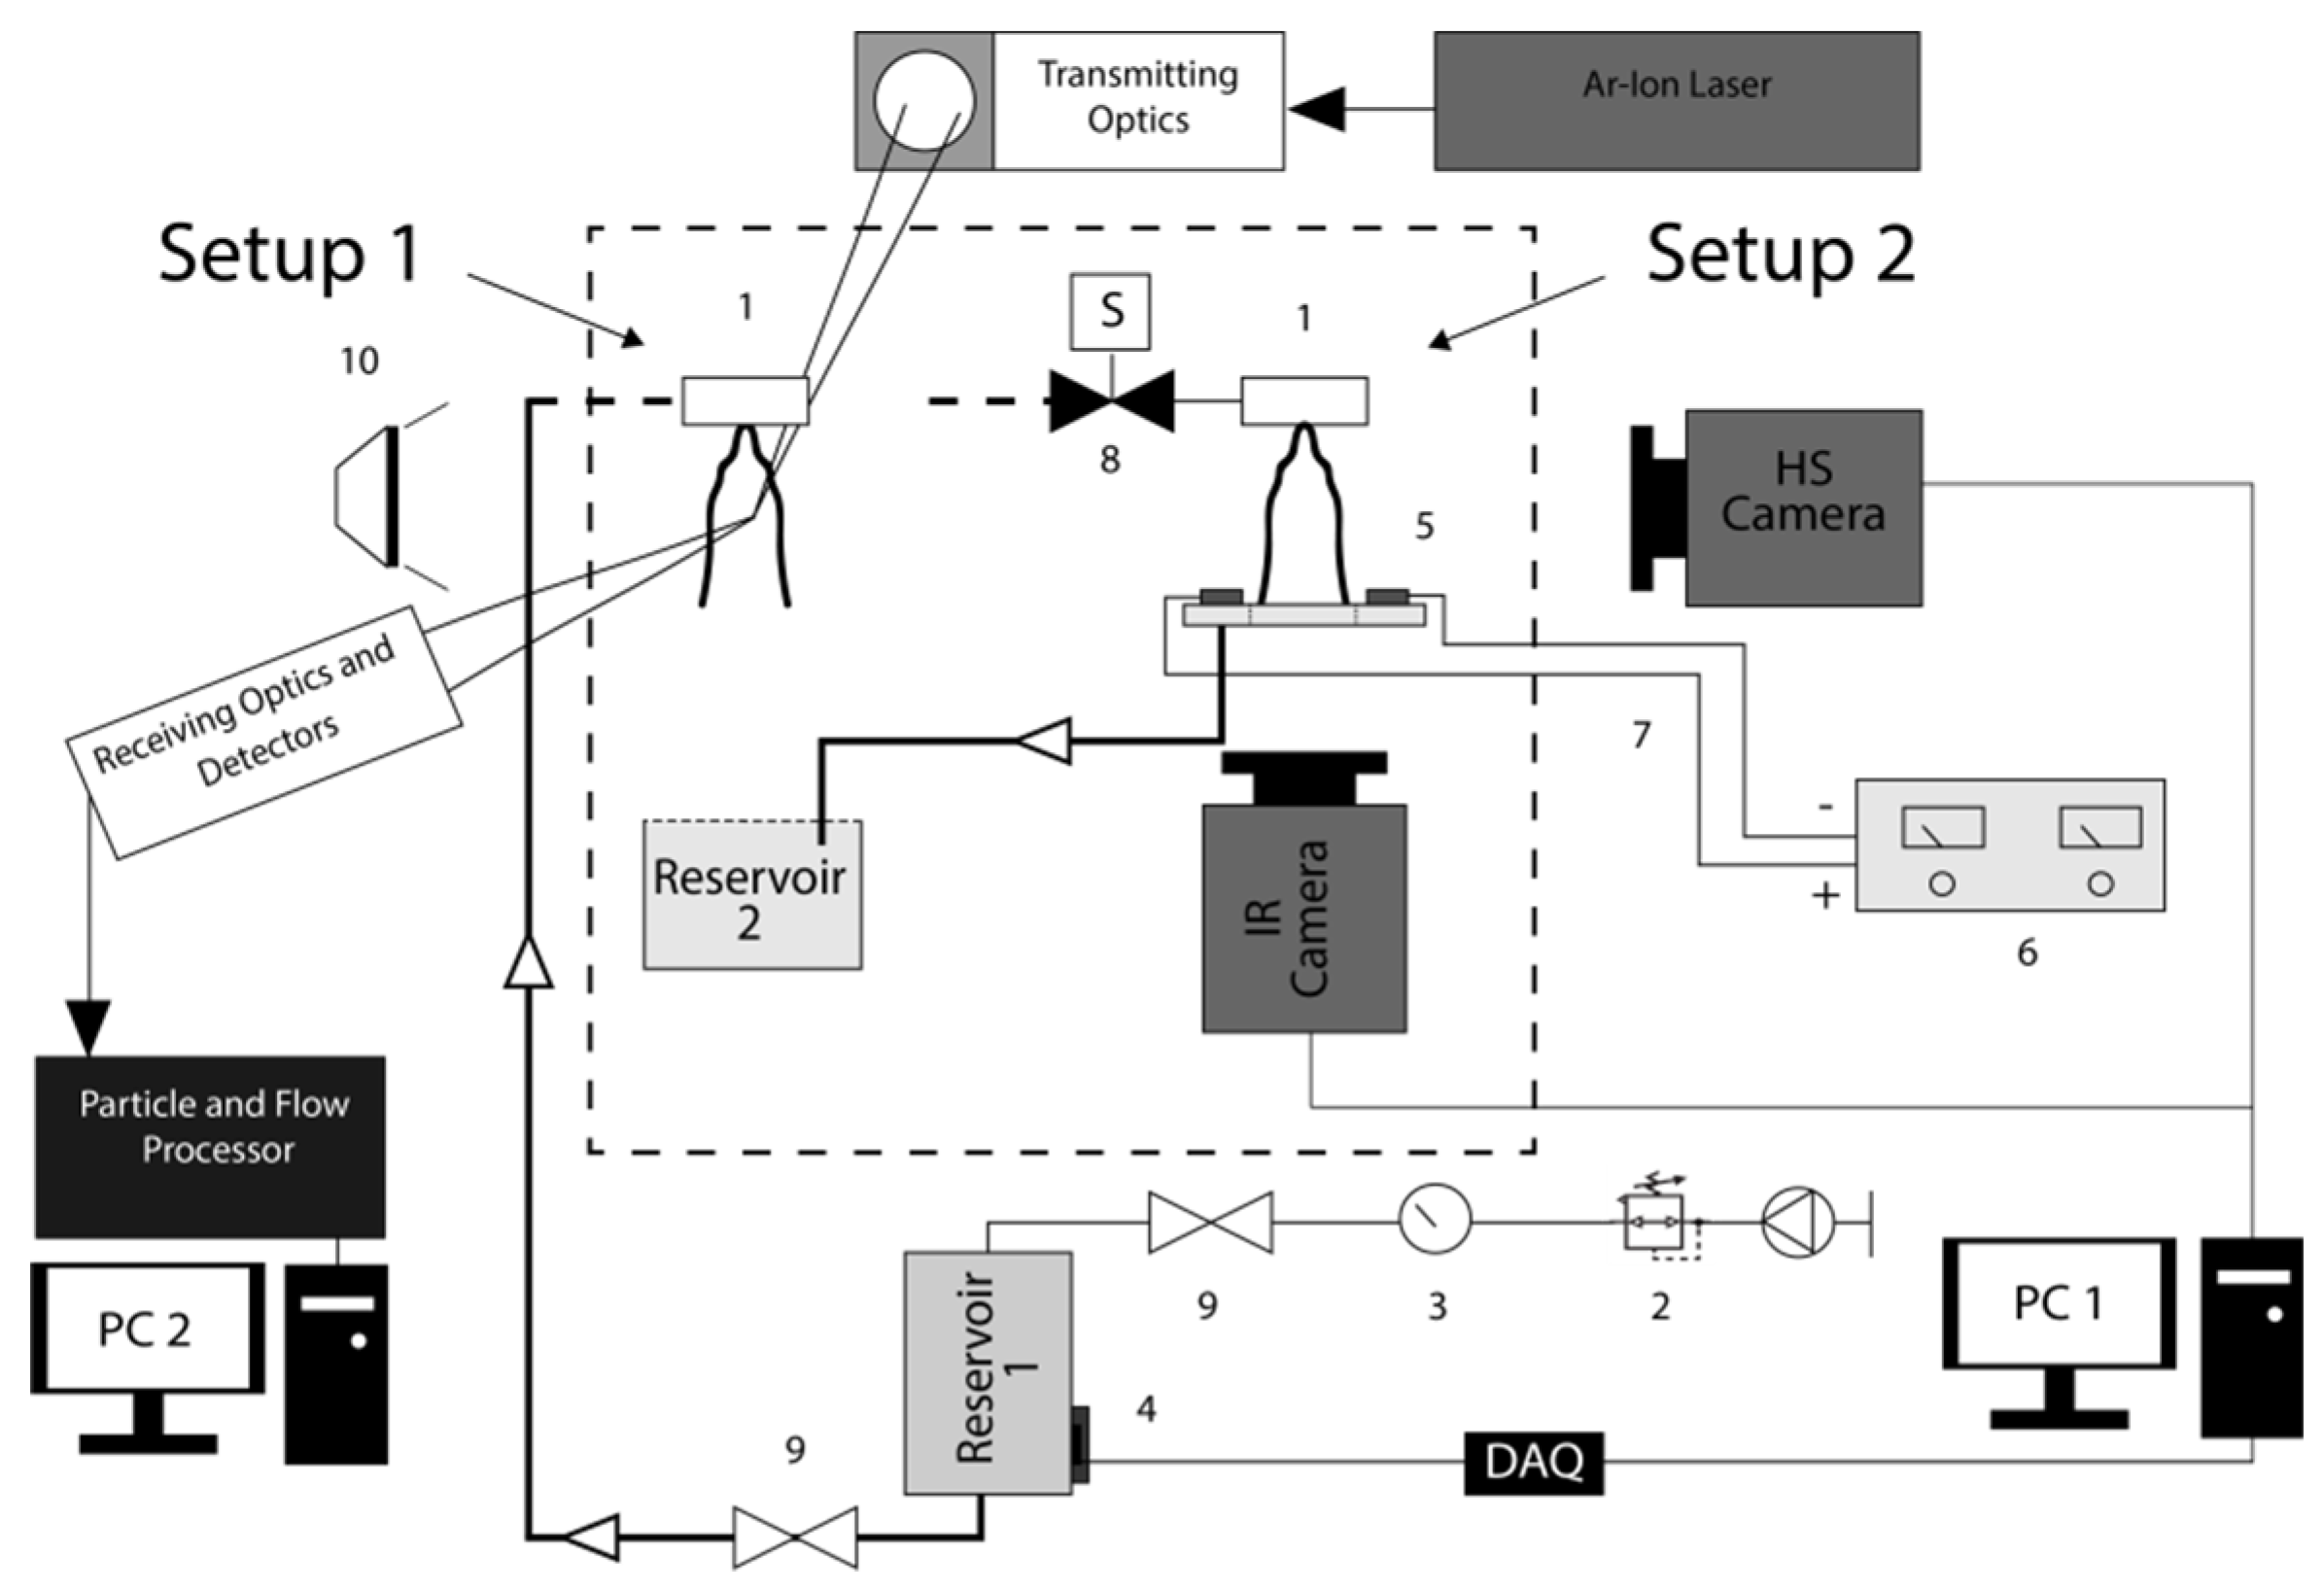
2.1. Experimental Apparatus and Working Conditions

The sketch in Figure 1 represents the experimental apparatus used in the present study. The small-size pressure-swirl atomizer (1) producing the spray has a discharge orifice of 0.42 mm in diameter and two tangential inlet ports with a square cross-section of 0.6 × 0.6 mm2. A three-stage translation unit connected to the atomizer allows its displacement in three axes. Malý et al. [27] included further and more specific details about the atomizer design. A small vessel of 3 L pressurized by air at 0.5 MPa supplies liquid to the atomizer. An IR1M Monnier compressed air regulator from Spirax Sarco maintained the pressure at 87 psi (±0.5 psi), monitored by a manometer. Additionally, a K-type thermocouple (C03-K from Omega) was mounted on the vessel and connected to a data acquisition board DT9828 from Data Translation to monitor the initial liquid temperature. The mass flow rate is of the order of 7 kg/h.
The combined high-speed visualization and (phase Doppler interferometer) PDI system characterized the spray morphology, droplet size, and velocity distributions before impact. Configuration (I) in Figure 1 identifies the experimental setup elements used for this characterization. Setting (II) delineates the features used in the characterization of the spray morphology and heat transfer processes at the impact of the spray on the heated surface.
The phase Doppler interferometer system consists of a 400 mWAr-Ion Laser from Spectra-Physics, transmitting and receiving optics connected to a BSA P80 processor from Dantec Dynamics. A high-speed camera (Phantom v4.2) mounted perpendicularly to the spray captures its morphology using extensive post-processing of images provided by contrast using a backlight LED source of 50 Watts with a diffusing glass (Figure 1, index 10). The images acquired at 13,029 fps have a resolution of 192 × 192 pixels2 and an exposure time of 10 µs. The optical configurations produced images with a minimum and maximum spatial resolution of 54.5 and 70.6 µm/pixel, respectively.
The impact surface in configuration II was a smooth thin stainless steel (AISI 304) flat plate, with a thickness of 20 μm and an impact area of 60 × 90 mm2. This sheet was fixed to a metallic frame using high-temperature silicone to reduce heat conduction losses and prevent electrical contact. After that, the bottom side of the surface was painted black and dried for 3 h. Next, two rectangular copper electrodes were soldered on opposite sides of the sheet and heated the surface through the Joule effect.
A continuous current power supply (HP 6274B DC) heated the sheet by Joule effect, as depicted in Figure 1, index 6. In configuration II, high-speed visualization of the leading spray structures is synchronized with a high-speed infrared (IR) thermographic camera (Onca-MwIR-InSb-320, from Xenics), capturing images from the bottom side of the heated surface. The bottom side painted with a black matt ensures an emissivity of 0.95, according to the manufacturer. The thickness of the painted layer is optimized to decrease the thermal resistance and measure the transient surface temperature distribution with accuracy.
Finally, a second vessel collects the working fluids after atomization (Figure 1 index Reservoir 2) for further filtration and reuse. Before and after the experimental tests, we evaluated the most relevant thermophysical properties of all the nanofluids used. Changes in these properties were negligible, which supports the argument that there were not significant particle losses in the liquid feeding system or the atomizer, in agreement with a previous study [27].

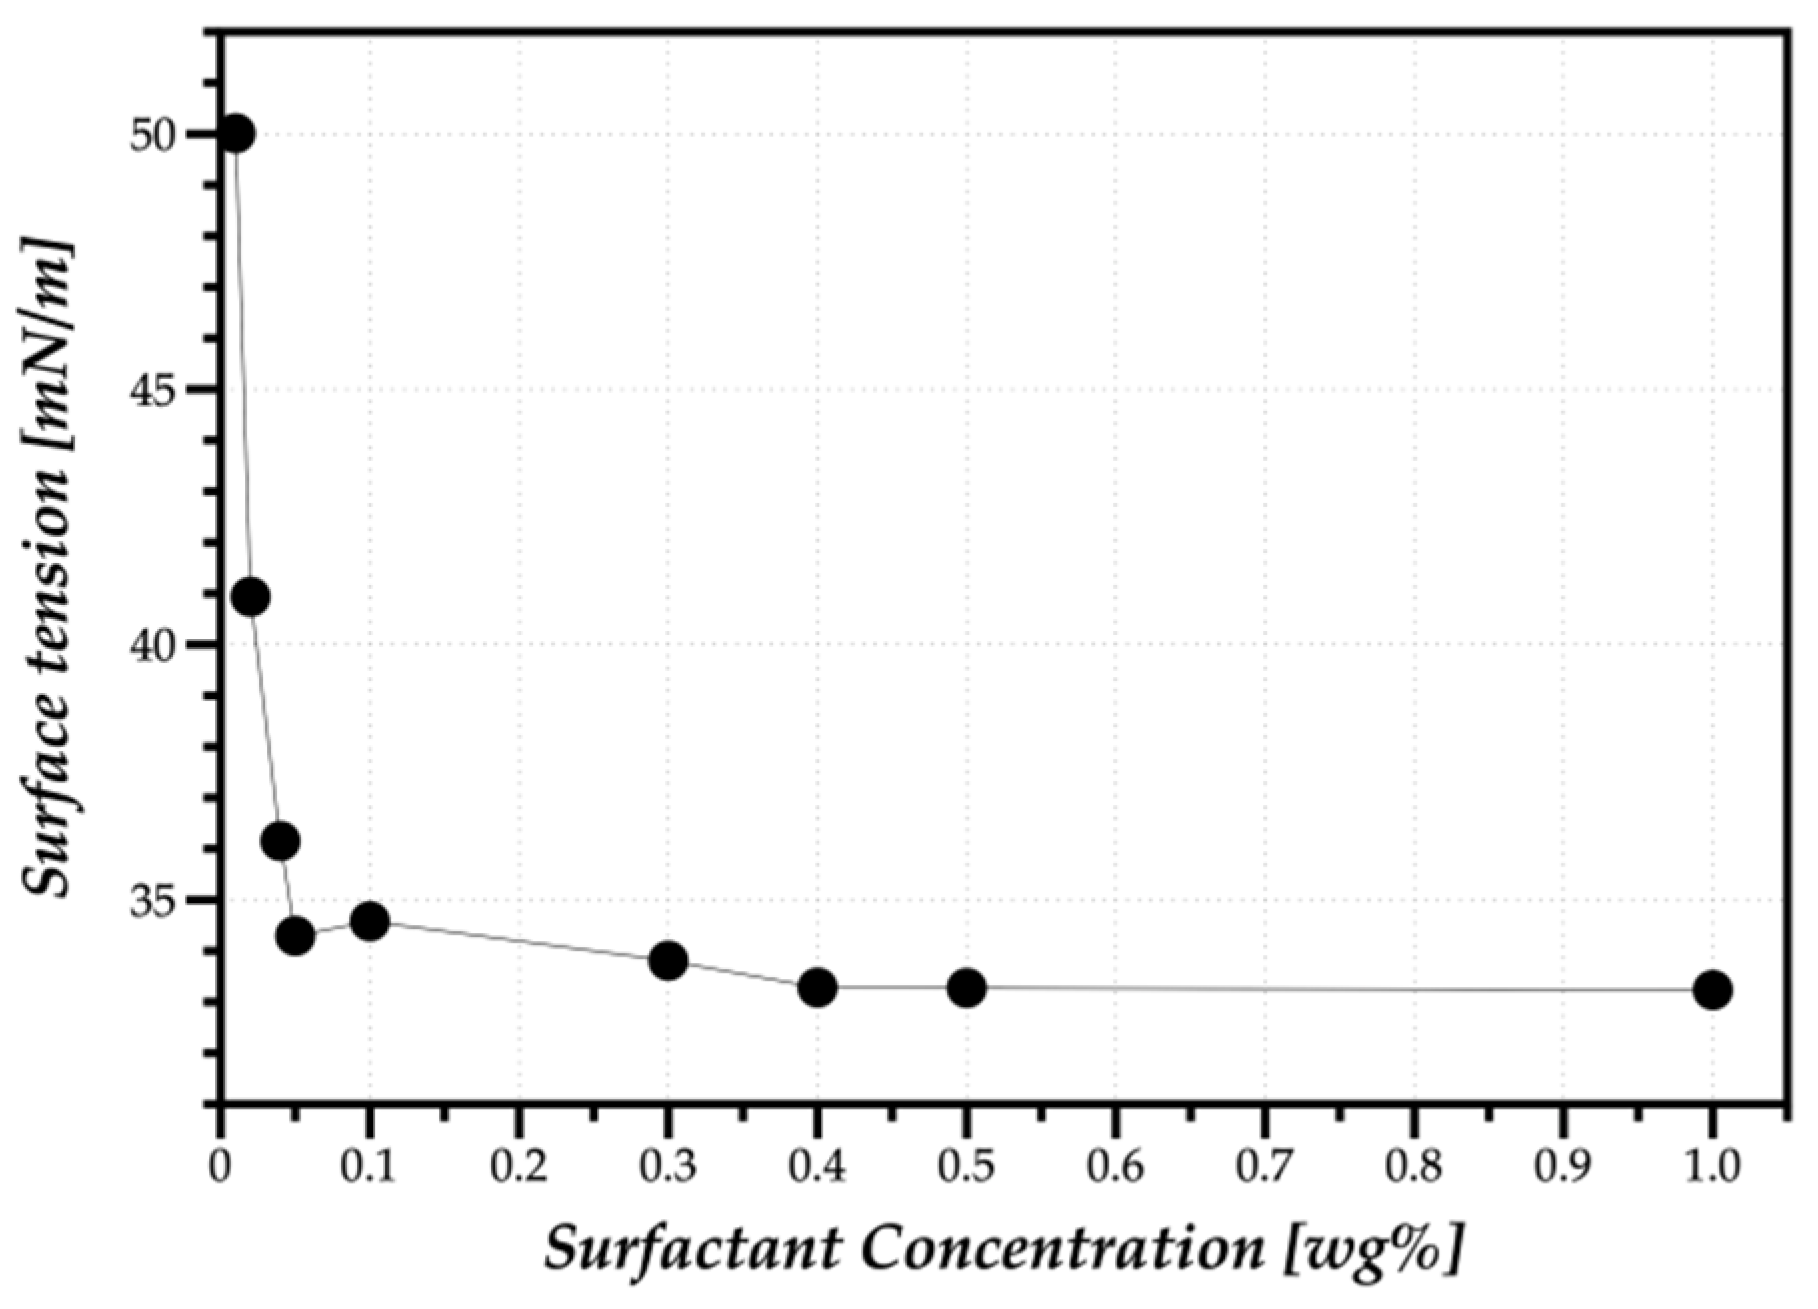
2.2. Preparation and Characterization of the Nanofluids

The Structural Chemistry Center of the Department of Chemical Engineering at Instituto Superior Técnico prepared the nanofluids, following the methodology described in Fantoni et al. [28]. Silver and gold nanoparticles with different geometries were supplied in the range of 0.1–1% in weight percentages (wt.%) and mixed with distilled water (DI Water) and surfactant (0.05 wt.% CTAB—cetyltrimethylammonium bromide). The nanoparticles consider different materials and geometries. After mixing, the nanofluids were subject to ultrasonic vibration for 20 min at an amplitude of 40% using a tip sonicator processor (UP200 Ht from Hielscher) to ensure a homogeneous and stable nanofluid. All the nanofluids used in this study showed a relatively good stability time, most of them over a week. Table 1 summarizes the main characteristics of the nanoparticles and the thermophysical properties of the nanofluids. Thermal conductivity (W/m.K), density (kg/m3), and specific heat were theoretically calculated based on the nanoparticle material and concentration, considering their bulk physical properties. Dynamic viscosity (cP)was measured by the Structural Chemistry Center of the Department of Chemical Engineering, using a rheometer (TA instruments ARI 500 ex), at ambient temperature (20 °C), with an accuracy of ±5%. Surface tension σ was measured with an optical tensiometer (THETA, Attention), using the pendant drop method, under controlled room temperatures (20 ± 3 °C). For each solution, the taken value corresponded to an average from 15 measurements. All the measurements depict mean errors lower than 0.35. A detailed description of the measurement procedures followed to measure the surface tension can be found, for instance, in [29]. To ensure nanofluids stability and minimize clustering when increasing the concentration of nanoparticles in the base fluid, it may require a higher surfactant concentration. Thus, additional analysis to infer the effect of different surfactant concentrations in DI Water on the liquid surface tension allowed establishing a working range of surfactant concentrations.
A rapid decrease in the surface tension value when the surfactant concentration increases just to 0.04 (wt.%) is evident in Figure 2. Then, surface tension values remain nearly constant up to relatively high CTAB concentrations (up to 1 wt.%). Hence, the working surfactant concentrations set in the range between 0.05% and 1% ensure the conditions mentioned above.
The refractive index is a fundamental input parameter when considering the 1st order of refraction of a particle used to evaluate the phase shift involved in measuring the droplet diameter by the phase Doppler system. Therefore, an ABBE refractometer, model 60/ED, and a Sodium D1 (yellow) light source evaluated this property for all nanofluids. The measurements were made at the controlled temperature of 20 ± 0.1 °C, using a thermostatic bath. Six values of the scale reading ( ) were taken and averaged. Finally, one calculates the refractive index n using the following equation:
n = sin ( α ) × ( N p ) 2 sin 2 ( β ) + cos ( α ) × sin ( β )
where is in degrees, α = 68.000 ° ,   β = 38.000 ° , and N p =   1.76062 is the index of the prism glass (at 20 °C), listed in the user’s manual for the type of light source used.

2.3. Characterization of the Impact Surface

The characterization of the impact surface topography and wettability considered all liquids used in the experiments. The wettability was quantified by the equilibrium contact angles, following the procedure described in [30]. The static contact angle was obtained from an average of five measurements in five different stainless-steel surface locations, using an optical tensiometer THETA (from Attention) with the sessile drop method (see Table 2). Moreover, surface topography was negligible within the vertical range of the Dektak3-Veeco profilometer used in the present work (0.02 μm).

2.4. Experimental Procedure, Measurement Techniques, and Post-Processing Methodologies

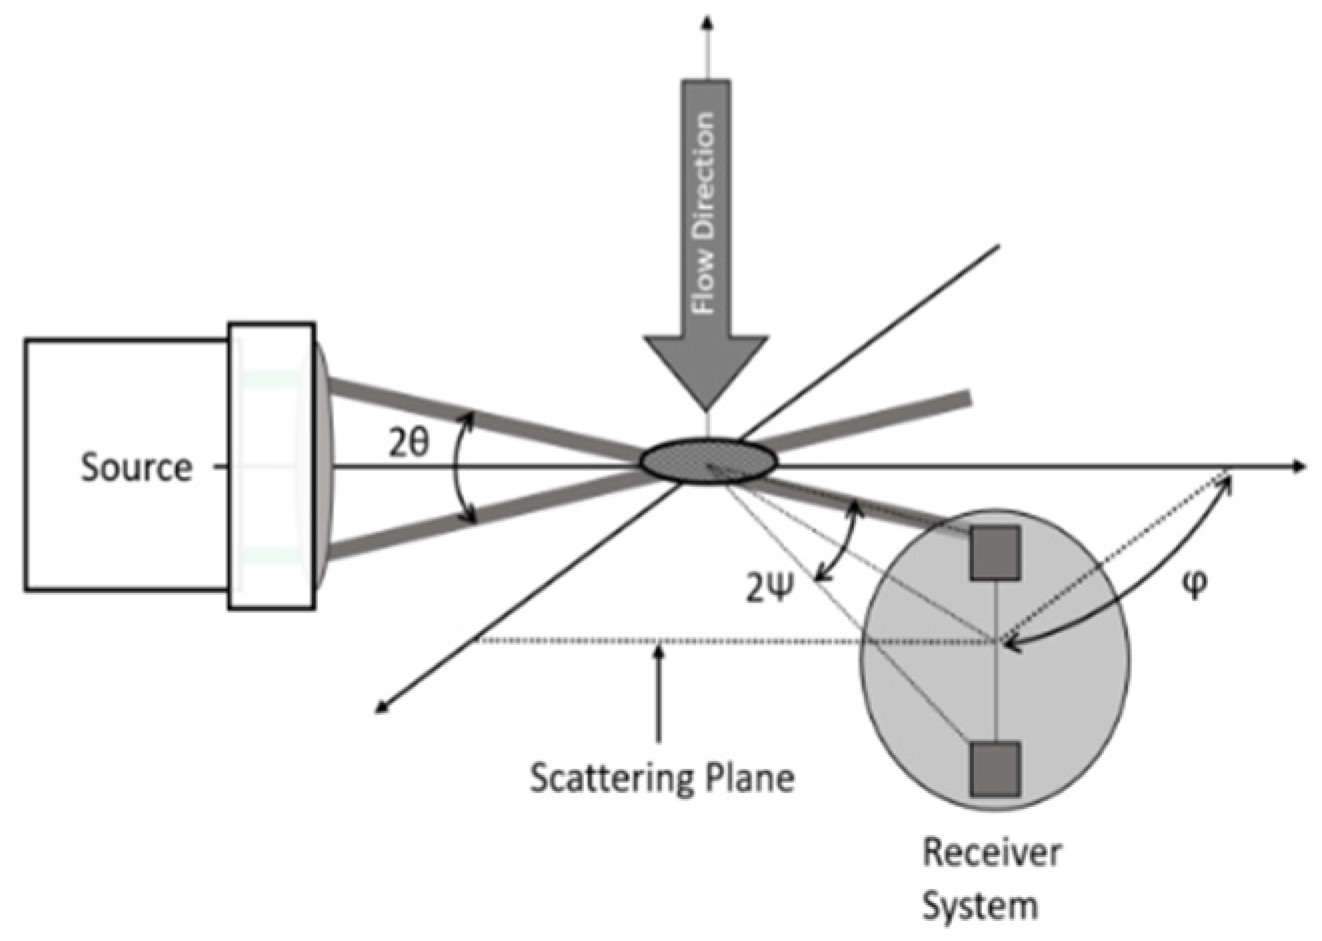
2.4.1. Phase Doppler Interferometry Measurements

The spray characterization before and during impact with the heated surface includes its morphology using high-speed imaging with a Phantom v4.2 high-speed video camera at a frame rate of 12,000 fps. These images allow evaluating the Spray Cone Angle (SCA).
A two-component PDI from Dantec Dynamics A/S (Skovlunde, Denmark) acquires droplet size and velocity information. The system consists of a 55× transmitting optics, a 57 × 10 receiving optics, and a multi-line Argon-ion laser from Spectra-Physics type 177—G0232. A Dantec Burst Signal P80 unit processes the measured signal, and the BSA flow software v5.20 controls the data acquisition parameters with the following setting: photomultiplier sensitivity ranged between 1180 and 1500 V, the signal gain at 22 dB, the velocity center is at 15 m/s with a 30 m/s span. The laser has a power of 400 mW, and the wavelengths used was 514 nm. The beam spacing was 60 mm, and the frequency shift was 40 MHz. The transmitting focal length was 310 mm. As for the receiving optics characteristics, we set the scattering angle to 69°, which is the angle that allows water measurements to be more independent from specific parameters such as the refractive index. The receiver focal length was 500 mm. The work reported here considers only the axial velocity component U since it is the relevant component applied in the empirical models used to predict the outcome of drop impact. Figure 3 depicts the PDI configuration with θ, ψ, and ϕ as the beam intersection angle, elevation angle, and scattering angle, respectively.
Figure 4 shows the measurement grid using a radial system where r = 0 mm corresponds to the spray cone center. The planes below the nozzle tip are at z = 10 mm and z = 20 mm, ensuring a fully developed spray without ligaments expected to fragment into droplets. Measurements in the Z-plane consider a range of −20 mm < r < 20 mm and −20 mm < y < 20 mm in 2 mm steps on two radially orthogonal axes. Using an information-theory approach, the accuracy in the measurement of drop sizes is lower than 2.1%, according to [31]. In the regions with lower droplets count (close to the central spray axis), the sample size was up to 5000 samples. However, the error did not overcome 1.7% despite being more sensitive to inaccuracy, which means the acquired information was enough.
The droplet size and velocity distributions were processed to obtain for each position, and nanofluid considered, the mean velocity ( u ¯ d ) of droplets and standard deviation ( u d ). Since the application for the nanofluid spray is the thermal management of surfaces, the mean diameter reported is the volume-weighted drop size distribution (d43) because the liquid volume is the relevant quantity associated with the thermofluid physical processes involved:
d 43 = i = 1 N k p v , i d k , i i = 1 N k p v , i
where Nk is the number of classes established using the Rice Rule, pv,k corresponds to the probability of class k, weighted by the volume of a droplet, and dk is the value of drop size representing each class.
Additionally, the spray size diversity is characterized in terms of the polydispersion degree using the normalized Shannon entropy (Hn), which quantifies how many different sizes are relevant in the spray [32].
H n = i = 1 N k p v , i ln ( p v , i )   ln ( N k )
where the numerator: i = 1 N k p v , i ln ( p v , i ) is the Shannon entropy, and the denominator: ln ( N k ) is the maximum Shannon entropy obtained for the uniform distribution.
Additionally, the drop size diversity has also a heterogeneity degree quantified by the volume-weighted standard deviation (SDv), which expresses how different are the relevant sizes in the spray, as:
S D v = d 53 2 d 43 2
where d53 is the second-order moment of the volume-weighted drop size distribution.

2.4.2. Heat Transfer Measurements

The characterization of the spray impingement heat transfer uses simultaneous imaging of high-speed visualization and thermography. The spray morphology images during impact and the temporal variation of the temperature distribution on the heated surface provide reliable information to understand the intricate relation between spray dynamics and the heat transfer processes. The high-speed camera recorded images at 900 fps, corresponding to 2× the high-speed thermographic camera frame rate. Image resolution depends on the impact conditions. For the images taken for the spray nozzle at z = 20 mm, the resolution is 520 × 320 pixel2 and 520 × 256 pixel2, for z = 10 mm. In both cases, the spatial resolution resulted in 64.5 μm/pixel. On the other hand, the thermographic images taken at 495 fps have a resolution of 230 × 250 pixel2 using an integration time of 200 μs. The size of the pixel in the thermographic camera is 222 μm/pixel.
The conversion from Analog-Digital Units to temperatures in Celsius followed a calibration procedure. One reduces the noise in the images by subtracting the background and applying a filter to uniformize the temperature. The calibration is considered a pixel by pixel approach. Teodori et al. [33] contain a detailed description of the calibration and post-processing procedures followed in the thermographic data reduction.
The surface heating by Joule effect considers the currents of I = 9 A and 15 A, which resulted in the imposed heat fluxes of 855 and 2375 W/m2, respectively. The initial surface temperature obtained from the imposed heat fluxes was Twall,0 = 74 °C, and Twall,0 = 145 °C, respectively. It is worth mentioning that this heat flux is calculated for the entire heated surface area, thus being an average value, as detailed in Pontes et al. [34]. Hence local heat transfer, q w , was obtained by an energy balance at the top of the impinged surface, using cylindrical coordinates and considering axisymmetric:
q w = q 0 + κ h δ ( 2 T r 2 ) ρ h c p , h δ T t
where q 0 is the heat source term (from Joule effect) for the projected area, κ h is the heater thermal conductivity, c p , h is the heater’s specific heat capacity, ρ is the density of the heater material, δ is the foil thickness, and q w is the heat flux from the heater to the liquid.
As referred to in Teodori et al. [33], the surface’s bottom side is assumed to have a negligible temperature difference between the upper and bottom sides. It is worth mentioning that the energy balance performed here is an adaptation from a pool boiling situation. The evaluation of heat losses considers an energy balance to the heated surface (in the absence of spray impact), estimated to be of the order of 10%. Additionally, the heat convection coefficient follows Newton’s law, h = q w / ( T T f   ) with a fluid temperature of Tf = 20 °C.

2.4.3. Synchronized High-Speed Video and Thermographic Imaging

The experiments performed to characterize the dynamic and heat transfer mechanisms used the synchronized images from the high-speed video and thermographic cameras. The experimental procedure was to impose the heat flux on the stainless-steel sheet and wait for the surface temperature stabilization. A solenoid actuated the spray right after the signal to start recording the video and thermographic cameras. When the surface is cooled down, both cameras stopped recording, and one turns off the imposed power. The surface is cleaned with pure acetone (99% purity), DI water, and blow-dried. This procedure was repeated at least three times for each different working condition to assure repeatability.

2.4.4. Measurement Uncertainties

Besides the uncertainties associated with the surface and liquids properties and those related to the phase Doppler measurements, discussed in the previous subsections, other relevant uncertainties involve the wetted area evaluation, heat fluxes, and temperatures taken from the thermographic images. The thermographic camera has a high sensitivity of 17 mK, and the overall calibration is described in Teodori et al. [33]. The experimental data uncertainties from the thermographic recordings, calculated according to [33], are
δ T m a x ; m i n = Δ T m a x ; m i n 2 8
Thus, the absolute error is given as:
E m a x ; m i n = δ T m a x ; m i n T m i n ; m a x
From the tested conditions, the absolute errors obtained for the fluxes were 0.55 and 0.23 °C, and 855 and 2375 W/m2 for the imposed fluxes, respectively.

3. Results and Discussion

The results depicted and discussed in this section focus on the detailed description of the thermal and fluid dynamics processes occurring at spray impingement on a heated wall, emphasizing the potential effects of the addition of nanoparticles. Hence, the first part of the results discusses the spray dynamics (droplet size and velocity distribution) before impact and how the addition of the surfactant and nanoparticles affects the spray characteristics. Knowing the spray characteristics, synchronized high-speed images, and time-resolved infrared thermography allows describing the effective thermal behavior of the impinging spray, taking into account its characteristics, as discussed in the previous section.

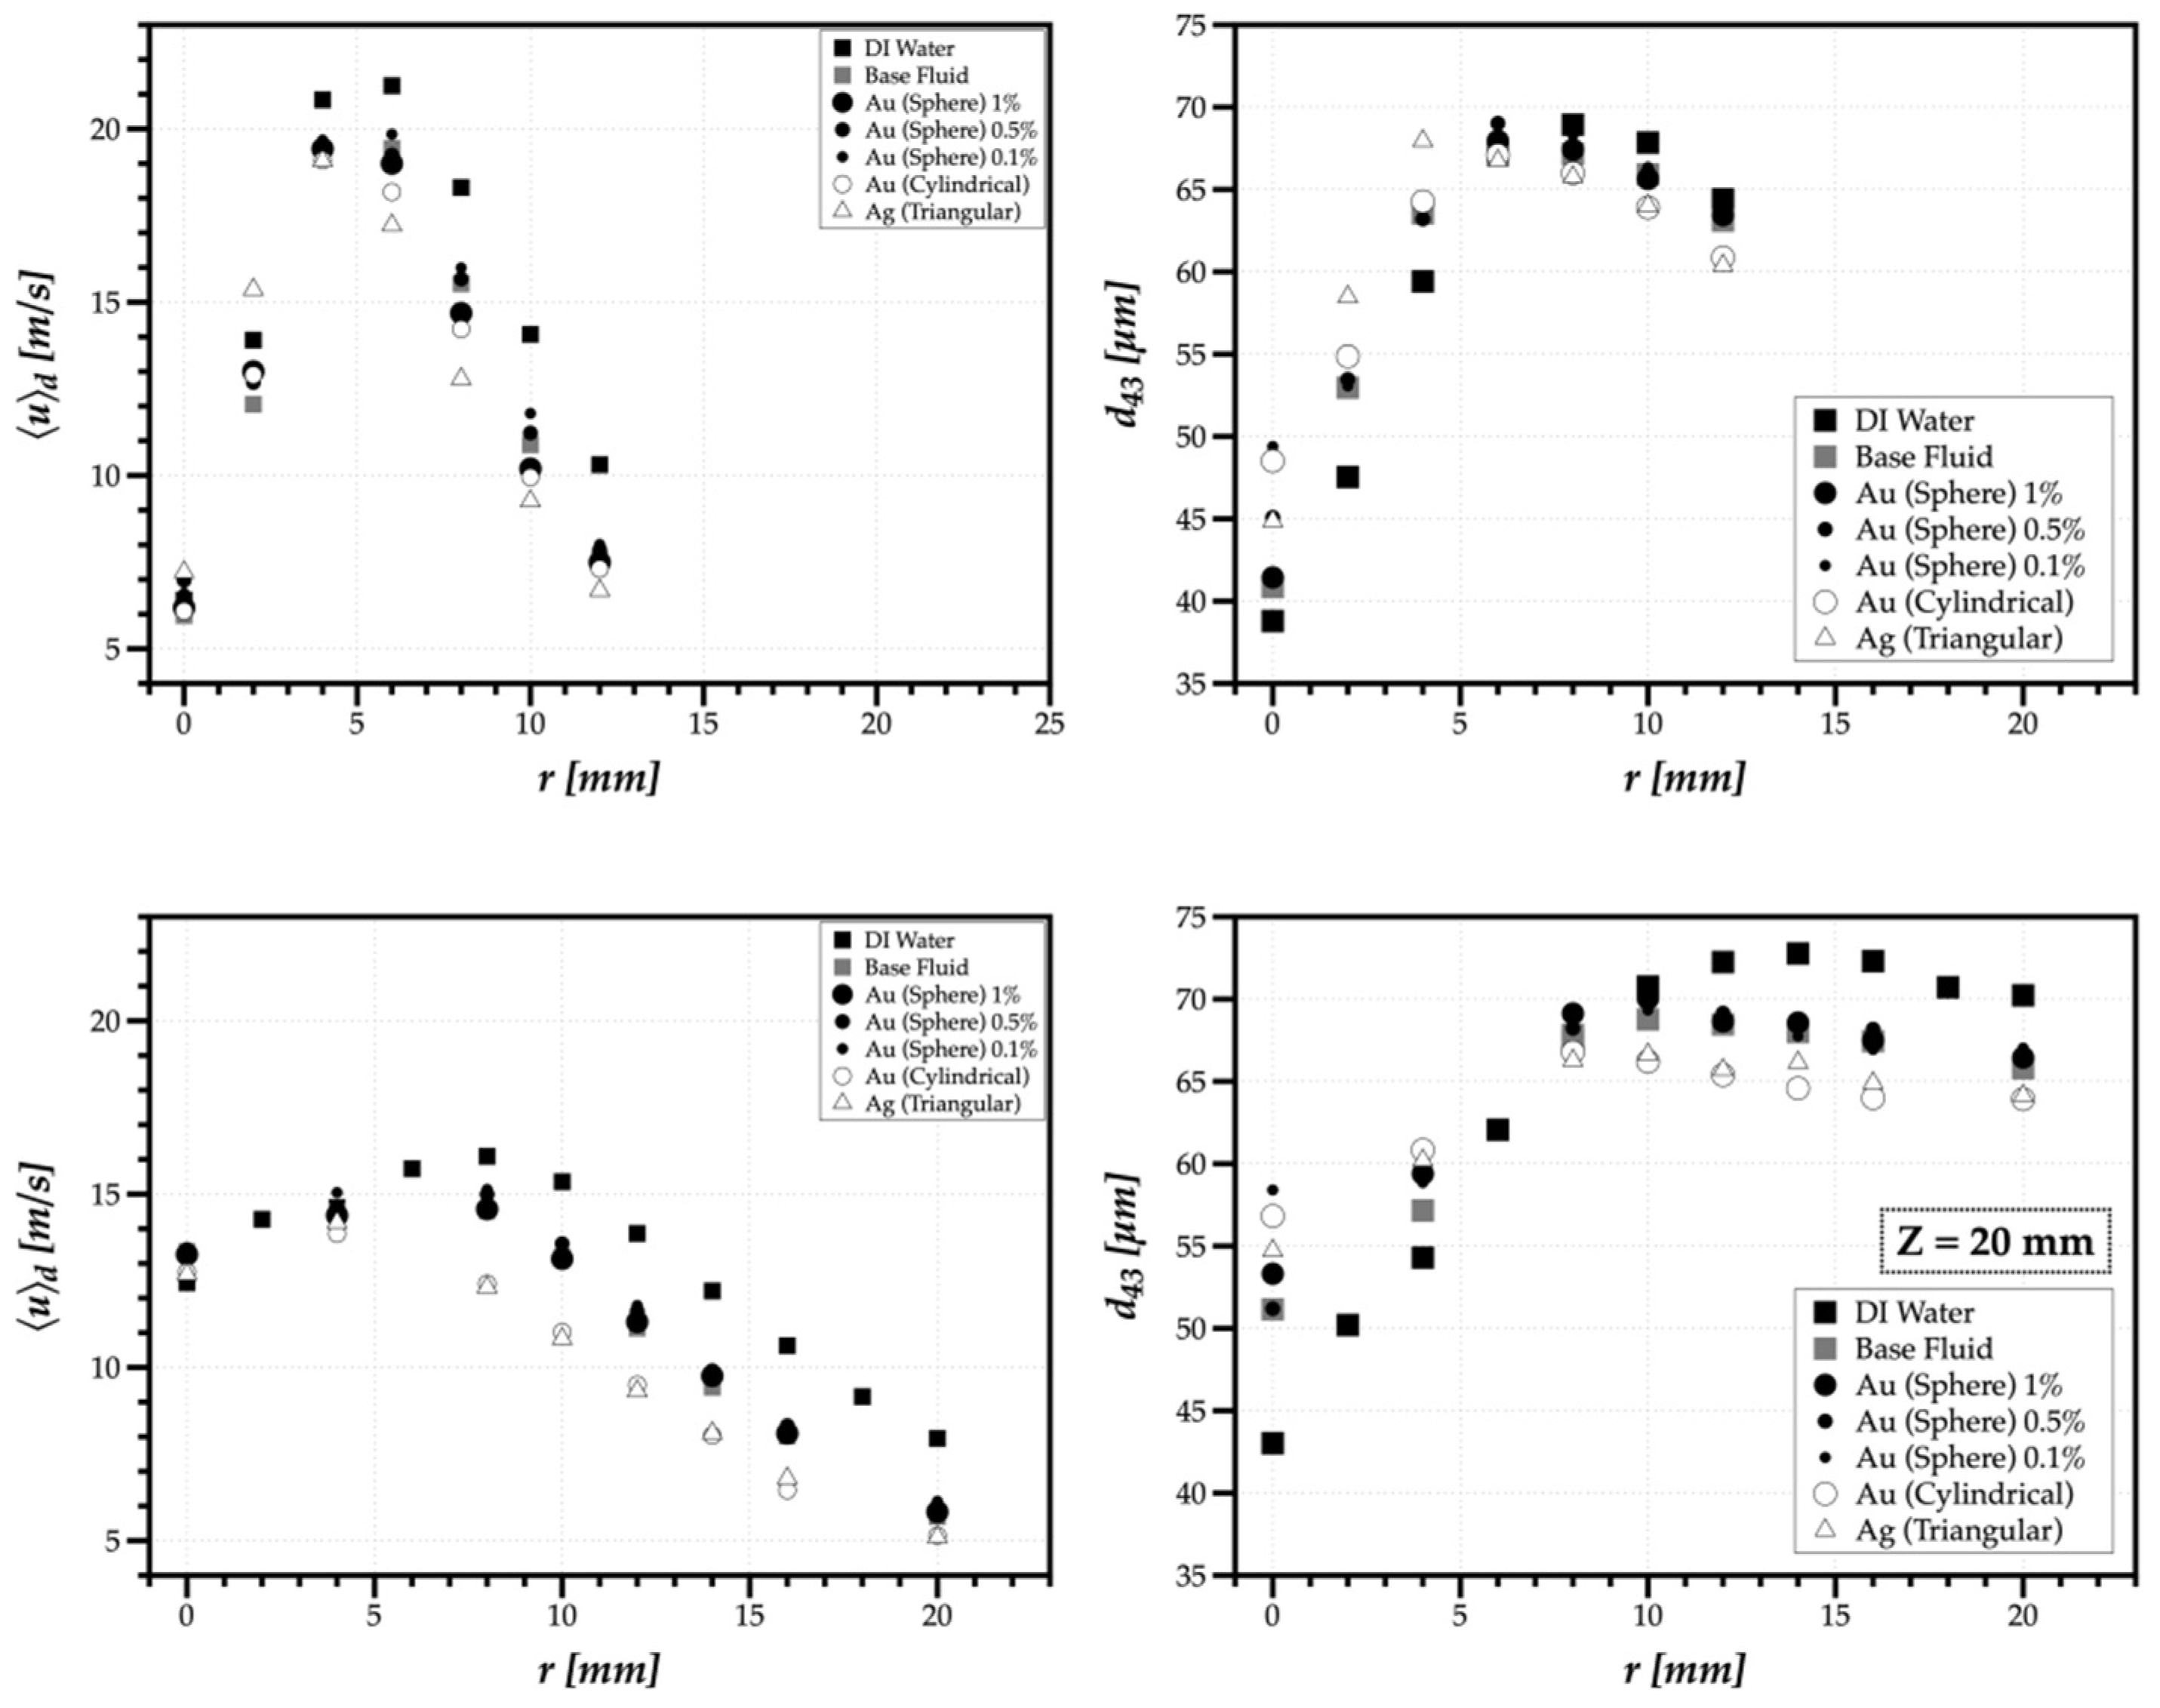
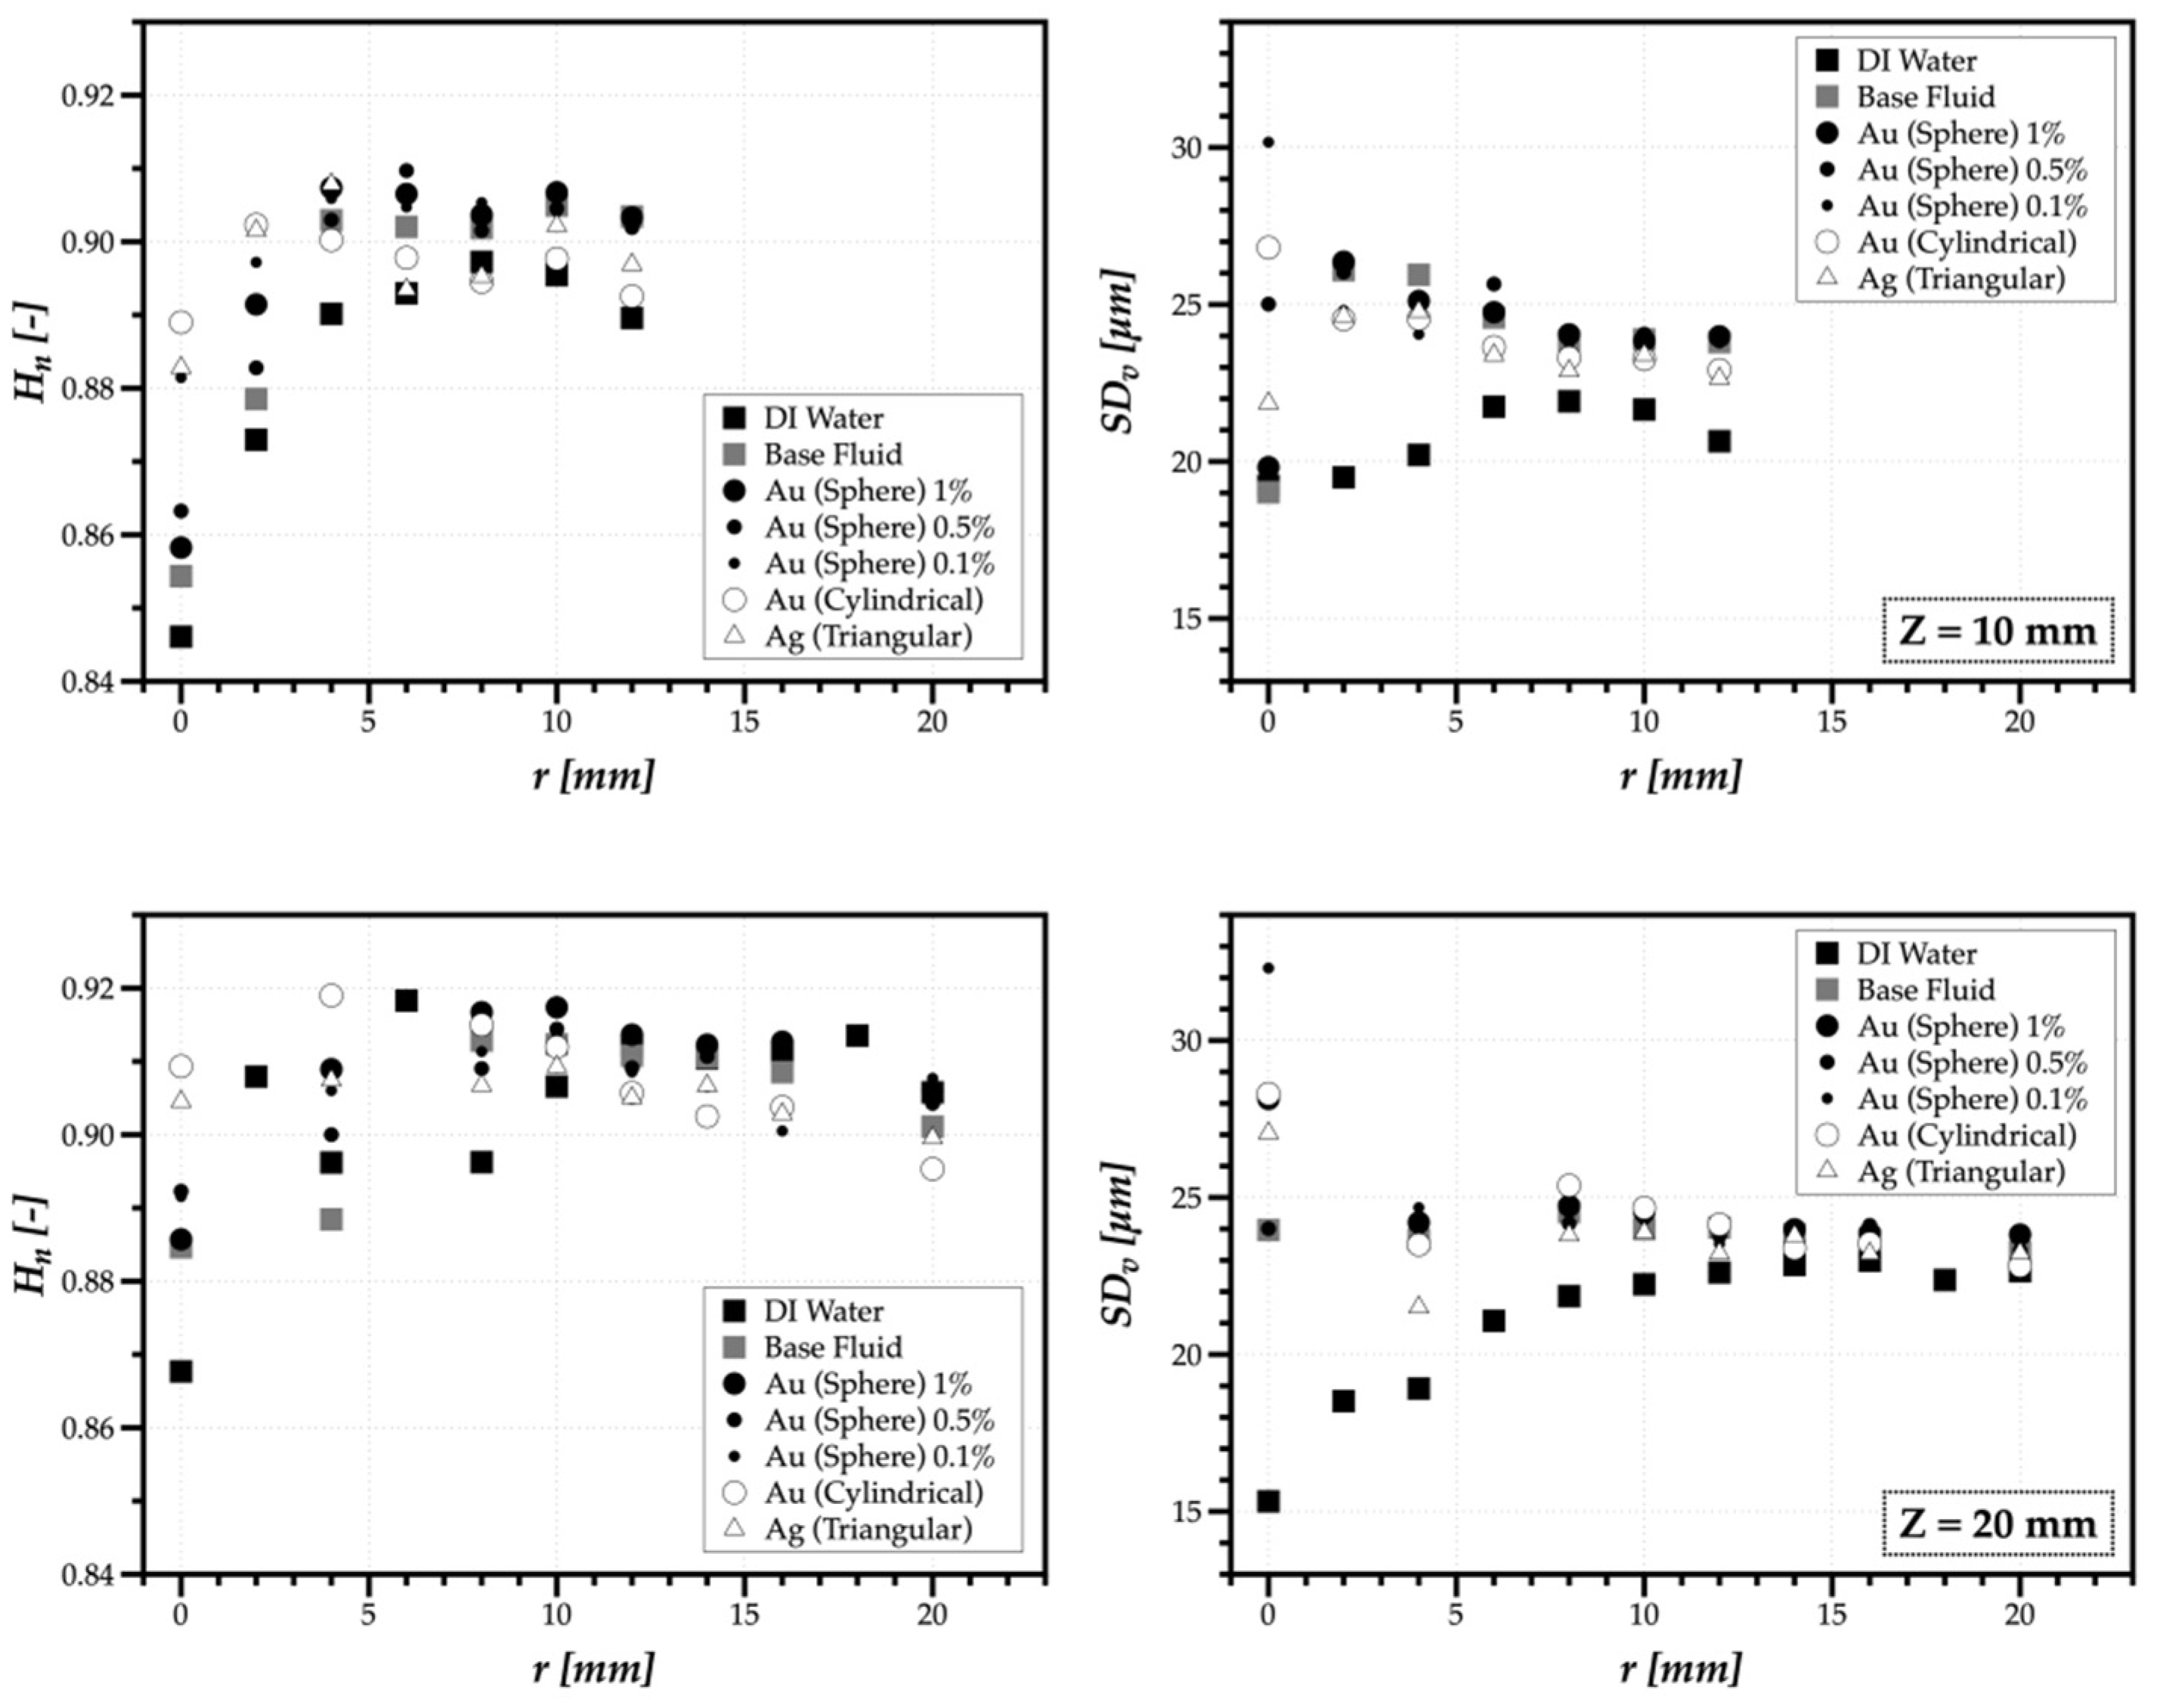
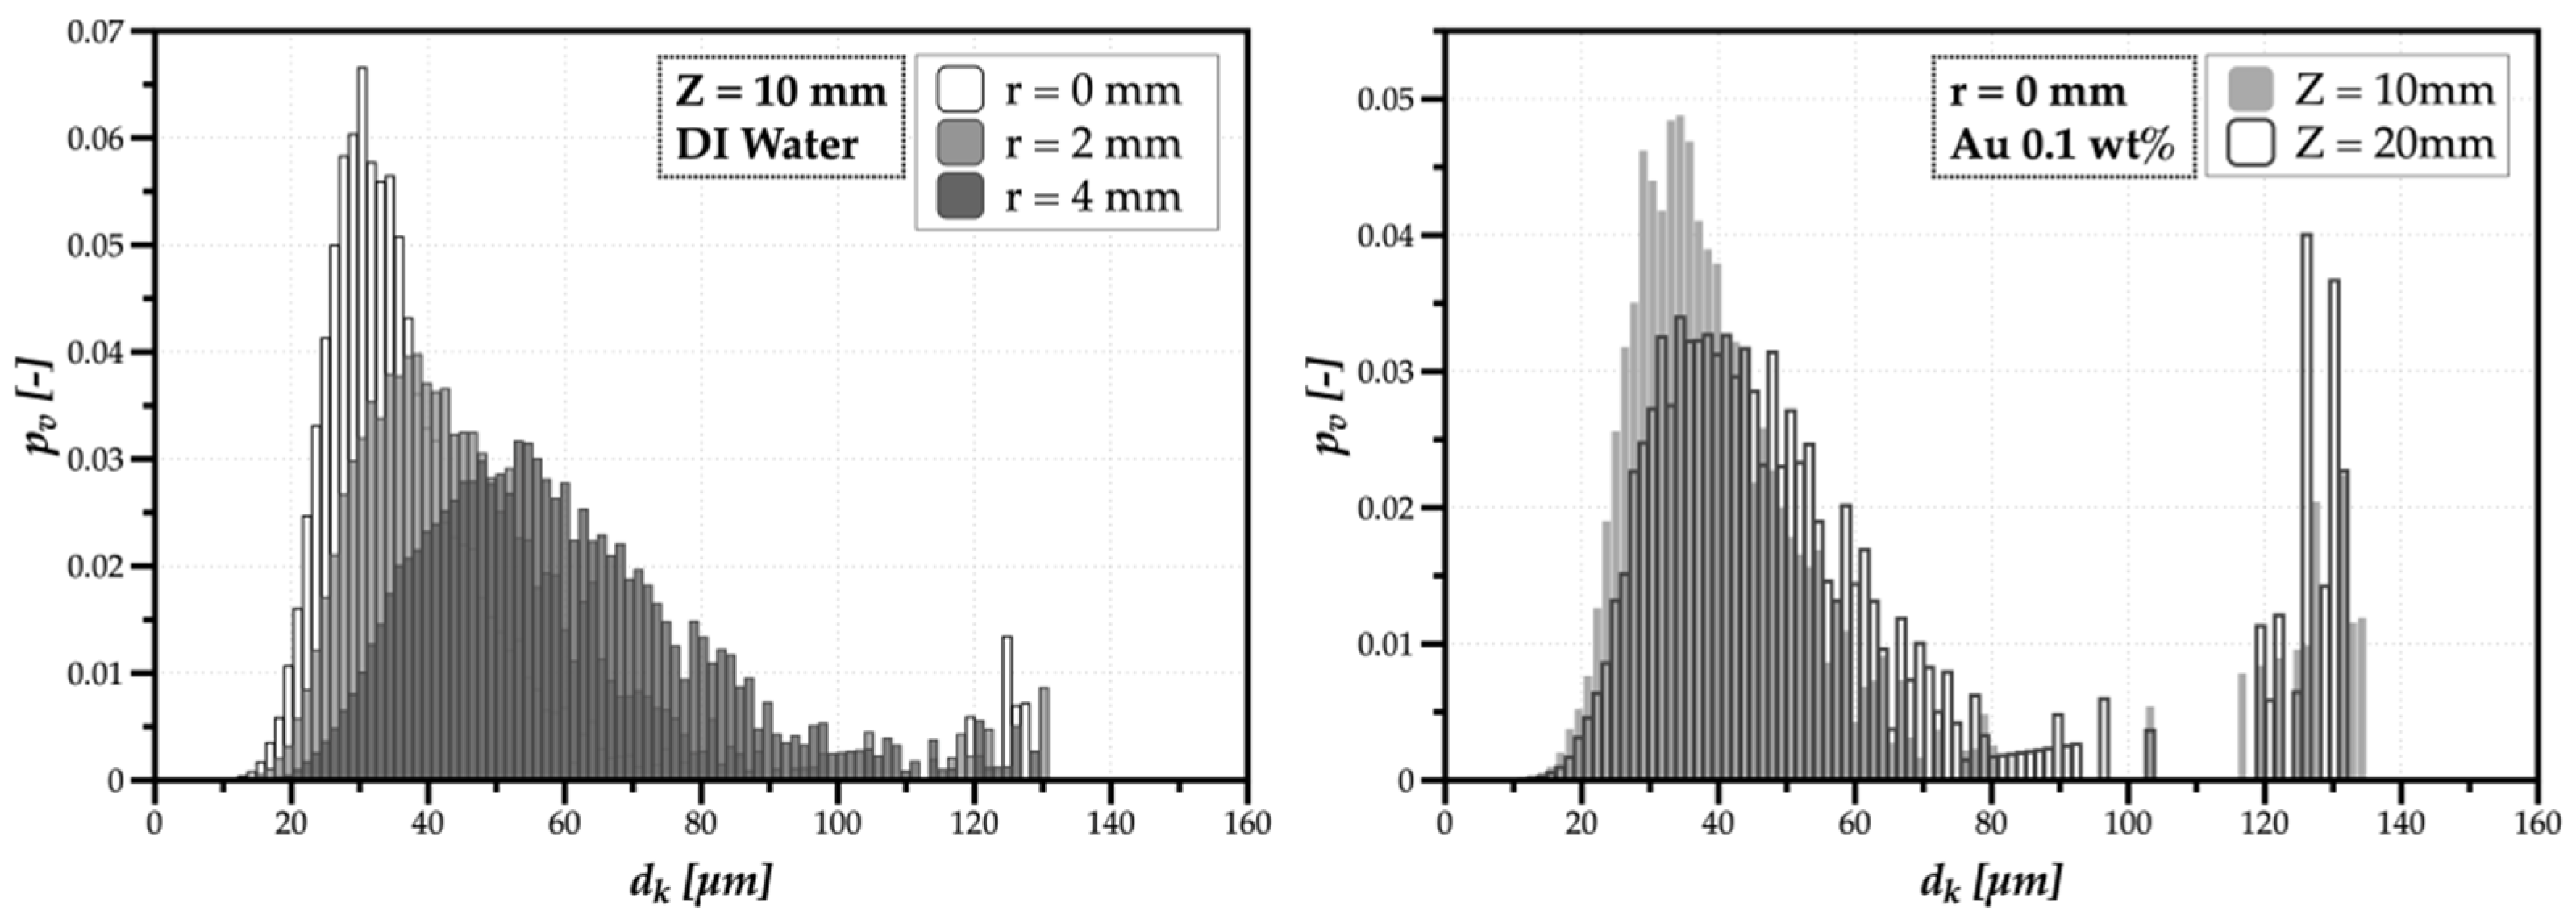
3.1. Effect of the Nanoparticles on the Spray Dynamics (before Impact)

The effect of adding the surfactant CTAB is significantly lowering the surface tension of the base fluid. The other thermophysical properties of the solutions are similar despite the addition of nanoparticles. An exception is the increase of 13% in the viscosity for solutions with the highest concentration of gold nanoparticles, and this increase is linear with the nanospheres particle concentration. This result agrees with that reported in other studies, such as Lee et al. [35] and Gupta et al. [36]. In both studies, the authors suggest that the nanoparticles’ size and geometry play an essential role in the nanofluid thermophysical properties, namely in the dynamic viscosity. When comparing the results obtained for the highest concentration of gold nanoparticles with the lowest, one can confirm that the cylindrical nanoparticles, although smaller in size, induce a more significant increase in the dynamic viscosity than the gold nanospheres.
The spray morphology for the various nanofluids, observed based on high-speed visualization, is similar, except for a thinner sheet (or initial jet) occurring due to the lower surface tension resulting from the addition of the surfactant, in agreement with the observations reported by Sijs et al. [37].
The liquid sheet breakup occurs at 5–7 mm from the atomizer exit, independently of the fluid used. The effect of the concentration of nanoparticles on the Spray Cone Angle (SCA) was negligible, with the SCA equal to 73.6° ± 1%. A mild increase in the spray cone angle observed for the case with a higher concentration of nanoparticles can be attributed to a higher dissipation of energy during the interaction with air due to the slightly larger viscosity of these nanofluid suspensions.
Hence, the main effect is the addition of surfactant, which alters the surface tension and affects atomization processes. Furthermore, although nanoparticles do not change the nanofluids’ bulk properties, for the cases considered here, particles’ motion and distribution may locally affect liquid properties (and eventually wettability, as discussed later when analyzing the results of spray impact.
Before impact, the spray characteristics are also essential to investigate and characterize the intricate relation between spray dynamics and the heat transfer processes in spray cooling. In this section, the results presented consist of the mean quantities useful to show elementary effects and used in the empirical models for predicting the outcome of impact. Figure 5 depicts the mean velocity of droplets and the mean diameter of a volume-weighted drop size distribution for the planes Z = 10, 20 (mm).
The results in Figure 5 are consistent with those previously reported in [27] using a similar atomizer. The smaller mean diameter in the central region (r = 0 mm) indicates the presence of more droplets of smaller sizes, transported by aerodynamic effects. At the z = 10 mm plane, the values are similar for all cases considered. Only at z = 20 mm, after ∆z = 10 mm of particle–fluid interaction, do the results begin to express the effect each nanofluid exerts in the spray dynamic characteristics. Namely, the maximum mean velocity value shifts to the central region of the spray with a slightly lower value. Additionally, after the location where faster droplets are present, the variation of u d with r remains similar. Noteworthy are the differences between DI Water and the base fluid (water and CTAB) and the nanofluids’ results with gold nanospheres from other shapes.
The main difference in the liquid atomization occurs when adding the surfactant, an essential element that ensures an adequate mixing of nanoparticles within the liquid. Relative to the mean diameter, the presence of nanoparticles has a negligible influence over the outcome of atomization. The variations of d43 at r = 0 mm are likely to result from particle–fluid transport phenomena. This result is positive since one of the downsides of using nanoparticles is the undesired modification of the fluid dynamic characteristics of flows due to increased viscosity. This effect is practically unnoticed, particularly in the region where the spray is fully developed, in which surface tension effects mostly dominate the dynamic spray characteristics [20]. It remains unclear why the cylindrical and triangular shapes of the nanoparticles intensify their interaction with the surrounding environment to the point of leading to an average decrease of 32% in the mean velocity of droplets.
Figure 6 reports the results associated with the spray drop size diversity considering the number of different and relevant sizes in the spray (polydispersion degree) and how different are the relevant sizes in the spray (heterogeneity degree). To interpret the meaning of each degree, consider two examples. The first is the increase of polydispersed size in all fluids at Z = 10 mm between r = 0 mm and r = 4 mm.
The example in Figure 7 (left) corresponds to DI water. The distribution represented is the volume-weighted probability size distribution. The fact that probability values decrease from the position at r = 0–4 mm means that more and different sizes acquired more relevancy in the spray. The size distributions on the right of Figure 7 correspond to the results with the largest heterogeneity degree for the nanofluid with 0.1 wt.% of gold nanospheres at r = 0 mm and both Z measurement planes.
The cluster of larger droplets in this position has similar probability values relative to the main cluster of droplets in the spray of smaller sizes. The higher the “distance” between relevant size clusters, the higher is the size dispersion, as evidenced by the SDv parameter.
The changes observed in the size dispersion of nanofluids at Z = 10 and 20 mm could be an effect attributed to the surfactant. The behavioral change in the SDv profile suggests that adding the surfactant to avoid agglomerations of nanoparticles in the nanofluid affects the particle–fluid interaction. Namely, the cluster of larger droplets shown in Figure 7(right) becomes relevant, particularly in the region r ≤ 8 mm.
Despite the variability of the polydispersion degree, Hn expressed that the values and variation with the radial position do not seem significantly affected by adding the surfactant and the nanoparticles. It means one does not expect the particle–fluid interaction that is structuring the spray and distributing droplets during spray penetration in the surrounding environment will change the spray footprint upon impact on a surface.

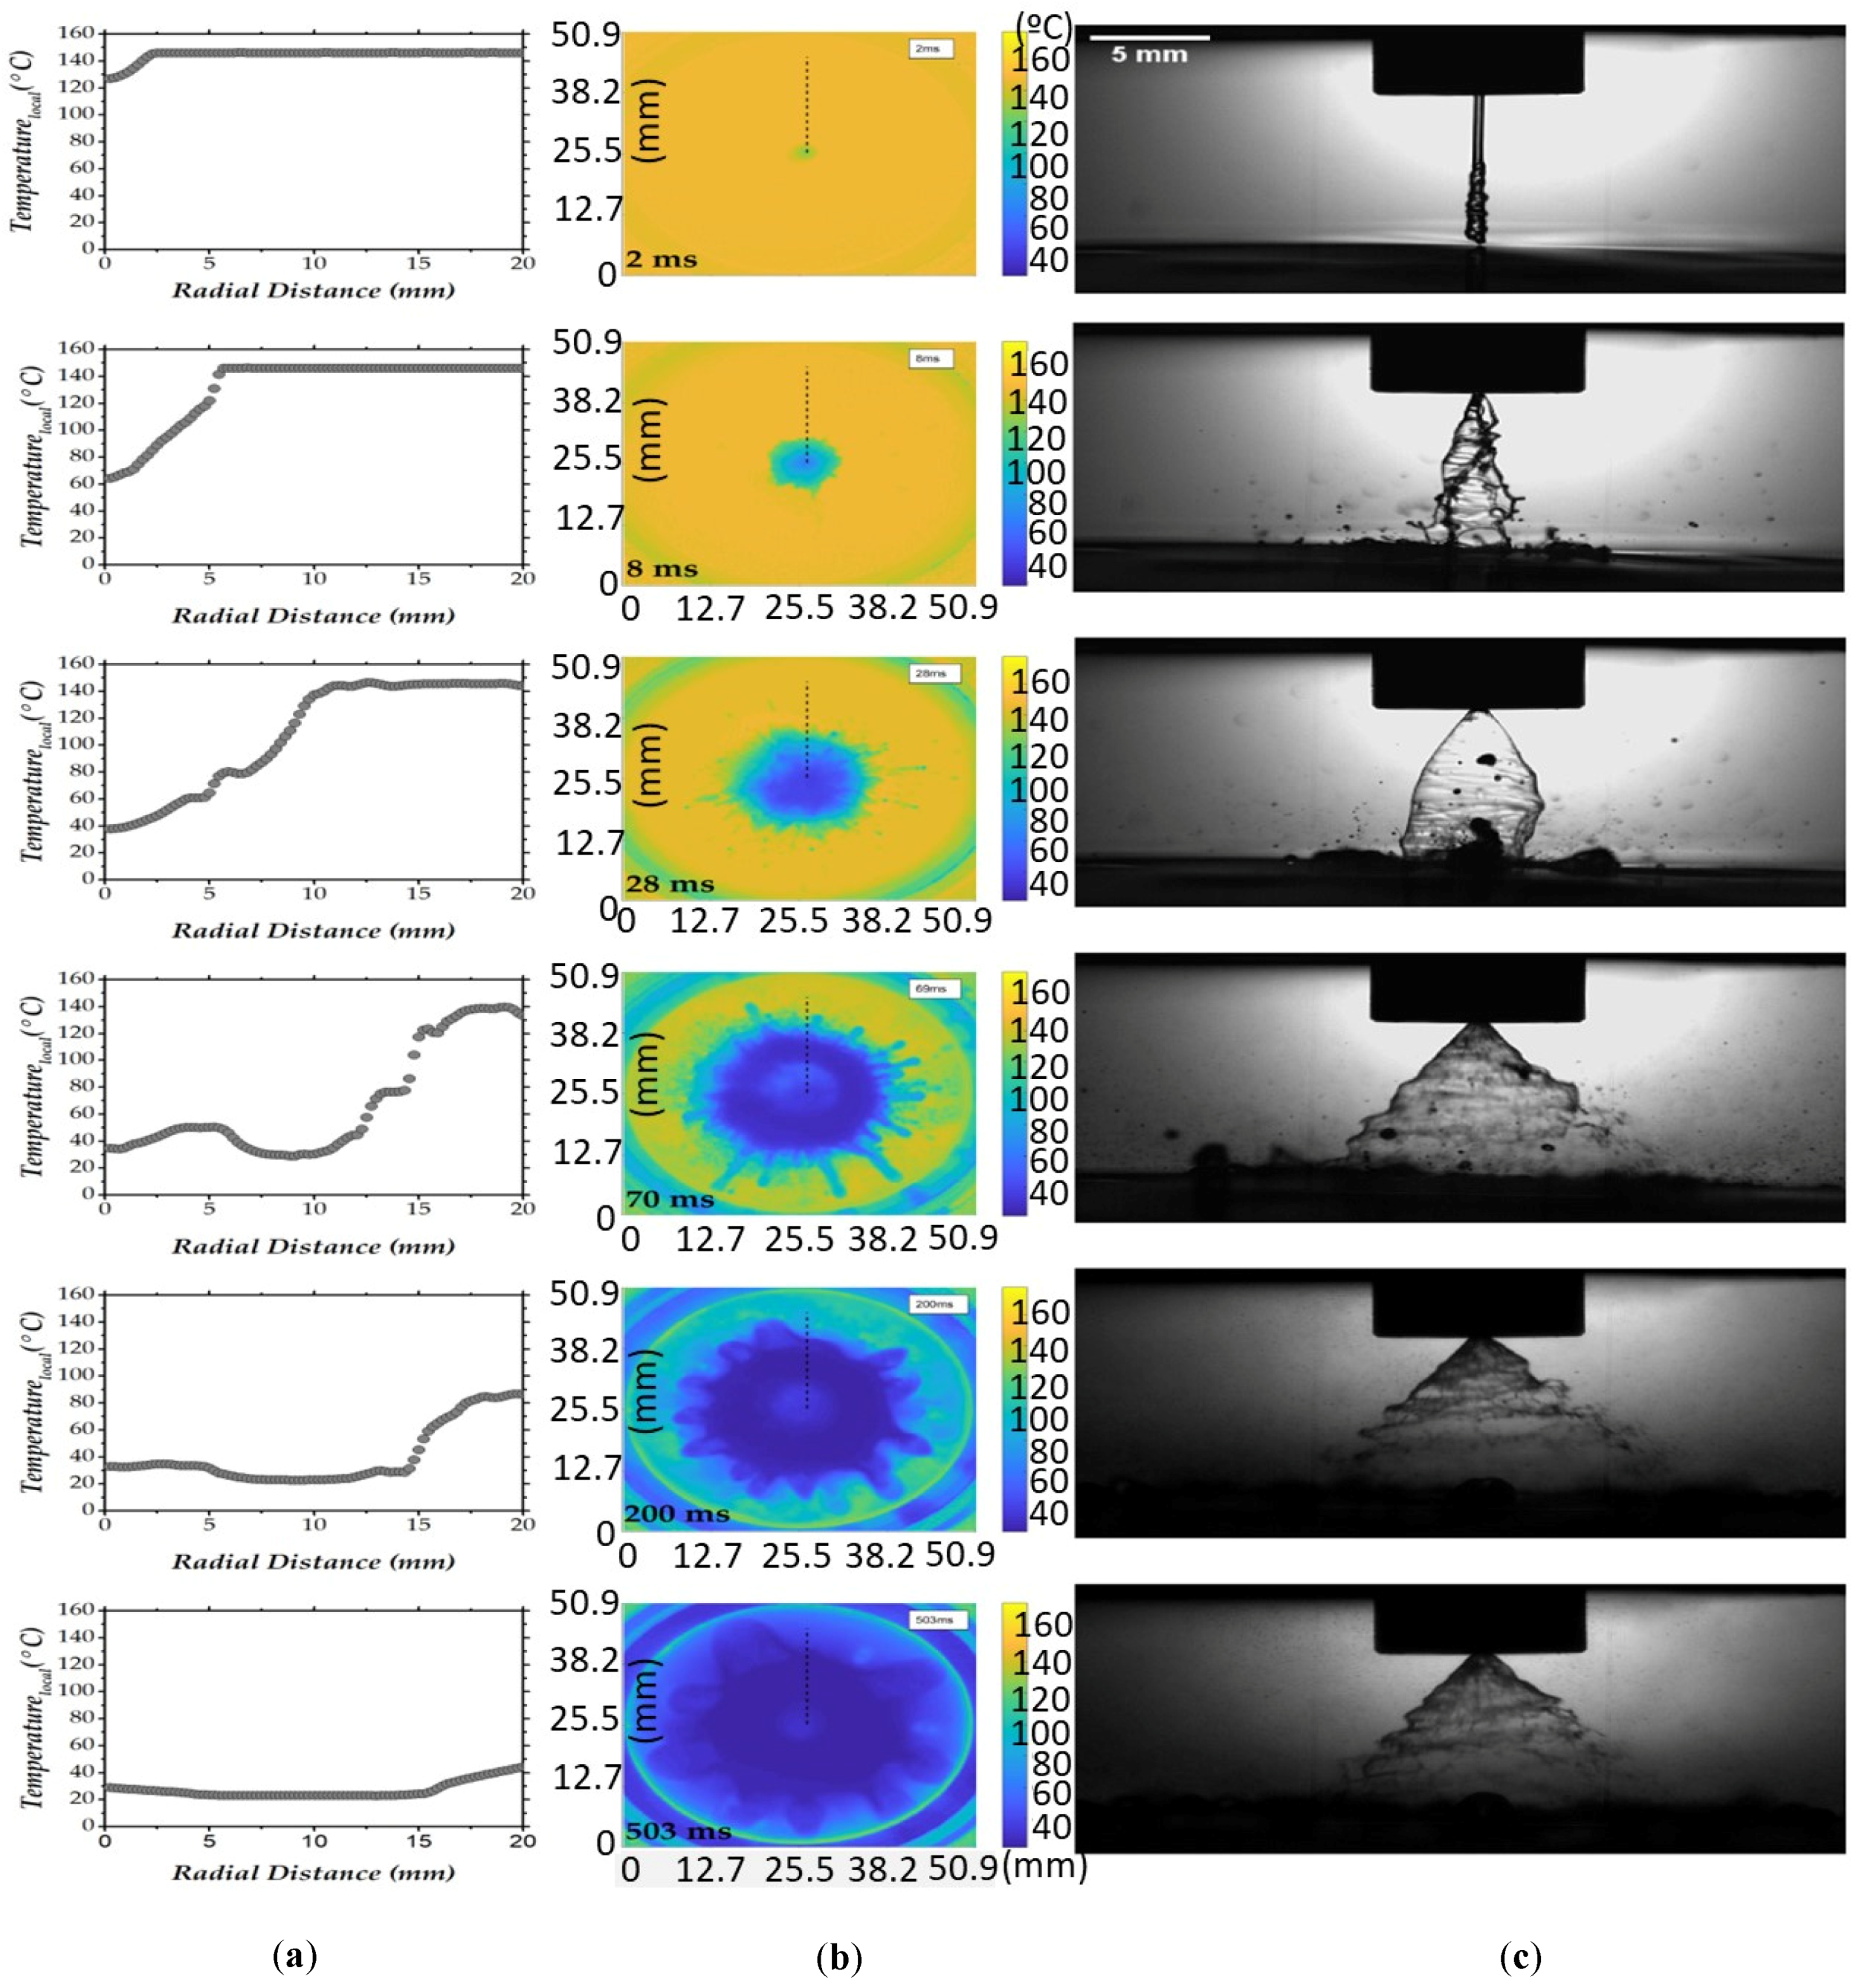
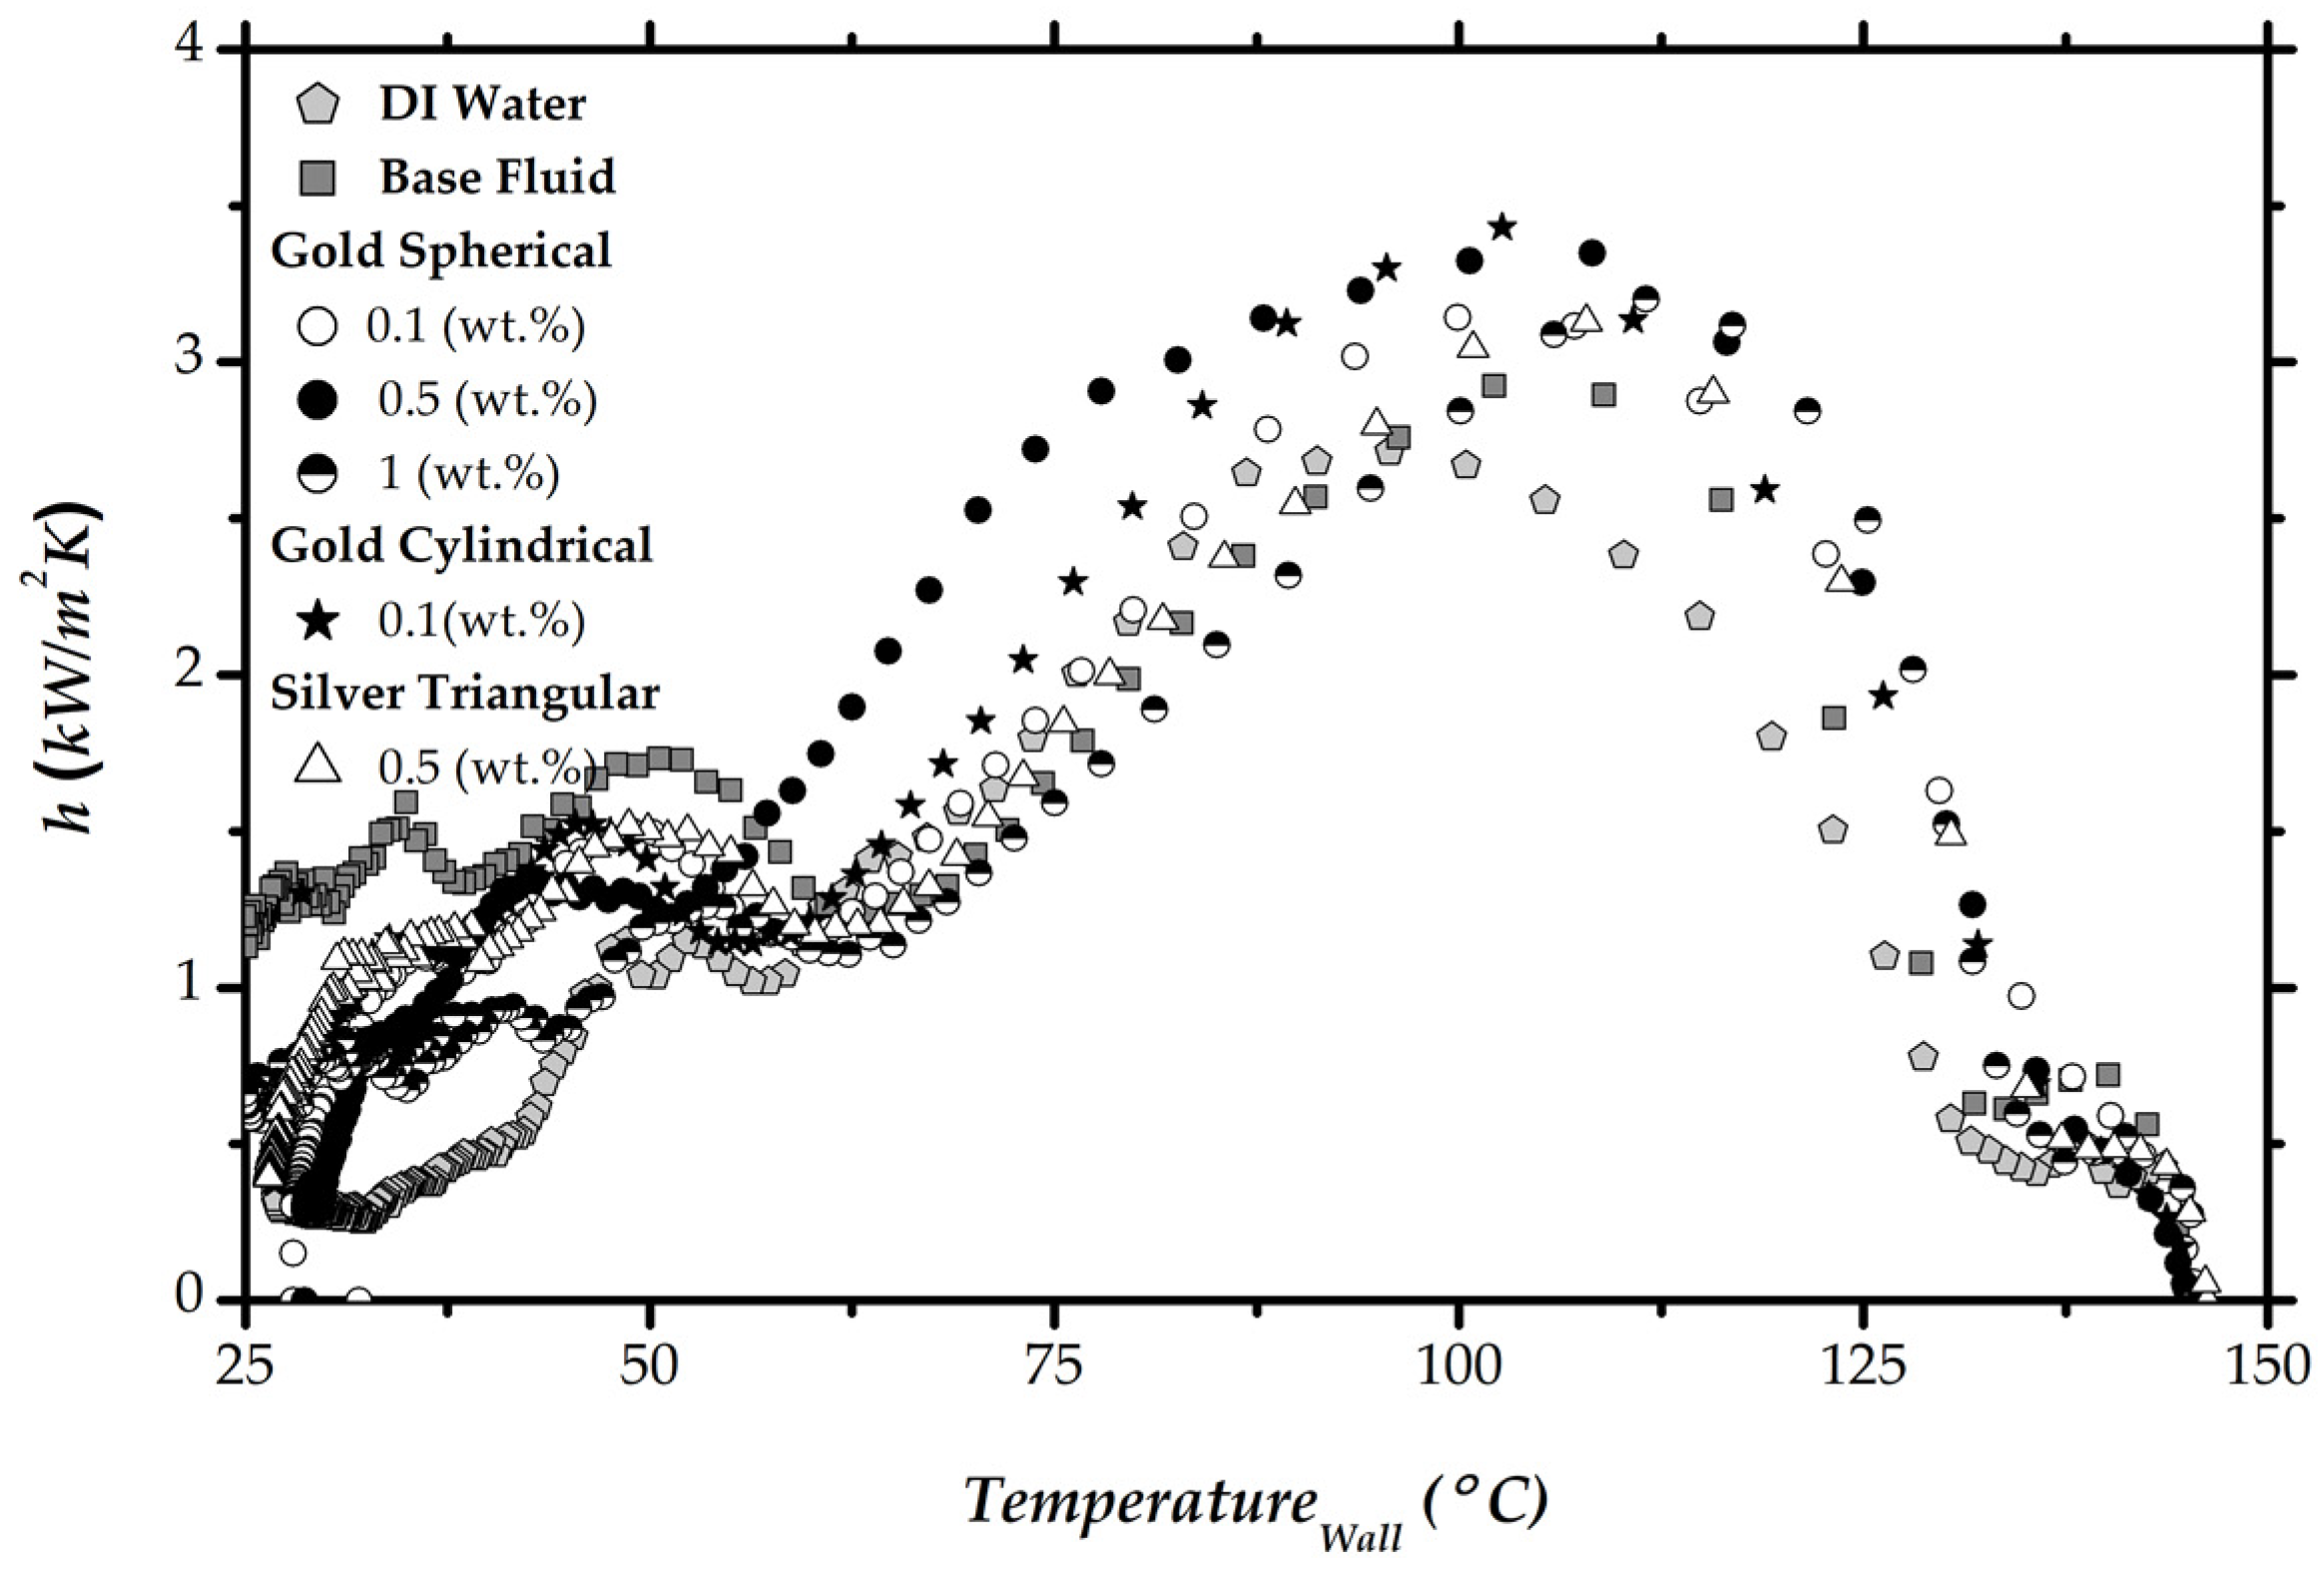
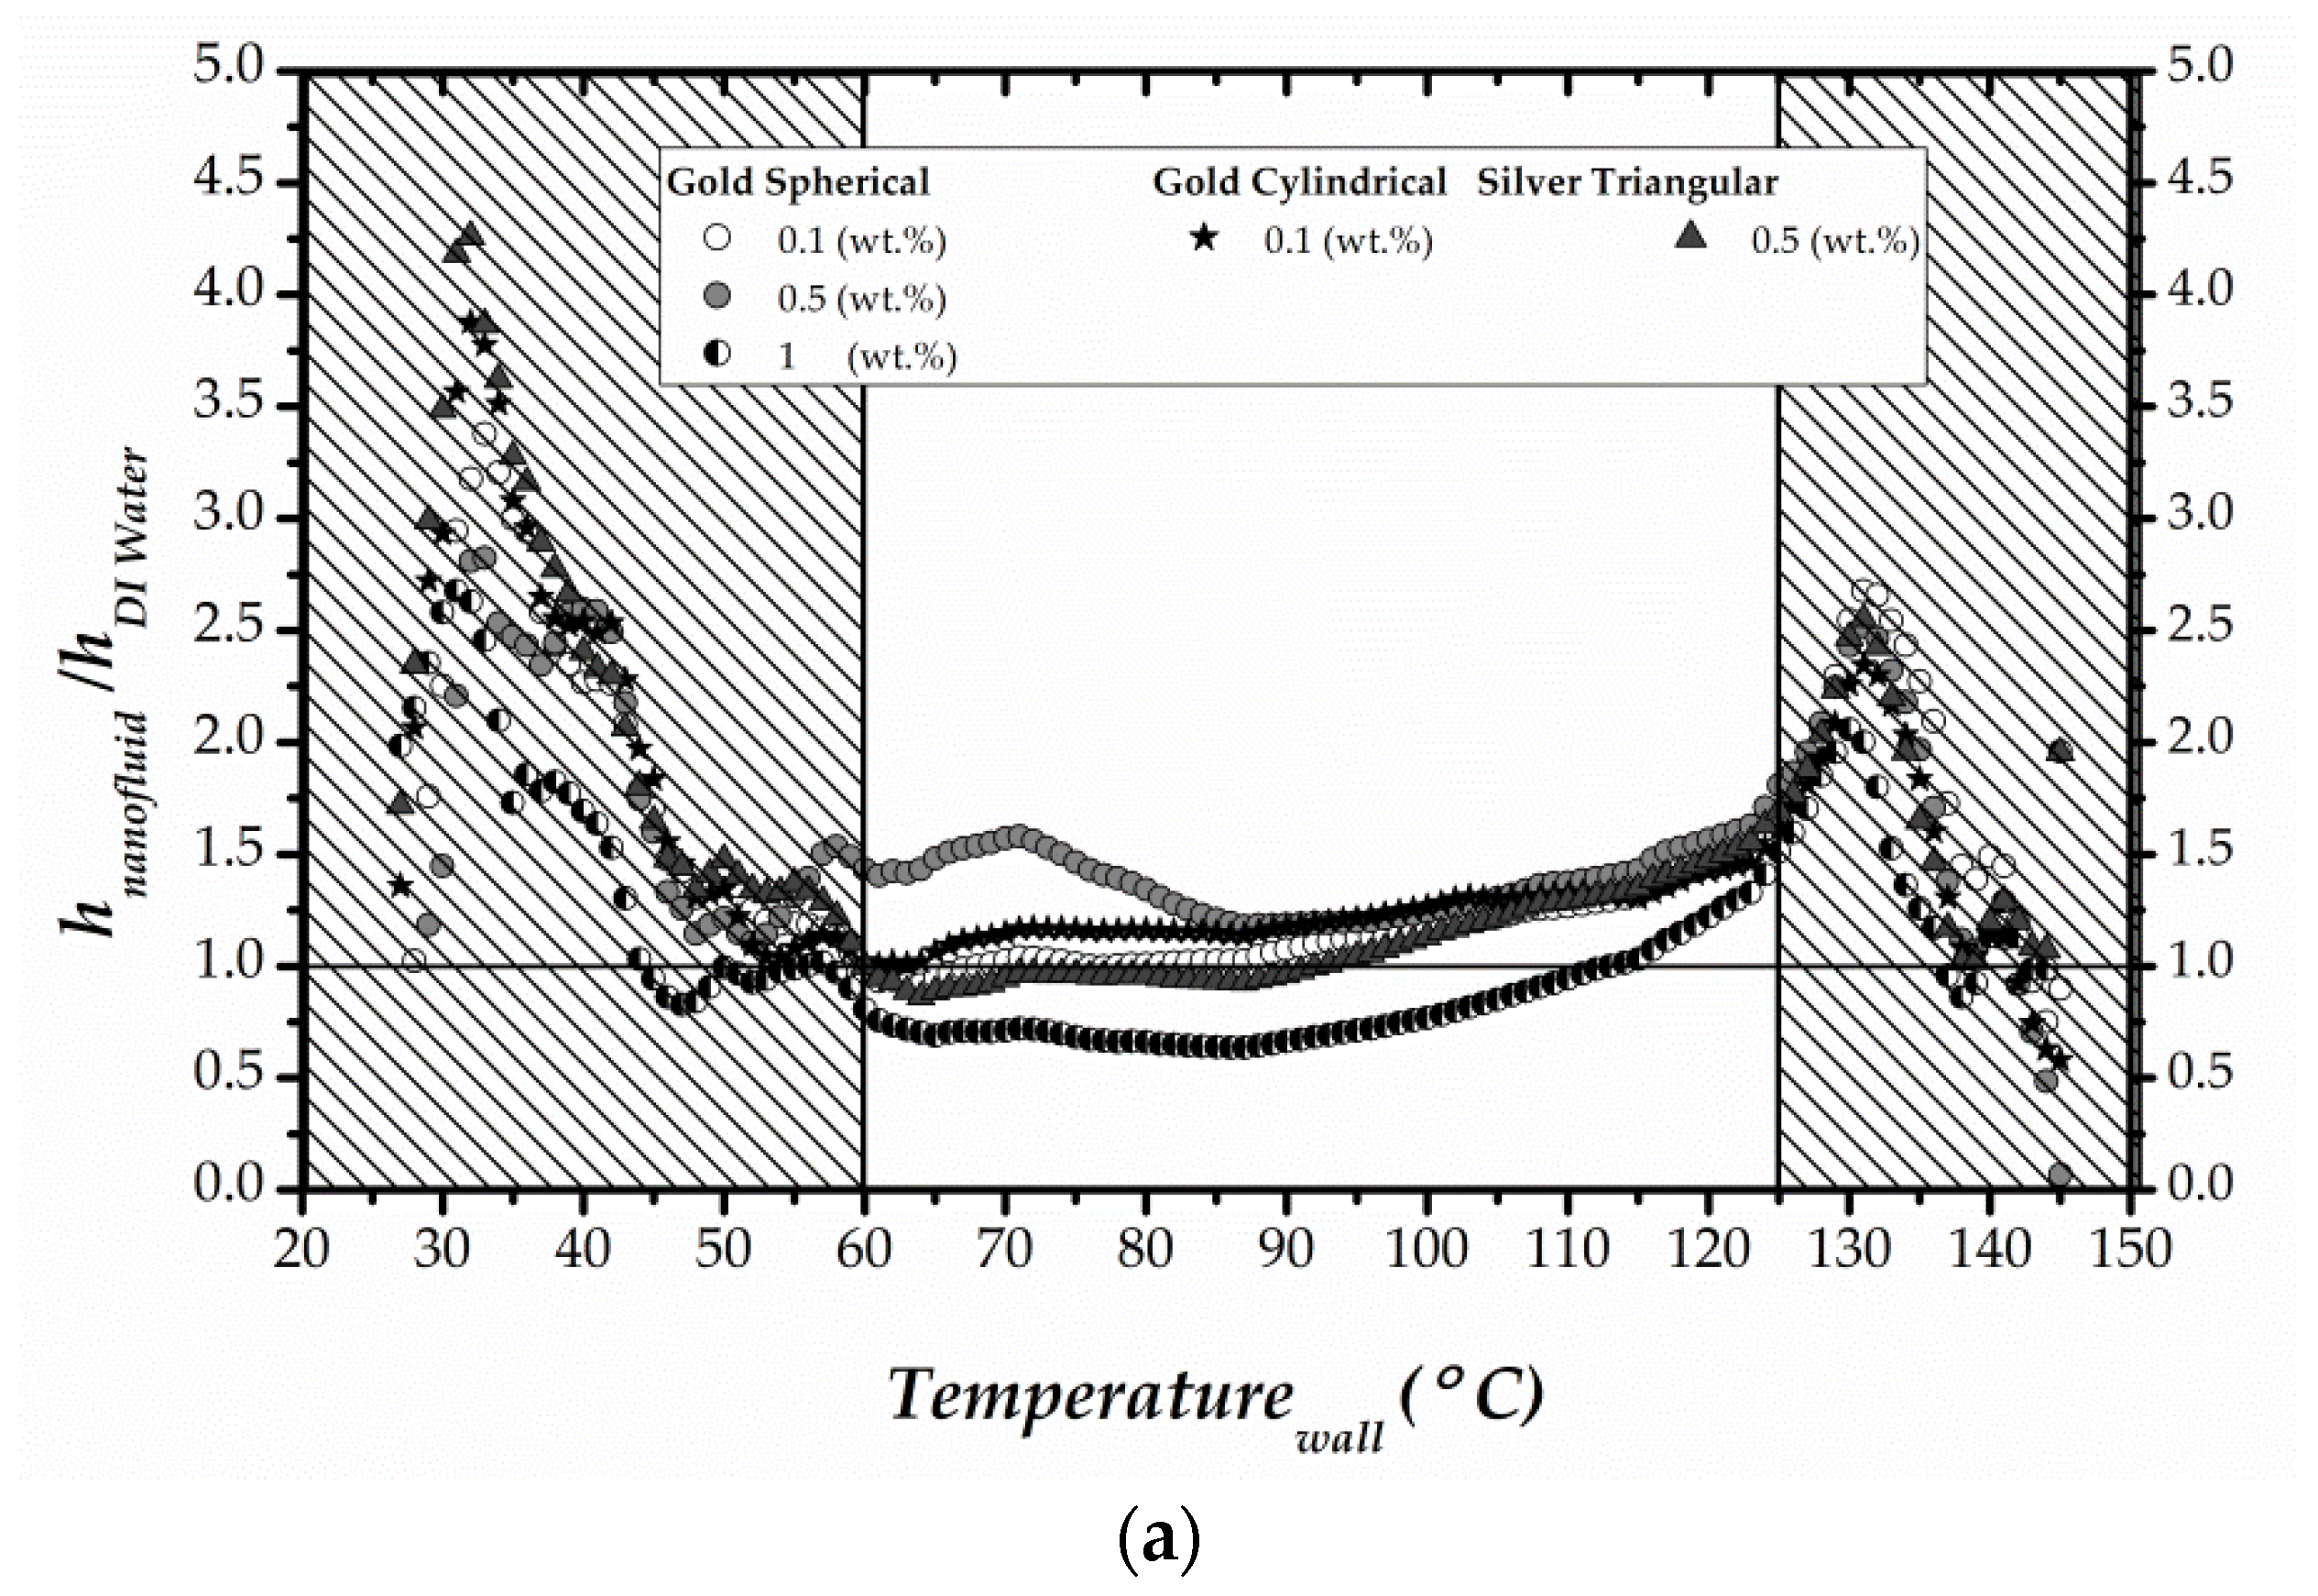
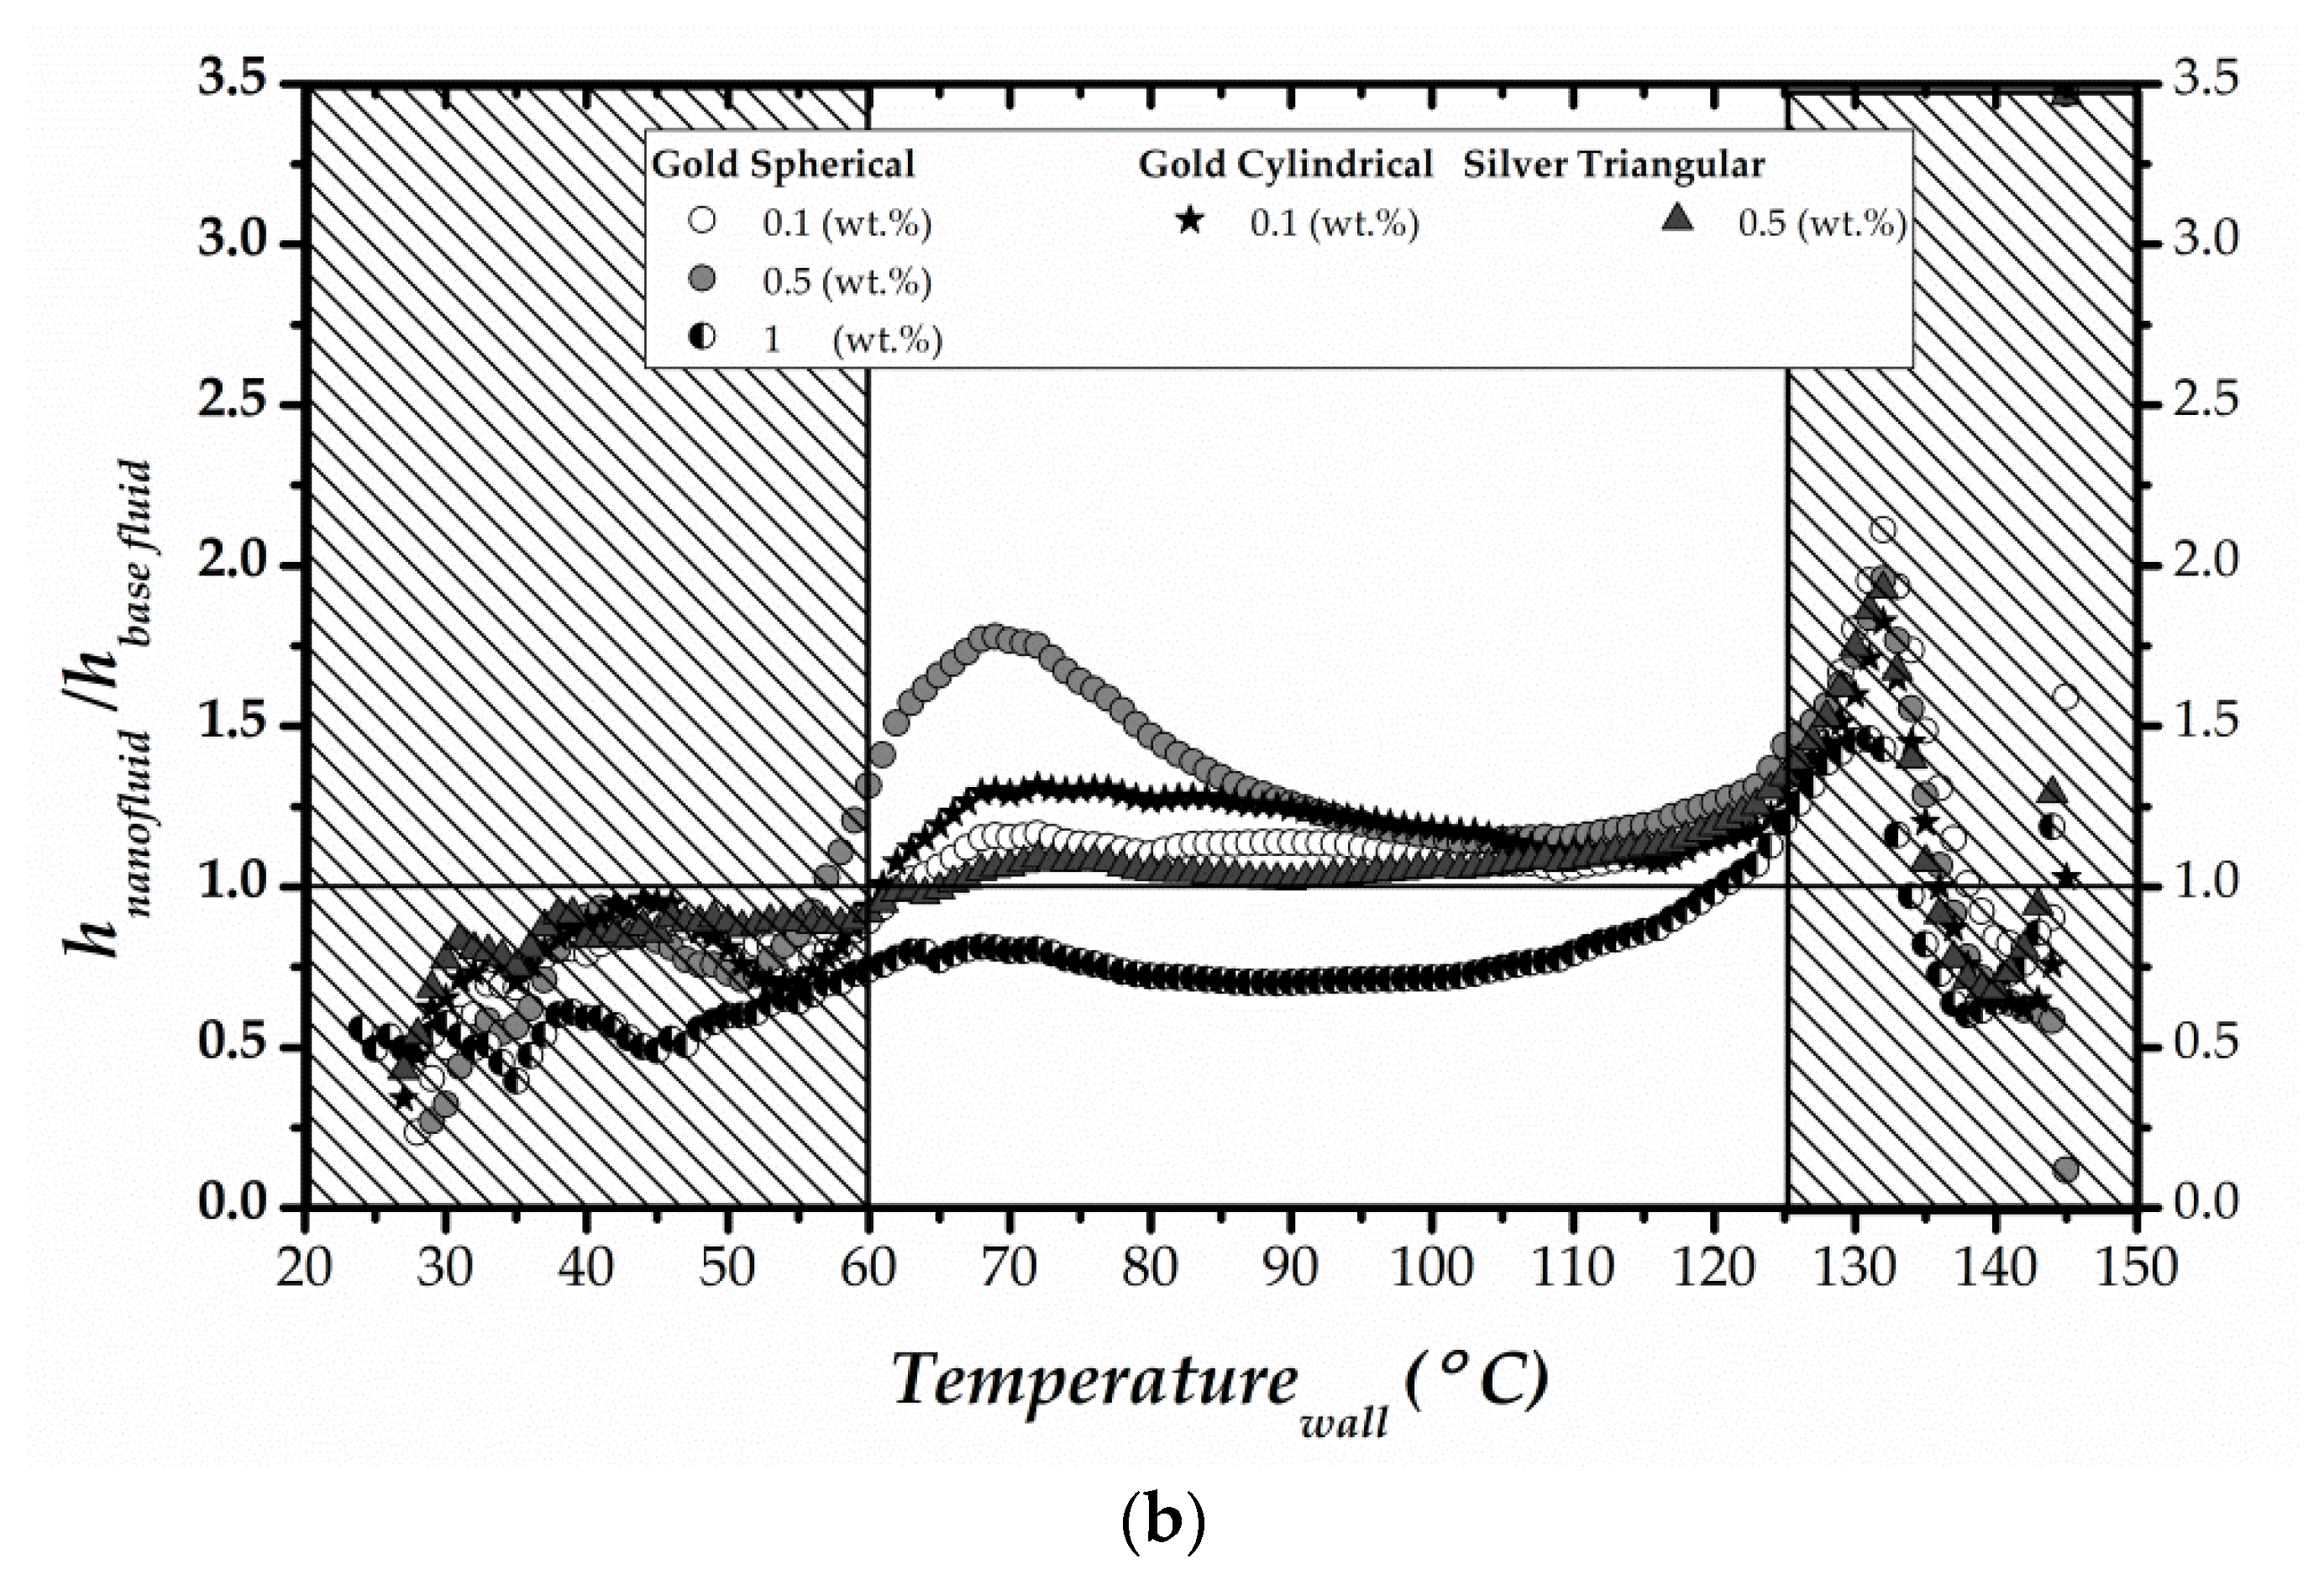
3.2. Effect of the Nanoparticles Spray Impingement Heat Transfer

The heat transfer processes occurring during spray impact on the heated surface become more evident by looking at the spray morphology and its “thermal footprint” on the surface, as illustrated in Figure 8. This figure depicts the synchronized side and bottom views of the spray and the backside of the heated smooth surface (for a total area-averaged imposed heat flux of q i m p =   2375 W/m2). The initial surface temperature (T0 = 145 °C.), taken with the high-speed video and high-speed thermal camera, respectively. The results presented correspond to the spray impact distance of Z = 10 mm. The experiments with an impact distance of 20 mm produced similar results, with an increase of the wetted area. The figure also depicts the temperature variation within the radial distance of the spray for the profile identified in the IR images by the dashed black line.
The frame before liquid contact sets instant t0, for which the initial temperature is at a constant temperature. The spray impacts the heated surface at 2 ms after the start-of-injection. The liquid sheet exiting the nozzle shows a structure similar to a liquid jet, far from a spray fully developed. Lefebvre and McDonell [38] call this stage the “thin distorted pencil.” At t = 8 ms, although roughly visible, the spray starts to form a hollow liquid sheet, and some disruptive ligaments begin to form. Hence, starting the generation of the first droplets, due to liquid sheet breakup and impact on the surface. At 28 ms, Figure 8 shows the formation of an almost closed hollow and smooth liquid sheet, contracted by surface tension forces.
One can qualitatively say that the droplets, resulting from splash or primary atomization, become smaller. As the droplet velocities increase, at 34 ms, the surface tension forces do not hold the closed bubble, as it starts to straighten the cone, becoming almost developed. Additionally, at this point, a significant part of the analyzed surface area is wetted by the impacting liquid, forming a liquid film due to deposition.
Figure 9 evidences the trend of the overall heat flux removed from the entire wetted area. The heat flux is maximum when the active cooling area or liquid film frontline is larger. At later time instants (t > 70 ms), as the temperature and heat flux values start to stabilize, the formation of secondary droplets at the edges of the spray intensifies. This phenomenon results from the splashing of droplets onto the liquid film. In theory, the spray cooling efficiency should decrease since the number of droplets leaving the surface without promoting heat transfer increases. However, the measurements performed here cannot evaluate this mechanism with the required accuracy to confirm this trend.
The images depicted in Figure 8 correspond to DI water, and the morphology of the spray does not significantly alter when adding the nanoparticles. The lowest surface tension resulting from the addition of the surfactant leads to a broader wetting area and a slightly larger number of splash droplets. Hence, comparing water with the base fluid (water and CTAB) and the nanofluids, there is a significant difference in the heat flux removed by the nanofluids, as shown in Figure 10 for the overall heat transfer convection coefficient as a function of the wall temperature.
The dominant role seems to be played by the addition of the surfactant, which affects the cooling performance of the spray in two different and complementary factors:
  • spray dynamics—the lower surface tension caused by the addition of the surfactant facilitates the liquid sheet breakup, promoting droplet formation and maximization of the heat;
  • liquid thermal dynamics—the surfactant increases the surface wettability, promoting the liquid–surface contact, and the nanoparticle addition improves the liquid’s thermal conduction (in theory), which slightly enhanced the maximum heat flux.
When analyzing the effect of nanoparticles size, geometry, or concentration, their influence is relatively less significant than that caused by the surfactant. Nevertheless, the results depicted in Figure 10 suggest a slight enhancement of heat transfer obtained with the nanofluids resulting from the addition of the gold nanospheres. The reason is likely the higher viscosity resulting from the nanoparticles that tend to increase droplets’ size (although this effect is marginal and not evident in the spray characteristics before impact). It also lessens droplet/film liquid instabilities leading to disintegration, which contributes to concentrating the liquid mass on the wetted area. Consequently, the heat convection coefficients obtained for the nanofluid sprays are higher than those of water and the base fluid, as depicted in Figure 11.
It is worth mentioning that the results plotted in Figure 11 should be interpreted with care since the initial heat convection coefficient ratios at higher temperatures are sensible to spray randomness and interpolation error. Therefore, the initial and final values, depicting the largest errors, were not considered for this analysis. With this in mind, the nanofluids showed an overall higher heat convection coefficient than water solely mixed with the base fluid. Hence, the maximum heat convection coefficients obtained for the nanofluids can be 9.8%–21.9% higher than those obtained with the base fluid and 11.5%–38.8% higher than those obtained with DI water.

4. Conclusions

The present paper addresses a detailed characterization of spray impingement on a smooth, heated surface and combines three diagnostic techniques: phase Doppler interferometry; and synchronized high-speed visualization; with time-resolved infrared thermography. Particular emphasis is given to nanofluid sprays and their potential to enhance the heat transfer mechanisms. Results show that for low nanoparticle concentrations (up to 1 wt.%), their addition does not significantly alter the spray’s hydrodynamic behavior. However, adding a surfactant to assure obtaining stable solutions decreases the surface tension of the solutions, promoting an increased trend for the droplets to splash. Despite this trend, most droplets tend to deposit on the surface, thus increasing the wetted area for cooling purposes.
Combined analysis of the spray dynamics and heat flux removed from the surfaces confirms the surfactant’s dominant role to increase the wetted area, thus promoting the heat transfer. However, the lower surface tension of the resulting fluid also promotes splash near the edges of the wetted area. In this context, gold nanospheres, increasing liquid viscosity, may reduce such disturbances contributing to a slightly improved heat transfer. The higher heat convection coefficients obtained with the nanofluids confirm this trend compared to those obtained with water and the base fluid composed of water and surfactant.
Furthermore, the following summarized points are other key outcomes of the present research:
  • Different experimental tests considering different nanoparticle concentrations allowed analyzing the spray evolution after and during the impact of droplets on a heated solid surface. The fluids considered are water as the conventional fluid, the baseline liquid (water + surfactant (CTAB)), and two concentrations of Gold (Au) nanoparticles with different orders of magnitude (0.1 wt.% and 1 wt.%).
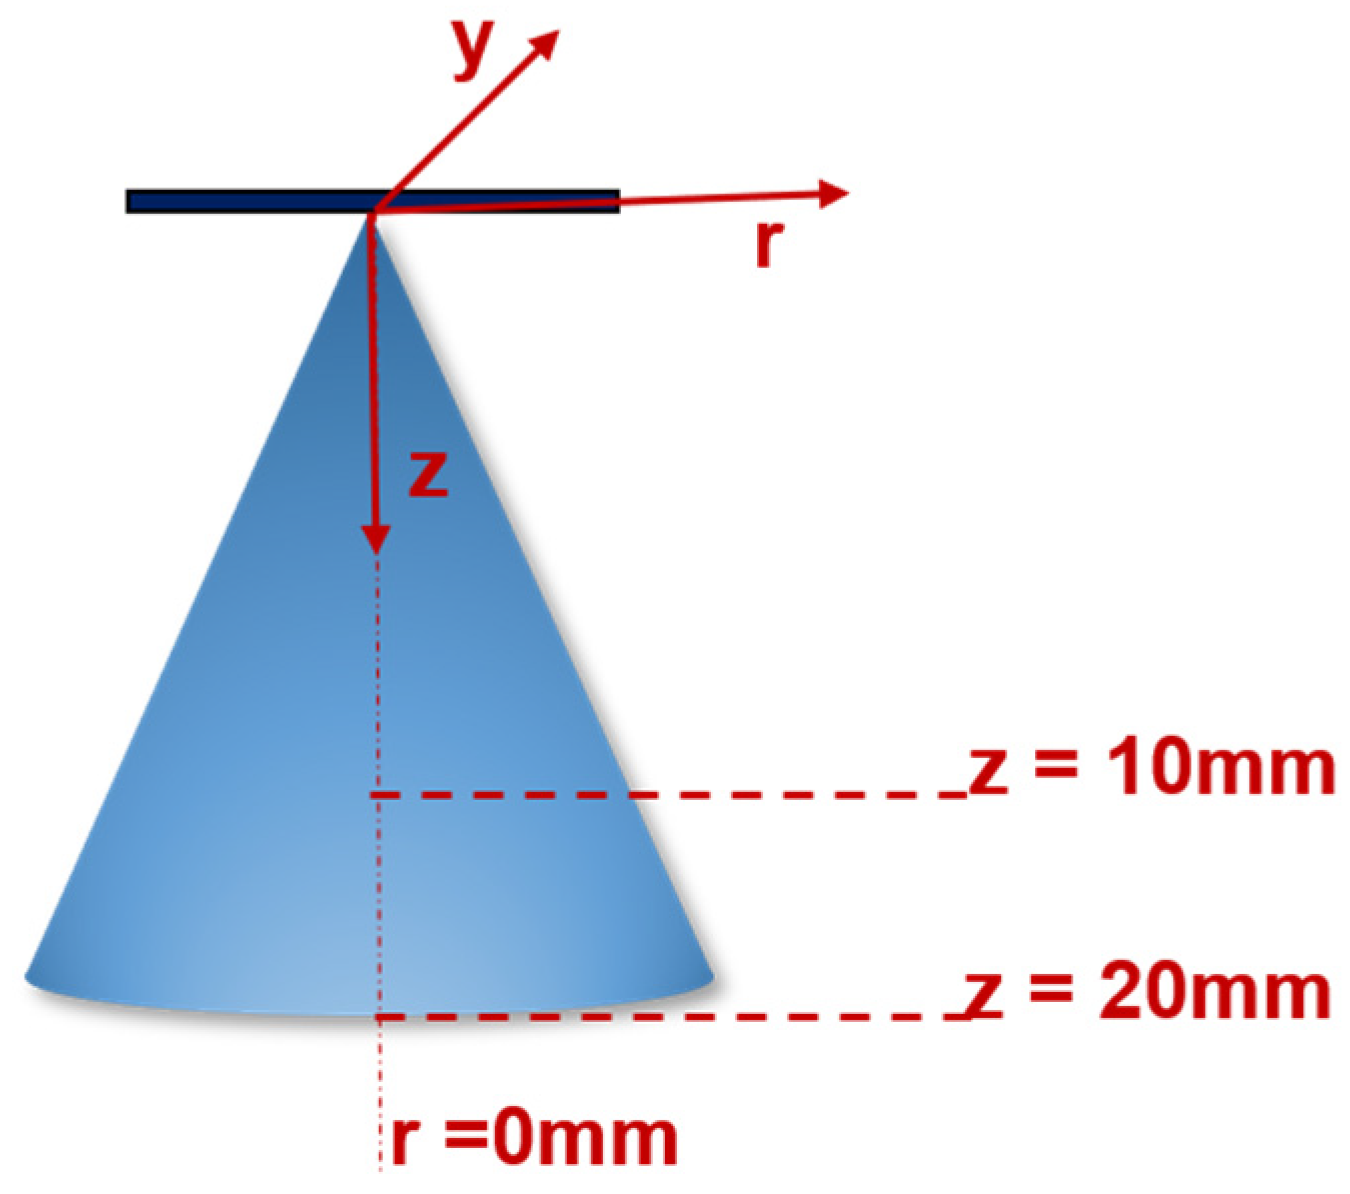
  • The results reported before impact include the average drop velocity, volume-weighted mean diameter, and drop size diversity at several locations relative to the central axis (r = 0 mm) aligned with the atomizer exit. The collected high-spatial and temporal images obtained important information on the nanofluids morphology and the spray atomization.
  • During the spray impingement, the thermographic analysis developed using a high-speed thermal camera allowed a better understanding of the effect of nanoparticles on the fluid spray dynamics and heat transfer processes.
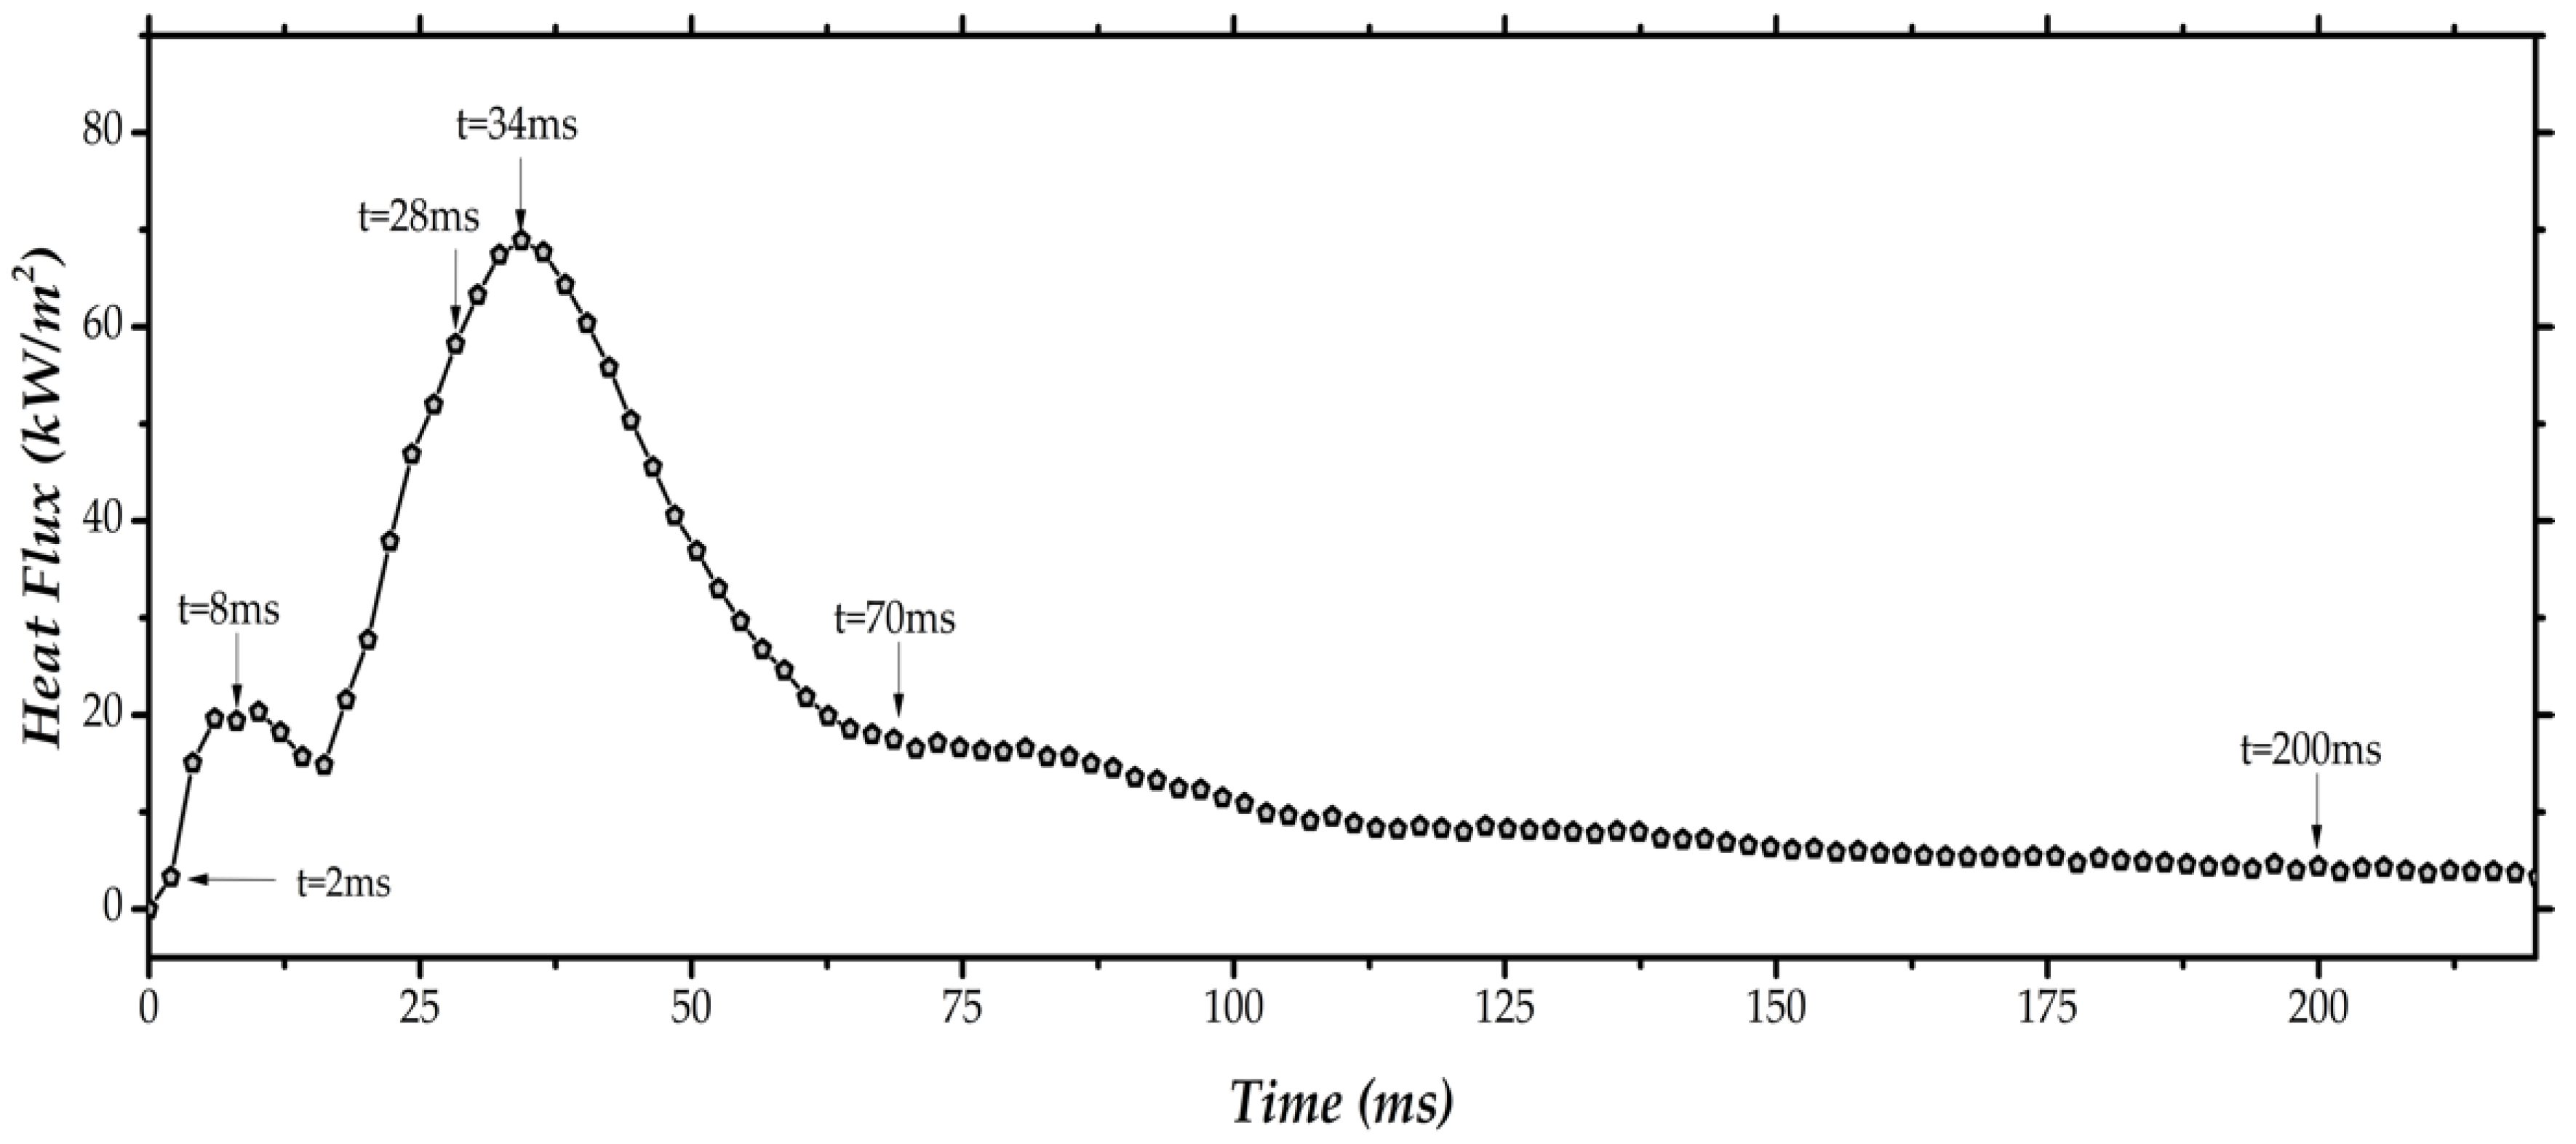
  • The wall temperature and the heat flux trends along the radial distance at different events are evaluated for all the considered fluids.
  • The results of this study can provide useful information on the thermofluid effects of nanofluids in spray cooling applications.
  • For the range of concentrations addressed here, there is no significant advantage in using the nanoparticles. However, one observes encouraging improvements in the heat transfer coefficients without substantial changes in the atomization characteristics. This result justifies further investigation towards the use of larger concentrations while ensuring nanofluid stability.

Author Contributions

Conceptualization, A.S.M., G.M., methodology, M.R.O.P., G.M., A.S.M., A.P.C.R.; software, M.F.; validation, A.S.M., G.M.; formal analysis, M.P., A.P.C.R.; investigation, G.M.; resources, A.S.M., G.M., A.L.N.M.; data curation, G.M., M.R.O.P., A.S.M.; writing—original draft preparation, G.M., A.S.M.; writing—review and editing, G.M., A.S.M., visualization, G.M., C.M.M.; supervision, A.L.N.M.; project administration, A.S.M., G.M.; funding acquisition, G.M., A.S.M. All authors have read and agreed to the published version of the manuscript.

Funding

This research received no external funding.

Acknowledgments

Authors are grateful to Fundação para a Ciência e Tecnologia (FCT) for partially financing the research under the framework of the project n° 030171 financed by LISBOA-01-0145-FEDER-030171/PTDC/EME-SIS/30171/2017, of the project JICAM/0003/2017 and of the project UTAP-EXPL/CTE/0064/2017, financiado no âmbito do Projeto 5665—Parcerias Internacionais de Ciência e Tecnologia, UT Austin Programme.

Conflicts of Interest

The authors declare no conflict of interest.

References

  1. Chen, S.J.; Tseng, A.A. Spray and jet cooling in steel rolling. Int. J. Heat Fluid Flow 1992, 13, 358–369. [Google Scholar] [CrossRef]
  2. Nitin, K.; Sunil, R.K.; Subbarao, P.M.V. Experimental study of non-boiling heat transfer from a horizontal surface by water sprays. Exp. Therm. Fluid Sci. 2007, 32, 571–579. [Google Scholar]
  3. Visaria, M.; Mudawar, I. Theoretical and experimental study of the effects of spray inclination on two phase spray cooling and critical heat flux. Int. J. Heat Mass Transf. 2008, 51, 2398–2410. [Google Scholar] [CrossRef]
  4. Bostanci, H.; Daniel, R.; John, K.; Louis, C. Spray cooling with ammonia on microstructured surfaces: Performance enhancement and hysteresis effect. J. Heat Transf. 2009, 131, 071401. [Google Scholar] [CrossRef]
  5. Breitenbach, J.; Roisman, I.V.; Tropea, C. From drop impact physics to spray cooling models: A critical review. Exp. Fluids 2018, 59, 55. [Google Scholar] [CrossRef]
  6. Lemoine, F.; Castanet, G. Temperature and chemical composition of droplets by optical measurement techniques: A state-of-the-art review. Exp. Fluids 2013, 54, 1572. [Google Scholar] [CrossRef] [Green Version]
  7. Bellerová, H.; Tseng, A.A.; Pohanka, M.; Raudensky, M. Spray cooling by solid jet nozzles using alumina/water nanofluids. Int. J. Therm. Sci. 2012, 62, 127–137. [Google Scholar] [CrossRef]
  8. Chun, S.Y.; Bang, I.C.; Choo, Y.J.; Song, C.H. Heat transfer characteristics of si and sic nanofluids during a rapid quenching and nanoparticles deposition effects. Int. J. Heat Mass Transf. 2011, 54, 1217–1223. [Google Scholar] [CrossRef]
  9. Bansal, A.; Pyrtle, F. Alumina nanofluid for spray cooling enhancement. In Proceedings of the 2007 ASME/JSME Thermal Engineering Summer Heat Transfer Conference, Vancouver, BC, Canada, 8–12 July 2007; Volume 1, pp. 797–803. [Google Scholar]
  10. Chen, M.; Li, J. Nanofluid-based pulsating heat pipe for thermal management of lithium-ion T batteries for electric vehicles. J. Energy Storage 2020, 32, 101715. [Google Scholar] [CrossRef]
  11. Bahiraei, M.; Heshmatian, S.; Goodarzi, M.; Moayedi, H. CFD analysis of employing a novel ecofriendly nanofluid in a miniature pin fin heat sink for cooling of electronic components: Effect of different configurations. Adv. Powder Technol. 2019, 30, 2503–2516. [Google Scholar] [CrossRef]
  12. Jiang, Y.; Bahrami, M.; Bagherzadeh, S.A.; Abdollahi, A.; Sulgani, M.T.; Karimipour, A.; Goodarzi, M.; Bach, Q.-V. Propose a new approach of fuzzy lookup table method to predict Al2O3/deionized water nanofluid thermal conductivity based on achieved empirical data. Physica A 2019, 527, 121177. [Google Scholar] [CrossRef]
  13. Bahmani, M.H.; Sheikhzadeh, G.; Zarringhalam, M.; Akbari, O.A.; Alrashed, A.A.A.A.; Shabani, G.A.S.; Goodarzi, M. Investigation of turbulent heat transfer and nanofluid flow in a double pipe heat exchanger. Adv. Powder Technol. 2018, 29, 273–282. [Google Scholar] [CrossRef]
  14. Goodarzi, M.; Amiri, A.; Goodarzi, M.S.; Reza Safaei, M.; Karimipour, A.; Languri, E.M.; Dahari, M. Investigation of heat transfer and pressure drop of a counter flow corrugated plate heat exchanger using MWCNT based nanofluids. Int. Commun. Heat Mass Transf. 2015, 66, 172–179. [Google Scholar] [CrossRef]
  15. Reza Safaei, M.; Ranjbarzadeh, R.; Hajizadehe, A.; Bahiraei, M.; Afrand, M.; Karimipour, A. Effects of cobalt ferrite coated with silica nanocomposite on the thermal conductivity of an antifreeze: New nanofluid for refrigeration condensers. Int. J. Refrig. 2019, 102, 86–95. [Google Scholar] [CrossRef]
  16. Li, Z.X.; Khaled, U.; Al-Rashede, A.A.; Goodarzi, M.; Sarafrazg, M.M.; Meer, R. Heat transfer evaluation of a micro heat exchanger cooling with spherical carbon-acetone nanofluid. Int. J. Heat Mass Transf. 2020, 149, 119124. [Google Scholar] [CrossRef]
  17. Tiara, A.M.; Chakraborty, S.; Sarkar, I.; Ashok, A.; Pal, S.K.; Chakraborty, S. Heat transfer enhancement using surfactant based alumina nanofluid jet from a hot steel plate. Exp. Therm. Fluid Sci. 2017, 89, 295–303. [Google Scholar] [CrossRef]
  18. Amini, M.; Zareh, M.; Maleki, S. Thermal performance analysis of mechanical draft cooling tower filled with rotational splash type packing by using nanofluids. Appl. Therm. Eng. 2020, in press. [Google Scholar] [CrossRef]
  19. Chakraborty, S.; Sarkar, I.; Ashok, A.; Sengupta, I.K.; Pal, S.; Chakraborty, S. Thermo-physical properties of Cu-Zn-Al LDH nanofluid and its application in spray cooling. Appl. Therm. Eng. 2018, 141, 339–351. [Google Scholar] [CrossRef]
  20. Rea, U.; McKrell, T.; Hu, L.W.; Buongiorno, J. Laminar convective heat transfer and viscous pressure loss of alumina-water and zirconia-water nanofluids. Int. J. Heat Mass Transf. 2009, 52, 2042–2048. [Google Scholar] [CrossRef]
  21. Duursma, G.; Sefiane, K.; Kennedy, A. Experimental studies of nanofluid droplets in spray cooling. Heat Transf. Eng. 2009, 30, 1108–1120. [Google Scholar] [CrossRef]
  22. Hsieh, S.S.; Liu, H.H.; Yeh, Y.F. Nanofluids spray heat transfer enhancement. Int. J. Heat Mass Transf. 2016, 94, 104–118. [Google Scholar] [CrossRef]
  23. Abu-Nada, E.; Oztop, H.F. Numerical analysis of Al2O3/water nanofluids natural convection in a wavy walled cavity. Numer. Heat Transf. Part A App. Int. J. Comput. Methodol. 2011, 59, 403–419. [Google Scholar] [CrossRef]
  24. Jackson, R.G.; Kahani, M.; Karwa, N.; Wu, A.; Lamb, R.; Taylor, R.; Rosengarten, G. Effect of surface wettability on carbon nanotube water-based nanofluid droplet impingement heat transfer. J. Phys. Conf. Ser. 2014, 525, 012024. [Google Scholar] [CrossRef] [Green Version]
  25. Lee, W.; Kihm, K.D.; Park, J.S.; Lee, W.; Kim, H.; Lee, C.; Cheon, S.; Lim, G. Wetting of nanofluids with nanoparticles of opposite surface potentials on pristine CVD graphene. Exp. Fluids 2016, 57, 118. [Google Scholar] [CrossRef]
  26. Kay, P.J.; Bowen, P.J.; Gold, M.R.; Sapsford, S.M. Transient fuel spray impingement at atmospheric and elevated ambient conditions. Exp. Fluids 2012, 53, 873–890. [Google Scholar] [CrossRef]
  27. Malý, M.; Moita, A.S.; Jedelsky, J.; Ribeiro, A.P.C.; Moreira, A.L.N. Effect of nanoparticles concentration on the characteristics of nanofluid sprays for cooling applications. J. Therm. Anal. Calorim. 2019, 135, 3375–3386. [Google Scholar] [CrossRef] [Green Version]
  28. Fantoni, A.; Fernandes, M.; Vygranenko, Y.; Louro, P.; Vieira, M.; Silva, R.; Teixeira, D.; Ribeiro, A.; Prazeres, M.; Alegria, E. Analysis of metallic nanoparticles embedded in thin film semiconductors for optoelectronic applications. Opt. Quantum Electron. 2018, 50, 246. [Google Scholar] [CrossRef]
  29. Moita, A.S.; Laurência, C.; Ramos, J.A.; Prazeres, D.M.F.; Moreira, A.L.N. Dynamics of droplets of biological fluids on smooth superhydrophobic surfaces under electrostatic actuation. J. Bionic Eng. 2016, 13, 220–234. [Google Scholar] [CrossRef]
  30. Pereira, P.; Moita, A.S.; Monteiro, G.; Prazeres, D.M.F. Characterization of English weed leaves and biomimetic replicas. J. Bionic Eng. 2014, 11, 346–359. [Google Scholar] [CrossRef]
  31. Panão, M.R.O.; Moreira, A.L.N. A real-time assessment of measurement uncertainty in the experimental characterization of sprays. Meas. Sci. Technol. 2008, 19, 095402. [Google Scholar] [CrossRef]
  32. Panão, M.R.O. Redefining spray uniformity through an information theory approach. At. Sprays 2016, 26, 1069–1081. [Google Scholar] [CrossRef]
  33. Teodori, E.; Pontes, P.; Moita, A.S.; Moreira, A.L.N. Thermographic analysis of interfacial heat transfer mechanisms on droplet/wall interactions with high temporal and spatial resolution. Exp. Therm. Fluids Sci. 2018, 96, 284–294. [Google Scholar] [CrossRef]
  34. Pontes, P.; Cautela, R.; Teodori, E.; Moita, A.S.; Liu, Y.; Moreira, A.L.N.; Nikulin, A.; Del Barrio, E. Effect of pattern geometry on bubble dynamics and heat transfer on biphilic surfaces. Exp. Therm. Fluid Sci. 2020, 115, 110088. [Google Scholar] [CrossRef]
  35. Lee, J.-H.; Hwang, K.S.; Jang, S.P.; Lee, B.H.; Kim, J.H.; Choi, S.U.; Choi, C.J. Effective viscosities and thermal conductivities of aqueous nanouids containing low volume concentrations of Al2O3 nanoparticles. Int. J. Heat Mass Transf. 2008, 51, 26512656. [Google Scholar] [CrossRef]
  36. Gupta, M.; Singh, V.; Kumar, R.; Said, Z. A review on thermophysical properties of nanofluids and heat transfer applications. Renew. Sustain. Energy Rev. 2017, 74, 638–670. [Google Scholar] [CrossRef]
  37. Sijs, R.; Kooij, S.; Bonn, D. How surfactants influence the drop size in sprays. arXiv 2019, arXiv:1907.09723v1. [Google Scholar]
  38. Lefebvre, A.H.; McDonell, V.G. Atomization and Sprays, 2nd ed.; Taylor & Francis: London, UK, 2017. [Google Scholar]
Figure 1. Schematic of the experimental apparatus. (1) Atomizer, (2) air pressure regulator, (3) manometer, (4) temperature sensor, (5) impact surface, (6) power supply, (7) electric cables, (8) solenoid valve, (9) manual valve, (10) light source.
Energies 13 05864 g001
Figure 2. Variation of surface tension as a function of the surfactant concentration.
Energies 13 05864 g002
Figure 3. Scheme of a classical PDI setting, where θ, ψ, and ϕ are the beam intersection angle, elevation angle, and scattering angle.
Energies 13 05864 g003
Figure 4. System of coordinates used in the measurements with the phase Doppler interferometer.
Energies 13 05864 g004
Figure 5. Mean velocity, u d (m/s), and mean diameter, d43 (µm), of droplets for Z = 10 mm (top) and Z = 20 mm (bottom).
Energies 13 05864 g005
Figure 6. Polydispersion degree characterized by the normalized Shannon entropy, H n , and spray heterogeneity degree characterized by the volume-weighted standard deviation, SDv (µm), for the planes of Z = 10 mm (top) and Z = 20 mm (bottom).
Energies 13 05864 g006
Figure 7. Example of increasing the polydispersion degree (left) for DI Water at Z = 10 mm; an example of a high heterogeneity degree (right) for the nanofluid with 0.1 wt.% of gold nanospheres at r = 0 mm.
Energies 13 05864 g007
Figure 8. (a) Temperature variation and the radial profile (identified in the IR images by the black dashed line) during spray impact on the heated surface. (b) IR images taken from the backside of the surface, synchronized with (c) side views (taken with the high-speed camera) of the spray showing its dynamics. ( q i m p = 2375 W/m2, z = 10 mm). This set of images is for DI water.
Energies 13 05864 g008
Figure 9. Heat flux removed by the spray averaged within the entire wetted area obtained for DI water spray at z = 10 mm.
Energies 13 05864 g009
Figure 10. Heat transfer coefficient as a function of the surface temperature for the various sprays tested in the present study.
Energies 13 05864 g010
Figure 11. Ratio between the heat convection coefficient obtained between the various nanofluid sprays and (a) DI water, (b) DI water, and CTAB.
Energies 13 05864 g011aEnergies 13 05864 g011b
Table 1. Main specifications and thermophysical properties of the nanofluids used in the present study.
ElementDI WaterBase FluidGoldSilver
Geometry--SpheresCylindersTriangles
Mean dimensions (nm)--Diameter: 80Diameter: 12Length: 30
Length: 39Width: 17
Nanoparticle (wt.%)--0.10.510.10.5
Surfactant (wt.%)-0.050.50.050.050.50.05
Dynamic viscosity, µ (cP)1.0021.0031.0221.0381.0411.1351.038
Density (kg/m3)998.21998.71999.161002.941007.68999.161002.726
Surface tension (mN/m)76.3134.2933.1137.7537.7232.6737.30
Specific heat (kJ/(kgK))4.184.184.184.164.144.184.16
Thermal conductivity (W/(mK))0.6NA0.6090.6480.69760.60940.650
Spray cone angle (°)
at 87psi
73.6473.4573.2674.4075.2873.6274.97
Table 2. Static contact angle for the different nanofluids.
ElementGeometryNanoparticles (%)Surfactant (%)Static Contact Angle CA (°) ± 6°
DI Water-0097.5
Base Fluid-00.0562.1
GoldSpherical0.10.553.4
0.50.0558.1
1.00.0558.9
Cylindrical0.10.551.5
SilverTriangular0.50.0557.8
Publisher’s Note: MDPI stays neutral with regard to jurisdictional claims in published maps and institutional affiliations.

